New technology in echocardiography II: imaging techniques - Heart
Upload
masood-ahmadCategory
view
212download
0
Real-Time Three-DimensionalEchocardiography in Assessmentof Heart DiseaseMasood Ahmad, M.D.
University of Texas Medical Branch, Galveston, Texas
Echocardiography has progressed at an impressive pace in the last decade. A plethora of newtechniques, including tissue-Doppler imaging, harmonic imaging, contrast echocardiography, digi-tal-stress echocardiography, and three-dimensional (3-D) echocardiography, have altered our diag-nostic strategies for managing patients with heart disease. Until recently, 3-D echocardiography waslooked upon as a time-consuming and tedious procedure, making it more a research interest than adiagnostic tool. The introduction of real-time three-dimensional (RT-3-D) echocardiography hasmade possible dynamic diagnostic/therapeutic assessments while the procedure is performed. At TheUniversity of Texas Medical Branch in Galveston, Texas, our more than 2 years of experience withRT-3-D suggests that this technique will play an important role in diagnosing and managingpatients with heart disease. (ECHOCARDIOGRAPHY, Volume 18, January 2001)
real-time 3-D echocardiography
Two-dimensional (2-D) echocardiography iswidely used to assess patients with cardiovas-cular disease. Although a vast amount of clin-ically useful information can be obtained at arelatively low cost, the technique has signi�-cant limitations. It does not provide precisequantitative information. Rather, geometricassumptions are made to calculate chambervolumes, mass, and ejection fraction. Thus,many of the observations are subjective, result-ing in signi�cant interobserver variation. As aresult, the measurements obtained are ofteninaccurate with poor reproducibility, particu-larly when cardiac chambers are deformed anddo not �t a speci�c geometric model. Lastly,2-D imaging of a three-dimensional (3-D) dy-namic organ, such as the heart, is less thanideal.
Various techniques have been assessed toproduce 3-D images of the heart.1-4 Most ofthese techniques integrate 2-D images into a3-D data set through sequential spatial andtemporal registration of 2-D images. Subse-quent reconstruction of 3-D images is attainedusing various computer software programs.Our experience has been with TomTec imaging
system, which relies on transducer-based local-ization for spatial orientation. We also haveused a K-3 system, which uses acoustic signalsto localize the position of the transducer rela-tive to a �xed point at a distance from thetransducer.5 Both approaches are excellent inproviding quantitative 3-D information; TomTec(Munich, Germany) provides volume-rendered3-D images with excellent structural detail andthe K-3 system (Shelton, CT, USA) obtains ac-curate measurements of ventricular volume,mass, and ejection fraction. The enormousamount of data generated by these techniquesmust be processed and reconstructed for view-ing, a somewhat time-consuming and dif�cultendeavor for every day practice. The success of2-D echocardiography in clinical cardiology islinked to the immediate availability of imagesthat it provides, which is lacking in the abovementioned 3-dimensional techniques. This ma-jor technical obstacle has been overcome withthe introduction of real-time 3-D (RT-3-D)echocardiography (Volumetrics, Durham, NC,USA).
RT-3-D Echocardiography
A 16-fold increase in the data acquisitionrate is achieved by a new signal processingapproach which allows scanning of a pyramidalvolume.6 The transducer for the volumetricscanner is approximately the same size as the
Address for correspondence and reprint requests: MasoodAhmad, M.D., University of Texas Medical Branch, 301University Blvd., 4.148 McCullough Building, Galveston,TX 77555-0766. Fax: 409-772-8240; E-mail: [email protected]
Reprinted with permission fromECHOCARDIOGRAPHY, Volume 18, No. 1, January 2001
Copyright ©2001 by Futura Publishing Company, Inc., Armonk, NY 10504-0418
73ECHOCARDIOGRAPHY: A Jrnl. of CV Ultrasound & Allied Tech.Vol. 18, No. 1, 2001
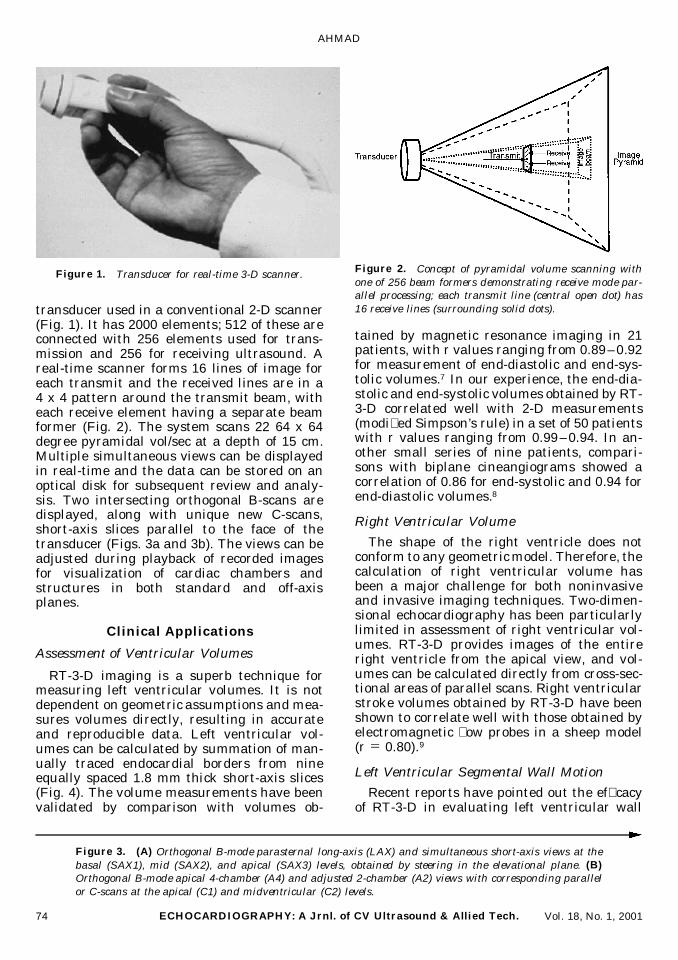
transducer used in a conventional 2-D scanner(Fig. 1). It has 2000 elements; 512 of these areconnected with 256 elements used for trans-mission and 256 for receiving ultrasound. Areal-time scanner forms 16 lines of image foreach transmit and the received lines are in a4 x 4 pattern around the transmit beam, witheach receive element having a separate beamformer (Fig. 2). The system scans 22 64 x 64degree pyramidal vol/sec at a depth of 15 cm.Multiple simultaneous views can be displayedin real-time and the data can be stored on anoptical disk for subsequent review and analy-sis. Two intersecting orthogonal B-scans aredisplayed, along with unique new C-scans,short-axis slices parallel to the face of thetransducer (Figs. 3a and 3b). The views can beadjusted during playback of recorded imagesfor visualization of cardiac chambers andstructures in both standard and off-axisplanes.
Clinical Applications
Assessment of Ventricular Volumes
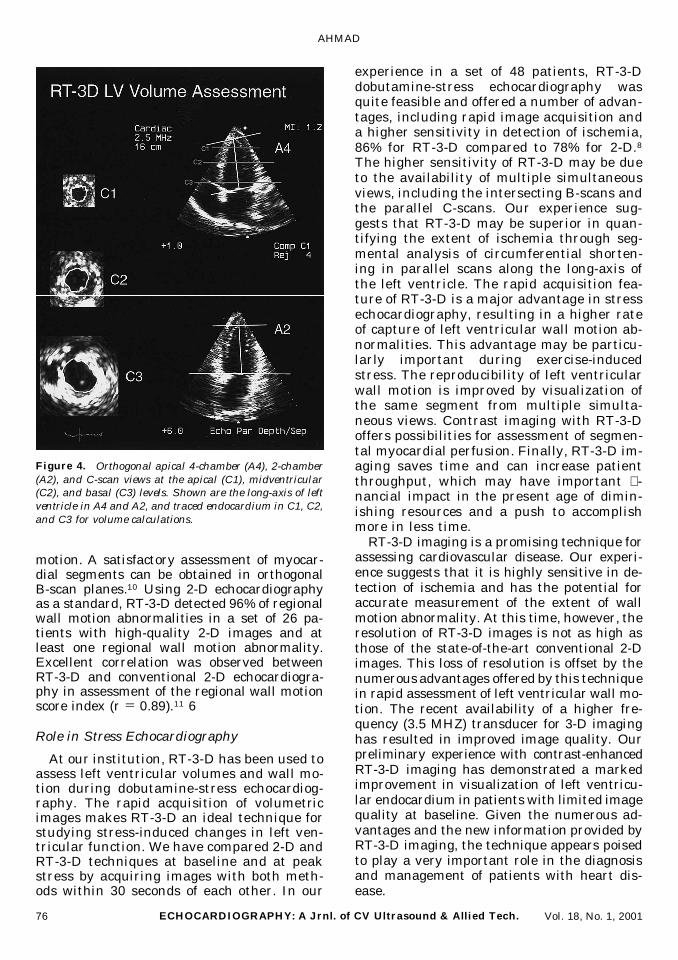
RT-3-D imaging is a superb technique formeasuring left ventricular volumes. It is notdependent on geometric assumptions and mea-sures volumes directly, resulting in accurateand reproducible data. Left ventricular vol-umes can be calculated by summation of man-ually traced endocardial borders from nineequally spaced 1.8 mm thick short-axis slices(Fig. 4). The volume measurements have beenvalidated by comparison with volumes ob-
tained by magnetic resonance imaging in 21patients, with r values ranging from 0.89–0.92for measurement of end-diastolic and end-sys-tolic volumes.7 In our experience, the end-dia-stolic and end-systolic volumes obtained by RT-3-D correlated well with 2-D measurements(modi�ed Simpson’s rule) in a set of 50 patientswith r values ranging from 0.99–0.94. In an-other small series of nine patients, compari-sons with biplane cineangiograms showed acorrelation of 0.86 for end-systolic and 0.94 forend-diastolic volumes.8
Right Ventricular Volume
The shape of the right ventricle does notconform to any geometric model. Therefore, thecalculation of right ventricular volume hasbeen a major challenge for both noninvasiveand invasive imaging techniques. Two-dimen-sional echocardiography has been particularlylimited in assessment of right ventricular vol-umes. RT-3-D provides images of the entireright ventricle from the apical view, and vol-umes can be calculated directly from cross-sec-tional areas of parallel scans. Right ventricularstroke volumes obtained by RT-3-D have beenshown to correlate well with those obtained byelectromagnetic �ow probes in a sheep model(r 5 0.80).9
Left Ventricular Segmental Wall Motion
Recent reports have pointed out the ef�cacyof RT-3-D in evaluating left ventricular wall
Figure 3. (A) Orthogonal B-mode parasternal long-axis (LAX) and simultaneous short-axis views at thebasal (SAX1), mid (SAX2), and apical (SAX3) levels, obtained by steering in the elevational plane. (B)Orthogonal B-mode apical 4-chamber (A4) and adjusted 2-chamber (A2) views with corresponding parallelor C-scans at the apical (C1) and midventricular (C2) levels.
Figure 1. Transducer for real-time 3-D scanner. Figure 2. Concept of pyramidal volume scanning withone of 256 beam formers demonstrating receive mode par-allel processing; each transmit line (central open dot) has16 receive lines (surrounding solid dots).
AHMAD
74 ECHOCARDIOGRAPHY: A Jrnl. of CV Ultrasound & Allied Tech. Vol. 18, No. 1, 2001

REAL-TIME THREE-DIMENSIONAL ECHOCARDIOGRAPHY
75ECHOCARDIOGRAPHY: A Jrnl. of CV Ultrasound & Allied Tech.Vol. 18, No. 1, 2001
motion. A satisfactory assessment of myocar-dial segments can be obtained in orthogonalB-scan planes.10 Using 2-D echocardiographyas a standard, RT-3-D detected 96% of regionalwall motion abnormalities in a set of 26 pa-tients with high-quality 2-D images and atleast one regional wall motion abnormality.Excellent correlation was observed betweenRT-3-D and conventional 2-D echocardiogra-phy in assessment of the regional wall motionscore index (r 5 0.89).11 6
Role in Stress Echocardiography
At our institution, RT-3-D has been used toassess left ventricular volumes and wall mo-tion during dobutamine-stress echocardiog-raphy. The rapid acquisition of volumetricimages makes RT-3-D an ideal technique forstudying stress-induced changes in left ven-tricular function. We have compared 2-D andRT-3-D techniques at baseline and at peakstress by acquiring images with both meth-ods within 30 seconds of each other. In our
experience in a set of 48 patients, RT-3-Ddobutamine-stress echocardiography wasquite feasible and offered a number of advan-tages, including rapid image acquisition anda higher sensitivity in detection of ischemia,86% for RT-3-D compared to 78% for 2-D.8
The higher sensitivity of RT-3-D may be dueto the availability of multiple simultaneousviews, including the intersecting B-scans andthe parallel C-scans. Our experience sug-gests that RT-3-D may be superior in quan-tifying the extent of ischemia through seg-mental analysis of circumferential shorten-ing in parallel scans along the long-axis ofthe left ventricle. The rapid acquisition fea-ture of RT-3-D is a major advantage in stressechocardiography, resulting in a higher rateof capture of left ventricular wall motion ab-normalities. This advantage may be particu-larly important during exercise-inducedstress. The reproducibility of left ventricularwall motion is improved by visualization ofthe same segment from multiple simulta-neous views. Contrast imaging with RT-3-Doffers possibilities for assessment of segmen-tal myocardial perfusion. Finally, RT-3-D im-aging saves time and can increase patientthroughput, which may have important �-nancial impact in the present age of dimin-ishing resources and a push to accomplishmore in less time.
RT-3-D imaging is a promising technique forassessing cardiovascular disease. Our experi-ence suggests that it is highly sensitive in de-tection of ischemia and has the potential foraccurate measurement of the extent of wallmotion abnormality. At this time, however, theresolution of RT-3-D images is not as high asthose of the state-of-the-art conventional 2-Dimages. This loss of resolution is offset by thenumerous advantages offered by this techniquein rapid assessment of left ventricular wall mo-tion. The recent availability of a higher fre-quency (3.5 MHZ) transducer for 3-D imaginghas resulted in improved image quality. Ourpreliminary experience with contrast-enhancedRT-3-D imaging has demonstrated a markedimprovement in visualization of left ventricu-lar endocardium in patients with limited imagequality at baseline. Given the numerous ad-vantages and the new information provided byRT-3-D imaging, the technique appears poisedto play a very important role in the diagnosisand management of patients with heart dis-ease.
Figure 4. Orthogonal apical 4-chamber (A4), 2-chamber(A2), and C-scan views at the apical (C1), midventricular(C2), and basal (C3) levels. Shown are the long-axis of leftventricle in A4 and A2, and traced endocardium in C1, C2,and C3 for volume calculations.
AHMAD
76 ECHOCARDIOGRAPHY: A Jrnl. of CV Ultrasound & Allied Tech. Vol. 18, No. 1, 2001

References
1. Pandian NG, Roelandt J, Nanda NC, et al: Dynamicthree-dimensional echocardiography: Methods andclinical potential. Echocardiography 1994;11:237-259.
2. Delabays A, Pandian NG, Cao QL, et al: Transtho-racic real-time three-dimensional echocardiographyusing a fan-like scanning approach for data acquisi-tion: Methods, strength, problems, and initial clinicalexperience. Echocardiography 1995;12:49-59.
3. Yao J, Cao QL, Marx G, et al: Three-dimensionalechocardiography: Current development and futuredirections. J Med Ultrasound 1996;4:11-19.
4. Gopal AL, Keller AM, Rigling R, et al: Left ventricularvolume and endocardial surface area by 3-dimen-sional echocardiography: Comparison with 2-dimen-sional echocardiography and nuclear magnetic reso-nance imaging in normal subjects. J Am Coll Cardiol1993;22:258-270.
5. Xie T, Trough M, Kumar M, et al: Left ventricularvolume measurements: Two different three-dimen-sional echocardiography methods compared with bi-plane cineventriculography. (abstract) J Am SocEchocardiogr 1997;10:391.
6. von Ramm OT, Smith SW: Real-time volumetric ul-
trasound imaging system. J Digit Imaging 1990;3:261-266.
7. Sun JP, White RD, Qin JX, et al: Real-time 3-dimen-sional echocardiography for quanti�cation of left ven-tricular volumes and ejection fraction: Comparisonwith magnetic resonance imaging and 2-D echo. (ab-stract) Circulation 1998;98(Suppl.):1168.
8. Ahmad M, Xie T, Trough M, et al: Real-time 3-DDobutamine stress echocardiography: A novel ap-proach compared to conventional 2-D stress echocar-diography. (abstract) Circulation 1998;98(Suppl.):1169.
9. Shiota T, Jones M, Chikada M, et al: Real-time three-dimensional echocardiography for determining rightventricular stroke volume in an animal model ofchronic right ventricular volume overload. Circula-tion 1998;97:1897-1900.
10. Takuma S, Zwas DR, Fard A, et al: Real-time 3-dimensional echocardiography acquires all standard2-dimensional images from two volume sets: A clini-cal demonstration in 45 patients. J Am Soc Echocar-diogr 1999;12:1-6.
11. Collins M, Hsieh A, Ohazama CJ, et al: Assessment ofregional wall motion abnormalities with real-time3-dimensional echocardiography. J Am Soc Echocar-diogr 1999;12:7-14.
REAL-TIME THREE-DIMENSIONAL ECHOCARDIOGRAPHY
77ECHOCARDIOGRAPHY: A Jrnl. of CV Ultrasound & Allied Tech.Vol. 18, No. 1, 2001