![Regional Report on Ozone Observation Ozone Observation [ RA-II: Asia ] Regional Report on Ozone Observation Ozone Observation [ RA-II: Asia ] Hidehiko.](https://static.fdocuments.us/doc/165x107/56649f115503460f94c23df0/regional-report-on-ozone-observation-ozone-observation-ra-ii-asia-regional.jpg)
Real-Time Observation of Nonclassical Protein ...
7
Real-Time Observation of Nonclassical Protein Crystallization Kinetics Andrea Sauter, † Felix Roosen-Runge, ‡ Fajun Zhang,* ,† Gudrun Lotze, ∥ Robert M. J. Jacobs, § and Frank Schreiber † † Institut fü r Angewandte Physik, Universitä t Tü bingen, Auf der Morgenstelle 10, 72076 Tü bingen, Germany ‡ Institut Laue-Langevin, 71 avenue des Martyrs, 38042 Grenoble Cedex 9, France ∥ European Synchrotron Radiation Facility, 71 avenue des Martyrs, 38043 Grenoble Cedex 9, France § Department of Chemistry, Chemistry Research Laboratory, University of Oxford, Mansfield Road, Oxford, OX1 3TA, United Kingdom * S Supporting Information ABSTRACT: We present a real-time study of protein crystallization of bovine β-lactoglobulin in the presence of CdCl 2 using small-angle X-ray scattering and optical microscopy. From observing the crystallization kinetics, we propose the following multistep crystallization mechanism that is consistent with our data. In the first step, an intermediate phase is formed, followed by the nucleation of crystals within the intermediate phase. During this period, the number of crystals increases with time, but the crystal growth is slowed down by the surrounding dense intermediate phase due to the low mobility. In the next step, the intermediate phase is consumed by nucleation and slow growth, and the crystals are exposed to the dilute phase. In this stage, the number of crystals becomes nearly constant, whereas the crystals grow rapidly due to access to the free protein molecules in the dilute phase. This real-time study not only provides evidence for a two-step nucleation process for protein crystallization but also elucidates the role and the structural signature of the metastable intermediate phase in this process. ■ INTRODUCTION Protein crystallization is the bottleneck of many projects in structural biology, since, in general, suitable crystallization conditions cannot be reliably predicted. 1 In classical nucleation theory, the solute molecules reversibly aggregate in the supersaturated solution and form nuclei with the density and structure of the crystals in the final stage. While classical nucleation theory has been successfully used in many systems, including protein crystallization under certain conditions, 2 various studies in the crystallization of proteins, colloids, and clathrate hydrates as well as biomineralization have shown features beyond the classical view in the early stage of nucleation. 3−8 In contrast to atomic systems, proteins and colloids often have an attractive interaction short-ranged compared to the size of the particles, as demonstrated by experiments, 9−14 theory, 15,16 and simulations. 17,18 Such short-ranged attraction leads to a liquid−liquid phase separation (LLPS) which is metastable with respect to the crystalline phase. 18−22 For these systems, a two-step (or multistep) mechanism of crystal nucleation has been discussed, i.e., an intermediate state, either cluster, aggregates, or a dense liquid phase, exists between the initial solution and the final crystalline state and may serve as the nucleation precursor. We note that throughout this paper, we use the term ‘aggregates’ instead of ‘clusters’ to avoid misinterpretation. An important theoretical prediction is that nucleation is favored in the dense liquid intermediate phase compared to the dilute phase, since the surface energy of the dense phase is closer to the final crystalline state, and the free energy barrier for nucleation is lower. 8,18,19 However, experimental observations in several protein systems suggest that crystals nucleate mainly from the dilute phase or at the interface of the dense liquid droplets and grow outside of it into the dilute phase 13,14,23 Despite the existing various theoretical concepts, clear experimental evidence and suitable methods to distinguish the early stage of nucleation are rather rare. 24−27 Early studies of protein crystal growth in real space using atomic force microscopy have revealed many important features of the metastable protein clusters and their role in the nucleation process. 27−31 However, the quantitative real-time in situ characterization of the transition kinetics and microscopic structure from the metastable intermediate phase to the stable crystalline phase is still a challenge. Our previous studies have shown that trivalent salts such as YCl 3 lead to a reentrant condensation and metastable liquid− Received: October 14, 2014 Published: January 8, 2015 Article pubs.acs.org/JACS © 2015 American Chemical Society 1485 DOI: 10.1021/ja510533x J. Am. Chem. Soc. 2015, 137, 1485−1491
Transcript of Real-Time Observation of Nonclassical Protein ...

Real-Time Observation of Nonclassical Protein CrystallizationKineticsAndrea Sauter,† Felix Roosen-Runge,‡ Fajun Zhang,*,† Gudrun Lotze,∥ Robert M. J. Jacobs,§
and Frank Schreiber†
†Institut fur Angewandte Physik, Universitat Tubingen, Auf der Morgenstelle 10, 72076 Tubingen, Germany‡Institut Laue-Langevin, 71 avenue des Martyrs, 38042 Grenoble Cedex 9, France∥European Synchrotron Radiation Facility, 71 avenue des Martyrs, 38043 Grenoble Cedex 9, France§Department of Chemistry, Chemistry Research Laboratory, University of Oxford, Mansfield Road, Oxford, OX1 3TA, UnitedKingdom
*S Supporting Information
ABSTRACT: We present a real-time study of protein crystallization ofbovine β-lactoglobulin in the presence of CdCl2 using small-angle X-rayscattering and optical microscopy. From observing the crystallizationkinetics, we propose the following multistep crystallization mechanismthat is consistent with our data. In the first step, an intermediate phaseis formed, followed by the nucleation of crystals within the intermediatephase. During this period, the number of crystals increases with time,but the crystal growth is slowed down by the surrounding denseintermediate phase due to the low mobility. In the next step, theintermediate phase is consumed by nucleation and slow growth, andthe crystals are exposed to the dilute phase. In this stage, the number ofcrystals becomes nearly constant, whereas the crystals grow rapidly dueto access to the free protein molecules in the dilute phase. This real-time study not only provides evidence for a two-stepnucleation process for protein crystallization but also elucidates the role and the structural signature of the metastableintermediate phase in this process.
■ INTRODUCTION
Protein crystallization is the bottleneck of many projects instructural biology, since, in general, suitable crystallizationconditions cannot be reliably predicted.1 In classical nucleationtheory, the solute molecules reversibly aggregate in thesupersaturated solution and form nuclei with the density andstructure of the crystals in the final stage. While classicalnucleation theory has been successfully used in many systems,including protein crystallization under certain conditions,2
various studies in the crystallization of proteins, colloids, andclathrate hydrates as well as biomineralization have shownfeatures beyond the classical view in the early stage ofnucleation.3−8
In contrast to atomic systems, proteins and colloids oftenhave an attractive interaction short-ranged compared to the sizeof the particles, as demonstrated by experiments,9−14
theory,15,16 and simulations.17,18 Such short-ranged attractionleads to a liquid−liquid phase separation (LLPS) which ismetastable with respect to the crystalline phase.18−22 For thesesystems, a two-step (or multistep) mechanism of crystalnucleation has been discussed, i.e., an intermediate state, eithercluster, aggregates, or a dense liquid phase, exists between theinitial solution and the final crystalline state and may serve asthe nucleation precursor. We note that throughout this paper,
we use the term ‘aggregates’ instead of ‘clusters’ to avoidmisinterpretation. An important theoretical prediction is thatnucleation is favored in the dense liquid intermediate phasecompared to the dilute phase, since the surface energy of thedense phase is closer to the final crystalline state, and the freeenergy barrier for nucleation is lower.8,18,19 However,experimental observations in several protein systems suggestthat crystals nucleate mainly from the dilute phase or at theinterface of the dense liquid droplets and grow outside of it intothe dilute phase13,14,23 Despite the existing various theoreticalconcepts, clear experimental evidence and suitable methods todistinguish the early stage of nucleation are rather rare.24−27
Early studies of protein crystal growth in real space usingatomic force microscopy have revealed many important featuresof the metastable protein clusters and their role in thenucleation process.27−31 However, the quantitative real-time insitu characterization of the transition kinetics and microscopicstructure from the metastable intermediate phase to the stablecrystalline phase is still a challenge.Our previous studies have shown that trivalent salts such as
YCl3 lead to a reentrant condensation and metastable liquid−
Received: October 14, 2014Published: January 8, 2015
Article
pubs.acs.org/JACS
© 2015 American Chemical Society 1485 DOI: 10.1021/ja510533xJ. Am. Chem. Soc. 2015, 137, 1485−1491

liquid phase separation phase behavior in many solutions ofnegatively charged proteins.32−35 Importantly, crystal growthdepends on the exact location in the phase diagram: Dependingon external control parameters such as salt concentration andtemperature, classical crystallization or a temperature-depend-ent nonclassical process was observed but could not beanalyzed in further detail regarding kinetics and nucleationmechanism. The optimum crystallization conditions werefound close to the reentrant condensation phase boundaries.34
In this work, we investigate the crystallization kinetics of theglobular protein β-lactoglobulin (BLG) in the presence of thedivalent salt CdCl2 by real-time SAXS and optical microscopy.BLG has turned out to be a good model system forcrystallization by tuning the protein interactions utilizingreentrant condensation with trivalent salts. Here, we focus onthe effect of the formation of aggregates on the crystallizationprocess and which crystallization pathways are followed. In adistinct phase diagram region, protein aggregates form beforecrystallization. Given the dimensions of proteins, a directoptical visualization of the nucleation process in proteinsolutions is not possible. Here, we employ the method ofreal-time SAXS, monitoring the nucleation process by means ofstructural information on the solutes such as proteinmonomers, crystals, and intermediates. These experimentsraise interesting questions regarding protein nucleation. Amodel is proposed to explain the main features of theexperiments. Different scenarios of crystal formation can becompared to the kinetic data. While the classical one-stepnucleation describes the direct nucleation and growth from ahomogeneous solution, in particular two nonconventionalpathways are discussed (see Figure 1): first, a parallel process
of one-step crystal nucleation accompanied by an “intermedi-ate” that forms and dissolves in the solution depending onconcentration (Figure 1a). In this pathway, crystal growth takesplace via the liquid or possibly by incorporation of aggregates,which, however, are not essential for crystal nucleation. Second,a two-step process of crystal nucleation within an intermediatethat forms first from solution and is later transformed tocrystals (Figure 1b).
■ EXPERIMENTAL SECTIONLyophilized protein powder of BLG from bovine milk and the divalentsalt cadmium chloride (CdCl2) were purchased from Sigma-Aldrich(product no. L3908 and 202908) and used as received.
Stock solutions were prepared by dissolving the protein powder orsalt in deionized (18.2 MΩ) and degassed Millipore water. All sampleswere prepared by mixing the needed amount of protein, salt stocksolution, and Millipore water. The protein concentration wasdetermined by UV absorption using an extinction coefficient of 0.96mL·mg−1 cm−1 at a wavelength of 278 nm.36 To avoid the effect ofbuffer on the phase behavior, no additional buffer was used for samplepreparation. The pH of the solutions was monitored using a SevenEasy pH instrument from Mettler Toledo and was in between 6.0 and7.0. Compared with the pI = 5.2 of BLG,37 the pH effect of added saltcould not lead to the charge inversion of proteins.33,38 All experimentswere performed at 293 K.
Circular dichroism (J-720 spectrophotometer from Jasco Inc.) andFourier transform infrared spectroscopy (FTIR) (IFS 48 from Bruker)were applied to monitor the stability of the protein secondary structureunder the experimental conditions.
Crystal growth was followed by optical microscopy (DME fromLeica Microsystem GmbH or AxioScope A1 from Zeiss). Beforecrystallization, protein stock solutions were filtered (100 μm). Thecrystallization process was performed using either a vapor diffusionhanging drop method or a batch method between two narrow glassslides (thickness approximately 300 μm), sealed by silicone. Bothmethods gave similar results.
SAXS measurements were carried out at the ESRF, Grenoble,France at beamline ID02. With a sample-to-detector distance of 2 mand an energy of 16047 eV, the accessed q-range was 0.06−4.3 nm−1.Details of the beamline, data collection, and calibration can be found inref 39. For time-resolved SAXS measurements, freshly preparedsample solutions in a quartz capillary were quickly transferred to thesample station and the measurement started about 2−3 min aftermixing. SAXS data were collected every 2 to 5 min depending on thesamples. The exposure time was 0.05 s. To check the consistency ofthe measurements, the sample was shifted vertically to differentpositions. This cycle was repeated every 2−5 min. Only the data fromone position as a function of time was used for the data analysis shownbelow, but data from all positions are consistent with our analysis.
■ RESULTS
Experimental Phase Diagram and Protein Stability.To provide a basis for the kinetic studies, we first present theexperimental phase diagram of BLG in the presence of CdCl2(Figure 2). Upon adding CdCl2, BLG solutions show a sharptransition c* from a clear solution at low CdCl2 concentrations(regime I) to a turbid one with massive precipitates at higherCdCl2 concentrations (regime II). At further increased saltconcentrations, the precipitates are gradually dissolved and thesolution becomes less turbid, but not completely clear even forFigure 1. Schematic of all processes in two possible pathways of
crystallization. (a) Nucleation directly from the liquid, parallelformation of “intermediates” that are redissolved or consumed bythe growing crystals. (b) Intermediates are formed first and act asprecursor for crystal nucleation.
Figure 2. Experimental phase diagram of BLG and CdCl2 at roomtemperature. Yellow stars mark the conditions used for the SAXSexperiments. Inset: Samples with a fixed BLG concentration (10 mg/mL) and increasing CdCl2 concentrations (from left to right: 0.6, 0.8,30, and 90 mM).
Journal of the American Chemical Society Article
DOI: 10.1021/ja510533xJ. Am. Chem. Soc. 2015, 137, 1485−1491
1486

a very high salt concentration. This is in contrast to systemswith trivalent salts where we observed a second border c**above which samples become completely clear again (re-entranteffect).32,33 We define this partial transition zone to clearsolutions as pseudo-c**. The region above pseudo-c** isdenoted as regime III. Zeta potential measurements show that aCdCl2 concentration-dependent charge inversion of the proteintakes place (SI, Figure S1b). In Figure 2, stars mark theconditions used for the real-time SAXS measurements. Underthe current experimental conditions, no liquid−liquid phaseseparation was observed in BLG solutions in the presence ofCdCl2, in contrast to some of the other protein-salt systemsshowing reentrant condensation.35 In these cases, the liquid−liquid phase separation region is found as a closed area withinthe second regime.We emphasize that the observed protein condensation is not
caused by a change of the protein structure induced by CdCl2.We have performed Fourier transform infrared (FTIR) andcircular dichroism spectroscopy for a broad protein and saltconcentration range as presented in Figure 3. Both techniques
indicate no significant change on the secondary structure of theprotein. Time-dependent FTIR spectra of the amide I and IIbands also confirm that no significant structural change occursduring the entire crystallization process (SI, Figure S1a).Crystallization Followed by Optical Microscopy.
Crystallization of BLG in the presence of CdCl2 was observedwithin a wide range of the above shown phase diagram. Slightly
below and above c*, no indications for a multistep process wereobserved: Crystals nucleate directly from a solution and growlarger without any visible clustering or liquid−liquid phaseseparation (Figure 4a−c). The typical shape of the crystals isneedle-like under these conditions. In contrast, in the transitionzone of pseudo-c** (Figure 4d−f), protein aggregates formquickly after sample preparation and the solution observed byoptical microscopy becomes more turbid. During crystalliza-tion, the turbid solution becomes gradually clearer, indicatingthat the aggregates are consumed. Removing the aggregates bycentrifuging can significantly reduce the number of crystals, asalso shown in other protein systems.27
We further analyze the time dependence of the number andsize of crystals. The visible area A of crystals in the microscopypictures was determined by the open source program ImageJ.40
The average crystal length can be estimated as L ≈ (A/N)1/2,where N is the number of crystals in the respective image.Figure 4g shows the evolution of L and N with time. In thebeginning, the number of crystals increases linearly and thensaturates. After the visible crystals stop increasing in number,they still significantly increase in size. The increase in L is slowuntil 80 min, then faster growth starts and eventually saturatesdue to depletion of protein. The effect of centrifuging on thenumber of crystals and the acceleration of the growth rate after80 min suggest that nucleation is closely related to the amountof protein portioned in aggregates formed in the early stage ofsample preparation.
Figure 3. (a) FTIR results (amide I and II) for a BLG concentration of20 mg/mL and CdCl2 concentrations between 0 and 30 mM (coveringall three regimes). (b) Circular dichroism spectra for samples with aBLG concentration of 0.2 mg/mL and CdCl2 concentrations between0 and 5 mM.
Figure 4. Real-time observation of crystal growth by opticalmicroscopy. (a−c): Crystallization of a clear sample slightly belowc* (6.5 mg/mL BLG with 0.7 mM CdCl2), directly after preparation(a), after 30 min (b), and after several days (c). (d−f): Nonclassicalcrystallization in the pseudo-c** zone (3.3 mg/mL BLG with 7 mMCdCl2) 20 min (d), 30 min (e), and 120 min after preparation (f). (g):Quantitative analysis of a nonclassical crystallization process for asample within pseudo-c** (20 mg/mL BLG with 15 mM CdCl2, seealso SI Video S1). The number of crystals N (filled red circles, leftaxis) and the average length L = (A/N)1/2 (open diamonds, right axis)are plotted as a function of time. Right: Evaluation of the area A ofcrystals.
Journal of the American Chemical Society Article
DOI: 10.1021/ja510533xJ. Am. Chem. Soc. 2015, 137, 1485−1491
1487
Crystal Growth Followed by Real-Time SAXS. Becauseof the fast crystallization process and limited resolution ofoptical microscopy, it is impossible to deduce the role ofprotein aggregates on the nucleation process by this method.For this purpose, we employ real-time SAXS to follow the earlystage of crystallization. Figure 5 shows time-resolved SAXS datafor crystallization slightly below c* (Figure 5a) and within thetransition zone of pseudo-c** (Figure 5c). By dividing eachcurve by the first one, we monitor the evolution of the samples.This is shown in the bottom projections of the 3D-plots. InFigure 5b,d, I(q, t) and I(q, t)/I(q, t = 0) are plotted at selectivetimes for further discussion. For comparison, the form factor ofBLG is also shown (blue dotted line).Below c*, the scattering curves change gradually with time.
After an induction time (20 min in the example shown inFigure 5a,b), Bragg peaks appear and grow with time. Lesspronounced Bragg peaks at later times are caused by crystalssedimenting out of the beam position. This is occasionallyobserved close to c*, where the samples are less viscous thanwithin the pseudo-c** zone. Apart from that, the underlyingshape of the curves barely changes with time. No indication ofstates other than solution and crystal was found. Similar
behavior was found for other samples slightly below and abovec*. Hence, close to c*, the crystallization process is consistentwith the observation by optical microscopy and can beexplained by classical nucleation theory.Importantly, within the region of pseudo-c**, I(q, t) follows
a power law of q−2 at low q directly after preparation (thechange of the exponent is shown in Figure S2 in SI), deviatingstrongly from the form factor of BLG under physiologicalconditions (blue dotted line in Figure 5b,d). This is consistentwith the formation of aggregates after sample preparation.41,42
The data were analyzed by normalizing the time-dependent I(q,t) by I(q, t = 0), which minimizes the effect of the form factorand the aggregate formation in the system and emphasizes thetime-dependent relative changes. With increasing time, a broadmaximum at 0.7−1.4 nm−1 appears (Figure 5c,d). Sincescattering probes molecular and solution structures directlyand thus is sensitive to changes of particle correlations, thetime-dependent change of this broad peak can be interpreted asthe evolution of a new structural feature within the largeraggregates at length scales of about 10 nm. Over time, thisbroad peak increases in intensity until Bragg peaks start to beobserved. The two most pronounced Bragg peaks located at
Figure 5. Real-time SAXS curves for 33 mg/mL BLG with 4 mM (a,b), i.e., slightly below c*, and 20 mg/mL BLG with 15 mM CdCl2 (c,d), i.e.within pseudo-c**. (a,c) 3D surface illustration of I(q, t). The bottom projections are created from all curves divided by the first one. The arrow in(c) points to an additional structure forming before crystallization. (b,d) Single I(q, t) and I(q, t)/I(q, t = 0) curves at selective times multiplied byconstant factors for better visibility. The blue dotted line shows the form factor of BLG at low concentrations.
Journal of the American Chemical Society Article
DOI: 10.1021/ja510533xJ. Am. Chem. Soc. 2015, 137, 1485−1491
1488
1.01 and 1.27 nm−1 overlap with the broad maximum. Theintensity of the Bragg peaks increases with time, whereas thebroad peak shrinks and eventually disappears. Similarcrystallization behavior was also observed for other sampleswithin the region of pseudo-c** (cf. Figure 2).To quantify the relationship between the aggregates (broad
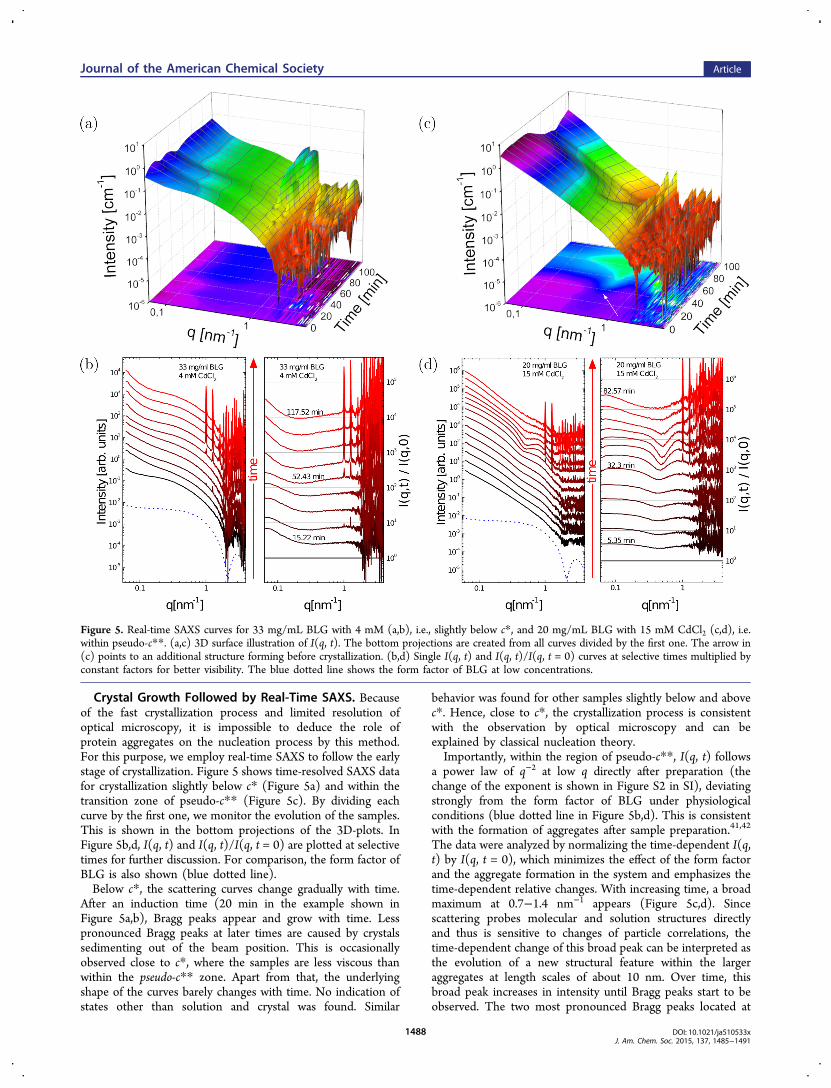
peak) and crystals (Bragg peaks) as a function of time, we usethe concept of the degree of crystallinity known fromsemicrystalline polymers43 for further data analysis: Theintensity at the minimum (at around 0.5 nm−1) was subtractedto set Imin to zero. Then, the broad peak in I(q, t)/I(q, t = 0)was fitted by a broad scaled Gaussian, and the remaining Braggpeaks were fitted by two further (sharp) Gaussian functions(Figure 6a). For different times, the enveloped area of the
broad region, Ainterm, and the area of the Bragg peaks, ABragg,were followed over time, monitoring the crystallization kinetics.Figure 6b shows Ainterm (red spheres) and ABragg (green stars)
as a function of time. The formation of the intermediate phasestarts from the very first measurements on, increasing with timeup to a maximum after approximately 42 min. Afterwards,Ainterm decays gradually to zero. ABragg, on the other hand, iszero in the beginning and becomes visible after 30 min.Interestingly, the increase with time is nontrivial: After reachinga plateau around 50−80 min, ABragg increases dramatically. Forfurther understanding, we show the first time derivative ofABragg which represents the crystallization rate (blue dashed linein Figure 6b, right axis), calculated at each point in time fromthe average of the incoming and outgoing slope. Interestingly,dABragg/dt has a local maximum corresponding to the maximumof Ainterm, suggesting that the crystallization rate is proportionalto the amount of protein in these aggregates. Recalling the
observation in Figure 4g, the early stage of crystallization can beinterpreted as dominated by the nucleation events. Thissuggests that nucleation occurs within the intermediate phase.The strong increase in ABragg after 80 min can be related to thegrowth-dominated stage as observed in Figure 4g. The samebehavior could be observed for other conditions within theregion of pseudo-c** followed by real-time SAXS. An analysisfor a sample with 33 mg/mL BLG with 17 mM CdCl2 can befound in the SI, Figures S3−5. In contrast, all tested conditionsclose to c* show no signs of the existence of an intermediatephase between the initial solution and the final crystalline state.
Discussion: Parallel One-Step Processes versus Two-Step Process. Based on the above presented real-time resultsfrom both optical microscopy and SAXS, we suggest thefollowing crystallization mechanism: In the first step, proteinaggregates form as an intermediate and crystals nucleate fromthe aggregate precursor after a short induction time. Thenucleation rate is thus proportional to the amount of theintermediate phase; as expected for such a two-step nucleation,a local maximum in the crystallization rate (and hence a pointof inflection in ABragg) occurs when Ainterm is at its maximum.Crystal growth is slow, possibly due to the slow dynamics ofmolecules within the aggregates, which makes it difficult forproteins to diffuse to the growth front. However, such slowdynamics may be sufficient for nucleation as less molecules areinvolved in this process. We note that if the intermediate is in akinetically arrested states (even slower dynamics), nucleationcan be strongly impeded.19 In the second step, the intermediatephase is consumed by nucleation and crystal growth, and thecrystals grow rapidly by consuming free protein from the dilutephase. Proteins in the dilute phase (also in small aggregates asindicated from SAXS profiles and earlier studies44) can be easilyincorporated into the crystal lattice. Importantly, the nucleationrate in the second step is significantly reduced, which furtherdemonstrates the likely role of the protein aggregates as theprecursor of a two-step nucleation process. All observations areexplained very naturally using the two-step nucleation pathwaybased on clearly defined physical concepts (Figure 1b).The proposed two-step nucleation mechanism can be further
supported by using a rate equation model. Before looking intodifferent quantitative models of the nucleation process, we notethree qualitative model-free aspects directly from the data: (a)The intermediate forms very fast, while the initial crystalnucleation and growth are much slower. (b) Given the fastformation of intermediate, the disappearance of the inter-mediate has implications for its nature. At the time ofdisappearance, a considerable concentration in the liquidphase is still present, since the crystal growth is taking placeeven later. Thus, the intermediate is not in equilibrium with theliquid phase, but rather supplied by an excess concentration inthe supersaturated liquid. (c) The plateau in the crystalformation indicates that the initial crystal growth is muchslower than the final crystal growth.One possible scenario involving an intermediate and crystals
is a picture of two parallel one-step processes as sketched inFigure 1a. The intermediate would form from the super-saturated solution, and subsequently dissolve again, once theliquid phase is depleted by crystal nucleation and growth. Whilethis scenario is consistent with observation (a) and (b) above, itcannot explain the plateau (c). Given the fast kinetics of theformation of the intermediate (a), the concentration in theliquid stays rather constant at the saturation concentration (b).Thus, once crystals are present, crystal growth should occur
Figure 6. Analysis of the time-dependent data. (a) For data analysis,the areas of the intermediate and crystalline part of I(q, t)/I(q, t = 0)were evaluated. (b) Red spheres (left axis) show Ainterm(t), the integralof the broad Gaussian function, connected to the intermediate statefrom 0.4 to 1.3 nm−1. Green stars (left axis) show ABragg(t), the integralof the two Bragg peaks in this area. The blue dashed line (right axis)shows the time derivative of ABragg(t), the crystallization rate. Thegrowth rate has a local maximum at the total maximum of Ainterm(t).(c) A rate equation model based on physically meaningful processesreproduces the experimental kinetic features. The light-cyan areamarks the nucleation-dominated regime and is followed by the growth-dominated regime (no sharp transition).
Journal of the American Chemical Society Article
DOI: 10.1021/ja510533xJ. Am. Chem. Soc. 2015, 137, 1485−1491
1489

with a similar steeply increasing signature as in the late growthstate, instead of being stagnant for some period. Thus, theparallel picture fails to explain an essential aspect observed inthe experiment.We note that it may be possible to introduce ad hoc technical
modifications of the one-step parallel scenario to force-fit thedata. Note that these modifications necessarily would violate apicture of a one-step process along classical nucleation theory,and rather suggest an effective multistep process. We also notethat the existence of heterogeneous nucleation or thecombination of heterogeneous and homogeneous nucleationprocesses might lead to an overall growth kinetics similar totwo or multiple parallel nucleation process, which again will notexplain the plateau. Furthermore, these modifications wouldrely on a certain combination of parallel one-step processes,which makes the consequential two-step mechanism morefeasible to explain the experimental results.The second scenario is the picture of a two-step process of
crystal nucleation from a previously formed intermediate asrepresented by Figure 1b. As shown in Figure 6c, a relatedmodel of rate equations based on processes with a clearphysical meaning reproduces all features with very goodagreement with the data. In the following, the system isdescribed in terms of the mass fractions of protein in the liquidsolution (L), in the intermediate phase (I) and within crystalsin the solution (CL) and intermediate phase (CI); (x)+ equals xfor positive x and 0 otherwise.First, the intermediate forms from the solution until the
liquid solution reaches a stable mass fraction L0: ΔI = kI(L −L0)+. Second, crystals nucleate slowly from the intermediate: Δn= knI. Third, the crystal growth within the intermediate dependson the amount of crystals and intermediate: ΔgI = kgIICI. Forth,once the intermediate phase is consumed and falls below acertain volume per crystal, the crystals become exposed to theliquid phase: Δt = ktCI(αICI − I)+. αI is the ratio of the criticalintermediate volume per crystal volume. Finally, once crystalsemerged into the liquid phase, the crystal growth in the liquidphase consumes the free protein molecules: ΔgL = kgLLCL.Consequently, the rate equations read
∂ = −Δ − ΔLt I gL (1)
∂ = Δ − Δ − ΔIt I n gI (2)
∂ = Δ − Δ + ΔCt I n t gI (3)
∂ = Δ + ΔCt L e gL (4)
with the initial conditions L(0) = 1, I(0) = 0, CI(0) = 0, andCL(0) = 0. The temporal evolution has been calculated with theEuler method using the following choices of model parameter:kI = 0.05 min−1, kn = 0.02 min−1, kgI = 0.1 min−1, kgL = 0.2min−1, ke = 1.0 min−1, L0 = 0.7, and αI = 0.2. Note that theabsolute values of the rates are consistent with the physicalpicture of this work and all parameters take physicallyreasonable values. We emphasize that the general qualitativeresult is robust against slight changes of the absolute values.
■ CONCLUSIONIn summary, our real-time SAXS and optical microscopy studyof protein BLG crystallization in the presence of CdCl2provides evidence for a two-step nucleation mechanism, i.e.,protein aggregates form first as an intermediate and crystalsnucleate within these aggregate precursors after an induction
time. The nucleation rate is thus proportional to the amount ofthe intermediate phase, consistent with the appearance of alocal maximum in the crystallization rate at the maximumquantity of the intermediate. However, the crystal growth rateis low, which might be due to the low mobility of proteinswithin the aggregates. This step lasts until the intermediatephase is consumed by crystallization, then crystal growthbecomes faster as proteins in the dilute phase can diffuse to andincorporate into the growth front directly. In contrast, thenucleation rate is significantly reduced, which furtherdemonstrates the role of the protein aggregates as the precursorof a two-step nucleation process. The experimental observa-tions on the nonclassical growth kinetics have been interpretedusing a rate equation model. In addition, these measurementsdemonstrate a noninvasive method to study in situ and in real-time the kinetics of nonclassical growth processes onnanometer length scales.
■ ASSOCIATED CONTENT
*S Supporting InformationA video of the crystal growth, real-time FTIR spectra of theprotein, ζ potential measurements under the same conditionsas the CD measurements, and an additional analyzed time-dependent SAXS study. This material is available free of chargevia the Internet at http://pubs.acs.org.
■ AUTHOR INFORMATION
Corresponding Author*[email protected]
NotesThe authors declare no competing financial interest.
■ ACKNOWLEDGMENTSThe authors thank the DFG for financial support and H.-J.Schope and M. Oettel for valuable discussions and comments.A.S. acknowledges a fellowship of the Landesgraduiertenforder-ung. A.S. thanks V. Niemann for the assistance in CDmeasurements and T. Stehle (IFIB, Universitat Tubingen) forsharing their lab resources.
■ REFERENCES(1) Nanev, C. N. Prog. Cryst. Growth Charact. Mater. 2013, 59, 133−169.(2) Sleutel, M.; Lutsko, J.; Van Driessche, A. E.; Duran-Olivencia, M.a.; Maes, D. Nat. Commun. 2014, 5, 5598.(3) Jacobson, L. C.; Hujo, W.; Molinero, V. J. Am. Chem. Soc. 2010,132, 11806−11.(4) Colfen, H.; Antonietti, M. Mesocrystals and nonclassicalcrystallization; John Wiley & Sons: West Sussex, 2008.(5) Gebauer, D.; Volkel, A.; Colfen, H. Science 2008, 322, 1819−22.(6) Gebauer, D.; Kellermeier, M.; Gale, J. D.; Bergstrom, L.; Colfen,H. Chem. Soc. Rev. 2014, 43, 2348−71.(7) Wallace, A. F.; Hedges, L. O.; Fernandez-Martinez, A.; Raiteri, P.;Gale, J. D.; Waychunas, G. A.; Whitelam, S.; Banfield, J. F.; De Yoreo,J. J. Science 2013, 341, 885−889.(8) Sear, R. P. Int. Mater. Rev. 2012, 57, 328−356.(9) Gliko, O.; Neumaier, N.; Pan, W.; Haase, I.; Fischer, M.; Bacher,A.; Weinkauf, S.; Vekilov, P. G. J. Am. Chem. Soc. 2005, 127, 3433−3438.(10) Gliko, O.; Pan, W.; Katsonis, P.; Neumaier, N.; Galkin, O.;Weinkauf, S.; Vekilov, P. G. J. Phys. Chem. B 2007, 111, 3106−3114.(11) Pan, W.; Galkin, O.; Filobelo, L.; Nagel, R. L.; Vekilov, P. G.Biophys. J. 2007, 92, 267−277.
Journal of the American Chemical Society Article
DOI: 10.1021/ja510533xJ. Am. Chem. Soc. 2015, 137, 1485−1491
1490
(12) Pan, W.; Vekilov, P. G.; Lubchenko, V. J. Phys. Chem. B 2010,114, 7620−30.(13) Chen, Q.; Vekilov, P. G.; Nagel, R. L.; Hirsch, R. E. Biophys. J.2004, 86, 1702−1712.(14) Liu, Y.; Wang, X.; Ching, C. B. Cryst. Growth Des. 2010, 10,548−558.(15) Hutchens, S. B.; Wang, Z.-G. J. Chem. Phys. 2007, 127, 084912.(16) Toth, G. I.; Pusztai, T.; Tegze, G.; Toth, G.; Granasy, L. Phys.Rev. Lett. 2011, 107, 175702.(17) Schilling, T.; Schope, H. J.; Oettel, M.; Opletal, G.; Snook, I.Phys. Rev. Lett. 2010, 105, 025701.(18) Wolde, P. R. t.; Frenkel, D. Science 1997, 277, 1975−1978.(19) Vekilov, P. G. Cryst. Growth Des. 2004, 4, 671−685.(20) Gunton, J.; Shiryayev, A.; Pagan, D. Protein Condensation: KineticPathways to Crystallization and Disease; Cambridge University Press:Cambridge, U.K., 2007.(21) Piazza, R. Curr. Opin. Colloid Interface Sci. 2000, 5, 38−43.(22) Anderson, V. J.; Lekkerkerker, H. N. W. Nature 2002, 416,811−815.(23) Ray, W. J.; Bracker, C. J. Cryst. Growth 1986, 76, 562−576.(24) Schope, H. J.; Bryant, G.; van Megen, W. Phys. Rev. Lett. 2006,96, 175701.(25) Zhang, T. H.; Liu, X. Y. J. Am. Chem. Soc. 2007, 129, 13520−13526.(26) Savage, J. R.; Dinsmore, A. D. Phys. Rev. Lett. 2009, 102, 198302.(27) Sleutel, M.; Van Driessche, A. E. S. Proc. Nat. Sci. USA 2014,111, E546−E553.(28) Malkin, A. J.; Kuznetsov, Y. G.; Land, T.; DeYoreo, J. J.;McPherson, A. Nat. Struct. Biol. 1995, 2, 956−959.(29) Kuznetsov, Y.; Malkin, A.; McPherson, A. Phys. Rev. B 1998, 58,6097−6103.(30) Mcpherson, A.; Malkin, A. J.; G, K. Y. Annu. Rev. Biophys.Biomol. Struct. 2000, 29, 361−410.(31) Van Driessche, A. E. S.; García-Ruiz, J. M.; Delgado-Lopez, J.M.; Sazaki, G. Cryst. Growth Des. 2010, 10, 3909−3916.(32) Zhang, F.; Skoda, M. W. A.; Jacobs, R. M. J.; Zorn, S.; Martin, R.A.; Martin, C. M.; Clark, G. F.; Weggler, S.; Hildebrandt, A.;Kohlbacher, O.; Schreiber, F. Phys. Rev. Lett. 2008, 101, 148101.(33) Zhang, F.; Weggler, S.; Ziller, M. J.; Ianeselli, L.; Heck, B. S.;Hildebrandt, A.; Kohlbacher, O.; Skoda, M. W. A.; Jacobs, R. M. J.;Schreiber, F. Proteins 2010, 78, 3450−3457.(34) Zhang, F.; Zocher, G.; Sauter, A.; Stehle, T.; Schreiber, F. J.Appl. Crystallogr. 2011, 44, 755−762.(35) Zhang, F.; Roth, R.; Wolf, M.; Roosen-Runge, F.; Skoda, M. W.A.; Jacobs, R. M. J.; Sztucki, M.; Schreiber, F. Soft Matter 2012, 8,1313−1316.(36) Sober, H. A. CRC Handbook of Biochemistry: Selected data formolecular biology; CRC: Boca Raton, FL, 1970.(37) Elofsson, U. M.; Paulsson, M. A.; Arnebrant, T. Langmuir 1997,13, 1695−1700.(38) Roosen-Runge, F.; Heck, B. S.; Zhang, F.; Kohlbacher, O.;Schreiber, F. J. Phys. Chem. B 2013, 117, 5777−5787.(39) Narayanan, T. Chapter Synchroton small-angle X-ray Scattering.In Soft Matter Characterization; Borsali, R., Pecora, R., Eds.; Springer:New York, 2008; p 899ff.(40) Schneider, C.; Rasband, W.; Eliceiri, K. Nat. Methods 2012, 9,671−675.(41) Glatter, O.; Kratky, O. Small angle X-ray scattering; AcademicPress: London, 1982.(42) Lindner, P.; Zemb, T. Neutrons, X-rays, and Light: ScatteringMethods Applied to Soft Condensed Matter; Elsevier: Amsterdam, TheNetherlands, 2002.(43) Strobl, G. The physics of polymers, 3rd ed.; Springer: Berlin,Germany, 2007; Chapter 5.(44) Zhang, F.; Roosen-Runge, F.; Sauter, A.; Roth, R.; Skoda, M. W.A.; Jacobs, R.; Sztucki, M.; Schreiber, F. Faraday Discuss. 2012, 159,313−325.
Journal of the American Chemical Society Article
DOI: 10.1021/ja510533xJ. Am. Chem. Soc. 2015, 137, 1485−1491
1491