REAL-TIME MUSIC VISUALIZATION USING …wfb/ammi/publications/C-2006-VR.pdfREAL-TIME MUSIC...
8
REAL-TIME MUSIC VISUALIZATION USING RESPONSIVE IMAGERY Robyn Taylor [email protected] Pierre Boulanger [email protected] Daniel Torres [email protected] Advanced Man-Machine Interface Laboratory, Department of Computing Science, University of Alberta T6G 2E8 Edmonton, Alberta. Canada ABSTRACT We present a music visualization system that allows musical feature data to be extracted in real-time from live performance and mapped to responsive imagery. We have created three example mappings between music and imagery, illustrating how music can be visualized through responsive video, virtual character behaviour, and interactive features inside an immersive virtual space. The system is implemented using a visual programming paradigm, enhancing its ease-of-use and making it suitable for use by collaborative teams containing both artists and scientists. 1. INTRODUCTION We have created a real-time system capable of visualizing live music using responsive imagery. A musician can interact with a virtual environment in a natural and intuitive way, using his or her voice as input to a visualization experience. In this paper, we will describe our system which allows us to visualize live musical performance using responsive imagery. We will present our musical feature data extraction routine and describe three examples of mappings between music and responsive imagery that have been created using our system. Example mappings include: • vocal timbre and piano chord data visualized through responsive video • melodic information visualized through the responses of a virtual character • vocal dynamics visualized through interactive aspects of an immersive virtual space Our music visualization system has been used to create an audio-visual performance piece (see Figure 1), and is currently being used to develop additional multimedia applications. It is designed to facilitate artist/scientist collaboration, thus visual programming platforms are used whenever possible to develop the audio-visual processing components. Section 2 of this paper discusses our motivation in creating a music visualization system, and Section 3 provides an overview of the system architecture. Section 4 explains our musical feature data extraction and organization routines, while Sections 5, 6, and 7 Figure 1 – A performer interacts with a responsive video visualization present examples of music visualization techniques that have been created using this system. 2. MOTIVATION New Media art often combines modern technologies with traditional art forms to create new platforms for artistic expression. Virtual and augmented reality technologies can be used to visualize live music for the purpose of creating an artistic experience. Examples of existing music visualization artworks include immersive installations that respond to vocal or instrumental input. Ox’s Color Organ [9] is one example of such an installation, allowing users to navigate virtual landscapes generated by assigning geometric and colour data to characteristics found within input musical streams. The Singing Tree created by Oliver et al. [8] allows users to immerse themselves in an environment containing both physical and virtual elements, inside which their vocalizations result in auditory and visual feedback. Virtual characters can be used to illustrate aspects of musical performance. Dancing Gregor (created by Singer et al. [11]) and Goto’s Cindy the Virtual Dancer [6] are examples of virtual characters that synchronize their movements to input provided by live musicians. Levin and Lieberman’s Messa di Voce [7] is a concert performance piece that generates glyphs in order to augment live performers' vocalizations.
Transcript of REAL-TIME MUSIC VISUALIZATION USING …wfb/ammi/publications/C-2006-VR.pdfREAL-TIME MUSIC...
REAL-TIME MUSIC VISUALIZATIONUSING RESPONSIVE IMAGERY
Robyn [email protected]
Pierre [email protected]
Daniel [email protected]
Advanced Man-Machine Interface Laboratory,Department of Computing Science, University of Alberta
T6G 2E8 Edmonton, Alberta. Canada
ABSTRACT
We present a music visualization system that allowsmusical feature data to be extracted in real-time fromlive performance and mapped to responsive imagery.We have created three example mappings betweenmusic and imagery, illustrating how music can bevisualized through responsive video, virtual characterbehaviour, and interactive features inside animmersive virtual space. The system is implementedusing a visual programming paradigm, enhancing itsease-of-use and making it suitable for use bycollaborative teams containing both artists andscientists.
1. INTRODUCTION
We have created a real-time system capable ofvisualizing live music using responsive imagery. Amusician can interact with a virtual environment in anatural and intuitive way, using his or her voice asinput to a visualization experience. In this paper, we will describe our system whichallows us to visualize live musical performance usingresponsive imagery. We will present our musicalfeature data extraction routine and describe threeexamples of mappings between music and responsiveimagery that have been created using our system.Example mappings include:
• vocal timbre and piano chord data visualizedthrough responsive video
• melodic information visualized through theresponses of a virtual character
• vocal dynamics visualized through interactiveaspects of an immersive virtual space
Our music visualization system has been used tocreate an audio-visual performance piece (see Figure1), and is currently being used to develop additionalmultimedia applications. It is designed to facilitateartist/scientist collaboration, thus visual programmingplatforms are used whenever possible to develop theaudio-visual processing components. Section 2 of this paper discusses our motivationin creating a music visualization system, and Section3 provides an overview of the system architecture.Section 4 explains our musical feature data extractionand organization routines, while Sections 5, 6, and 7
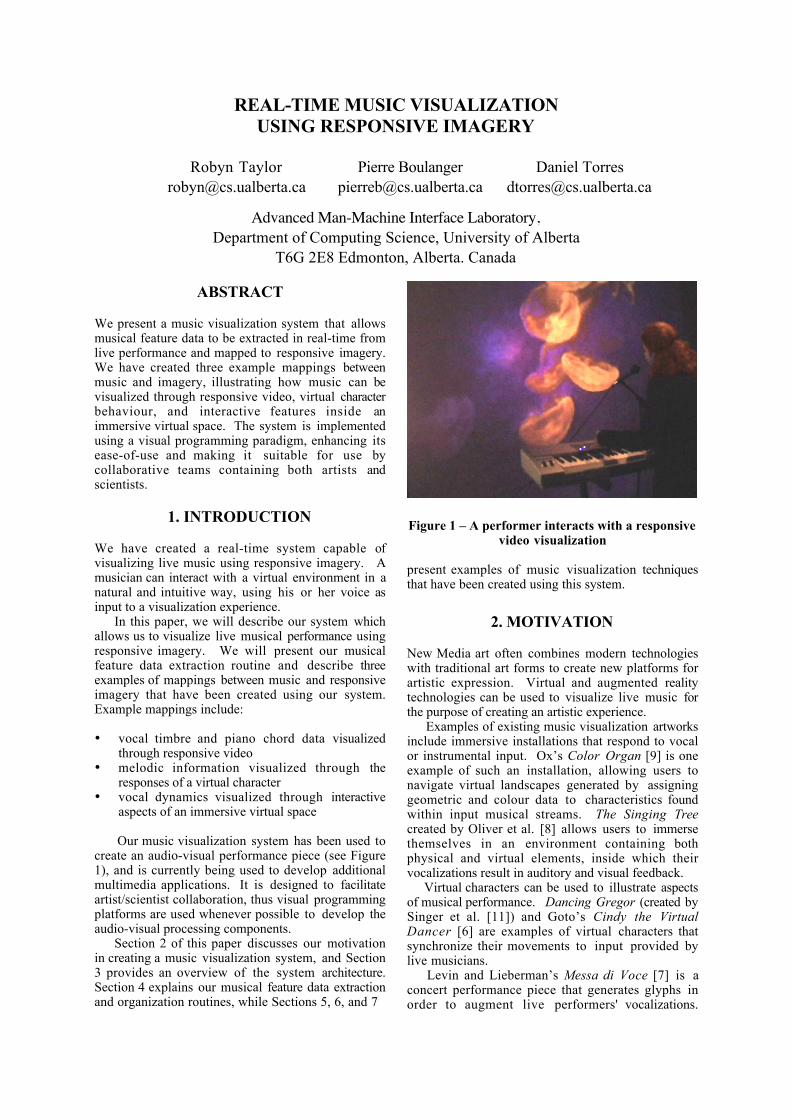
Figure 1 – A performer interacts with a responsivevideo visualization
present examples of music visualization techniquesthat have been created using this system.
2. MOTIVATION
New Media art often combines modern technologieswith traditional art forms to create new platforms forartistic expression. Virtual and augmented realitytechnologies can be used to visualize live music forthe purpose of creating an artistic experience. Examples of existing music visualization artworksinclude immersive installations that respond to vocalor instrumental input. Ox’s Color Organ [9] is oneexample of such an installation, allowing users tonavigate virtual landscapes generated by assigninggeometric and colour data to characteristics foundwithin input musical streams. The Singing Treecreated by Oliver et al. [8] allows users to immersethemselves in an environment containing bothphysical and virtual elements, inside which theirvocalizations result in auditory and visual feedback. Virtual characters can be used to illustrate aspectsof musical performance. Dancing Gregor (created bySinger et al. [11]) and Goto’s Cindy the VirtualDancer [6] are examples of virtual characters thatsynchronize their movements to input provided bylive musicians. Levin and Lieberman’s Messa di Voce [7] is aconcert performance piece that generates glyphs inorder to augment live performers' vocalizations.
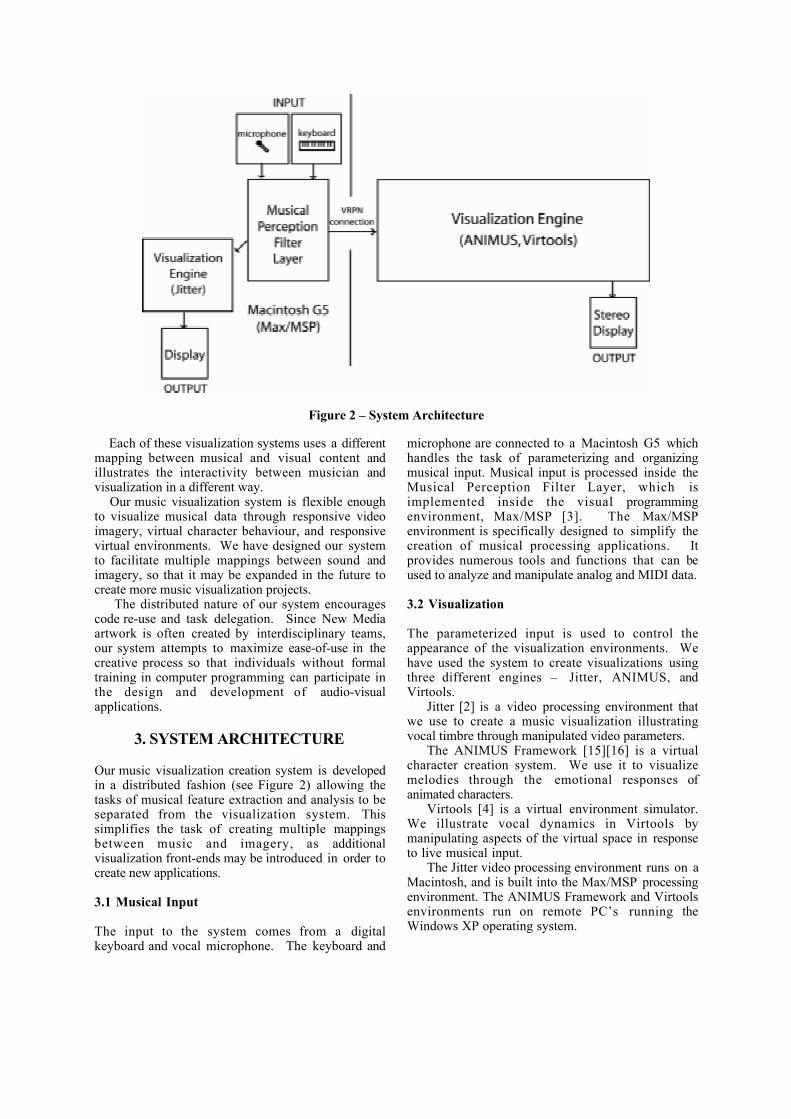
Figure 2 – System Architecture
Each of these visualization systems uses a differentmapping between musical and visual content andillustrates the interactivity between musician andvisualization in a different way. Our music visualization system is flexible enoughto visualize musical data through responsive videoimagery, virtual character behaviour, and responsivevirtual environments. We have designed our systemto facilitate multiple mappings between sound andimagery, so that it may be expanded in the future tocreate more music visualization projects. The distributed nature of our system encouragescode re-use and task delegation. Since New Mediaartwork is often created by interdisciplinary teams,our system attempts to maximize ease-of-use in thecreative process so that individuals without formaltraining in computer programming can participate inthe design and development of audio-visualapplications.
3. SYSTEM ARCHITECTURE
Our music visualization creation system is developedin a distributed fashion (see Figure 2) allowing thetasks of musical feature extraction and analysis to beseparated from the visualization system. Thissimplifies the task of creating multiple mappingsbetween music and imagery, as additionalvisualization front-ends may be introduced in order tocreate new applications.
3.1 Musical Input
The input to the system comes from a digitalkeyboard and vocal microphone. The keyboard and
microphone are connected to a Macintosh G5 whichhandles the task of parameterizing and organizingmusical input. Musical input is processed inside theMusical Perception Filter Layer, which isimplemented inside the visual programmingenvironment, Max/MSP [3]. The Max/MSPenvironment is specifically designed to simplify thecreation of musical processing applications. Itprovides numerous tools and functions that can beused to analyze and manipulate analog and MIDI data.
3.2 Visualization
The parameterized input is used to control theappearance of the visualization environments. Wehave used the system to create visualizations usingthree different engines – Jitter, ANIMUS, andVirtools. Jitter [2] is a video processing environment thatwe use to create a music visualization illustratingvocal timbre through manipulated video parameters. The ANIMUS Framework [15][16] is a virtualcharacter creation system. We use it to visualizemelodies through the emotional responses ofanimated characters. Virtools [4] is a virtual environment simulator.We illustrate vocal dynamics in Virtools bymanipulating aspects of the virtual space in responseto live musical input. The Jitter video processing environment runs on aMacintosh, and is built into the Max/MSP processingenvironment. The ANIMUS Framework and Virtoolsenvironments run on remote PC’s running theWindows XP operating system.
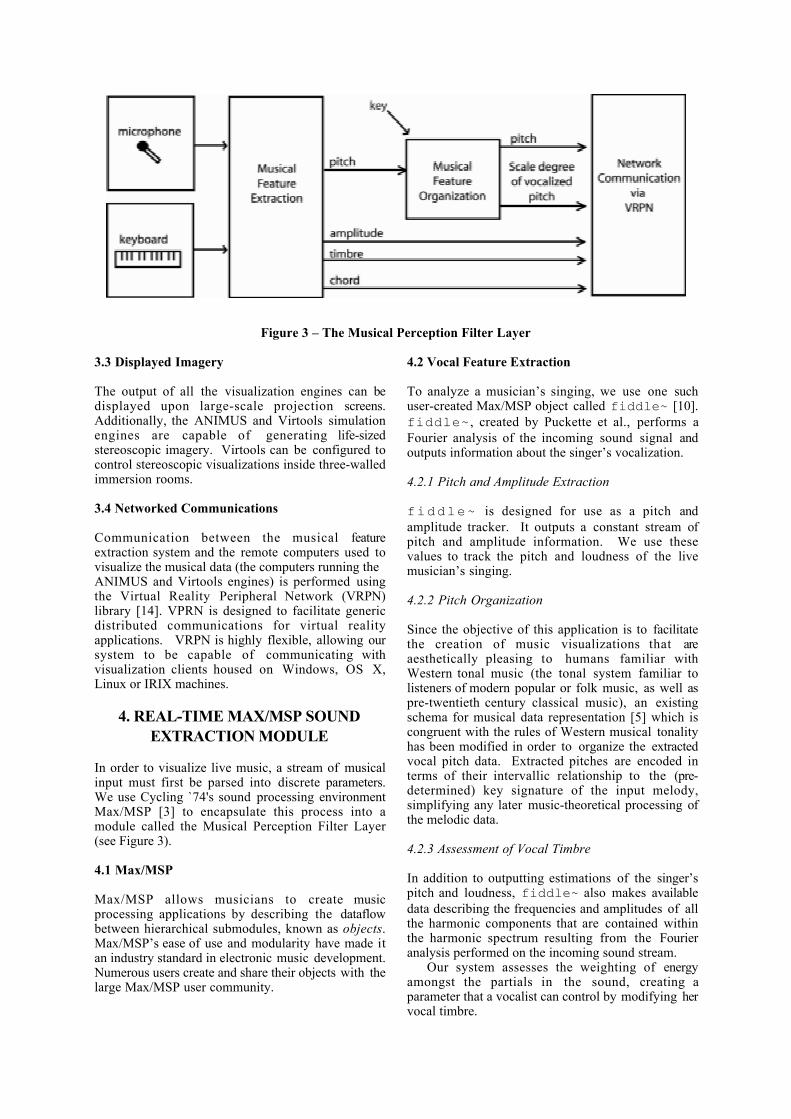
Figure 3 – The Musical Perception Filter Layer
3.3 Displayed Imagery
The output of all the visualization engines can bedisplayed upon large-scale projection screens.Additionally, the ANIMUS and Virtools simulationengines are capable of generating life-sizedstereoscopic imagery. Virtools can be configured tocontrol stereoscopic visualizations inside three-walledimmersion rooms.
3.4 Networked Communications
Communication between the musical featureextraction system and the remote computers used tovisualize the musical data (the computers running theANIMUS and Virtools engines) is performed usingthe Virtual Reality Peripheral Network (VRPN)library [14]. VPRN is designed to facilitate genericdistributed communications for virtual realityapplications. VRPN is highly flexible, allowing oursystem to be capable of communicating withvisualization clients housed on Windows, OS X,Linux or IRIX machines.
4. REAL-TIME MAX/MSP SOUNDEXTRACTION MODULE
In order to visualize live music, a stream of musicalinput must first be parsed into discrete parameters.We use Cycling `74's sound processing environmentMax/MSP [3] to encapsulate this process into amodule called the Musical Perception Filter Layer(see Figure 3).
4.1 Max/MSP
Max/MSP allows musicians to create musicprocessing applications by describing the dataflowbetween hierarchical submodules, known as objects.Max/MSP’s ease of use and modularity have made itan industry standard in electronic music development.Numerous users create and share their objects with thelarge Max/MSP user community.
4.2 Vocal Feature Extraction
To analyze a musician’s singing, we use one suchuser-created Max/MSP object called fiddle~ [10]. fiddle~ , created by Puckette et al., performs aFourier analysis of the incoming sound signal andoutputs information about the singer’s vocalization.
4.2.1 Pitch and Amplitude Extraction
fiddle~ is designed for use as a pitch andamplitude tracker. It outputs a constant stream ofpitch and amplitude information. We use thesevalues to track the pitch and loudness of the livemusician’s singing.
4.2.2 Pitch Organization
Since the objective of this application is to facilitatethe creation of music visualizations that areaesthetically pleasing to humans familiar withWestern tonal music (the tonal system familiar tolisteners of modern popular or folk music, as well aspre-twentieth century classical music), an existingschema for musical data representation [5] which iscongruent with the rules of Western musical tonalityhas been modified in order to organize the extractedvocal pitch data. Extracted pitches are encoded interms of their intervallic relationship to the (pre-determined) key signature of the input melody,simplifying any later music-theoretical processing ofthe melodic data.
4.2.3 Assessment of Vocal Timbre
In addition to outputting estimations of the singer’spitch and loudness, fiddle~ also makes availabledata describing the frequencies and amplitudes of allthe harmonic components that are contained withinthe harmonic spectrum resulting from the Fourieranalysis performed on the incoming sound stream. Our system assesses the weighting of energyamongst the partials in the sound, creating aparameter that a vocalist can control by modifying hervocal timbre.
Vocal timbre refers to the characteristics of avocalized sound that make it recognizably differentfrom other vocalizations uttered at the same pitch andloudness. A voice’s timbral character is determinedby the way energy is distributed amongst the partialfrequencies in the sound. Literally meaning tonecolour, a vocalist’s timbre is what is being addressedwhen a voice is described using terms such as dark,bright, rich, or strident. Our system creates a description of the singer’svocal timbre by examining the harmonic spectrumoutput by the fiddle~ object. Vowel choices areroughly identified by comparing the reportedamplitude at each harmonic in the vocalized spectrumto known data characterizing vowel formation.
4.4 Piano Chord Identification
In addition to interpreting analogue vocal data, MIDIdata from the digital piano keyboard is also assessed.A sub-module of the Musical Perception Filter Layeris used to monitor MIDI events and identify thechords played on the digital piano by comparing themto a list of “known” major and minor chords. Anyinversion of the chords is recognized, and this modulecould easily be expanded to incorporate other types ofchord data.
4.5 Broadcasting the Musical Feature Data
After the musical feature data (vocal pitch, amplitude,and timbral information as well as keyboard chorddata) has been identified and extracted, it is thentransmitted to the visualization engines to berepresented through responsive imagery. As describedin Section 3.3, this task is facilitated by the use ofthe VRPN library [14]. We have created a Max/MSP object encapsulatingthe VRPN technology required to run a server on theMacintosh system. This object, vrpnserver,broadcasts the extracted musical feature data so thatour visualization engines may receive informationabout the musical performance.
5. VISUALIZATION THROUGHRESPONSIVE VIDEO IMAGERY
Our first visualization environment allows a musicianto interact with a responsive video visualization bymanipulating her vocal timbre and playing chords ona digital piano. By mapping responsive video parameters to aspectsof the musician’s live performance, we used ourmusic visualization system to create a multimedia
piece called Deep Surrender that has been performedlive in concert. The piece was created using Cycling `74’s videoprocessing engine, Jitter [2] to manipulate theresponsive video space.
5.1 Jitter
Jitter is an add-on to the Max/MSP system. As such,its visually programmed interface is consistent withthat of Max/MSP, and Jitter operations are executedinside of the Max/MSP processing loop. Jitter’sextensive library of image processing functions allowsusers to perform matrix-based image manipulationoperations on still images and video files. We makeuse of two such Jitter functions, thej i t . s c a l e b i a s and jit.chromakeyoperations in order to create the effects seen in theDeep Surrender performance (see Figure 4.)
5.2 Visualizing Piano Chords
In the production, chords played on the pianokeyboard affect the colour balance of the videoimagery. To map piano chords to colours, we use a strategysimilar to the one used by Jack Ox in her ColorOrgan installation [9]. A music theoretical structure,the Circle of Fifths, is mapped to a standard colourwheel, associating a colour value with each chord. The Circle of Fifths relates chords to one anotherin terms of their harmonic similarities. Chords thatare closer to one another on the Circle are moresimilar to one another than chords that are locatedfurther away. Mapping a colour wheel to the Circleof Fifths makes chords that are musically similarappear similar in colour. Jitter’s jit.scalebias operation adjusts thecolour balance of a displayed video, using matrixmultiplication to scale the hue of the moving images. In the Deep Surrender performance, the liveperformer manipulates the colour balance of the videoplayback by playing different chords on the keyboard.
5.3 Visualizing Vocal Timbre
The vocalist’s singing also affects the visualenvironment. Image layering is used to allow thesinger’s vocalization to introduce coloured imagesinto the video stream. The jit.chromakey operation is used tosuperimpose images into the displayed video scenes.Chroma-keying (also known as blue- or green-screening) is commonly used in film and videoproductions. The process allows elements from onevideo to be layered into a second video, creating a
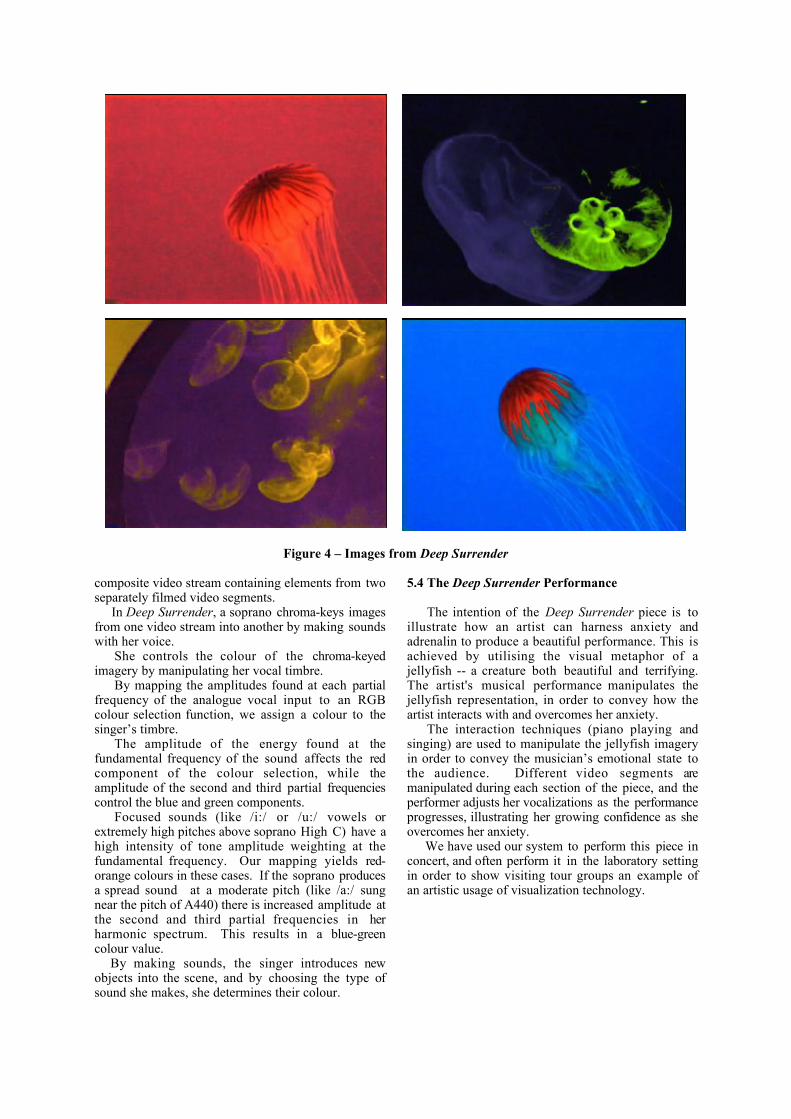
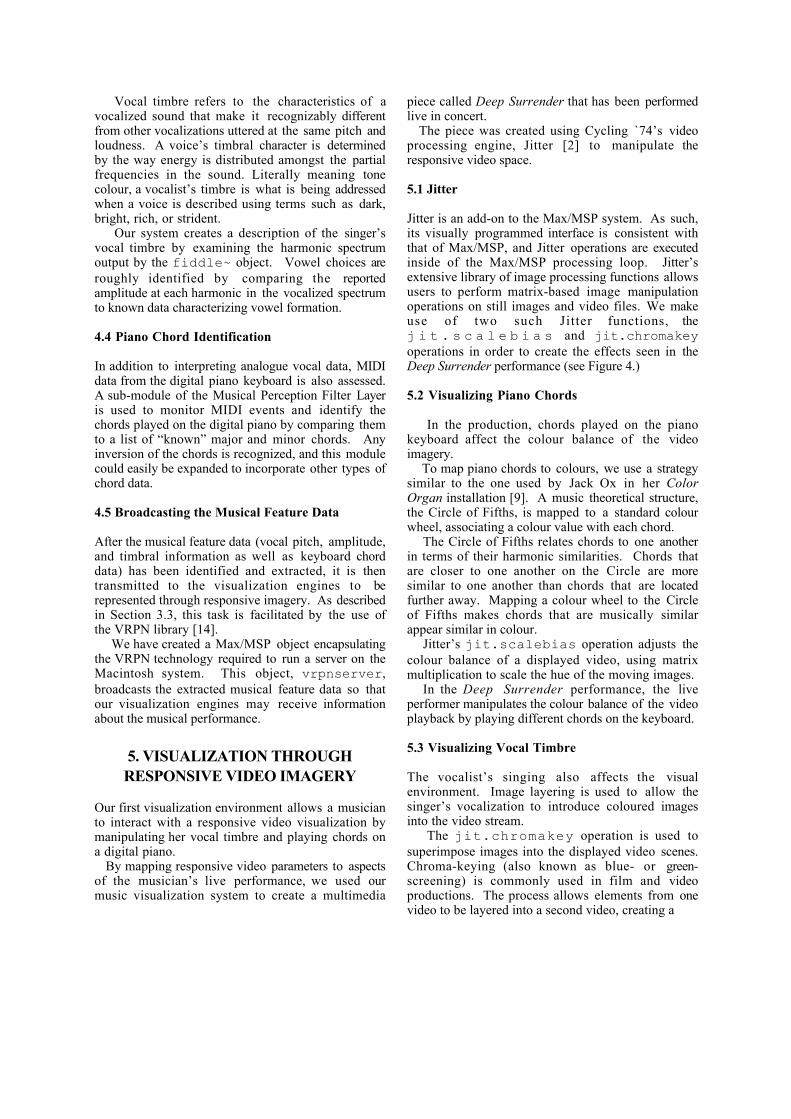
Figure 4 – Images from Deep Surrender
composite video stream containing elements from twoseparately filmed video segments. In Deep Surrender, a soprano chroma-keys imagesfrom one video stream into another by making soundswith her voice. She controls the colour of the chroma-keyedimagery by manipulating her vocal timbre. By mapping the amplitudes found at each partialfrequency of the analogue vocal input to an RGBcolour selection function, we assign a colour to thesinger’s timbre. The amplitude of the energy found at thefundamental frequency of the sound affects the redcomponent of the colour selection, while theamplitude of the second and third partial frequenciescontrol the blue and green components. Focused sounds (like /i:/ or /u:/ vowels orextremely high pitches above soprano High C) have ahigh intensity of tone amplitude weighting at thefundamental frequency. Our mapping yields red-orange colours in these cases. If the soprano producesa spread sound at a moderate pitch (like /a:/ sungnear the pitch of A440) there is increased amplitude atthe second and third partial frequencies in herharmonic spectrum. This results in a blue-greencolour value. By making sounds, the singer introduces newobjects into the scene, and by choosing the type ofsound she makes, she determines their colour.
5.4 The Deep Surrender Performance
The intention of the Deep Surrender piece is toillustrate how an artist can harness anxiety andadrenalin to produce a beautiful performance. This isachieved by utilising the visual metaphor of ajellyfish -- a creature both beautiful and terrifying.The artist's musical performance manipulates thejellyfish representation, in order to convey how theartist interacts with and overcomes her anxiety. The interaction techniques (piano playing andsinging) are used to manipulate the jellyfish imageryin order to convey the musician’s emotional state tothe audience. Different video segments aremanipulated during each section of the piece, and theperformer adjusts her vocalizations as the performanceprogresses, illustrating her growing confidence as sheovercomes her anxiety. We have used our system to perform this piece inconcert, and often perform it in the laboratory settingin order to show visiting tour groups an example ofan artistic usage of visualization technology.
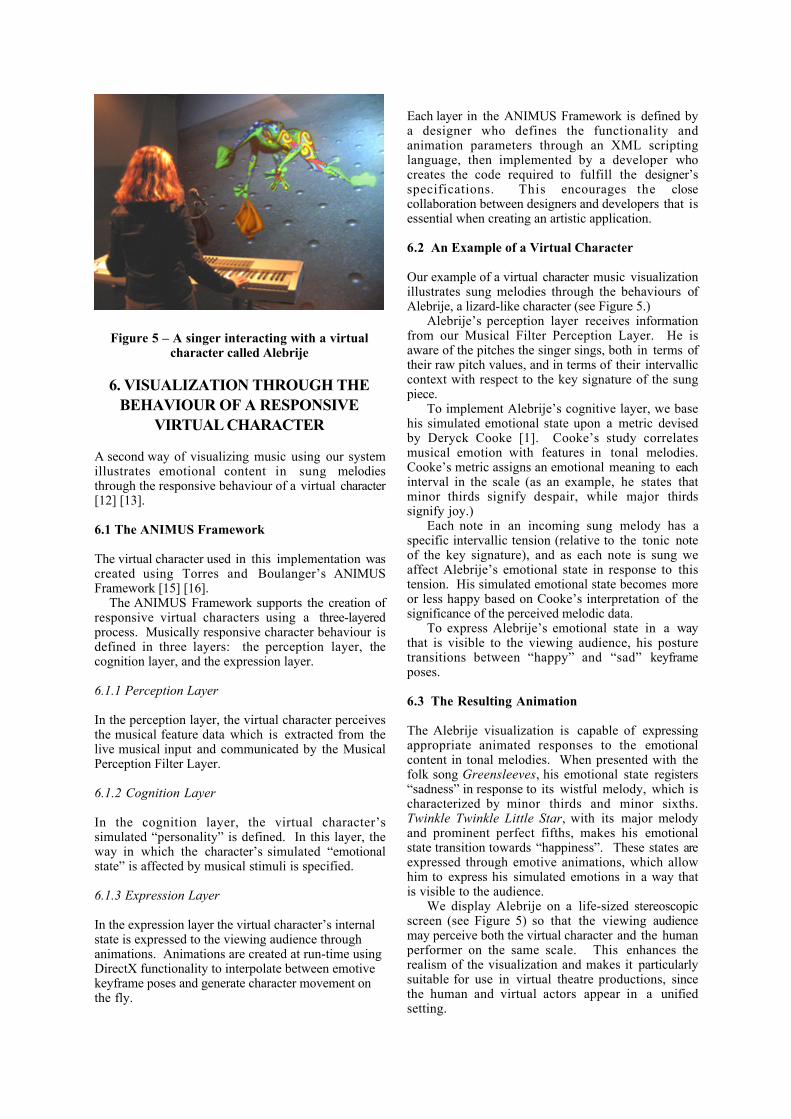
Figure 5 – A singer interacting with a virtualcharacter called Alebrije
6. VISUALIZATION THROUGH THEBEHAVIOUR OF A RESPONSIVE
VIRTUAL CHARACTER
A second way of visualizing music using our systemillustrates emotional content in sung melodiesthrough the responsive behaviour of a virtual character[12] [13].
6.1 The ANIMUS Framework
The virtual character used in this implementation wascreated using Torres and Boulanger’s ANIMUSFramework [15] [16]. The ANIMUS Framework supports the creation ofresponsive virtual characters using a three-layeredprocess. Musically responsive character behaviour isdefined in three layers: the perception layer, thecognition layer, and the expression layer.
6.1.1 Perception Layer
In the perception layer, the virtual character perceivesthe musical feature data which is extracted from thelive musical input and communicated by the MusicalPerception Filter Layer.
6.1.2 Cognition Layer
In the cognition layer, the virtual character’ssimulated “personality” is defined. In this layer, theway in which the character’s simulated “emotionalstate” is affected by musical stimuli is specified.
6.1.3 Expression Layer
In the expression layer the virtual character’s internalstate is expressed to the viewing audience throughanimations. Animations are created at run-time usingDirectX functionality to interpolate between emotivekeyframe poses and generate character movement onthe fly.
Each layer in the ANIMUS Framework is defined bya designer who defines the functionality andanimation parameters through an XML scriptinglanguage, then implemented by a developer whocreates the code required to fulfill the designer’sspecifications. This encourages the closecollaboration between designers and developers that isessential when creating an artistic application.
6.2 An Example of a Virtual Character
Our example of a virtual character music visualizationillustrates sung melodies through the behaviours ofAlebrije, a lizard-like character (see Figure 5.) Alebrije’s perception layer receives informationfrom our Musical Filter Perception Layer. He isaware of the pitches the singer sings, both in terms oftheir raw pitch values, and in terms of their intervalliccontext with respect to the key signature of the sungpiece. To implement Alebrije’s cognitive layer, we basehis simulated emotional state upon a metric devisedby Deryck Cooke [1]. Cooke’s study correlatesmusical emotion with features in tonal melodies.Cooke’s metric assigns an emotional meaning to eachinterval in the scale (as an example, he states thatminor thirds signify despair, while major thirdssignify joy.) Each note in an incoming sung melody has aspecific intervallic tension (relative to the tonic noteof the key signature), and as each note is sung weaffect Alebrije’s emotional state in response to thistension. His simulated emotional state becomes moreor less happy based on Cooke’s interpretation of thesignificance of the perceived melodic data. To express Alebrije’s emotional state in a waythat is visible to the viewing audience, his posturetransitions between “happy” and “sad” keyframeposes.
6.3 The Resulting Animation
The Alebrije visualization is capable of expressingappropriate animated responses to the emotionalcontent in tonal melodies. When presented with thefolk song Greensleeves, his emotional state registers“sadness” in response to its wistful melody, which ischaracterized by minor thirds and minor sixths.Twinkle Twinkle Little Star, with its major melodyand prominent perfect fifths, makes his emotionalstate transition towards “happiness”. These states areexpressed through emotive animations, which allowhim to express his simulated emotions in a way thatis visible to the audience. We display Alebrije on a life-sized stereoscopicscreen (see Figure 5) so that the viewing audiencemay perceive both the virtual character and the humanperformer on the same scale. This enhances therealism of the visualization and makes it particularlysuitable for use in virtual theatre productions, sincethe human and virtual actors appear in a unifiedsetting.
We intend to develop this simulation further inorder to create musically responsive virtual characterswith greater expressive capabilities. We are currentlyworking with a media artist who is creating a 3Dcharacter with a wide library of emotive poses so thatwe may develop a compelling artistic performanceincorporating the musically responsive virtualcharacters.
7. VISUALIZATION INSIDE A VIRTUALSPACE
The third method we have implemented to visualizemusic using our system uses the Virtoolsdevelopment environment to create immersive virtualspaces that are responsive to musical input.
7.1 Virtools
The Virtools’ authoring application [4] is a visualprogramming environment which allows designers ofvirtual reality applications to create immersivevisualizations by defining Virtools Behaviours anddescribing how they affect the properties of objects inthe virtual environment. Connecting our Musical Perception Filter Layer’smusical control system with Virtools’ intuitiveauthoring environment allows us to rapidly developmusic visualization applications. Using Virtools'visual programming environment to createvisualizations allows different musical imagingstrategies to be quickly and easily defined, tested, andmodified. The connection between Max/MSP's musicprocessing environment and Virtools' virtual realitysimulator allows both the musical and visual aspectsof immersive music visualization projects to beimplemented using specialized developmentenvironments that expedite the process of audio-visualapplication development.
7.2 Immersive Spaces
The Virtools simulator is capable of retargeting ourmusic visualizations so that they may be displayedinside life-sized immersion rooms. Immersion roomsare CAVE-like three-walled structures comprised oflarge stereoscopic display screens. When a virtualenvironment is displayed in an immersion room, theimmersed users experience a realistic and believablesense of actually being inside the virtual space.
7.3 Musical Control of the Virtual Environment
We interact with the Virtools simulator by connectingthe Musical Perception Filter Layer to the Virtoolsevent loop. We have built a Virtools building blockthat connects to our musical feature data server. Our building block, called MusicController,receives information about the performer’s pitch,loudness, and timbre, as well as information about
any chords that are played on the digital piano. Thesemusical features can then be used to control aspects ofthe Virtools simulation. We have created a responsive environment insideVirtools that allows a user to modify aspects of thevirtual space using his or her voice. To illustrate the singer’s vocal dynamics, cloudsof particle fog are generated in response to singing.The colour of the clouds is controlled by the pitch theuser sings (higher pitches are visualized with red-orange colours while lower pitches are visualized withblue-green colours) and the size of the cloudsincreases as the singer’s loudness increases (see Figure6.) The particle cloud is a particularly responsiveform of visual feedback, as the fog is evocative of thebreath the user uses to create a vocalized sound.
Figure 6 – Vocalization visualized with fog
The Virtools visualization environment is particularlyuser-friendly, as its visually programmed authoringenvironment provides users with a large library of pre-built functionality. The particle fog visual metaphorwas created using Virtools’ built-in particle cloudsimulation routines. Enhancements to the responsive virtual room arecurrently being developed, so that visitors to ourlaboratory may experiment with the musical inputmechanism and experience visual feedback in theimmersive virtual space.
8. CONCLUSIONS
This system is designed to facilitate the creation ofartistic applications that use musical control tointeract with responsive virtual environments. We have created this system in a way that makesthe process of artist/scientist collaboration as easy aspossible.
For this reason, we chose to use visualprogramming to develop system componentswhenever possible. Max/MSP, Jitter, and Virtoolsuse visual techniques to describe the flow of datawithin an application, allowing those without trainingin traditional computer programming to participate inthe development process with greater ease. While the ANIMUS Framework requiresdevelopers to create their applications usingtraditional coding methods, its character-creationprocesses encourage task delegation, making extensiveuse of scripting languages to allow non-technical teammembers to participate in the design process ofresponsive animation applications. We have used our system to develop three musicvisualization applications. One of these applications(the responsive video visualization) has been used tocreate an audio-visual work that has been performed ina live concert setting. The other applications (thevirtual characters and the responsive room) arecurrently being used to develop additionalperformance pieces and installations. Modern visualization technologies can be used toproduce compelling imagery and responsiveinteraction. We look forward to using this system tocontinue our development of New Media artworkfacilitated by computer science research.
ACKNOWLEDGEMENTS
The use of the VRPN library was made possible bythe NIH National Research Resource in MolecularGraphics and Microscopy at the University of NorthCarolina at Chapel Hill, supported by the NIHNational Center for Research Resources and the NIHNational Institute of Biomedical Imaging andBioengineering. The source video footage for the Deep Surrendervideo production was filmed by Melanie Gall. The textures on the models used in the Virtoolssimulation are from http://www.ktn3d.com/.
REFERENCES
[1] Deryck Cooke. The Language of Music. NewYork: Oxford University Press, 1959.[2] Cycling '74. Jitter, 2004.[3] Cycling '74. Max/MSP, 2004.[4] Dassault Systémes. Virtools, 2005.[5] Diana Deutsch and J. Feroe. The internalrepresentation of pitch sequences in tonal music.Psychological Review, 88:503-522, 1981.[6] Masataka Goto and Yoichi Muraoka. Interactive
Performance of a Music-Controlled CG Dancer.http://staff.aist.go.jp/m.goto/PROJ/ip-j.html.[7] Golan Levin and Zachary Lieberman. In-situspeech visualization in real-time interactiveinstallation and performance. In Proceedings of The3rd International Symposium on Non-PhotorealisticAnimation and Rendering, pages 7-14. ACM Press,2004.[8] William Oliver, John Yu, and Eric Metois. TheSinging Tree: design of an interactive musicalinterface. In DIS '97: Proceedings of the conferenceon Designing interactive systems: processes,practices, methods, and techniques, pages 261-264.ACM Press, 1997.[9] Jack Ox. 2 performances in the 21st CenturyVirtual Color Organ. In Proceedings of the fourthconference on Creativity & Cognition, pages 20-24.ACM Press, 2002.[10] M. Puckette, T. Apel, and D. Zicarelli. Real-time audio analysis tools for Pd and MSP. InProceedings of the International Computer MusicConference, pages 109-112. International ComputerMusic Association, 1998.[11] Eric Singer, Athomas Goldberg, Ken Perlin,Clilly Castiglia, and Sabrina Liao. Improv:Interactive improvisational animation and music. InProceedings of the International Society for theElectronic Arts (ISEA) Annual Conference, 1996.[12] Robyn Taylor, Pierre Boulanger and DanielTorres. Visualizing emotion in musical performanceusing a virtual character. In Proceedings of the FifthInternational Symposium On Smart Graphics, pages13-24. Springer LNCS, 2005.[13] Robyn Taylor, Daniel Torres and PierreBoulanger. Using music to interact with a virtualcharacter. In Proceedings of the InternationalConference on New Interfaces for MusicalExpression, pages 220-223, 2005.[14] Russell M. Taylor II, Thomas C. Hudson, AdamSeeger, Hans Weber, Jeffrey Juliano, and Aron T.Helser. VRPN: A device-independent, networktransparent VR peripheral system. In Proceedings ofthe ACM symposium on Virtual reality software andtechnology, pages 55-61. ACM Press, 2001. [15] D. Torres and P. Boulanger. The ANIMUSProject: a framework for the creation of interactivecreatures in immersed environments. In Proceedingsof the ACM symposium on Virtual reality softwareand technology, pages 91-99. ACM Press, 2003.[16] D. Torres and P. Boulanger. A perception andselective attention system for synthetic creatures. InProceedings of the Third International SymposiumOn Smart Graphics, pages 141-150, 2003.
![Warhammer Armies - Kislev [Citadel Journal]- 4th Edition - WFB](https://static.fdocuments.us/doc/165x107/563db822550346aa9a90d6a6/warhammer-armies-kislev-citadel-journal-4th-edition-wfb.jpg)
![WFB [Faq] Lizardman 2009](https://static.fdocuments.us/doc/165x107/577d2fb51a28ab4e1eb26ed8/wfb-faq-lizardman-2009.jpg)