Real-time ionosphere monitoring by three … GNSS+2016, Portland, 13-16 September 2016 Real-time...
26
ION GNSS+2016, Portland, 13-16 September 2016 Real-time ionosphere monitoring by three-dimensional tomography over Japan 1* Susumu Saito, 2,† Shota Suzuki, 2 Mamoru Yamamoto, 3 Chia-Hun Chen, and 4 Akinori Saito 1 Electronic Navigation Research Institute, Japan 2 Research Institute of Sustainable Humanosphere, Kyoto University, Japan 3 National Cheng Kung University, Taiwan 4 Department of Science, Kyoto University, Japan † Now at SQUARE ENIX Co. Ltd.
Transcript of Real-time ionosphere monitoring by three … GNSS+2016, Portland, 13-16 September 2016 Real-time...

ION GNSS+2016, Portland, 13-16 September 2016
Real-time ionosphere monitoring
by three-dimensional tomography
over Japan 1*Susumu Saito, 2,†Shota Suzuki, 2Mamoru
Yamamoto, 3Chia-Hun Chen, and 4Akinori Saito 1Electronic Navigation Research Institute, Japan
2Research Institute of Sustainable Humanosphere, Kyoto
University, Japan 3National Cheng Kung University, Taiwan
4Department of Science, Kyoto University, Japan
†Now at SQUARE ENIX Co. Ltd.

ION GNSS+2016, Portland, 13-16 September 2016
Ionospheric density profile measurements
3-D ionospheric density profiles are very useful for radio
applications (such as communications or GNSS
augmentation) as well as ionospheric sciences.
Ionosonde:
Classic simple device
Bottomside profiles only
GNSS radio occultation:
Globally observable
Smoothed in a wide
horizontal area
Incoherent scatter radar:
Very powerful, various
parameters can be derived.
Extremely expensive
[Haji and Romans, 1997]

ION GNSS+2016, Portland, 13-16 September 2016
GNSS tomography
GNSS tomography is a powerful technique to reconstruct 3-
D ionospheric density profiles from total electron content
(TEC)measurements.
Many TEC measurements
3-D density profile
reconstruct
Objectives: Make 3-D ionospheric density profiles available
by tomography in real-time

ION GNSS+2016, Portland, 13-16 September 2016
Real-time ionosphere monitoring
ENRI has developed a real-time 2-D ionospheric disturbance
monitoring system using real-time data from 200 selected
GEONET stations. [Saito et al., ION ITM 2014]
- can be expanded to a real-time 3-D ionospheric tomography
system
Real-time GNSS measurements from 200
selected GEONET stations Real-time 2-D ionosphere disturbance monitoring
[Saito et al., ION ITM 2014]

ION GNSS+2016, Portland, 13-16 September 2016
3-D tomography
Constraint Parameter
Alt
itu
de
[k
m]
100
800
0 0.0001
Loose constraint
Tight constraint
Tight constraint
Constraint parameter depends on locations
(calculated based on NeQuick model)
ni
li
TEC vector
Geometry
Matrix
Electron density
vector
Cost function
Constrained least-square solution
Constraint term
Least-square term Constraint term
Hyper parameter
TEC of i-th
satellite

ION GNSS+2016, Portland, 13-16 September 2016
Tomographic reconstruction volume

ION GNSS+2016, Portland, 13-16 September 2016
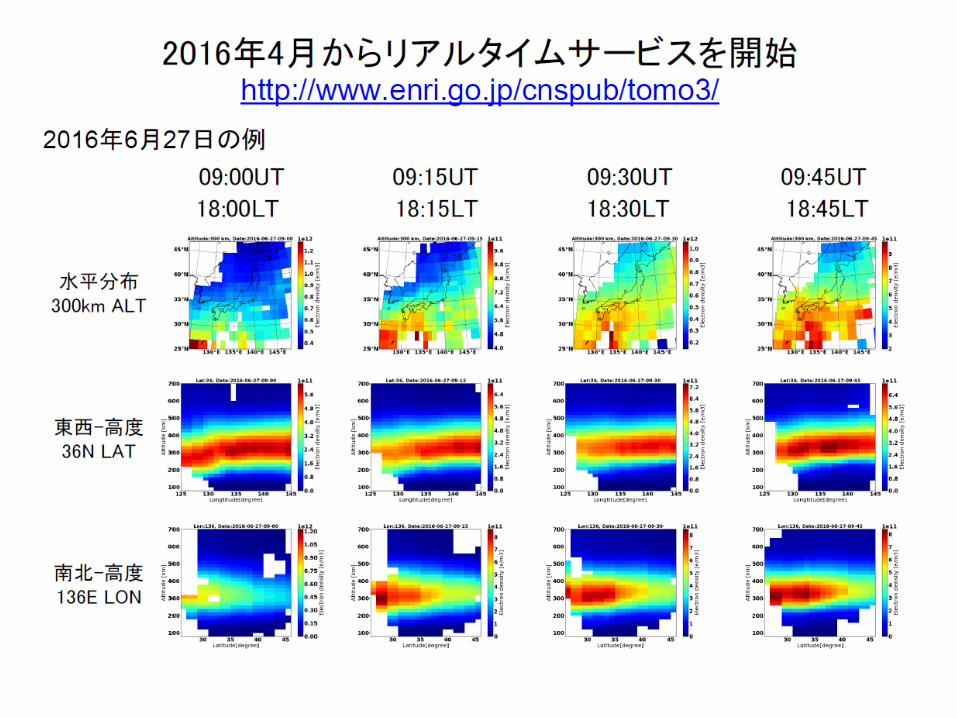
Realtime tomography results
(a) Meridional cross-section (136ºE) (b) Latitudinal cross-section (35ºN)
(c) Horizontal distribution (Altitude: 350 km) (d) Vertical profile (35ºN, 136ºE)

ION GNSS+2016, Portland, 13-16 September 2016
Validation Ionosonde
- Vertical HF sounder
- Peak density can be precisely
determined.
- Bottom-side profile can be
reconstructed.
0.196 0
0
200
400
600
800
Electron density/1012 [m-3]
Alt
itu
de
[k
m]
Plasma frequency [MHz]
12.7 0 4 8 12
0.790 1.78
Ionogram
Ogimi
Yamagawa
Kokubunji
NICT ionosonde stations

ION GNSS+2016, Portland, 13-16 September 2016
Wakkanai Kokubunji
Yamagawa Okinawa
Validation results

ION GNSS+2016, Portland, 13-16 September 2016
Real-time web interface
http://www.enri.go.jp/cnspub/tomo3/plotting.html
Preliminary real-time web interface
- On-demand plotting of zonal, meridional, and horizontal
cross sections and vertical profile

ION GNSS+2016, Portland, 13-16 September 2016
Potential use of tomography
Ionospheric science
- 3-D structure of traveling ionospheric disturbances (TIDs)
- Ionospheric climatology with tomography of archived
GEONET data
Engineering application
- Better ionospheric correction for single-frequency GNSS
- HF radio wave propagation prediction

ION GNSS+2016, Portland, 13-16 September 2016
Summary
Real-time 3-D ionospheric tomography system over Japan
has been developed.
- Every 15min with about 10min latency
Tomography results are validated with independent
measurements
- In good agreement
- More validation works planned
Scientific and engineering applications are provisioned.
Acknowledgment: This work is supported by JSPS Grant-in-Aid for Challenging Exploratory Research JP26630182.

A new ionospheric storm scale (I-scale)
TEC monitoring system in NICT [http://seg-web.nict.go.jp/GPS/FC_GEONET/LAT-TEC/]
“A new ionospheric storm scale based on TEC and foF2 statistics”, M. Nishioka, T. Tsugawa, H. Jin and M. Ishii, accepted to Space Weather

Motivation
Ionospheric storms have no clear definition.
Ionospheric parameters largely depend on local time, season, and latitude.
It is necessary to investigate the ionospheric parameters statistically in order to define an universal ionospheric scale.
TEC in the Japanese sector during the St Patrick’s day storm Observation median of 27 days
Positive storm Negative storm

Percentage deviation of TEC from the reference, PTEC, is used to describe ionospheric state.
PTEC=
15-minute TEC for 18 years from 1997 to 2014 (TECobs).
Data set and methodology 【Data Set】
【Methodology】
The reference value, TECref is defined as a median of TECobs at the same local time and latitude in the past 27 days.
Since distributions of PTEC are different among different seasons, local-times, and latitudes, PTEC is normalized by σ. The normalized PTEC is used to determine an I-scale. It is defined by setting thresholds to the normalized numbers to seven categories:
TECobs-TECref
TECref
Distribution of PTEC
(29oN, Feb-Apr, 20JST)
90 (days) x 18 (years) ~1600 samples
I0: Quiet state IP1, IP2, IP3: moderate, strong, severe positive storms IN1, IN2, IN3: moderate, strong, and severe negative storms
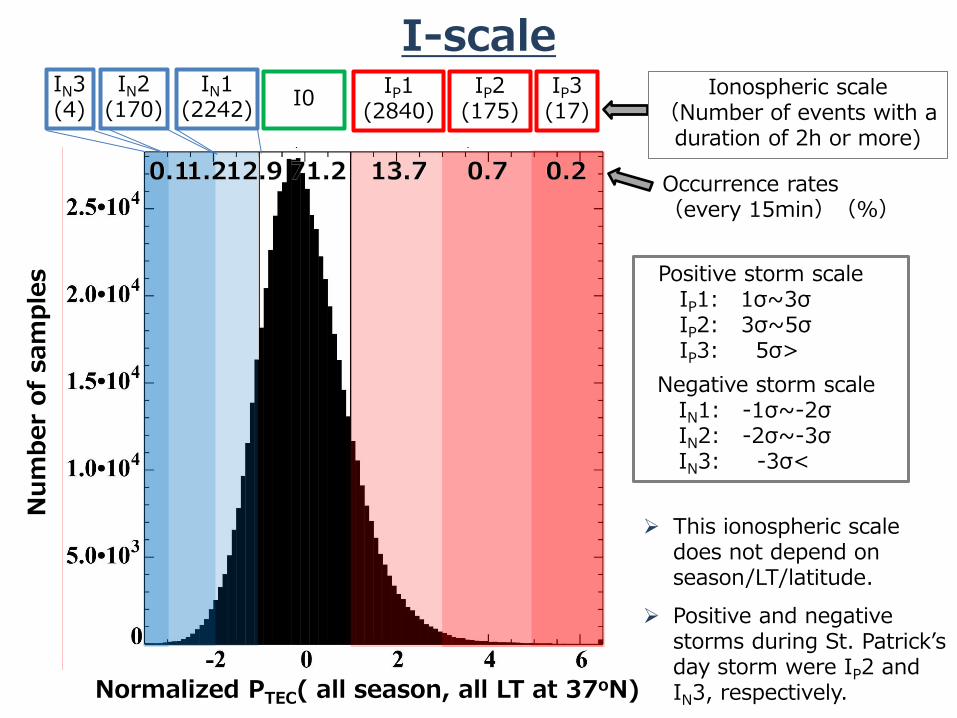
I-scale
Normalized PTEC( all season, all LT at 37oN)
Nu
mb
er
of
sam
ple
s
Positive storm scale IP1: 1σ~3σ IP2: 3σ~5σ IP3: 5σ>
Negative storm scale IN1: -1σ~-2σ IN2: -2σ~-3σ IN3: -3σ<
IN1 (2242)
IN2 (170)
IN3 (4)
IP1 (2840)
IP2 (175)
IP3 (17)
Occurrence rates (every 15min)(%)
Ionospheric scale (Number of events with a
duration of 2h or more)
This ionospheric scale does not depend on season/LT/latitude.
Positive and negative storms during St. Patrick’s day storm were IP2 and IN3, respectively.
I0