
REAL-TIME HYBRID MODEL TESTING OF A BRACELESS SEMI ...
12
Proceedings of the ASME 2016 35th International Conference on Ocean, Offshore and Arctic Engineering OMAE2016 June 19 - 24, 2016, Busan, Korea OMAE2016-54437 REAL-TIME HYBRID MODEL TESTING OF A BRACELESS SEMI-SUBMERSIBLE WIND TURBINE. PART II: EXPERIMENTAL RESULTS Erin E. Bachynski MARINTEK 7450 Trondheim, Norway Maxime Thys * MARINTEK 7450 Trondheim, Norway Thomas Sauder MARINTEK 7450 Trondheim, Norway NTNU AMOS / IMT 7491 Trondheim, Norway Valentin Chabaud NTNU / IMT 7491 Trondheim, Norway Lars Ove Sæther MARINTEK 7450 Trondheim, Norway ABSTRACT Real-Time Hybrid Model (ReaTHM) tests of a braceless semi-submersible wind turbine were carried out at MARIN- TEK’s Ocean Basin in 2015. The tests sought to evaluate the performance of the floating wind turbine (FWT) structure in en- vironmental conditions representative of the Northern North Sea. In order to do so, the tests employed a new hybrid testing method, wherein simulated aerodynamic loads were applied to the phys- ical structure in the laboratory. The test method was found to work well, and is documented in [1]. The present work describes some of the experimental re- sults. The test results showed a high level of repeatability, and permitted accurate investigation of the coupled responses of a FWT, including unique conditions such as blade pitch faults. For example, the influence of the wind turbine controller can be seen in decay tests in pitch and surge. In regular waves, aero- dynamic loads due to constant wind had little influence on the structure motions (except for the mean offsets). Tests in irregu- lar waves with and without turbulent wind are compared directly, and the influence of the wave-frequency motions on the aerody- namic damping of wind-induced low-frequency motions can be observed. * Corresponding author: [email protected] INTRODUCTION Floating wind turbines (FWTs) are an emerging technology which can be used to generate electricity from the significant wind resource in relatively deep water (>50 m). Scaled model tests are an important part of the qualification process for such novel concepts, and such tests may have many different objec- tives. Model tests can, for example, be used to confirm system behavior, evaluate nonlinear phenomena, assess extreme and de- tailed loads, validate computer codes, or convince decision mak- ers of the feasibility of a concept [2]. There are, however, significant challenges related to carry- ing out scaled model tests of FWTs in an ocean basin. Hydro- dynamic tests generally follow Froude scaling, but a consistent scaling of the wind turbine will then result in a reduced Reynolds number compared to the prototype, which leads to generally poor aerodynamic performance [3]. Furthermore, there are practical challenges related to generating (and measuring) constant and turbulent wind fields in a wave basin [4, 5]. In order to improve the aerodynamic load modeling in wave basin experiments, several researchers have attempted various forms of “non-geometrical” scaling of the wind turbine rotor. One form of non-geometrical scaling is to replace the wind tur- bine rotor with a drag disk (e.g. [6, 7]), which gives the cor- rect mean thrust and provides some aerodynamic damping, and 1 Copyright c 2016 by ASME
Transcript of REAL-TIME HYBRID MODEL TESTING OF A BRACELESS SEMI ...
Proceedings of the ASME 2016 35th International Conference on Ocean, Offshore and Arctic EngineeringOMAE2016
June 19 - 24, 2016, Busan, Korea
OMAE2016-54437
REAL-TIME HYBRID MODEL TESTING OF A BRACELESS SEMI-SUBMERSIBLEWIND TURBINE. PART II: EXPERIMENTAL RESULTS
Erin E. BachynskiMARINTEK
7450 Trondheim, Norway
Maxime Thys∗
MARINTEK7450 Trondheim, Norway
Thomas SauderMARINTEK
7450 Trondheim, NorwayNTNU AMOS / IMT
7491 Trondheim, Norway
Valentin ChabaudNTNU / IMT
7491 Trondheim, Norway
Lars Ove SætherMARINTEK
7450 Trondheim, Norway
ABSTRACTReal-Time Hybrid Model (ReaTHM) tests of a braceless
semi-submersible wind turbine were carried out at MARIN-TEK’s Ocean Basin in 2015. The tests sought to evaluate theperformance of the floating wind turbine (FWT) structure in en-vironmental conditions representative of the Northern North Sea.In order to do so, the tests employed a new hybrid testing method,wherein simulated aerodynamic loads were applied to the phys-ical structure in the laboratory. The test method was found towork well, and is documented in [1].
The present work describes some of the experimental re-sults. The test results showed a high level of repeatability, andpermitted accurate investigation of the coupled responses of aFWT, including unique conditions such as blade pitch faults.For example, the influence of the wind turbine controller can beseen in decay tests in pitch and surge. In regular waves, aero-dynamic loads due to constant wind had little influence on thestructure motions (except for the mean offsets). Tests in irregu-lar waves with and without turbulent wind are compared directly,and the influence of the wave-frequency motions on the aerody-namic damping of wind-induced low-frequency motions can beobserved.
∗Corresponding author: [email protected]
INTRODUCTIONFloating wind turbines (FWTs) are an emerging technology
which can be used to generate electricity from the significantwind resource in relatively deep water (>50 m). Scaled modeltests are an important part of the qualification process for suchnovel concepts, and such tests may have many different objec-tives. Model tests can, for example, be used to confirm systembehavior, evaluate nonlinear phenomena, assess extreme and de-tailed loads, validate computer codes, or convince decision mak-ers of the feasibility of a concept [2].
There are, however, significant challenges related to carry-ing out scaled model tests of FWTs in an ocean basin. Hydro-dynamic tests generally follow Froude scaling, but a consistentscaling of the wind turbine will then result in a reduced Reynoldsnumber compared to the prototype, which leads to generally pooraerodynamic performance [3]. Furthermore, there are practicalchallenges related to generating (and measuring) constant andturbulent wind fields in a wave basin [4, 5].
In order to improve the aerodynamic load modeling in wavebasin experiments, several researchers have attempted variousforms of “non-geometrical” scaling of the wind turbine rotor.One form of non-geometrical scaling is to replace the wind tur-bine rotor with a drag disk (e.g. [6, 7]), which gives the cor-rect mean thrust and provides some aerodynamic damping, and
1 Copyright c© 2016 by ASME

can provide gyroscopic forces if spinning. A more sophisticatedmethod of non-geometrical scaling is to modify the wind tur-bine airfoil shape and chord length in order to obtain improvedperformance at low Reynolds numbers. Improvements to the tur-bine performance in a wave basin have been documented, but it isnot currently possible to simultaneously match the thrust, torque,and slope of the thrust curve adequately [8–10]. Numerical codevalidation using tests with non-geometrically scaled rotors hasalso proved challenging due to three-dimensional effects at lowReynolds numbers which are not accounted for by commonlyused methods such as blade/element momentum [11].
In addition to the torque and thrust, accurate modeling ofother aerodynamic forces and moments (such as the sway forceand yaw moment), including the effects of the wind turbine con-trol system, may be important. When the experimental goal is toqualify the global performance of the system, a so-called “real-time hybrid model testing” approach may be applied: in the caseof the FWT in the wave basin, this implies that the aerodynamicforces are actuated upon the physical model according to simul-taneous (real-time) simulations of the turbine rather than beinggenerated by a small-scale physical turbine [1,12–14]. Real-timehybrid model testing will be referred to as ReaTHMTM testing (atrademark of MARINTEK) in the following. The platform mo-tions are measured and passed to the numerical simulator, and ac-tuators apply appropriate aerodynamic/generator forces and mo-ments based on the results of the numerical simulations.
Basin tests of FWTs with hybrid test techniques are rela-tively new, and previous tests have focused solely on the applica-tion of the thrust force [12]. The test campaign for NOWITECHextends the ReaTHM testing concept to 5 degree-of-freedomaerodynamic/generator loads, at a larger scale than previouslytested, using a novel actuation system.
The objectives of the test campaign were twofold: 1) toquantify the system behaviour in environmental conditions rep-resentative of the Northern North Sea, and 2) to prove the ap-plicability of the hybrid test method. In addition, the resultsfrom these tests are expected to be used to validate numericalhydrodynamic and structural models of floating offshore windturbines. Extensive documentation tests as well as several po-tentially design-driving load cases with turbulent wind, irregularwaves, and current were therefore carried out.
The test method is documented in Part I [1], while this workprovides details of the test set-up and presents some of the inter-esting findings from the model test campaign. Calibration of anumerical model of the floating wind turbine is described in PartIII [15].
MODEL DESCRIPTIONThe 5MW CSC platform, which supports the NREL 5MW
wind turbine, was selected for testing [16, 17]. The physi-cal model comprises the hull, tower, and rotor-nacelle-assembly
(RNA) model for the hybrid test method. The Froude scaling lawwas applied based on a linear scale factor of λ = 30, and all val-ues given in this paper are given in prototype (full) scale unlessotherwise noted. The basin floor was positioned at a depth of6.66 m which corresponds to a prototype scale depth of 200 m.
Coordinate systemsAs shown in Fig. 1, the global Earth-fixed coordinate sys-
tem is located at the centerline of the tower at the waterline atthe platform’s resting static position. The z axis of the global co-ordinate system points downward and the system coincides withthe location where waves were measured during calibration. Thissystem is offset from the geometric center of the basin (extentsshown in pink).
Y X
Z
Column 1 Column 2
Column 3
wind wave 0o
wave 60o
wave 90o
current
FIGURE 1. VIEW OF THE PHYSICAL MODEL AND GLOBALCOORDINATE SYSTEM
HullThe hull of the CSC platform includes three side columns,
three pontoons, and a central column, as described in Table 1.
TABLE 1. HULL GEOMETRY
Draft 30 mCentral column diameter 6.5 m
Side column diameter 6.5 mPontoon height 6.0 mPontoon width 9.0 m
Central column freeboard 10.0 mSide column freeboard 20.0 m
Center-to-center (central to side column) 41.0 mCenter-to-edge (central column to pontoon end) 45.5 m
The main material used for manufacturing the model is alu-
2 Copyright c© 2016 by ASME

minum and CNC-cut Divinycell foam with a ground and paintedsurface. The model was ballasted with solid weights. The mass,centre of gravity (CoG), and mass moment of inertia in pitch andyaw were calibrated by weighing and by performing oscillationtests in air with the model in a cradle. Hollow columns and bal-lasting compartments were included to allow for adjustable andaccurate ballasting of the structure.
The measured mass and inertia characteristics of column 3are given in Table 2. Note that the vertical center of gravity(VCG) is given in the basin coordinate system (positive z down-ward). Relatively large deviations in the mass and inertia werepermitted for this part of the structure. The measured mass andinertia of the complete structure is described in Table 4.
TABLE 2. MASS CHARACTERISTICS OF COLUMN 3
Specified Measured DeviationMass (tonnes) 435 456.7 5 %
VCG (m) 10.938 12.93 18.21 %Iyy own CG (tonne-m2) 81017 96093 18.61 %Izz own CG (tonne-m2) 2193 - -
Tower and RNAThe tower and RNA were designed to be as rigid as pos-
sible and to match the mass characteristics of the NREL 5MWwind turbine [17] with the OC3-Hywind tower design [18]. Thedimensions of the frame were designed to accommodate the hy-brid test system, within the dimensional limits dictated by themass and stiffness specifications. Although rather poor agree-ment in the local Iyy can be observed, the deviation was foundto be acceptable, since there is little effect on the overall systemproperties.
TABLE 3. MASS CHARACTERISTICS OF TOWER AND RNA
Specified Measured DeviationMass (tonnes) 598.6 714.0 19.2 %
VCG (m) 70.48 58.23 17.38 %Iyy own CG (tonne-m2) 447244 978590 118.8 %Izz own CG (tonne-m2) 16328 - -
Combined Hull, Tower and RNAThe measured dry mass characteristics of the complete
model (excluding the mooring system) are shown in Table 4. Asshown, the overall platform was approximately 5 % lighter thanthe specification, however the mass moment of inertia in pitchwas approximately 1.5 % higher than specified.
TABLE 4. MASS CHARACTERISTICS OF COMPLETE MODEL
Specified Measured DeviationMass (tonnes) 10214.5 9730 4.7%
VCG (m) 18.9 19.05 0.79 %Iyy about CG (tonne-m2) 10157700 10297582 1.38 %Izz about CG (tonne-m2) 8054160 7641621 5.12 %
Mooring SystemThe mooring system of the 5MW CSC wind turbine con-
sists of 3 catenary mooring lines. The mooring system was builtto match the weight characteristics of the lines in water, but theaxial stiffness of the mooring lines was not considered in the scal-ing (as this stiffness was found to have insignificant influence onthe restoring properties for the offsets of interest). The mooringsystem layout is described in Table 5 and Fig. 1.
TABLE 5. MOORING SYSTEM LAYOUT, REFERRED TOGLOBAL COORDINATE SYSTEM
Fairlead Anchorx (m) y (m) z (m) x (m) y (m) z (m)
Line 1 22.98 -39.8 27.0 301.5 -522.2 200Line 2 22.98 39.8 27.0 301.5 522.2 200Line 3 -45.95 0.0 27.0 -603.0 0.0 200
As per the prototype design, the mooring lines consist oftwo chain segments with no clump weights. For the modeltest, the mooring lines were made from chain with lead wiresadded for weight correction. Table 6 summarizes the mass andwetted weight of the mooring line segments as built. The di-ameter is given according to the specification: for simulations,the axial stiffness is assumed to be determined by a circularcross-section with the given diameter and Young’s modulus ofE = 6.3 ∗ 109 kN/m2. That is, the as-built mooring system hashigher axial stiffness when scaled than the specified prototype(E = 2.1∗108 kN/m2).
TABLE 6. MOORING LINE CHARACTERISTICS AS BUILT
Segment Length Mass per Wet weight Spec.(m) length (kg/m) (kN/m) diameter (m)
Upper 240.00 235.0 2.005 0.195Lower 367.55 446.0 3.804 0.269
Aerodynamic Load ModelThe aerodynamic load calculations were carried out in a For-
tran Dynamic Link Library (DLL) which calls the open source
3 Copyright c© 2016 by ASME
code AeroDyn v13.00.01a-bjj [19]. AeroDyn [20] is a well-known implementation of the blade element/momentum (BEM)and generalized dynamic wake (GDW) methods, which has beenvalidated against experimental data [21]. BEM was applied formean wind speeds of 8 m/s, while GDW was applied for all otherwind speeds.
As described in greater detail in Part I [1], the aerodynamicand generator loads were calculated using AeroDyn and the“Bladed-style” DISCON controller defined for the OC3 study,with some modifications for cases where blade pitch fault orshutdown are to be included. The aerodynamic calculations arecarried out in full scale, with the measured positions, orienta-tions, and velocities, as well as the applied loads, scaled accord-ing to Froude scaling.
INSTRUMENTATIONThe measured responses during the tests included the plat-
form motions and accelerations at the nacelle, wind turbine rota-tional speed, total aerodynamic and generator loads on the rotor,sectional moments and shear forces at the base of the tower and atthe base of column 3, and mooring line tensions at the fairleads.A single ultra-thin instrumentation and power cable (under themodel) was used. During wave calibration, wave elevations weresampled at 200 Hz in model scale. During the tests with themodel, wave and force measurements were sampled at 600Hz inmodel scale.
The wave elevation was measured using conductance-typewave probes. Three probes were used during calibration, whileonly one was kept during tests with the model. The current speedwas measured during calibration using acoustic time travel dif-ference.
The forces on the mooring lines were measured using 280 Nring-type force transducers located at the upper end of eachmooring line.
Bending moments and shear forces were measured at thebase of the tower (10 m above the still water level) and at the baseof the back column (column 3, at the point where the columnmeets the pontoon, at a depth of 24 m). Four strain gauges on thetower and four strain gauges on the column were used.
Several systems were in place to measure the motions andaccelerations of the model. The motions of the vessel weremeasured by the OQUS position measuring system which is anoptical-electronic system. Four (4) passive (reflective) diodes onthe tower of the model and onshore cameras were employed.Translational accelerations were measured using an accelerom-eter in the nacelle of the model. Rates of rotation were measuredusing a gyrometer in the nacelle. The OQUS measurements weresampled at 100 Hz.
The approximate measurement accuracies are given in Ta-ble 7 in model scale. The OQUS accuracies refer to dynamicresolution.
TABLE 7. MODEL SCALE MEASUREMENT ACCURACIES
OQUS x-,y- and z-motions 0.5 mmOQUS roll, pitch and yaw 0.05 deg
Wave probes 1.0 mmCurrent speed 5 mm/s
Force transducers 2 % of meas. value for sign. resp. levels
TEST PROGRAMThe complete test program was designed to include identifi-
cation tests, with and without the hybrid system, as well as de-terministic (regular, constant) and random (irregular, turbulent)wave and wind tests. Two tests were carried out with wind, wave,and current, and several tests were carried out with the wind tur-bine in a fault condition.
PULLOUT TESTSAfter installation of the model and connection of the moor-
ing system, the draft and pretension were measured and checked.Pullout tests were then carried out to check the static restoringforce and tensions of the mooring system. The results of the pull-out tests are provided in Tables 8-9. The tabulated data includesthe offset (η), total restoring force or moment from the mooringsystem (Fr), and the tension in the mooring line with maximumtension (Tmax).
All offsets are based on the motion at the waterline (ie, in theglobal Earth-fixed coordinate system). As expected, the mooringsystem is more stiff in +x than in -x.
TABLE 8. PULL-OUT TESTS IN SURGE
-x +xη Fr (kN) Tmax (kN) η Fr (kN) Tmax (kN)
0.00 0 1595 0.00 0 15952.52 240 1680 1.03 110 16713.88 363 1732 2.60 282 17947.09 644 1856 5.05 571 20089.34 832 1948 10.61 1340 2644
12.18 1066 2080 15.31 2212 342614.95 1305 2223 19.84 3479 4635
24.19 5020 6148
DECAY TESTSDecay tests were carried out to establish the natural periods
and damping of the rigid body modes of motion. Decay tests inall six degrees of freedom were carried out in calm water with-out wind, and decay tests in surge and pitch were carried outfor wind speeds below, at, and above the rated wind speed. The
4 Copyright c© 2016 by ASME

TABLE 9. PULL OUT TESTS IN SWAY AND YAW
+y +yawη Fr (kN) Tmax (kN) η Fr (kNm) Tmax (kN)
0.00 0 1595 0.00 0 15950.97 94 1654 0.37 2221 15962.26 225 1736 2.68 9061 16034.99 494 1916 4.78 15940 16137.86 780 2124 7.12 23672 1625
10.67 1020 230613.29 1285 2526
natural periods of the model in various configurations are sum-marized in Table 10. The hybrid system is active in all of thetests presented here; see [1] for an evaluation of the performanceof the hybrid system. The wind turbine control system is activein all simulations with nonzero wind.
TABLE 10. NATURAL PERIODS FROM DECAY TESTS
Motion No wind loads 8 m/s 11.4 m/s 15 m/sSurge (s) 86.1 90.3 94.2 90.5Sway (s) 85.3 - - -Heave (s) 25.5 - - -Roll (s) 28.3 - - -Pitch (s) 29.2 30.5 36.5 32.2Yaw (s) 59.4 - - -
The mean offsets of the platform in constant wind can alsobe obtained from the decay tests with wind, as given in Table 11.The mean offset is subtracted from all subsequent figures, suchthat the results can more easily be compared to the tests withoutwind forces.
TABLE 11. MEAN OFFSETS IN CONSTANT WIND
Motion 8 m/s 11.4 m/s 15 m/sSurge (m) -4.75 -7.6 -4.0Pitch (deg) 3.45 5.4 3.0
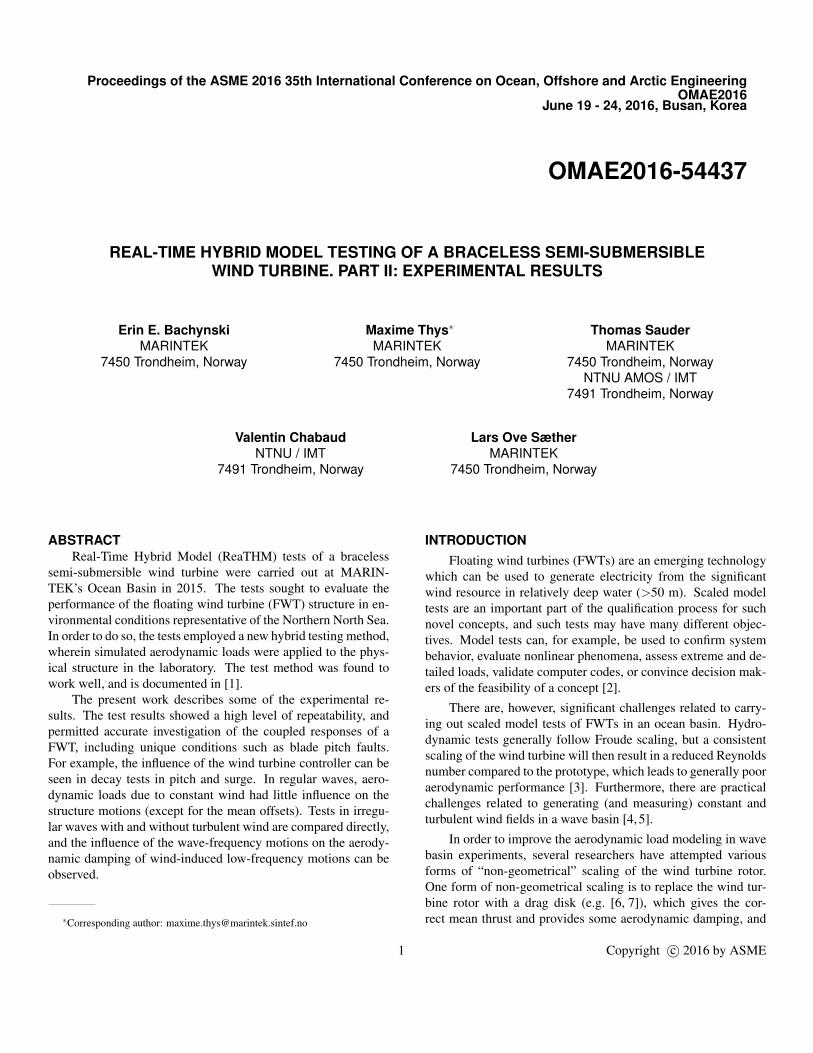
Damping values are presented as a function of the amplitudeof motion. The ratio of damping compared to critical damping(ζ ∗) is calculated based on the logarithmic decrement (δ ) foreach cycle:
δ = lnxn
xn+1(1)
where xn and xn+1 are two consecutive peaks or troughs. Thedamping ratio is then found as:
ζ∗ =
1√1+( 2π
δ)2. (2)
In some cases, and especially for small motion amplitudes, thereare large variations in the damping level.
Decay tests below rated wind speedFour decay tests in surge and three decay tests in pitch were
carried out with 8 m/s constant wind.The surge decay results with 8 m/s constant wind are com-
pared to the tests with zero wind forces in Figs. 2 and 3. Notethat some tests were initiated with positive surge, while otherswere initiated with a negative surge displacement, and multipleiterations (it. in the figure) are shown. Compared to the testswithout wind, a slight increase in damping is observed, but thisincrease is relatively small due to the low velocity at the nacelle.Nonetheless, a significant lengthening of the natural period (5seconds) is observed due to the wind forces, including the actionof the torque controller.
0 100 200 300 400 500 600 700
time, s
-8
-6
-4
-2
0
2
4
6
surg
e, m
no wind it1no wind it2no wind it38 m/s it18 m/s it28 m/s it38 m/s it4
FIGURE 2. SURGE DECAY, 8 m/s CONSTANT WIND
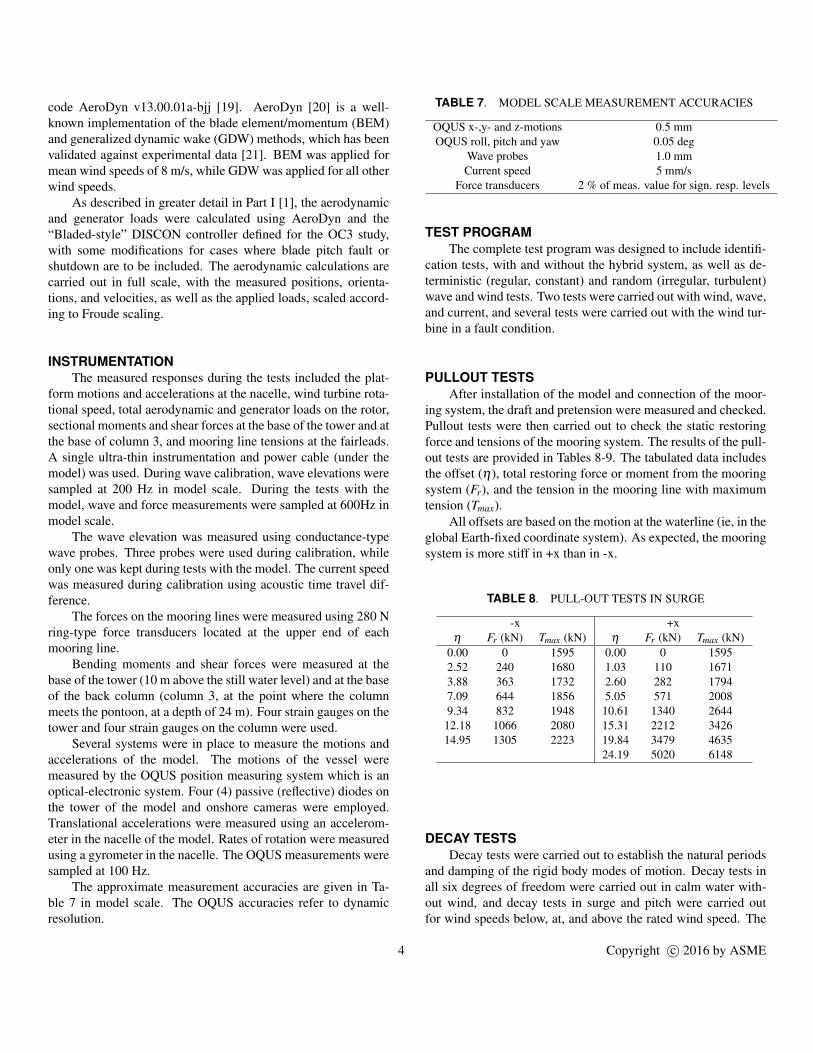
Fig. 4 shows the pitch decay tests with below-rated windspeed. As expected, there is significant aerodynamic damping inpitch. Since the natural period in pitch is smaller than in surge,and the excursions at the nacelle are larger, the relative velocityis higher in the pitch decay test than in the surge decay test.
Fig. 4 also shows that the natural period is longer for theplatform in below-rated wind speed than without wind. There is,however, significant variation in the length of each cycle, andsome variation from test to test. The natural period tends tolengthen for later cycles.
5 Copyright c© 2016 by ASME
0 1 2 3 4 5 6 7
surge, m
0
0.02
0.04
0.06
0.08
0.1
0.12
0.14
0.16
0.18
1*
no wind it1no wind it2no wind it38 m/s it18 m/s it28 m/s it38 m/s it4
FIGURE 3. SURGE DAMPING, 8 m/s CONSTANT WIND
0 50 100 150 200 250 300
time, s
-4
-3
-2
-1
0
1
2
3
4
pitc
h, d
eg
no wind it1no wind it28 m/s it18 m/s it28 m/s it3
FIGURE 4. PITCH DECAY, 8 m/s CONSTANT WIND
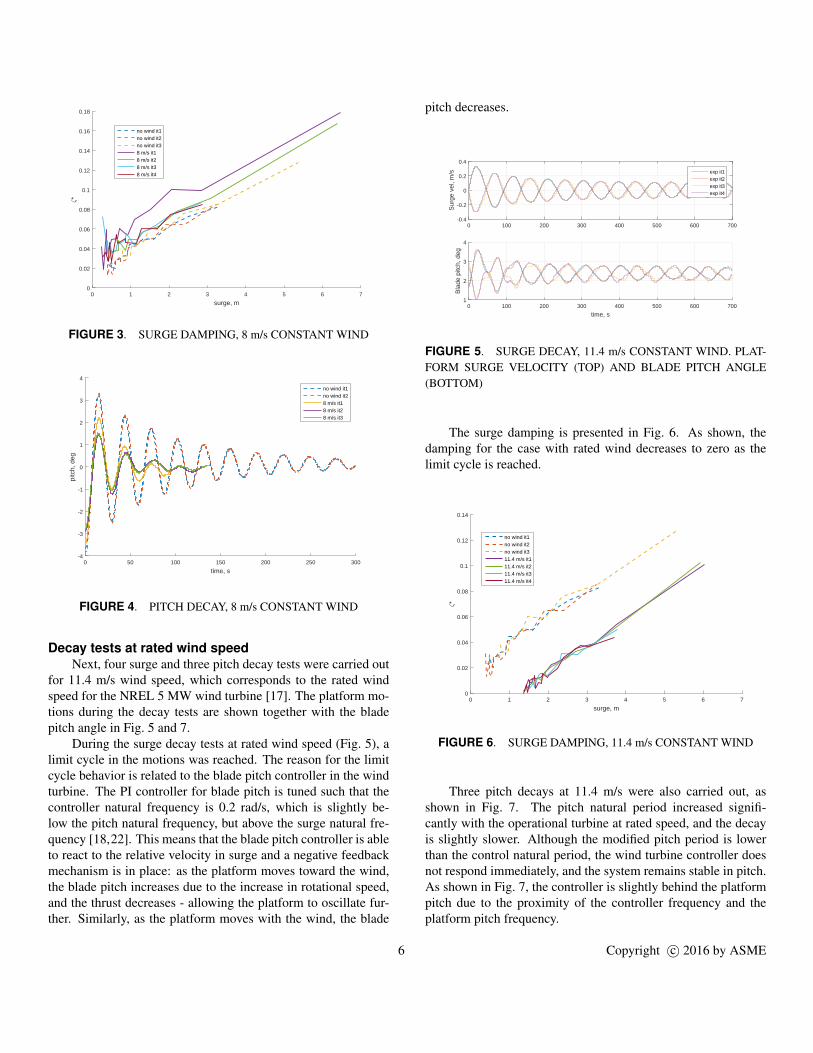
Decay tests at rated wind speedNext, four surge and three pitch decay tests were carried out
for 11.4 m/s wind speed, which corresponds to the rated windspeed for the NREL 5 MW wind turbine [17]. The platform mo-tions during the decay tests are shown together with the bladepitch angle in Fig. 5 and 7.
During the surge decay tests at rated wind speed (Fig. 5), alimit cycle in the motions was reached. The reason for the limitcycle behavior is related to the blade pitch controller in the windturbine. The PI controller for blade pitch is tuned such that thecontroller natural frequency is 0.2 rad/s, which is slightly be-low the pitch natural frequency, but above the surge natural fre-quency [18,22]. This means that the blade pitch controller is ableto react to the relative velocity in surge and a negative feedbackmechanism is in place: as the platform moves toward the wind,the blade pitch increases due to the increase in rotational speed,and the thrust decreases - allowing the platform to oscillate fur-ther. Similarly, as the platform moves with the wind, the blade
pitch decreases.
0 100 200 300 400 500 600 700-0.4
-0.2
0
0.2
0.4
Sur
ge v
el, m
/s exp it1exp it2exp it3exp it4
0 100 200 300 400 500 600 700
time, s
1
2
3
4
Bla
de p
itch,
deg
FIGURE 5. SURGE DECAY, 11.4 m/s CONSTANT WIND. PLAT-FORM SURGE VELOCITY (TOP) AND BLADE PITCH ANGLE(BOTTOM)
The surge damping is presented in Fig. 6. As shown, thedamping for the case with rated wind decreases to zero as thelimit cycle is reached.
0 1 2 3 4 5 6 7
surge, m
0
0.02
0.04
0.06
0.08
0.1
0.12
0.14
1*
no wind it1no wind it2no wind it311.4 m/s it111.4 m/s it211.4 m/s it311.4 m/s it4
FIGURE 6. SURGE DAMPING, 11.4 m/s CONSTANT WIND
Three pitch decays at 11.4 m/s were also carried out, asshown in Fig. 7. The pitch natural period increased signifi-cantly with the operational turbine at rated speed, and the decayis slightly slower. Although the modified pitch period is lowerthan the control natural period, the wind turbine controller doesnot respond immediately, and the system remains stable in pitch.As shown in Fig. 7, the controller is slightly behind the platformpitch due to the proximity of the controller frequency and theplatform pitch frequency.
6 Copyright c© 2016 by ASME

0 50 100 150 200 250 300-1
-0.5
0
0.5
1
Pitc
h ve
l, de
g/s
exp it1exp it2exp it3
0 50 100 150 200 250 300
time, s
0
2
4
6
Bla
de p
itch,
deg
FIGURE 7. PITCH DECAY, 11.4 m/s CONSTANT WIND. PLAT-FORM PITCH VELOCITY (TOP) AND BLADE PITCH ANGLE(BOTTOM)
The damping in pitch at rated speed remains at a level similarto the case with no wind.
Decay tests above rated wind speedFour surge decay tests and four pitch decay tests were car-
ried out at above rated wind speed, as shown in Fig. 8 and 9.Although the wind turbine blade pitch controller is active
at above-rated wind speeds, the negative feedback is smaller at20 m/s than at 11.4 m/s due to gain scheduling. In Fig. 8, thesurge velocity and blade pitch angle are shown. Due to gainscheduling, the same variation in rotor speed results in smallerchanges in the blade pitch angle as the blade pitch angle in-creases. In this case the mean blade pitch angle is above 17 de-grees. Due to the small changes in the blade pitch angle, the hy-drodynamic damping is sufficient to result in decay despite somenegative feedback from the controller. There is a slight decreasein surge damping with above-rated wind compared to the casewithout wind, but the difference is small.
0 100 200 300 400 500 600 700-0.4
-0.2
0
0.2
0.4
Sur
ge v
el, m
/s
exp it1exp it2exp it3exp it4
0 100 200 300 400 500 600 700
time, s
17
17.2
17.4
17.6
17.8
Bla
de p
itch,
deg
FIGURE 8. SURGE DECAY, 20 m/s CONSTANT WIND. PLAT-FORM SURGE VELOCITY (TOP) AND BLADE PITCH ANGLE(BOTTOM)
The pitch natural period increased significantly with the op-erational turbine at rated speed. The damping is slightly higherfor the 20 m/s wind speed than for the case without wind. Asin the surge decay test at 20 m/s, the variation in the blade pitchangle is small. The effect of the delay between the pitch controlresponse and the pitch velocity results in the presence of someaerodynamic damping in the system.
0 50 100 150 200 250 300-1
-0.5
0
0.5
1
Pitc
h ve
l, de
g/s
exp it1exp it2exp it3exp it4
0 50 100 150 200 250 300
time, s
16.5
17
17.5
18
18.5
Bla
de p
itch,
deg
FIGURE 9. PITCH DECAY, 20 m/s CONSTANT WIND. PLAT-FORM PITCH VELOCITY (TOP) AND BLADE PITCH ANGLE(BOTTOM)
REGULAR AND PINK WAVE TESTSRegular wave tests with 1/60 steepness were carried out for
three periods (8, 11, and 16 seconds) and three wave headings (0,60, and 90 degrees) without the hybrid system present. Regularwave tests for 8 and 11 second wave periods at 0 degree waveheading were also carried out with the hybrid system present:without wind, with constant wind at 8 m/s, and with constantwind at 15 m/s. Analysis of the regular waves is carried out for10-15 wave periods after the initial ramp. As far as possible, theanalysis is carried out before the wave reflections from the beachreached the model. Pink noise tests, with an irregular wave spec-trum which is ideally constant over a range of frequencies andzero outside that range, were also carried out in order to examinethe wave-only response over a wider range of frequencies. Thepink noise tests, which are summarized in Table 12, were carriedout without the hybrid system.
Response amplitude operators (RAOs) can be computedbased on the measured waves and responses in pink noise and inregular waves. Fig. 10 shows the surge, heave, and pitch RAOsfor the waves from zero degrees. In addition to the results fromthe two pink noise tests without the hybrid system present, theresults from the regular wave tests with (including pretension,see Part I [1]) and without the hybrid system, and with constantwind, are included. The motions appear to behave quite linearly
7 Copyright c© 2016 by ASME
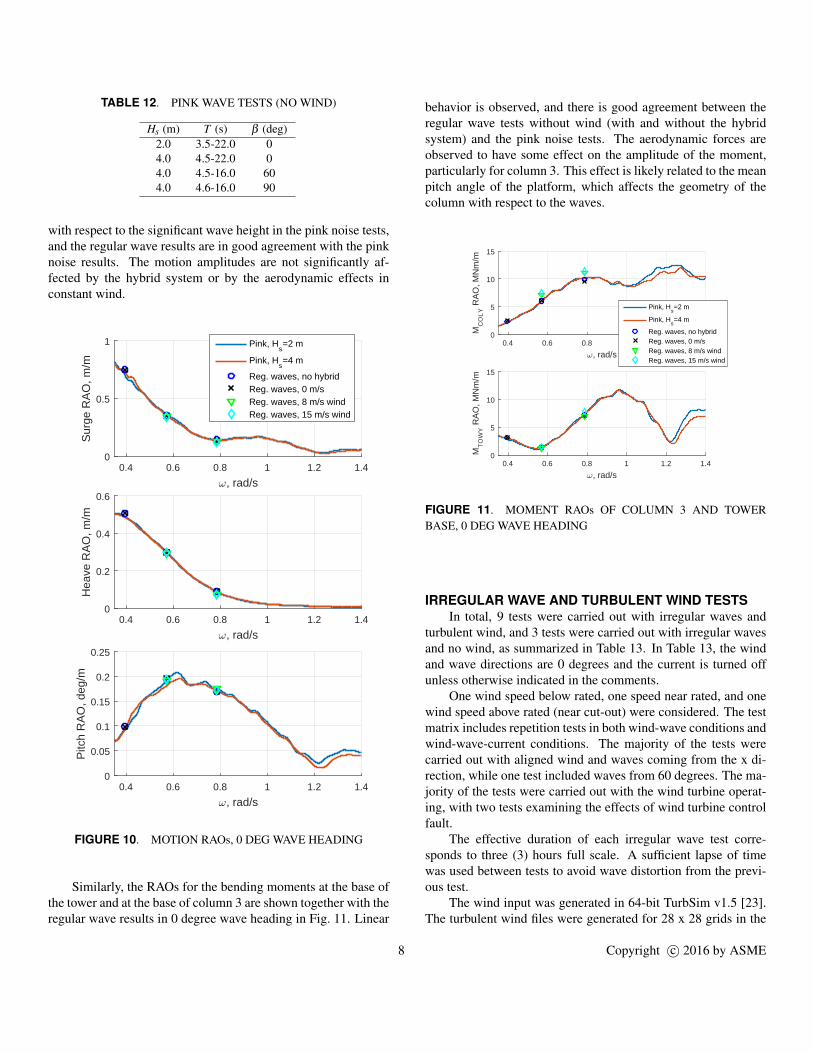
TABLE 12. PINK WAVE TESTS (NO WIND)
Hs (m) T (s) β (deg)2.0 3.5-22.0 04.0 4.5-22.0 04.0 4.5-16.0 604.0 4.6-16.0 90
with respect to the significant wave height in the pink noise tests,and the regular wave results are in good agreement with the pinknoise results. The motion amplitudes are not significantly af-fected by the hybrid system or by the aerodynamic effects inconstant wind.
0.4 0.6 0.8 1 1.2 1.4
!, rad/s
0
0.5
1
Sur
ge R
AO
, m/m
Pink, Hs=2 m
Pink, Hs=4 m
Reg. waves, no hybridReg. waves, 0 m/sReg. waves, 8 m/s windReg. waves, 15 m/s wind
0.4 0.6 0.8 1 1.2 1.4
!, rad/s
0
0.2
0.4
0.6
Hea
ve R
AO
, m/m
0.4 0.6 0.8 1 1.2 1.4
!, rad/s
0
0.05
0.1
0.15
0.2
0.25
Pitc
h R
AO
, deg
/m
FIGURE 10. MOTION RAOs, 0 DEG WAVE HEADING
Similarly, the RAOs for the bending moments at the base ofthe tower and at the base of column 3 are shown together with theregular wave results in 0 degree wave heading in Fig. 11. Linear
behavior is observed, and there is good agreement between theregular wave tests without wind (with and without the hybridsystem) and the pink noise tests. The aerodynamic forces areobserved to have some effect on the amplitude of the moment,particularly for column 3. This effect is likely related to the meanpitch angle of the platform, which affects the geometry of thecolumn with respect to the waves.
0.4 0.6 0.8 1 1.2 1.4
!, rad/s
0
5
10
15
MC
OL
Y R
AO
, MN
m/m
Pink, Hs=2 m
Pink, Hs=4 m
Reg. waves, no hybridReg. waves, 0 m/sReg. waves, 8 m/s windReg. waves, 15 m/s wind
0.4 0.6 0.8 1 1.2 1.4
!, rad/s
0
5
10
15
MT
OW
Y R
AO
, MN
m/m
FIGURE 11. MOMENT RAOs OF COLUMN 3 AND TOWERBASE, 0 DEG WAVE HEADING
IRREGULAR WAVE AND TURBULENT WIND TESTSIn total, 9 tests were carried out with irregular waves and
turbulent wind, and 3 tests were carried out with irregular wavesand no wind, as summarized in Table 13. In Table 13, the windand wave directions are 0 degrees and the current is turned offunless otherwise indicated in the comments.
One wind speed below rated, one speed near rated, and onewind speed above rated (near cut-out) were considered. The testmatrix includes repetition tests in both wind-wave conditions andwind-wave-current conditions. The majority of the tests werecarried out with aligned wind and waves coming from the x di-rection, while one test included waves from 60 degrees. The ma-jority of the tests were carried out with the wind turbine operat-ing, with two tests examining the effects of wind turbine controlfault.
The effective duration of each irregular wave test corre-sponds to three (3) hours full scale. A sufficient lapse of timewas used between tests to avoid wave distortion from the previ-ous test.
The wind input was generated in 64-bit TurbSim v1.5 [23].The turbulent wind files were generated for 28 x 28 grids in the
8 Copyright c© 2016 by ASME

y-z plane, corresponding to 160 m x 160 m centered at a heightof 90 m above the still water line. The time step in the wind fileswas 0.22 s and each time series lasted 12500 s (corresponding to3 hours of full scale time, plus approximately 5 min extra modelscale time). There was no vertical shear in the wind files. Thenormal turbulence model (NTM) for class B wind turbines wasused, and the Kaimal wind spectrum was applied. The relativelylow resolution of the wind file is related to the frequencies ofinterest in the present test and hardware (memory) limitations,but these limitations are not inherent to the test methodology.Additional discussion of the wind field frequencies can be foundin [1].
TABLE 13. IRREGULAR WAVE TESTS. SPECIFIED/OBTAINEDVALUES ARE SHOWN FOR Hs and Tp.
Hs (m) Tp (s) U (m/s) I (%) Comment15.3/15.11 14.0/13.86 0 w/out hybrid system
3.6/3.62 10.2/10.13 0 w/ and w/outhybrid system
5.9/5.86 11.3/11.05 25 13.2 repeated5.9/5.86 11.3/11.21 25 13.2 60 deg wave3.6/3.62 10.2/10.13 11 17.05.2/4.99 8.0/8.02 8 19.55.9/5.26 11.3/11.05 25 13.2 current 1.12 m/s,
repeated5.9/5.86 11.3/11.05 25 13.2 Shutdown,
blade seize
The two tests with Hs =5.9 m, Tp =11.3 s, and turbulentwind (U =25 m/s) can be used to examine the repeatability ofthe wind-wave tests. The platform motions over a short timeduration are compared in Fig. 12.
There is less than 2 % difference in the statistical resultsbetween the two tests, which suggests good repeatability.
Fig. 13 shows time series of the platform motions in com-bined, wave-only, and wind-only conditions. The mean valueof the responses is subtracted in order to see the dynamic com-ponents more clearly. Visually, Fig. 13 shows that the low-frequency motions are primarily excited by the wind, and that thewave-frequency responses are fairly independent from the low-frequency motions.
The low- and wave-frequency parts of the motion spectrafor the wind-wave, wave-only, and wind-only surge, heave, andpitch motions are shown separately in Figs. 14 and 15. Basedon Fig. 14, for the surge motion, the presence of waves tends todecrease the low-frequency response. This is consistent with thefact that the wave-frequency motions contribute non-linearly tothe rotor thrust [24, 25].
The low-frequency (natural frequency) heave response islargest in the wave-only condition and is somewhat dampened
2500 2600 2700 2800 2900 3000-8
-6
-4
-2
0
Sur
ge, m
Rep. 1Rep. 2
2500 2600 2700 2800 2900 3000-1.5
-1
-0.5
0
0.5
1
Sw
ay, m
2500 2600 2700 2800 2900 3000-2
-1
0
1
2
Hea
ve, m
2500 2600 2700 2800 2900 3000-2
-1.5
-1
-0.5
0
0.5
1
Rol
l, de
g
2500 2600 2700 2800 2900 3000
time, s
0
1
2
3
4
5
Pitc
h, d
eg
2500 2600 2700 2800 2900 3000
time, s
-2
-1
0
1
2
3
Yaw
, deg
FIGURE 12. REPEATED TESTS, IRREGULAR WAVES ANDTURBULENT WIND, Hs =5.9 m, Tp =11.3 s, U =25 m/s.
when the wind is also present. There is little wind-wave cou-pling for the low-frequency pitch motions. Fig. 15 suggests thatthere is very little influence from the wind on the wave-frequencymotions for this platform.
Time series of the column and tower base bending momentsin wind-wave, wave-only, and wind-only conditions are shown inFig. 16. The low-frequency wind-induced effects on the columnare small, as expected. As a result of the changed mean posi-tion/orientation of the column due to wind forces, the amplitudeof the wave-frequency column bending moment is larger for thewind-wave condition than the wave-only condition.
The tower base bending moment shows significant variationin both the low-frequency and wave-frequency regions, but thereis little influence of the waves on the low-frequency tower basebending moment variation, and little influence of the wind on thewave-frequency variation.
The low-frequency component of the mooring line tensions,which is largely dictated by the surge motions, is dominatedby wind excitation. The presence of waves dampens the low-frequency surge motion somewhat, and there is a correspondingdecrease in the low-frequency mooring forces for the wind-wavecase compared to the wind-only case. The wave-frequency vari-ation in the mooring line forces depends on the mean position ofthe platform. As such, the wave-frequency mooring line force
9 Copyright c© 2016 by ASME

3000 3100 3200 3300 3400 3500-4
-2
0
2
4
6
Sur
ge, m
Wind-waveWave onlyWind only
3000 3100 3200 3300 3400 3500-0.5
0
0.5
Sw
ay, m
3000 3100 3200 3300 3400 3500-0.6
-0.4
-0.2
0
0.2
0.4
0.6
Hea
ve, m
3000 3100 3200 3300 3400 3500-0.6
-0.4
-0.2
0
0.2
0.4
0.6R
oll,
deg
3000 3100 3200 3300 3400 3500
time, s
-4
-2
0
2
4
Pitc
h, d
eg
3000 3100 3200 3300 3400 3500
time, s
-1.5
-1
-0.5
0
0.5
1
Yaw
, deg
FIGURE 13. PLATFORM MOTIONS IN WIND-WAVE,WAVE-ONLY, AND WIND-ONLY CONDITIONS. Hs =3.6 m, Tp =10.2 s,U =11 m/s. MEAN VALUES ARE REMOVED.
variation increases for lines 1 and 2 (upwind) in the wind-wavecase, while the variation decreases for line 3 (downwind).
The key statistics for the wind-wave test near rated windspeed are compared to the wave-only and wind-only statisticsin Table 14. Table 14 also includes the results from superposi-tion in the time domain (direct addition of the time series from4330 and 1713). In general, direct superposition of the time se-ries gives slightly conservative results for the platform motionsand mooring line tensions, but is not conservative for the bendingmoments in the column. Superposition of the statistics tends togive slightly larger errors.
CONCLUSIONSReaTHMTM testing of a semi-submersible wind turbine was
carried out at the MARINTEK Ocean Basin as a part of theNOWITECH research center. Physically modelled waves andcurrent were applied to the model, while aerodynamic and gen-erator loads on the wind turbine were applied by actuators basedon real-time simulations (accounting for the measured motions).
Extensive identification tests were carried out, and the windturbine (including the control system) was found to have signifi-cant effects on the natural periods and damping of the system.
0 0.05 0.1 0.15 0.2 0.25 0.3 0.35 0.4
!, rad/s
0
20
40
60
80
100
Sur
ge, m
2s
Wind-waveWave onlyWind only
0 0.05 0.1 0.15 0.2 0.25 0.3 0.35 0.4
!, rad/s
0
0.1
0.2
0.3
0.4
0.5
Hea
ve, m
2s
0 0.05 0.1 0.15 0.2 0.25 0.3 0.35 0.4
!, rad/s
0
5
10
15
Pitc
h, m
2s
FIGURE 14. LOW-FREQUENCY PART OF PLATFORM MOTIONSPECTRA. WIND-WAVE, WAVE-ONLY, AND WIND-ONLY CON-DITIONS. Hs =3.6 m, Tp =10.2 s, U =11 m/s.
The tested conditions permitted a detailed examination ofthe motions, mooring line forces, and tower and column bendingmoments in severe waves, aligned wind and waves, misalignedwind and waves, wind-wave-current, and in several wind turbinefault conditions. For this platform, interaction between the aero-dynamic and hydrodynamic loads was observed primarily at lowfrequencies.
ACKNOWLEDGMENTThe authors gratefully acknowledge the financial support
from the Research Council of Norway granted through theNorwegian Research Centre for Offshore Wind Technology(NOWITECH).
REFERENCES[1] Sauder, T., Chabaud, V., Thys, M., Bachynski, E. E., and
Sæther, L. O., 2016. “Real-time hybrid model testing ofa braceless semi-submersible wind turbine: Part I: The hy-brid approach”. In 35th International Conference on Ocean,Offshore and Arctic Engineering, no. OMAE2016-54435.
10 Copyright c© 2016 by ASME

TABLE 14. Comparison of key responses: wind-wave, wave-only, wind-only
Wind and waves Wave-only Wind-only Superposition Deviation (%)4310 4330 1713 and 1720 in time domain from superposition
Std. Dev. Surge (m) 1.59 0.44 1.66 1.69 -5.94Mean Surge (m) -8.09 -0.12 -7.91 -7.97 1.49Std. Dev. Heave (m) 0.21 0.22 0.07 0.22 -5.42Std. Dev. Roll (deg) 0.17 0.03 0.17 0.17 -1.60Std. Dev. Pitch (deg) 1.19 0.23 1.18 1.18 0.56Mean Pitch (deg) 5.77 -0.32 5.74 5.44 5.73Std. Dev. Yaw (deg) 0.49 0.09 0.52 0.52 -6.01Std. Dev. MCOLY (MNm) 10.23 7.85 2.39 8.20 19.85Mean MCOLY (MNm) -8.70 0.55 -8.81 -8.27 4.97Std. Dev. MTOWY (MNm) 15.34 6.26 14.10 15.29 0.33Mean MTOWY (MNm) 85.22 -5.85 85.01 79.44 6.79Std. Dev. FMOOR1 (kN) 63.25 18.01 64.75 66.17 -4.62Std. Dev. FMOOR2 (kN) 62.42 19.85 62.84 65.27 -4.57Std. Dev. FMOOR3 (kN) 64.38 29.59 67.84 72.00 -11.84
0.5 1 1.5
!, rad/s
0
0.1
0.2
0.3
0.4
Sur
ge, m
2s
Wind-waveWave onlyWind only
0.5 1 1.5
!, rad/s
0
0.05
0.1
0.15
0.2
0.25
Hea
ve, m
2s
0.5 1 1.5
!, rad/s
0
0.02
0.04
0.06
0.08
0.1
0.12
Pitc
h, m
2s
FIGURE 15. WAVE-FREQUENCY PART OF PLATFORM MO-TION SPECTRA. WIND-WAVE, WAVE-ONLY, AND WIND-ONLYCONDITIONS. Hs =3.6 m, Tp =10.2 s, U =11 m/s.
[2] IEA Wind Task 30, 2012. Experts’ meeting on computercode validation for offshore wind system modeling. Tech.rep., IEA Wind.
[3] Robertson, A. N., Jonkman, J., Goupee, A. J., Coulling,
3000 3050 3100 3150 3200 3250 3300 3350 3400 3450 3500-30
-20
-10
0
10
20
30
40
MC
OL
Y, M
Nm
Wind-waveWave onlyWind only
3000 3050 3100 3150 3200 3250 3300 3350 3400 3450 3500
time, s
-60
-40
-20
0
20
40
60
MT
OW
Y, M
Nm
FIGURE 16. TOWER AND COLUMN BENDING MOMENTSIN WIND-WAVE, WAVE-ONLY, AND WIND-ONLY CONDITIONS.Hs =3.6 m, Tp =10.2 s, U =11 m/s. MEAN VALUES ARE RE-MOVED.
A. J., Prowell, I., Browning, J., Masciola, M. D., andMolta, P., 2013. “Summary of conclusions and recommen-dations drawn from the DeepCwind scaled floating offshorewind system test campaign”. In Proceedings of the ASME
11 Copyright c© 2016 by ASME
2013 32nd International Conference on Ocean, Offshoreand Arctic Engineering, no. OMAE2013-10817.
[4] Courbois, A., Flamand, O., Toularastel, J.-L., Ferrant,P., and Rousset, J.-M., 2013. “Applying relevant windgeneration techniques to the case of floating wind tur-bines”. In European-African Conference on Wind Engi-neering (EACWE).
[5] Newton, J. M., Cameron, M. P., Urbina, R., Kimball, R. W.,Goupee, A. J., and Thiagarajan, K. P., 2015. “Character-iszation of a wind tunnel for use in offshore wind turbinedevelopment”. In 34th International Conference on Ocean,Offshore and Arctic Engineering, no. OMAE2015-41979.
[6] Roddier, D., Cermelli, C., Aubault, A., and Weinstein, A.,2010. “WindFloat: A floating foundation for offshore windturbines”. Journal of Renewable and Sustainable Energy,2(3), p. 033104.
[7] Wan, L., Gao, Z., and Moan, T., 2015. “Experimentaland numerical study of hydrodynamic responses of a com-bined wind and wave energy converter concept in survivalmodes”. Coastal Engineering, 104, pp. 151 – 169.
[8] Fowler, M. J., Kimball, R. W., Thomas, D. A., and Goupee,A. J., 2013. “Design and testing of scale model wind tur-bines for use in wind/wave basin model tests of floating off-shore wind turbines”. In 32nd International Conference onOcean, Offshore and Arctic Engineering, no. OMAE2013-10122.
[9] Kimball, R., Goupee, A. J., Fowler, M. J., de Ridder, E.-J.,and Helder, J., 2014. “Wind/wave basin verification of aperformance-matched scale-model wind turbine on a float-ing offshore wind turbine platform”. In Proceedings of theASME 2014 33rd International Conference on Ocean, Off-shore and Arctic Engineering, no. OMAE2014-24166.
[10] Bottasso, C. L., Campagnolo, F., and Pectrovic, V., 2014.“Wind tunnel tetsting of scaled wind turbine models: Be-yond aerodynamics”. Journal of Wind Engineering and In-dustrial Aerodynamics, 127, pp. 11–28.
[11] Fernandes, G., Make, M., Gueydon, S., and Vaz, G., 2014.“Sensitivity to aerodynamic forces for the accurate mod-elling of floating offshore wind turbines”. In RENEW2014,G. Soares, ed., no. ISBN: 978-1-138-02871-5.
[12] Azcona, J., Bouchotrouch, F., Gonzalez, M., Garciandıa,J., Munduate, X., Kelberlau, F., and Nygaard, T. A., 2014.“Aerodynamic thrust modelling in wave tank tests of off-shore floating wind turbines using a ducted fan”. Journalof Physics: Conference Series, 524, Jun, pp. 1–11.
[13] Hall, M., Moreno, J., and Thiagarajan, K., 2014. “Per-formance specifications for real-time hybrid testing of1:50-scale floating wind turbine models”. In Proceed-ings of the ASME 2014 33rd International Conferenceon Ocean, Offshore and Arctic Engineering OMAE2014,no. OMAE2014-24497.
[14] Chabaud, V., Steen, S., and Skjetne, R., 2013. “Real-time
hybrid testing for marine structures: Challenges and strate-gies”. In 32nd International Conference on Ocean, Offshoreand Arctic Engineering, no. OMAE2013-10277.
[15] Berthelsen, P. A., Bachynski, E. E., Karimirad, M., andThys, M., 2016. “Real-time hybrid model testing of abraceless semi-submersible wind turbine. Part III: Cali-bration of a numerical model”. In 35th InternationalConference on Ocean, Offshore and Arctic Engineering,no. OMAE2016-54640.
[16] Luan, C., Gao, Z., and Moan, T., 2016. “Design and anal-ysis of a braceless steel 5-mw semi-submersible wind tur-bine”. In 35th International Conference on Ocean, Offshoreand Arctic Engineering, no. OMAE2016-54848. (submit-ted for publication).
[17] Jonkman, J., Butterfield, S., Musial, W., and Scott, G.,2009. Definition of a 5-MW reference wind turbine foroffshore system development. Tech. Rep. NREL/TP-500-38060, National Renewable Energy Laboratory, February.
[18] Jonkman, J., 2010. Definition of the floating system forPhase IV of OC3. Tech. Rep. NREL/TLP-500-47535.
[19] Jonkman, B. J., and Jonkman, J. M., 2010. Documentationof updates to FAST, A2AD, and AeroDyn: Released March31, 2010, including the revised AeroDyn interface. Tech.rep.
[20] Moriarty, P. J., and Hansen, A. C., 2005. AeroDyn theorymanual. Tech. Rep. NREL/TP-500-36881.
[21] Laino, D. J., Hansen, A. C., and Minnema, J. E., 2002.“Validation of the AeroDyn subroutines using NREL un-steady aerodynamics experiment data”. Wind Energy, 5,pp. 227–244.
[22] Larsen, T. J., and Hanson, T. D., 2007. “A method to avoidnegative damped low frequent tower vibrations for a float-ing, pitch controlled wind turbine”. Journal of Physics:Conference Series, The Second Conference on The Scienceof Making Torque from Wind, 75.
[23] Jonkman, B., 2009. TurbSim user’s guide: Version 1.50.Tech. Rep. NREL/TP-500-46198, National Renewable En-ergy Laboratory, September.
[24] Bachynski, E. E., Kvittem, M. I., Luan, C., and Moan,T., 2014. “Wind-wave misalignment effects on floatingwind turbines: motions and tower load effects”. Jour-nal of Offshore Mechanics and Arctic Engineering, 136,pp. 041902–1–041902–12.
[25] Kvittem, M. I., 2014. “Modelling and response analysis forfatigue design of a semi-submersible wind turbine”. PhDthesis, Norwegian University of Science and Technology.
12 Copyright c© 2016 by ASME