Real-time drought forecasting system for irrigation …
14
Hydrol. Earth Syst. Sci., 18, 3353–3366, 2014 www.hydrol-earth-syst-sci.net/18/3353/2014/ doi:10.5194/hess-18-3353-2014 © Author(s) 2014. CC Attribution 3.0 License. Real-time drought forecasting system for irrigation management A. Ceppi 1 , G. Ravazzani 1 , C. Corbari 1 , R. Salerno 2 , S. Meucci 3 , and M. Mancini 1 1 Department of Civil and Environmental Engineering (D.I.C.A.), Politecnico di Milano, Milan, Italy 2 Epson Meteo Centre, Cinisello Balsamo (Milan), Italy 3 M.M.I. srl, Milan, Italy Correspondence to: A. Ceppi ([email protected]) Received: 21 November 2013 – Published in Hydrol. Earth Syst. Sci. Discuss.: 23 December 2013 Revised: 4 July 2014 – Accepted: 23 July 2014 – Published: 5 September 2014 Abstract. In recent years frequent periods of water scarcity have enhanced the need to use water more carefully, even in European areas which traditionally have an abundant sup- ply of water, such as the Po Valley in northern Italy. In dry periods, water shortage problems can be enhanced by con- flicting uses of water, such as irrigation, industry and power production (hydroelectric and thermoelectric). Furthermore, in the last decade the social perspective in relation to this is- sue has been increasing due to the possible impact of climate change and global warming scenarios which emerge from the IPCC Fifth Assessment Report (IPCC, 2013). Hence, the in- creased frequency of drought periods has stimulated the im- provement of irrigation and water management. In this study we show the development and implemen- tation of the PREGI real-time drought forecasting sys- tem; PREGI is an Italian acronym that means “hydro- meteorological forecast for irrigation management”. The sys- tem, planned as a tool for irrigation optimization, is based on meteorological ensemble forecasts (20 members) at medium range (30 days) coupled with hydrological simulations of wa- ter balance to forecast the soil water content on a maize field in the Muzza Bassa Lodigiana (MBL) consortium in north- ern Italy. The hydrological model was validated against mea- surements of latent heat flux acquired by an eddy-covariance station, and soil moisture measured by TDR (time domain reflectivity) probes; the reliability of this forecasting system and its benefits were assessed in the 2012 growing season. The results obtained show how the proposed drought fore- casting system is able to have a high reliability of forecast at least for 7–10 days ahead of time. 1 Introduction A lack of water has always been one of the most critical fac- tors for the survival of populations around the world. The United Nations proclaimed the year 2003 as the international year of freshwater and the year 2006 as the international year of deserts and desertification, highlighting the importance of prevention, mitigation and adaption of events related to wa- ter supply. Future climate change scenarios combined with limited water resources require better irrigation management and planning (English et al., 2002; Farrè and Faci, 2009); this has also occurred in areas habitually with an abundant supply of water as the Po Valley in the north of Italy. Con- sidering historical climate data sets, recent studies demon- strate that there is not a significant decrease in the amount of precipitation, although a reduction in the last 20 years has been found over Italy (Salerno et al., 2007). However, a new and more frequent distribution of extreme events has been observed (Maugeri, 2006), as occurred in the most recent drought episodes of the years 2003, 2005 and 2006 in the Lombardy region (Craveri, 2006). Scientific literature provides interesting issues focused on the optimization of irrigation management also cou- pling meteorological and hydrological models. Examples of main international research are the CROPWAT (a com- puter program for irrigation planning and management) by Smith (1992), the EPIC-PHASE (Erosion Productivity Im- pact Calculator–phase) model developed at the centre of Toulouse (Cabelguenne et al., 1997), the real-time scheduled irrigation approach proposed by Gowing and Ejieji (2001) in the United Kingdom, the “eWarning” Danish warning system (Jensen and Thysen, 2003), real-time forecasts for daily evapotranspiration proposed by Cai et al. (2007) and Published by Copernicus Publications on behalf of the European Geosciences Union.
Transcript of Real-time drought forecasting system for irrigation …
Hydrol. Earth Syst. Sci., 18, 3353–3366, 2014www.hydrol-earth-syst-sci.net/18/3353/2014/doi:10.5194/hess-18-3353-2014© Author(s) 2014. CC Attribution 3.0 License.
Real-time drought forecasting system for irrigation management
A. Ceppi1, G. Ravazzani1, C. Corbari1, R. Salerno2, S. Meucci3, and M. Mancini1
1Department of Civil and Environmental Engineering (D.I.C.A.), Politecnico di Milano, Milan, Italy2Epson Meteo Centre, Cinisello Balsamo (Milan), Italy3M.M.I. srl, Milan, Italy
Correspondence to:A. Ceppi ([email protected])
Received: 21 November 2013 – Published in Hydrol. Earth Syst. Sci. Discuss.: 23 December 2013Revised: 4 July 2014 – Accepted: 23 July 2014 – Published: 5 September 2014
Abstract. In recent years frequent periods of water scarcityhave enhanced the need to use water more carefully, evenin European areas which traditionally have an abundant sup-ply of water, such as the Po Valley in northern Italy. In dryperiods, water shortage problems can be enhanced by con-flicting uses of water, such as irrigation, industry and powerproduction (hydroelectric and thermoelectric). Furthermore,in the last decade the social perspective in relation to this is-sue has been increasing due to the possible impact of climatechange and global warming scenarios which emerge from theIPCC Fifth Assessment Report (IPCC, 2013). Hence, the in-creased frequency of drought periods has stimulated the im-provement of irrigation and water management.
In this study we show the development and implemen-tation of the PREGI real-time drought forecasting sys-tem; PREGI is an Italian acronym that means “hydro-meteorological forecast for irrigation management”. The sys-tem, planned as a tool for irrigation optimization, is based onmeteorological ensemble forecasts (20 members) at mediumrange (30 days) coupled with hydrological simulations of wa-ter balance to forecast the soil water content on a maize fieldin the Muzza Bassa Lodigiana (MBL) consortium in north-ern Italy. The hydrological model was validated against mea-surements of latent heat flux acquired by an eddy-covariancestation, and soil moisture measured by TDR (time domainreflectivity) probes; the reliability of this forecasting systemand its benefits were assessed in the 2012 growing season.The results obtained show how the proposed drought fore-casting system is able to have a high reliability of forecast atleast for 7–10 days ahead of time.
1 Introduction
A lack of water has always been one of the most critical fac-tors for the survival of populations around the world. TheUnited Nations proclaimed the year 2003 as the internationalyear of freshwater and the year 2006 as the international yearof deserts and desertification, highlighting the importance ofprevention, mitigation and adaption of events related to wa-ter supply. Future climate change scenarios combined withlimited water resources require better irrigation managementand planning (English et al., 2002; Farrè and Faci, 2009);this has also occurred in areas habitually with an abundantsupply of water as the Po Valley in the north of Italy. Con-sidering historical climate data sets, recent studies demon-strate that there is not a significant decrease in the amountof precipitation, although a reduction in the last 20 years hasbeen found over Italy (Salerno et al., 2007). However, a newand more frequent distribution of extreme events has beenobserved (Maugeri, 2006), as occurred in the most recentdrought episodes of the years 2003, 2005 and 2006 in theLombardy region (Craveri, 2006).
Scientific literature provides interesting issues focusedon the optimization of irrigation management also cou-pling meteorological and hydrological models. Examplesof main international research are the CROPWAT (a com-puter program for irrigation planning and management) bySmith (1992), the EPIC-PHASE (Erosion Productivity Im-pact Calculator–phase) model developed at the centre ofToulouse (Cabelguenne et al., 1997), the real-time scheduledirrigation approach proposed by Gowing and Ejieji (2001)in the United Kingdom, the “eWarning” Danish warningsystem (Jensen and Thysen, 2003), real-time forecasts fordaily evapotranspiration proposed by Cai et al. (2007) and
Published by Copernicus Publications on behalf of the European Geosciences Union.
3354 A. Ceppi et al.: Real-time drought forecasting system for irrigation management
the Canterbury Irrigation Scheduler (CIS) by Brown etal. (2010). In the north of Italy the recurrence of waterstress periods requires an improvement in the managementand coordination of water courses (lakes, hydroelectric reser-voirs, rivers, etc.), together with testing other alternativesources, such as water withdrawals from large quarry lakes(Ravazzani et al., 2011a). This activity has contributed tothe better management of water distribution by water con-sortia according to season, different cultivation requests andtotal available water in lakes and snowpack. A prudent wa-ter distribution policy means wiser and thriftier methods ofirrigation, maximizing agricultural production (Hassanli etal., 2009; Oweis and Hachun, 2009; Geerts and Raes, 2009).However, these management policies are currently based onthe sensitivity and experience of consortia managers. A pol-icy of saving irrigation water would be helpful if districtswere subsequently affected by significant rainfall, but ex-tremely dangerous if no precipitation occurs in the followingweeks.
It is clear that the complexity of these matters related towater resources should be studied with a scientific and en-gineering approach, in order to be able to predict the occur-rence of potentially harmful droughts in advance; this issue isalso one of the main goals of the DROUGHT R&SPI (Fos-tering European Drought Research and Science–Policy In-terfacing,www.eu-drought.org) and DEWFORA (DroughtEarly Warning and Forecasting to strengthen preparednessand adaptation to droughts in Africa, www.dewfora.net)projects, which focus on drought early warning systems re-spectively on the European and African continents.
Scientific literature proposes different methods, more re-lated to statistical approaches, for optimizing irrigationscheduling and planning (Kuo and Liu, 2003; Negesh Kumaret al., 2006; Azamathulla et al., 2008; Vico and Porporato,2011, 2013), while the application suggested in this papertakes into account actual measures of soil moisture and ob-served weather data in addition to updated forecasts to pro-vide landowners with a suitable product for real-world farmprofit optimization, as well as cost savings for irrigation prac-tices: e.g. water volume, pumping system from ditches, fuelfor tractors and labour costs. Our task is to put the scien-tific know-how into practice as a tool for better irrigationmanagement and planning. In fact, working on the PREGIproject (PREGI is an Italian acronym that means “hydro-meteorological forecast for irrigation management”), fundedby the Lombardy region in the years 2010–2012, we discov-ered how irrigation practices in the Po Valley area are leftto very old strategies more related to landowner experiencesrather than scientific studies and engineering processes. Inthis context, an adoptable methodology is the one appliedfor real-time flood predictions (Rabuffetti et al., 2008; Ceppiat al., 2013), coupling meteorological forecasts with hydro-logical simulations. The knowledge of quantitative precipita-tion forecasts (QPFs) for the following weeks combined withthe updating of hydrological conditions makes it possible to
obtain a tool for water distribution management in cultivatedareas in order to improve irrigation scheduling, minimize ir-rigation costs and save water; therefore, to comply with thisaim, our idea was to create a web application where farm-ers are able to monitor real-time soil moisture conditions andforecasts.
The PREGI system is based on meteorological forecastsat medium range with hydrological simulations of water bal-ance to forecast the soil moisture at field scale. In particular,three TDR (time domain reflectivity) probes were installedto monitor soil moisture conditions, while to produce prob-abilistic soil moisture forecasts, the non-hydrostatic WRF-ARW (Weather Research and Forecasting–Advanced Re-search WRF) meteorological model based on 20 ensemblemembers with 1 month as the forecast horizon provided byEpson Meteo Centre (EMC) was coupled with the FEST-WB (Flash-flood Event-based Spatially distributed rainfall-runoff Transformation–Water Balance) distributed hydrolog-ical model developed at Politecnico di Milano (POLIMI),and used to generate soil moisture simulations.
The area of study is a maize field in the Muzza Bassa Lodi-giana (MBL) consortium in the Po Valley (northern Italy),used as an experimental test site for the PREGI tool. A cal-ibration phase was carried out for the 2010 and 2011 grow-ing seasons, while a validation was performed in the 2012season, when it was also possible to couple hydrologicalsimulations with meteorological forecasts in order to obtainsoil moisture predictions; the results of this forecasting chainshow a high reliability of up to 7–10 days as the lead timeof forecasts. Notwithstanding this, during the 2012 seasonthe PREGI system was not fully employed by the landownerof the experimental field, and the decision-making criteriadid not follow the indications highlighted in the PREGI plat-form; in fact, as shown in Sect. 3.3, a better management ofwater distribution could have been carried out and even onescheduled irrigation could have been saved.
2 Case study, models and methods
2.1 Area of study
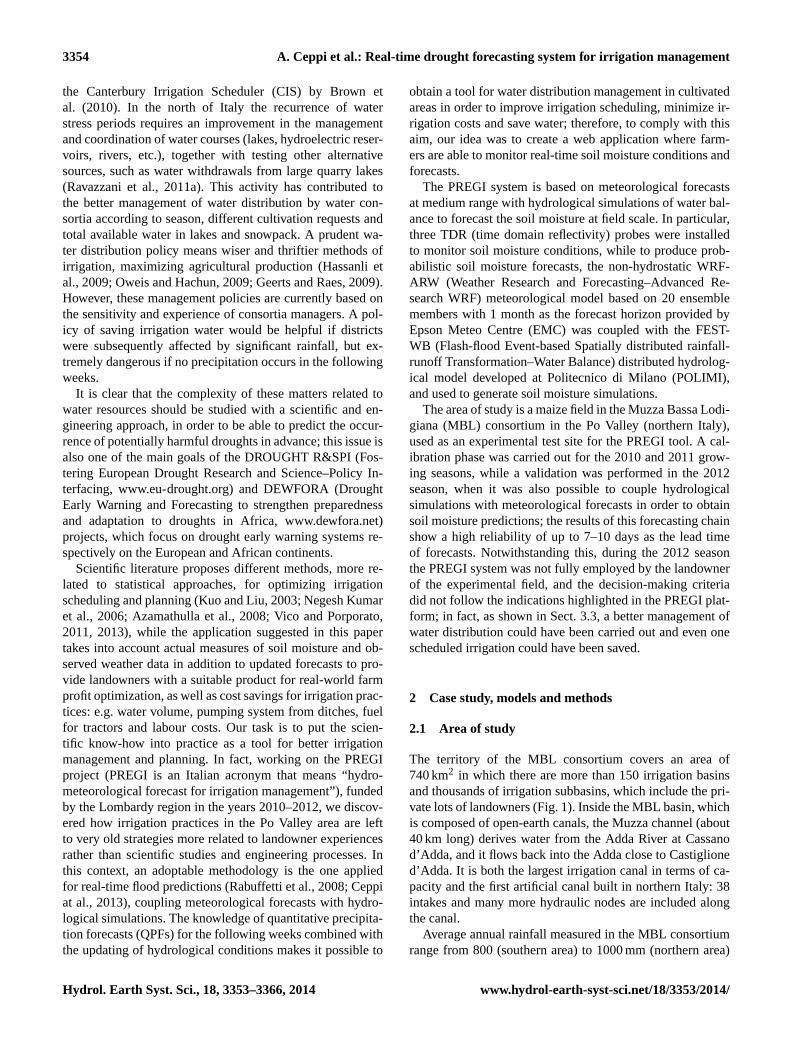
The territory of the MBL consortium covers an area of740 km2 in which there are more than 150 irrigation basinsand thousands of irrigation subbasins, which include the pri-vate lots of landowners (Fig. 1). Inside the MBL basin, whichis composed of open-earth canals, the Muzza channel (about40 km long) derives water from the Adda River at Cassanod’Adda, and it flows back into the Adda close to Castiglioned’Adda. It is both the largest irrigation canal in terms of ca-pacity and the first artificial canal built in northern Italy: 38intakes and many more hydraulic nodes are included alongthe canal.
Average annual rainfall measured in the MBL consortiumrange from 800 (southern area) to 1000 mm (northern area)
Hydrol. Earth Syst. Sci., 18, 3353–3366, 2014 www.hydrol-earth-syst-sci.net/18/3353/2014/
A. Ceppi et al.: Real-time drought forecasting system for irrigation management 3355
Figure 1. The Lombardy region in the north of Italy (left) and theMBL consortium with its irrigation subbasins (right). The Livragatest site is shown with a red dot, while the available rain gaugestations of the Lombardy ARPA and Meteonetwork–EMC networkused as input into the FEST-WB hydrological model are shown withblue dots.
with two peaks in spring and autumn (Ceriani and Carelli,2000). During the summer season most of the water supplycomes from the irrigation network. The upper-medium partof the basin is irrigated by flowing surface water, while, inthe bottom part of the basin, water is taken and lifted by theAdda and Po rivers through proper pumping systems.
The experimental test site for the PREGI project is a fieldlocated in the middle of the MBL basin at Cascina Nuovafarm in the town of Livraga, where meteorological, eddy-covariance stations and TDR probes for evapotranspirationfluxes and soil moisture profile, respectively, have been in-stalled to measure hydrological processes (Masseroni et al.,2012). Since no measures in other consortium fields wereavailable to calibrate and validate the hydrological model,it was not possible to verify the PREGI forecasting sys-tem outside the Livraga experimental site. Notwithstandingthis, such a system can be replicated in any geographicalarea and vegetated field, on the condition that soil features,weather, hydrological data and irrigation time allotments areavailable.
2.2 Meteorological model
The probabilistic forecast was provided by the Regional En-semble Prediction System (REPS), based on the WRF-ARWmodel, implemented and developed by the EMC. The REPS-WRF used in this project has a grid mesh size of 18 km, 36vertical levels and 20 members; boundary and initial condi-tions are provided by the Global Ensemble Prediction Sys-tem (GEPS) based on a modified version of the WRF-ARWapplied at the global scale, which has a grid mesh size of200 km and the same number of vertical levels as the REPS,and it uses the same initial conditions in the control runs
provided by the 12:00 UTC GFS (Global Forecasting Sys-tem) analysis at 0.5◦ of horizontal resolution. The forecasthas a lead time of 30 days, while the temporal resolution is12 h. Each perturbation of the ensemble is produced by analgorithm developed by the EMC based on a special appli-cation of ensemble transform Kalman filter (EnTKF), ableto allow covariance localization whilst maintaining computa-tional efficiency and removing spurious long-range correla-tions. The REPS-WRF is carried out every 2 days, since thisis the computational time to run the combined system. TheREPS-WRF run starts at 00:00 UTC, the same start time asthe hydrological simulation. For a detailed description of theWRF model, please refer to Skamarock and Klemp (2008).
2.3 Hydrological model and required data
In this study, hydrological simulations are performed us-ing the FEST-WB, a rainfall-runoff spatially distributed andphysically based model, whose development was initiated bythe Politecnico di Milano in 1990.
The FEST-WB calculates the main processes of the hydro-logical cycle: evapotranspiration, infiltration, surface runoff,flow routing, subsurface flow, snow dynamics and soil watercontent. The model requires observed precipitation and airtemperature data from ground stations, which are both inter-polated to a regular grid using the inverse distance weightingtechnique or forecasted weather data. The spatial domain isdiscretized with a mesh of regular square cells (200 m in thisapplication), while the temporal resolution of soil moisturesimulations and forecasts is calculated on a daily timescale;since the Livraga maize field is about 8 ha wide and thelandowner schedules his activities on daily/weekly planning,both the spatial and timescale turned out to be appropriatefrom a computational time point of view.
In addition to (observed/forecasted) weather data, the hy-drological model needs further information to be set up, suchas land use, soil texture, hydraulic conductivity (Ks), typeof vegetation (dates of sowing and harvest), DEM (digitalelevation model), aquifer parameters and scheduled irriga-tions. In particular, amounts and methods of water allotmentsare fundamental to keep updated soil moisture initial condi-tions. In fact, since irrigation allotments are planned by theMBL consortium, landowners cannot irrigate their fields ondays other than the scheduled ones, because each field of theMuzza consortium has its own scheduled irrigation followingcenturies-old time tables where planned water allotments aredetermined in advance; therefore, this information becomesmandatory in the hydro-meteorological forecasting chain. Atthe Livraga experimental field this is available every week;i.e. the landowner has the possibility of withdrawing waterfrom the nearest irrigation ditch every 7 days. For instance,the potential water concession for the Cascina Nuova farm is650 L s−1 taken from the “Porra Nuova” ditch, but, consider-ing that the irrigation efficiency of the Muzza basin is about45 % of the theoretical value, the available water discharge is
www.hydrol-earth-syst-sci.net/18/3353/2014/ Hydrol. Earth Syst. Sci., 18, 3353–3366, 2014
3356 A. Ceppi et al.: Real-time drought forecasting system for irrigation management
only about 300 L s−1. Since this volume of water is used toirrigate our experimental field of 8 ha in about 8 h, the esti-mated irrigation input implemented in the FEST-WB modelwas assumed to be equal to 108 mm.
As far as soil information is concerned, in situ field testscarried out during the PREGI project have classified the soiltexture as silt loam; in particular, a content of 19.2 % clay,48.1 % silt and 32.7 % sand was found in soil analyses. Ta-ble 1 summarizes the main soil properties for the Livragamaize field: a tuning of these values inside the interval rangereported in Maidment (1993) was carried out to calibrate andimplement the FEST-WB hydrological model.
Another important parameter to define in the hydrologi-cal model is soil depth, which has been modelled as a sin-gle layer with a value of 0.7 m, considering the predominantgrowing zone of maize roots; consequently the three TDRprobes were installed at 10, 35 and 70 cm depth. Finally,different measures of permeability were performed with theGuelph infiltrometer (Eijkekalmp, 2011) to investigate theKs, which was found to be equal to 2.36× 10⁻⁷ m s−1 in theexperimental field.
As described in the results (Sect. 3), observed and fore-casted soil moisture data are influenced by rainfall, irrigationcontributions and evapotranspiration fluxes which denotemain inflows and outflows in water balance at the Livragafield scale. Evapotranspiration losses play a crucial role in thewater balance during the summer season in the Po Valley areawhere cumulated values exceed 300 mm in 4 months (seeFigs. 2b, d, f). Eddy-covariance measures were used to con-trol actual evapotranspiration (ET) fluxes and to make a com-parison with the ET simulated by the FEST-WB model (seeSect. 3.1 for further details). When eddy-covariance mea-sures are not available, the system target would not in anycase be affected, since the main hydrological variable is thesoil moisture, and TDR probes are sufficient for monitoringand forecasting purposes. However, the limits of such a sys-tem, in order to be replicated in other areas, are the avail-ability of real-time data (weather and soil moisture values),amounts and scheduled irrigation allotments.
In the current version of the FEST-WB model, evapotran-spiration is computed according to a revised version of theFood and Agricultural Organization (FAO-56) method (Allenet al., 1998). The original approach is based on the use of thePenman–Monteith equation (Monteith, 1965) to calculate areference evapotranspiration (ET0) of a surface defined as an“hypothetical crop with an assumed height of 0.12 m, hav-ing a surface resistance of 70 s m−1 and an albedo of 0.23,closely resembling the evaporation of an extensive surfaceof green grass of uniform height, actively growing and ad-equately watered” (Allen et al., 1998). In this paper, due tothe availability of only air temperature meteorological fore-casts, the Penman–Monteith equation is substituted with amodified Hargreaves and Samani equation (Hargreaves andSamani, 1985) which includes a correction factor for alti-tude (Ravazzani et al., 2012). In Ravazzani et al. (2012),
the reliability of this modified equation to compute ET0 hasbeen demonstrated. Subsequently, the crop coefficient (kc),which embodies all the physiologic characteristics of a spe-cific plant, allows passing from ET0 to the potential evapo-transpiration of a specific crop. Allen et al. (1998) createda database ofkc for a large number of agricultural crops indifferent climates, including maize. Crop coefficient valuesare assigned by defining the length of phenological phasesconsidering the sowing and reaping dates for each year. Forfurther details about the development and calibration of theFEST-WB, please refer to Montaldo et al. (2003, 2007),Ravazzani et al. (2007, 2011b), Corbari et al. (2011) andRavazzani (2013).
2.4 Coupling strategy and warning thresholds
The cascade forecasting system applied in this study iscurrently based on hydrological model initialization frommeteorological model output: temperature and precipitationforecasts.
Before launching the coupled system, the hydrologicalmodel is initialized with observed weather data of the pre-vious day, provided by the ARPA (Regional Agency forEnvironmental Protection) of the Lombardy region andMeteonetwork–EMC meteorological station network to setup the initial soil moisture conditions. In order to better un-derstand the developed forecasting chain, an example of eachstep of the operative chain is detailed in Table 2.
This coupling of hydro-meteorological models to irriga-tion scheduling knowledge provides advance informationon soil moisture content and expected cumulated precipita-tion for irrigation management and water control from 1 to30 days as a forecast horizon.
In order to issue warnings regarding soil moisture fore-casts, two thresholds were defined in the PREGI system: oneis the water surplus equal to the field capacity of the soil andthe other is the stress threshold, where below this point thecrop begins to suffer because of a lack of water. According tothe FAO-56 definition (Allen, et al., 1998) and also appliedin Baroni et al. (2010) the latter is calculated as follows (1):
RAW = p · TAW, (1)
where RAW is the readily available water, defined as fieldcapacity minus stress threshold; TAW is the total availablewater, defined as field capacity minus wilting point; andp isa coefficient depending on the crop and climatic parameterswhich can be assumed to be equal to 0.5 for maize (Allen etal., 1998) in the Livraga field. Therefore, the Eq. (1) becomes
field capacity− stress threshold
= p · (field capacity− wilting point). (2)
Hydrol. Earth Syst. Sci., 18, 3353–3366, 2014 www.hydrol-earth-syst-sci.net/18/3353/2014/
A. Ceppi et al.: Real-time drought forecasting system for irrigation management 3357
Table 1.Water-retention properties classified for a silt loam soil type (Maidment, 1993).
Total Residual water Pore size Wilting Field Bubblingporosity (φ) content (θr) distribution (λ) point capacity pressure (hb)
0.501 0.015 0.234 0.133 0.330 0.2076
23
1
a)
b)
c)
d)
e)
f)
2
Fig. 2: The left graphs (a, c, e) show the comparison between observed (red line) and simulated 3
(blue line) soil moisture values by the FEST-WB model at the Livraga maize field for the 2010, 4
2011 and 2012 growing season; precipitation (blue bars) and irrigation (orange bars) amounts are 5
shown in light blue histograms. The right graphs (b, d, f) show the comparison between observed 6
(red line) and simulated (blue line) actual cumulated evapotranspiration values by the FEST-WB 7
model. Unfortunately, some observed data are missing due to storage battery problems in the three-8
year project. 9
0
20
40
60
80
100
1200.15
0.20
0.25
0.30
0.35
0.40
0.45
0.50
26/0
5/2
01
0
02/0
6/2
01
0
09/0
6/2
01
0
16/0
6/2
01
0
23/0
6/2
01
0
30/0
6/2
01
0
07/0
7/2
01
0
14/0
7/2
01
0
21/0
7/2
01
0
28/0
7/2
01
0
04/0
8/2
01
0
11/0
8/2
01
0
18/0
8/2
01
0
25/0
8/2
01
0
01/0
9/2
01
0
08/0
9/2
01
0
15/0
9/2
01
0
Rain
fall +
Irr
igati
on
[m
m]
So
il m
ois
ture
[-]
Days
Rainfall
Irrigation
Simulated by FEST-WB
Observed0
50
100
150
200
250
300
350
26/0
5/2
01
0
02/0
6/2
01
0
09/0
6/2
01
0
16/0
6/2
01
0
23/0
6/2
01
0
30/0
6/2
01
0
07/0
7/2
010
14/0
7/2
010
21/0
7/2
01
0
28/0
7/2
01
0
04/0
8/2
01
0
11/0
8/2
01
0
18/0
8/2
01
0
25/0
8/2
01
0
01/0
9/2
01
0
08/0
9/2
01
0
15/0
9/2
01
0
Cu
mu
late
d E
vap
otr
asp
ira
tio
n [
mm
]
Days
Observed
Simulated by FEST-WB
0
20
40
60
80
100
1200.15
0.20
0.25
0.30
0.35
0.40
0.45
0.50
11/0
5/2
01
1
18/0
5/2
01
1
25/0
5/2
01
1
01/0
6/2
01
1
08/0
6/2
01
1
15/0
6/2
01
1
22/0
6/2
01
1
29/0
6/2
01
1
06/0
7/2
01
1
13/0
7/2
01
1
20/0
7/2
01
1
27/0
7/2
01
1
03/0
8/2
01
1
10/0
8/2
01
1
17/0
8/2
01
1
24/0
8/2
01
1
31/0
8/2
01
1
07/0
9/2
01
1
14/0
9/2
01
1
Rain
fall +
Irr
igati
on
[m
m]
So
il m
ois
ture
[-]
Days
Rainfall
Irrigation
Observed
Simulated by FEST-WB
0
50
100
150
200
250
300
350
11/0
5/2
01
1
18/0
5/2
01
1
25/0
5/2
01
1
01/0
6/2
01
1
08/0
6/2
01
1
15/0
6/2
01
1
22/0
6/2
01
1
29/0
6/2
01
1
06/0
7/2
01
1
13/0
7/2
01
1
20/0
7/2
01
1
27/0
7/2
01
1
03/0
8/2
01
1
10/0
8/2
01
1
17/0
8/2
01
1
24/0
8/2
01
1
31/0
8/2
01
1
07/0
9/2
01
1
14/0
9/2
01
1
Cu
mu
late
d E
vap
otr
asp
ira
tio
n [
mm
]
Days
Observed
Simulated by FEST-WB
0
20
40
60
80
100
1200.15
0.20
0.25
0.30
0.35
0.40
0.45
0.50
25/0
4/2
01
2
02/0
5/2
01
2
09/0
5/2
01
2
16/0
5/2
01
2
23/0
5/2
01
2
30/0
5/2
01
2
06/0
6/2
01
2
13/0
6/2
01
2
20/0
6/2
01
2
27/0
6/2
01
2
04/0
7/2
01
2
11/0
7/2
01
2
18/0
7/2
01
2
25/0
7/2
01
2
01/0
8/2
01
2
08/0
8/2
01
2
15/0
8/2
01
2
22/0
8/2
01
2
29/0
8/2
01
2
Rain
fall +
Irr
igati
on
[m
m]
So
il m
ois
ture
[-]
Days
Rainfall
Irrigation
Observed
Simulated by FEST-WB
0
50
100
150
200
250
300
350
25/0
4/2
012
02/0
5/2
01
2
09/0
5/2
01
2
16/0
5/2
01
2
23/0
5/2
01
2
30/0
5/2
01
2
06/0
6/2
01
2
13/0
6/2
01
2
20/0
6/2
01
2
27/0
6/2
01
2
04/0
7/2
01
2
11/0
7/2
012
18/0
7/2
01
2
25/0
7/2
01
2
01/0
8/2
01
2
08/0
8/2
01
2
15/0
8/2
01
2
22/0
8/2
01
2
29/0
8/2
01
2
Cu
mu
late
d E
vap
otr
asp
ira
tio
n [
mm
]
Days
Observed
Simulated by FEST-WB
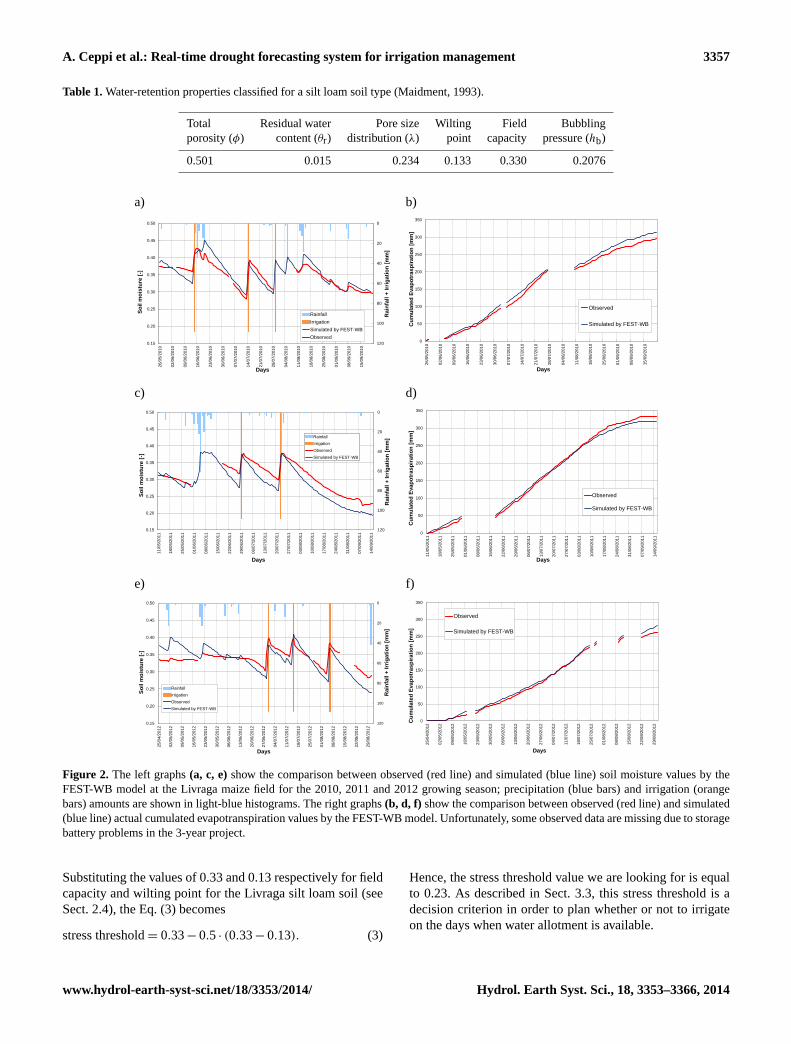
Figure 2. The left graphs(a, c, e)show the comparison between observed (red line) and simulated (blue line) soil moisture values by theFEST-WB model at the Livraga maize field for the 2010, 2011 and 2012 growing season; precipitation (blue bars) and irrigation (orangebars) amounts are shown in light-blue histograms. The right graphs(b, d, f) show the comparison between observed (red line) and simulated(blue line) actual cumulated evapotranspiration values by the FEST-WB model. Unfortunately, some observed data are missing due to storagebattery problems in the 3-year project.
Substituting the values of 0.33 and 0.13 respectively for fieldcapacity and wilting point for the Livraga silt loam soil (seeSect. 2.4), the Eq. (3) becomes
stress threshold= 0.33− 0.5 · (0.33− 0.13). (3)
Hence, the stress threshold value we are looking for is equalto 0.23. As described in Sect. 3.3, this stress threshold is adecision criterion in order to plan whether or not to irrigateon the days when water allotment is available.
www.hydrol-earth-syst-sci.net/18/3353/2014/ Hydrol. Earth Syst. Sci., 18, 3353–3366, 2014
3358 A. Ceppi et al.: Real-time drought forecasting system for irrigation management
Table 2. Description of the forecasting chain coupling the meteorological and hydrological model. The action time is reported in UTC(Coordinated Universal Time), while the time delay after the first step of the operative chain is reported in hours and minutes (hh:mm).
Day and Time delay aftertime the start of the[UTC] chain [hh:mm] Action
Day 1 at 00:00 – The REPS-WRF model is launched by the EMC
Day 3 at 12:00 60:00 The REPS-WRF model outputs are uploaded on the POLIMI server
Day 3 at 13:00 61:00 Observed weather data of the previous day provided by the Lombardy ARPAand Meteonetwork–EMC meteorological station network are available on thePOLIMI server
Day 3 at 13:30 61:30 The FEST-WB model is launched with observed weather data of the previousday to produce initial conditions
Day 3 at 14:00 62:00 Once initial conditions are obtained, the FEST-WB model is now initializedwith the REPS-WRF probabilistic forecasts to produce soil moisture forecasts
Day 3 at 16:00 64:00 Soil moisture forecasts are uploaded on the Google Maps platform purposelydeveloped
2.5 Statistical indexes
Common skill scores in scientific literature are used tocompare soil moisture simulations between observed andsimulated values by the FEST-WB model initialized withobserved values and weather data forecasted by the REPS-WRF model; since the WRF is a probabilistic model with 20ensemble members, the median value is chosen for analysisclarity. In particular, results described in Sect. 3.2 include themean relative error (MRE) – calculated as (Eq.4)
MRE =1
n
n∑i=1
(Fi − Oi
Oi
), (4)
whereOi represents observed values,Fi represents medianof forecasted values andn represents numbers of analysedevents – and the NS index (Nash and Sutcliffe, 1970):
NS= 1−
n∑i=1
(Oi − Fi)2
n∑i=1
(Oi − O)2, (5)
whereO represents the average of observed values, whichshows how well the forecast predicts the observed time se-ries, with best scores close to 1, and a range between−∞
and 1. In this study, Eq. (5) measures the ratio between thedeviations of forecasted median values by the FEST-WB hy-drological model initialized by 20 ensembles of the REPS-WRF model with observed values and the deviation betweenthe observed mean and observed values.
Another skill score used in this study is the Brier score(BS), which is essentially the mean-squared error of the prob-ability forecasts, considering that the observation iso = 1 if
the event occurs ando = 0 if the event does not occur. Thescore averages the squared differences between pairs of fore-cast probabilities and the subsequent observations (Wilks,2006). Equation (6) for the BS score is
BS=1
n
n∑k=1
(Fk − Ok)2, (6)
whereN represents number of forecasting instances,Fk rep-resents the probability that an event was forecasted andOk
represents the actual outcome of the event at instancek (0 ifit does not happen and 1 if it happens).
For instance, supposing that the forecast probability to ex-ceed a threshold of cumulated rainfall is 70 % and then thisevent occurs, the BS score is equal to 0.09; vice versa, ifit does not occur, then the BS score is 0.49; therefore, bestscores are close to 0. In this analysis, three thresholds werechosen: 20, 50 and 100 mm; these last two values are reason-ably similar to half and full irrigation in the Livraga maizefield, while the 20 mm threshold corresponds to typical pre-cipitation amounts in that area, which is not usually affectedby heavy rainfall in the summer season, as occurred in 2012.It is important to bear in mind that this computation, per-formed with the entire forecast data set, does not refer todaily precipitation values, but rather cumulated precipitationvalues over a period of 1, 2, 3, . . . , 30 days. For instance,the BS score at the the 7th day as the lead time considers theoccurrence probability of a cumulated precipitation forecastover a period of 7 days to exceed the threshold of 20, 50 or100 mm (occurring over the same time period of 7 days).
Hydrol. Earth Syst. Sci., 18, 3353–3366, 2014 www.hydrol-earth-syst-sci.net/18/3353/2014/
A. Ceppi et al.: Real-time drought forecasting system for irrigation management 3359
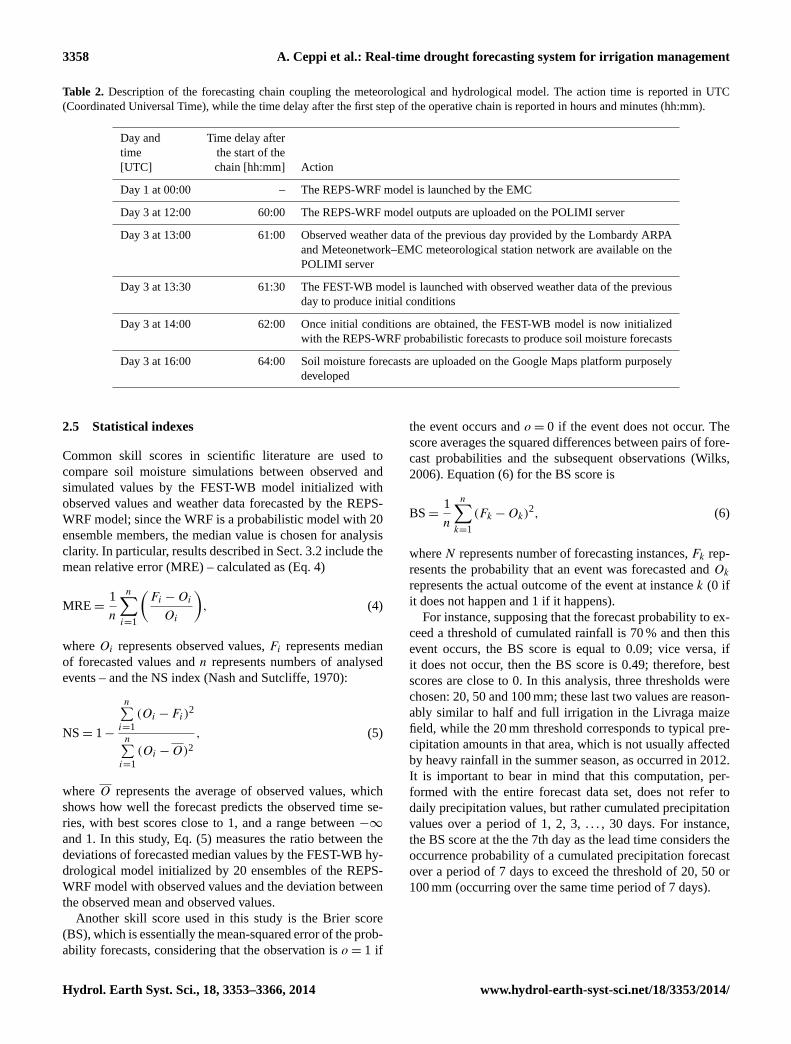
Figure 3. The mean relative error for soil moisture between the ob-served data and the median of all the FEST-WB simulations initial-ized with the 20 ensembles of the REPS-WRF model for the 2012growing season over a period of more lead time days.
3 Results and discussion
3.1 Calibration and validation of the FEST-WB modelusing observed data
The 2010–2012 period was used to calibrate and validatethe hydrological model with data acquired at Cascina Nuovafield in Livraga, where one eddy-covariance station and threeTDR probes were installed to monitor evapotranspirationfluxes and soil moisture content. Figure 2 shows the com-parison between values measured (red line) by TDR probes(in reality, it is a weighted average of the three measures ata depth of 10, 35 and 70 cm) and data simulated (blue line)by the FEST-WB model during the three growing seasons of2010, 2011 and 2012, including rainfall (light-blue bars) andirrigation (orange bars) amounts in the Livraga maize field.
As far as the 2010 season is concerned, Fig. 2a shows howsoil moisture data are well associated with rainfall and ir-rigation inputs, with a MAE of 4 % and MRE of+1 %; agood match between observed and modelled simulation datais also shown in Fig. 2b for the actual cumulated evapotran-spiration. In addition, Fig. 2a shows how the first seasonal ir-rigation (14 June 2010) could have been avoided if soil mois-ture and precipitation forecasts had been known in advance;in fact, severe rainfall (about 85 mm) occurred between 15and 20 June, with a maximum peak of 45 mm on 15 June(the day after the irrigation!). Unfortunately, in that year thePREGI tool with hydro-meteorological forecasts was not yetin service and it was only available for the 2012 vegetationseason.
In regard to the 2011 season, satisfactory results are foundbetween observed and simulated values in terms both of soilmoisture (MAE equal to 8 %, Fig. 2c) and cumulated evap-otranspiration (Fig. 2d), even if an underestimation is gener-ally present (MRE of−8 %) in simulated soil moisture val-ues, mainly due to higher rates in evapotranspiration.
Figure 4. The NS index for rainfall and irrigation amounts betweenthe observed data and the median of 20 ensembles of the REPS-WRF model for the 2012 growing season over a period of morelead time days.
Figure 5. Brier score index for the three thresholds of cumulatedrainfall: 20 mm (blue line), 50 mm (red line) and 100 mm (greenline) for the 2012 growing season over a period of more lead timedays.
After 2 years of calibration (2010 and 2011), the validationof the FEST-WB model is carried out for the 2012 growingseason at the Livraga field. The performance of the validation(Fig. 2e) shows a good match between model and observa-tions, with a MAE of 7 % and MRE of−1 %. A slight under-estimation of the FEST-WB is generally present except at thebeginning of the season; however, the hydrological model,initialized with observed values by the Lombardy ARPA andMeteonetwork–EMC weather stations, was able to simulatesoil moisture conditions with a daily error within 10 %, inparticular during the irrigation period between June and Au-gust. Even the comparison between observed (red line) andsimulated (blue line) data for the real cumulated evapotran-spiration (Fig. 2f) indicates a good correspondence duringthe 2012 growing season.
www.hydrol-earth-syst-sci.net/18/3353/2014/ Hydrol. Earth Syst. Sci., 18, 3353–3366, 2014
3360 A. Ceppi et al.: Real-time drought forecasting system for irrigation management
a)
b)
c)
d)
e)
f)
g)
h)
i)
j)
1
0
20
40
60
80
1000.200.220.240.260.280.300.320.340.360.380.400.420.44
28/0
6/20
12
29/0
6/20
12
30/0
6/20
12
01/0
7/20
12
02/0
7/20
12
03/0
7/20
12
04/0
7/20
12
05/0
7/20
12
06/0
7/20
12
Prec
ipita
tion
+ Irr
igat
ion
[mm
]
Soil
Moi
stur
e [-
]
Lead time of forecast [days]
Issue of 2012-06-28Valid from 2012-06-28 to 2012-07-06
Irrigation
SM percentile 25th
SM median
SM mean
SM percentile 75th
stress index
surplus index
Median cumulatedprecipitationforecast
0
20
40
60
80
1000.200.220.240.260.280.300.320.340.360.380.400.420.44
28/0
6/20
12
29/0
6/20
12
30/0
6/20
12
01/0
7/20
12
02/0
7/20
12
03/0
7/20
12
04/0
7/20
12
05/0
7/20
12
06/0
7/20
12
Prec
ipita
tion
+ Irr
igat
ion
[mm
]
Soil
Moi
stur
e [ -
]
Lead time of forecast [days]
Issue of 2012-06-28Valid from 2012-06-28 to 2012-07-06
Irrigation
SM percentile 25th
SM median
SM mean
SM percentile 75th
stress index
surplus index
Median cumulatedprecipitationforecast
0
20
40
60
80
1000.200.220.240.260.280.300.320.340.360.380.400.420.44
12/0
7/20
12
13/0
7/20
12
14/0
7/20
12
15/0
7/20
12
16/0
7/20
12
17/0
7/20
12
18/0
7/20
12
19/0
7/20
12
20/0
7/20
12
21/0
7/20
12
Prec
ipita
tion
+ Irr
igat
ion
[mm
]
Soil
Moi
stur
e [-
]
Lead time of forecast [days]
Issue of 2012-07-12Valid from 2012-07-12 to 2012-07-21
Irrigation
SM percentile 25th
SM median
SM mean
SM percentile 75th
stress index
surplus index
Median cumulatedprecipitationforecast
0
20
40
60
80
1000.200.220.240.260.280.300.320.340.360.380.400.420.44
12/0
7/20
12
13/0
7/20
12
14/0
7/20
12
15/0
7/20
12
16/0
7/20
12
17/0
7/20
12
18/0
7/20
12
19/0
7/20
12
20/0
7/20
12
21/0
7/20
12
Prec
ipita
tion
+ Irr
igat
ion
[mm
]
Soil
Moi
stur
e [ -
]
Lead time of forecast [days]
Issue of 2012-07-12Valid from 2012-07-12 to 2012-07-21
Irrigation
SM percentile 25th
SM median
SM mean
SM percentile 75th
stress index
surplus index
Median cumulatedprecipitationforecast
0
20
40
60
80
1000.200.220.240.260.280.300.320.340.360.380.400.420.44
20/0
7/20
12
21/0
7/20
12
22/0
7/20
12
23/0
7/20
12
24/0
7/20
12
25/0
7/20
12
26/0
7/20
12
27/0
7/20
12
28/0
7/20
12
Prec
ipita
tion
+ Irr
igat
ion
[mm
]
Soil
Moi
stur
e [-
]
Lead time of forecast [days]
Issue of 2012-07-20Valid from 2012-07-20 to 2012-07-28
Irrigation
SM percentile 25th
SM median
SM mean
SM percentile 75th
stress index
surplus index
Median cumulatedprecipitationforecast
0
20
40
60
80
1000.200.220.240.260.280.300.320.340.360.380.400.420.44
20/0
7/20
12
21/0
7/20
12
22/0
7/20
12
23/0
7/20
12
24/0
7/20
12
25/0
7/20
12
26/0
7/20
12
27/0
7/20
12
28/0
7/20
12
Prec
ipita
tion
+ Irr
igat
ion
[mm
]
Soil
Moi
stur
e [ -
]
Lead time of forecast [days]
Issue of 2012-07-20Valid from 2012-07-20 to 2012-07-28
Irrigation
SM percentile 25th
SM median
SM mean
SM percentile 75th
stress index
surplus index
Median cumulatedprecipitationforecast
0
20
40
60
80
1000.200.220.240.260.280.300.320.340.360.380.400.420.44
05/0
8/20
12
06/0
8/20
12
07/0
8/20
12
08/0
8/20
12
09/0
8/20
12
10/0
8/20
12
11/0
8/20
12
12/0
8/20
12
Prec
ipita
tion
+ Irr
igat
ion
[mm
]
Soil
Moi
stur
e [-
]
Lead time of forecast [days]
Issue of 2012-08-05Valid from 2012-08-05 to 2012-08-12
Irrigation
SM percentile 25th
SM median
SM mean
SM percentile 75th
stress index
surplus index
Median cumulatedprecipitationforecast
0
20
40
60
80
1000.200.220.240.260.280.300.320.340.360.380.400.420.44
11/0
8/20
12
12/0
8/20
12
13/0
8/20
12
14/0
8/20
12
15/0
8/20
12
16/0
8/20
12
17/0
8/20
12
18/0
8/20
12
19/0
8/20
12
20/0
8/20
12
Prec
ipita
tion
+ Irr
igat
ion
[mm
]
Soil
Moi
stur
e [-
]
Lead time of forecast [days]
Issue of 2012-08-11Valid from 2012-08-11 to 2012-08-20
Irrigation
SM percentile 25th
SM median
SM mean
SM percentile 75th
stress index
surplus index
Median cumulatedprecipitationforecast
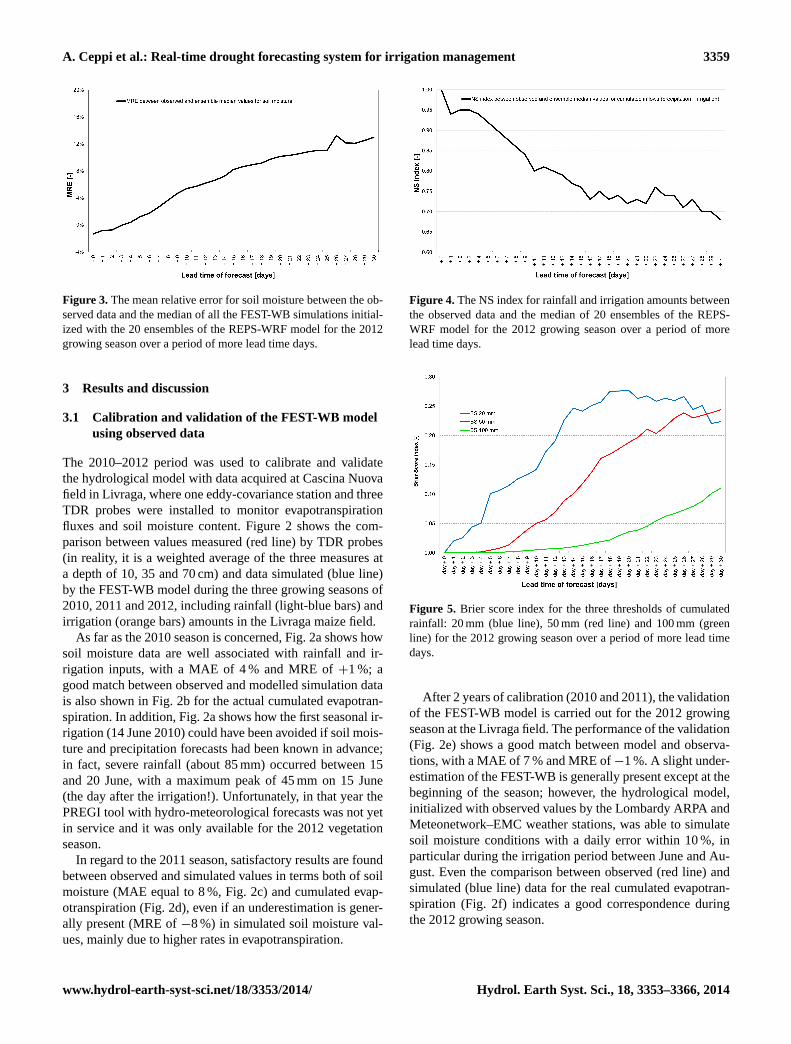
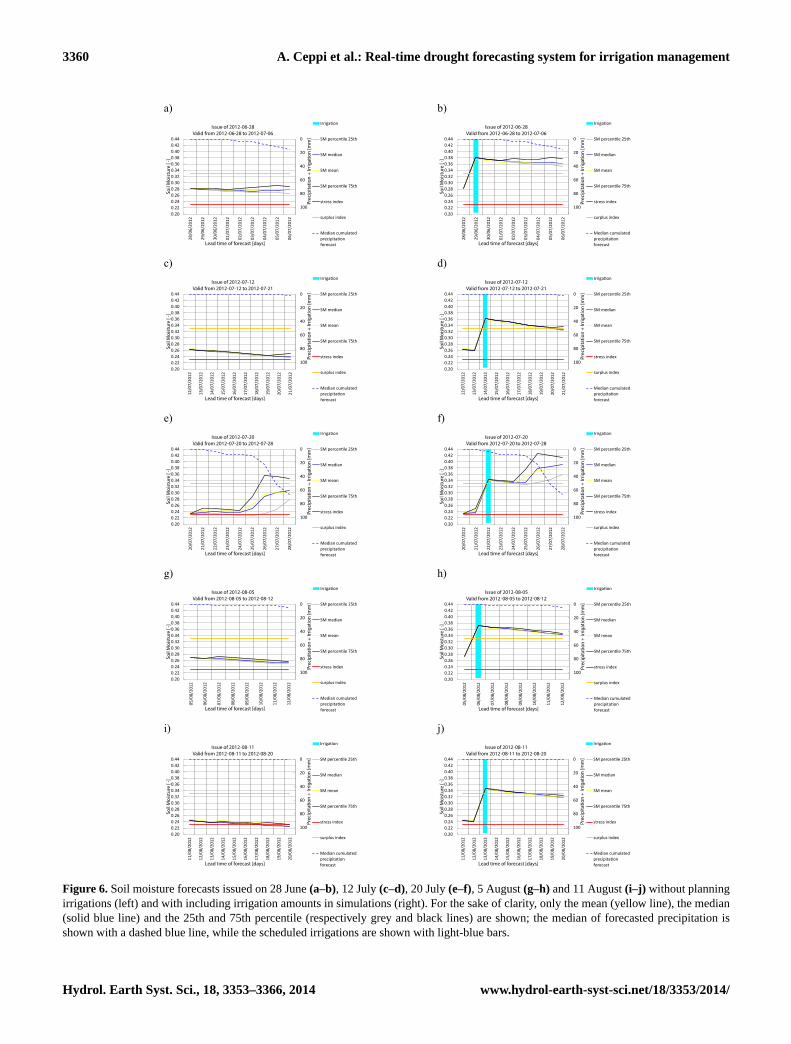
Figure 6. Soil moisture forecasts issued on 28 June(a–b), 12 July(c–d), 20 July(e–f), 5 August(g–h)and 11 August(i–j) without planningirrigations (left) and with including irrigation amounts in simulations (right). For the sake of clarity, only the mean (yellow line), the median(solid blue line) and the 25th and 75th percentile (respectively grey and black lines) are shown; the median of forecasted precipitation isshown with a dashed blue line, while the scheduled irrigations are shown with light-blue bars.
Hydrol. Earth Syst. Sci., 18, 3353–3366, 2014 www.hydrol-earth-syst-sci.net/18/3353/2014/
A. Ceppi et al.: Real-time drought forecasting system for irrigation management 3361
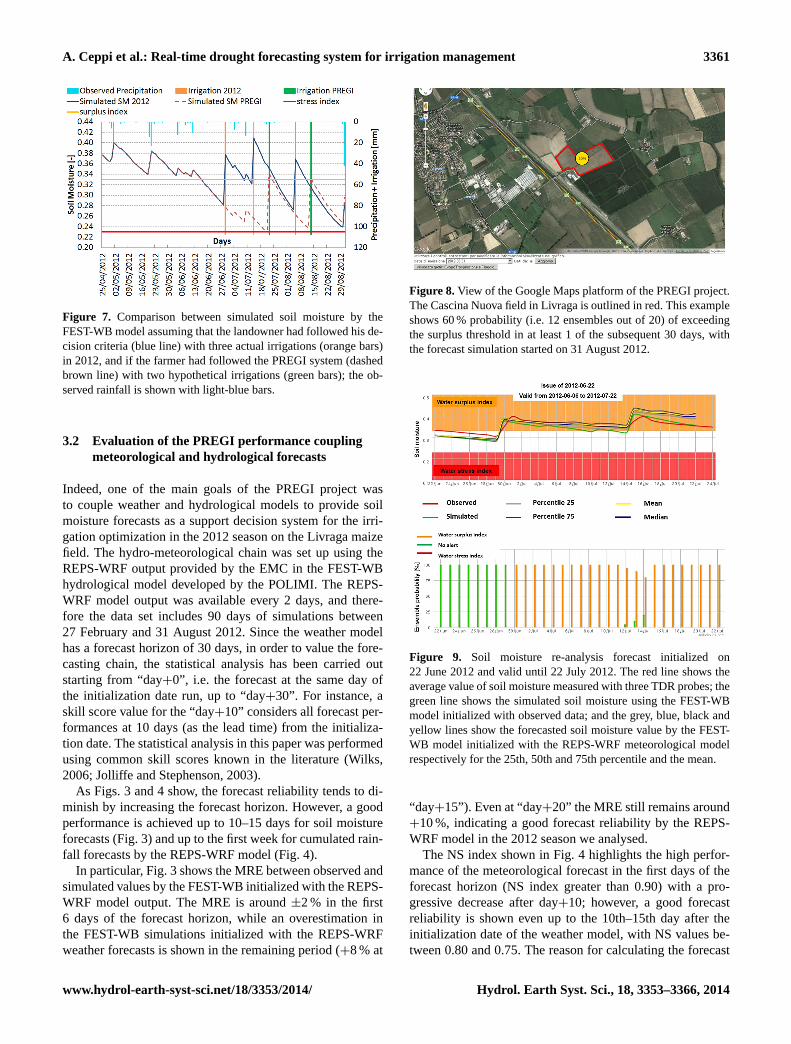
Figure 7. Comparison between simulated soil moisture by theFEST-WB model assuming that the landowner had followed his de-cision criteria (blue line) with three actual irrigations (orange bars)in 2012, and if the farmer had followed the PREGI system (dashedbrown line) with two hypothetical irrigations (green bars); the ob-served rainfall is shown with light-blue bars.
3.2 Evaluation of the PREGI performance couplingmeteorological and hydrological forecasts
Indeed, one of the main goals of the PREGI project wasto couple weather and hydrological models to provide soilmoisture forecasts as a support decision system for the irri-gation optimization in the 2012 season on the Livraga maizefield. The hydro-meteorological chain was set up using theREPS-WRF output provided by the EMC in the FEST-WBhydrological model developed by the POLIMI. The REPS-WRF model output was available every 2 days, and there-fore the data set includes 90 days of simulations between27 February and 31 August 2012. Since the weather modelhas a forecast horizon of 30 days, in order to value the fore-casting chain, the statistical analysis has been carried outstarting from “day+0”, i.e. the forecast at the same day ofthe initialization date run, up to “day+30”. For instance, askill score value for the “day+10” considers all forecast per-formances at 10 days (as the lead time) from the initializa-tion date. The statistical analysis in this paper was performedusing common skill scores known in the literature (Wilks,2006; Jolliffe and Stephenson, 2003).
As Figs. 3 and 4 show, the forecast reliability tends to di-minish by increasing the forecast horizon. However, a goodperformance is achieved up to 10–15 days for soil moistureforecasts (Fig. 3) and up to the first week for cumulated rain-fall forecasts by the REPS-WRF model (Fig. 4).
In particular, Fig. 3 shows the MRE between observed andsimulated values by the FEST-WB initialized with the REPS-WRF model output. The MRE is around±2 % in the first6 days of the forecast horizon, while an overestimation inthe FEST-WB simulations initialized with the REPS-WRFweather forecasts is shown in the remaining period (+8 % at
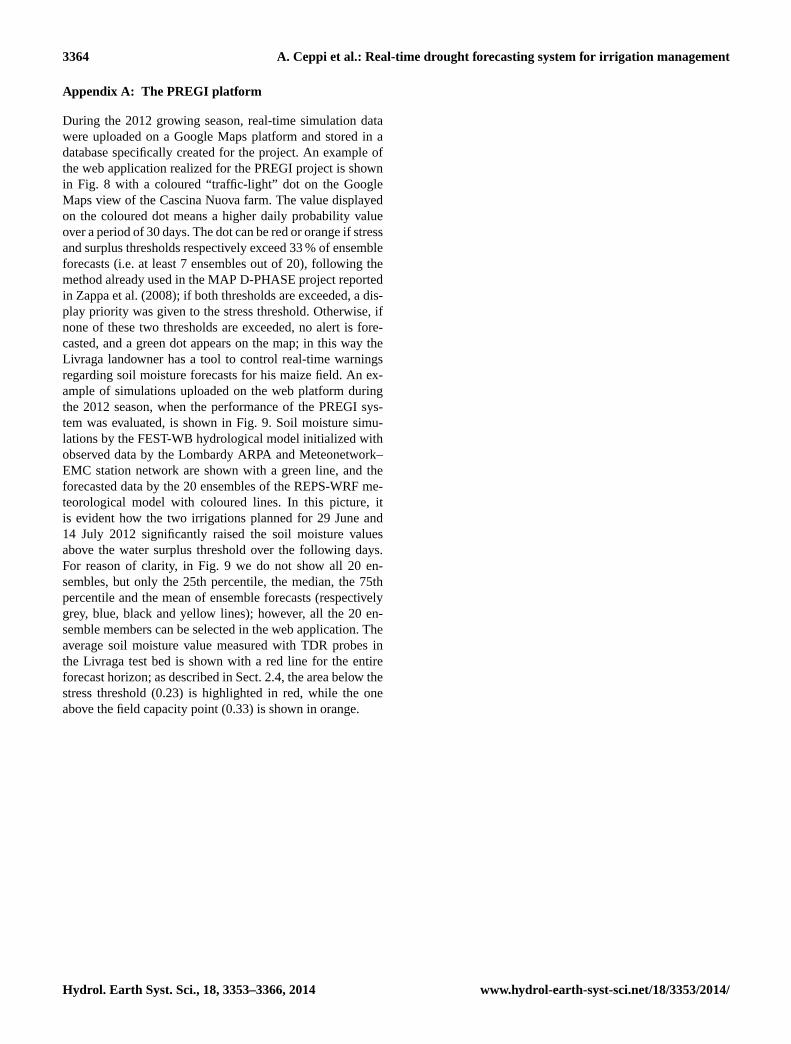
Figure 8. View of the Google Maps platform of the PREGI project.The Cascina Nuova field in Livraga is outlined in red. This exampleshows 60 % probability (i.e. 12 ensembles out of 20) of exceedingthe surplus threshold in at least 1 of the subsequent 30 days, withthe forecast simulation started on 31 August 2012.
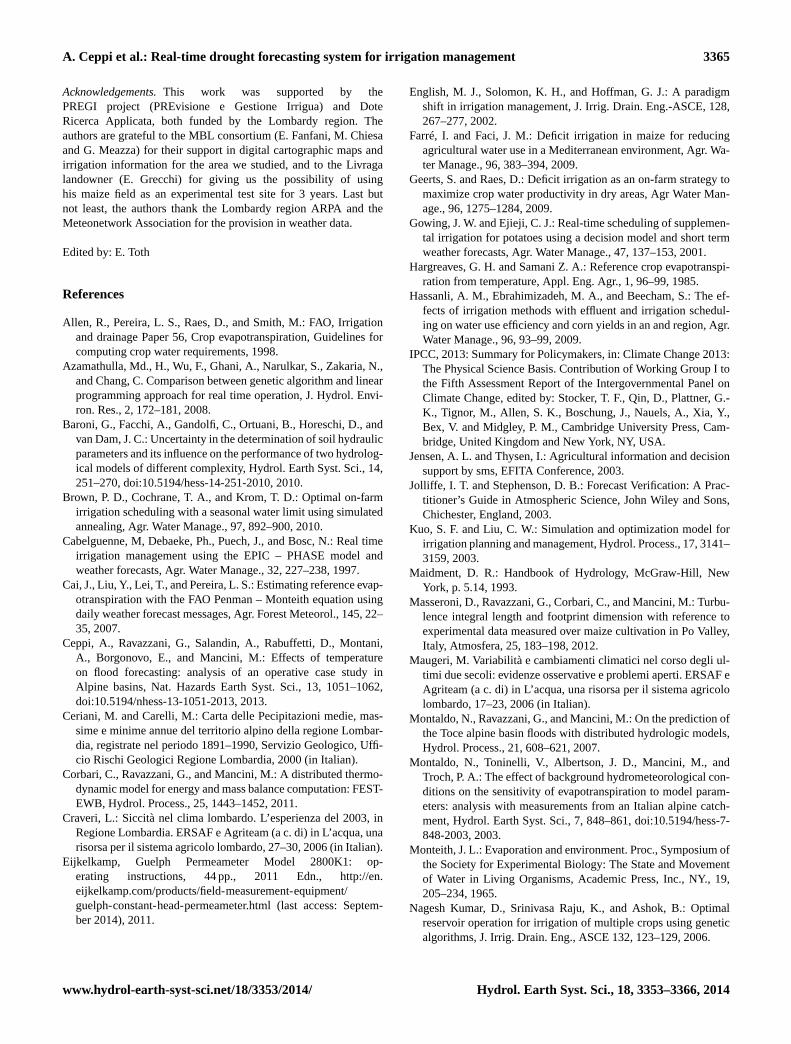
Figure 9. Soil moisture re-analysis forecast initialized on22 June 2012 and valid until 22 July 2012. The red line shows theaverage value of soil moisture measured with three TDR probes; thegreen line shows the simulated soil moisture using the FEST-WBmodel initialized with observed data; and the grey, blue, black andyellow lines show the forecasted soil moisture value by the FEST-WB model initialized with the REPS-WRF meteorological modelrespectively for the 25th, 50th and 75th percentile and the mean.
“day+15”). Even at “day+20” the MRE still remains around+10 %, indicating a good forecast reliability by the REPS-WRF model in the 2012 season we analysed.
The NS index shown in Fig. 4 highlights the high perfor-mance of the meteorological forecast in the first days of theforecast horizon (NS index greater than 0.90) with a pro-gressive decrease after day+10; however, a good forecastreliability is shown even up to the 10th–15th day after theinitialization date of the weather model, with NS values be-tween 0.80 and 0.75. The reason for calculating the forecast
www.hydrol-earth-syst-sci.net/18/3353/2014/ Hydrol. Earth Syst. Sci., 18, 3353–3366, 2014

3362 A. Ceppi et al.: Real-time drought forecasting system for irrigation management
performance of the rainfall plus irrigation accumulated in amoving forecast horizon, and not the forecasted amount on aspecific day, satisfies one of the aims of the PREGI project:in fact, from an irrigation management point of view, it ismore important to know whether the next 7 or 14 days, whichusually coincide with water irrigation allotments in the MBLfields, will be wet or dry than whether a precipitation eventwill occur precisely on the 14th or 15th day of the forecast.However, Fig. 5 shows the REPS-WRF model performancewith forecasted precipitation only, excluding the contributionof irrigation, using the Brier score index for a forecast hori-zon from 1 to 30 days during the 2012 growing season. Asis shown in Fig. 5, the forecast performance is better for thethreshold of 100 mm cumulated over a moving period from 1to 30 days, worsening as the lead time increases. However,the forecast reliability has a different trend for thresholdsgreater than 50, and above all 20 mm, with higher Brier scorevalues in the first days of lead time and a subsequent wors-ening in the following period. In fact, in the way in whichthe BS is defined, the rarer an event, the easier to get a bet-ter BS. This is true if we consider the frequency of eventswhich exceed the threshold of 100 mm cumulated in 1, 2,3, . . . , 30 days that occurred during March–August 2012,and more in general in the summer season in the Po Valleyarea, in comparison with the cumulated precipitation values(observed/forecasted) of 20 mm, which are much more typ-ical from a climatological point of view for this area; how-ever, there is a good level of reliability (BS values lower than0.15) within the first 10 days even for a threshold of 20 mmcumulated in 10 days. Notwithstanding this, our decision toshow the performance over a cumulated period of 1, 2, 3, . . . ,30 days is the result of a preliminary investigation carriedout with the landowner of the Livraga field, who is the realdecision-maker: as mentioned above, from his point of viewit was more interesting to know the reliability of a cumulatedprecipitation forecast over 7 or 10 days and not whether it isgoing to rain exactly on the 7th or 10th day from the forecastinitialization date. Therefore, considering the available 2012data set only, this skill analysis with the BS index (as for theNS) was performed with forecast values cumulated over aperiod of more days (1, 2, 3, . . . , 30) rather than 24 h values.
3.3 To follow or not to follow the PREGI system
Although the model validation was only performed afterthe 2012 growing season, hydro-meteorological simulationswere set up in real time at the beginning of the 2012 sea-son when the PREGI system issued soil moisture, evapotran-spiration and precipitation forecasts every 2 days, providingthe landowner with useful information concerning soil con-ditions for irrigation scheduling. As described in Sect. 2.4,the initial conditions of the hydrological model were up-dated daily, taking into account observed weather data andirrigation water amounts which were planned during the en-tire season more on the basis of the landowner’ experience
than the PREGI system. Three irrigations were planned dur-ing the vegetation season 2012: 29 June, 14 July and 6 Au-gust: the lattermost was supposed to be the previous week,on 29 July, but the observed soil moisture values and fore-casts convinced the landowner to follow the PREGI appli-cation and to postpone it for one week. This advice led toan extension of the growing season until the end of August,when a riper maize was harvested two weeks after the orig-inally scheduled date; however, had the PREGI system beenfully followed by the landowner, one out of three irrigationswould have been even saved. In fact, to demonstrate the ben-efits of such a forecasting system, we re-ran two simulations,one assuming that the landowner follows the advice providedby the PREGI platform on when to irrigate, and the other as-suming that he follows the currently planned decision crite-ria; as shown in Fig. 6 (where for the sake of clarity we showonly the mean, median and the 25th and 75th percentile ofensemble forecasts), one out of three irrigations could havebeen saved! In particular, the irrigation scheduled for 29 June(Fig. 6b) could have been avoided (Fig. 6a), since none of the20 ensembles would have forecasted a soil moisture value be-low the stress threshold. According to the forecast shown inFig. 6c, even the irrigation that occurred on 14 July (Fig. 6d)could have been avoided and postponed for 1 week (Fig. 6f),to when it was really necessary, because soil moisture fore-casts, issued on 20 July, gave a probability of 35 % (i.e. 7ensemble members out 20) of exceeding the stress value ifthe landowner had not irrigated on the 22nd (Fig. 6e).
In the same way during August, the landowner could havepostponed the planned irrigation for 6 August (Fig. 6h) forone week (Fig. 6j), since no members of the ensemble fore-cast issued a warning (Fig. 6g) for the next 7 days (which isimportant to bear in mind for the available irrigation time al-lotment). In fact, if no irrigation occurred in the following7 days, the forecast issue on 11 August would have fore-casted a probability of 50 % to exceed the stress thresholdon 17 August (Fig. 6i).
This comparison between the two scenarios, with or with-out the PREGI system, made it possible to assess the benefitsof this system in terms of water savings. Figure 7 shows, infact, how the soil moisture conditions with only two sim-ulated irrigations, instead of three, would have remainedwithin the range of the two surplus and stress thresholds.However, the three irrigations that actually took place raisedthe soil water content even further above the surplus thresh-old for a good part of the 2012 season.
4 Conclusions
The aim of the PREGI project is to realize an integrated sys-tem by coupling meteorological and hydrological models tomonitor and forecast soil water content in order to manageirrigation water more wisely. The test bed of the project wasthe maize field at Livraga in the MBL consortium, about
Hydrol. Earth Syst. Sci., 18, 3353–3366, 2014 www.hydrol-earth-syst-sci.net/18/3353/2014/

A. Ceppi et al.: Real-time drought forecasting system for irrigation management 3363
50 km south-east of Milan in northern Italy. The hydro-meteorological chain to produce ensemble soil moisture fore-casts is based on 20 meteorological members of the non-hydrostatic WRF-ARW model with a 30-day lead-time, pro-vided by the Epson Meteo Centre, while the hydrologi-cal model used to generate soil moisture simulations is theFEST-WB rainfall-runoff distributed model, developed bythe Politecnico di Milano. This contribution made by ensem-ble forecasts provides probabilistic information with differ-ent forecast scenarios to be below or above stress/surplusthresholds. Furthermore, according to crop water consump-tion determined by the soil type and the degree of saturation,a continuous monitoring of soil water content was carriedout during the entire 2012 growing season, with three TDRprobes installed.
The results show how it was possible by combining meteo-rological and hydrological models to have reliable soil mois-ture forecasts for up to 10 and 14 days respectively, with amean relative error of less than 10 %. Although the PREGIsystem showed a good level of performance during the 2012season, decision criteria for when to irrigate were left more tothe farmer’s experience rather than the hydro-meteorologicalforecasts. However, thanks to the PREGI system, we high-lighted how one of the three irrigations could have beenavoided if the landowner had followed the results generatedby our application. Thus, the benefits of this project are bothdirect and indirect: the direct benefits regard the monitoringand forecasting of soil water content according to the currentstate of soil moisture values and water crop requirements,while the indirect benefits regard the optimization of waterirrigations pursuing the best quantitative distribution, in par-ticular periods of water scarcity, in order to minimize produc-tion losses caused by water stress due insufficient watering,avoiding the waste of irrigation water as occurred in the 2010growing season, when the PREGI system was unfortunatelynot yet in service.
One of the future developments is to extend these analy-ses over different sites with other case studies during futuregrowing seasons. However, a limit for replicating this sys-tem in other areas will be that of obtaining real-time data(weather and soil moisture information), amounts and sched-uled irrigation dates, which are usually not easy to acquire inreal time.
www.hydrol-earth-syst-sci.net/18/3353/2014/ Hydrol. Earth Syst. Sci., 18, 3353–3366, 2014
3364 A. Ceppi et al.: Real-time drought forecasting system for irrigation management
Appendix A: The PREGI platform
During the 2012 growing season, real-time simulation datawere uploaded on a Google Maps platform and stored in adatabase specifically created for the project. An example ofthe web application realized for the PREGI project is shownin Fig. 8 with a coloured “traffic-light” dot on the GoogleMaps view of the Cascina Nuova farm. The value displayedon the coloured dot means a higher daily probability valueover a period of 30 days. The dot can be red or orange if stressand surplus thresholds respectively exceed 33 % of ensembleforecasts (i.e. at least 7 ensembles out of 20), following themethod already used in the MAP D-PHASE project reportedin Zappa et al. (2008); if both thresholds are exceeded, a dis-play priority was given to the stress threshold. Otherwise, ifnone of these two thresholds are exceeded, no alert is fore-casted, and a green dot appears on the map; in this way theLivraga landowner has a tool to control real-time warningsregarding soil moisture forecasts for his maize field. An ex-ample of simulations uploaded on the web platform duringthe 2012 season, when the performance of the PREGI sys-tem was evaluated, is shown in Fig. 9. Soil moisture simu-lations by the FEST-WB hydrological model initialized withobserved data by the Lombardy ARPA and Meteonetwork–EMC station network are shown with a green line, and theforecasted data by the 20 ensembles of the REPS-WRF me-teorological model with coloured lines. In this picture, itis evident how the two irrigations planned for 29 June and14 July 2012 significantly raised the soil moisture valuesabove the water surplus threshold over the following days.For reason of clarity, in Fig. 9 we do not show all 20 en-sembles, but only the 25th percentile, the median, the 75thpercentile and the mean of ensemble forecasts (respectivelygrey, blue, black and yellow lines); however, all the 20 en-semble members can be selected in the web application. Theaverage soil moisture value measured with TDR probes inthe Livraga test bed is shown with a red line for the entireforecast horizon; as described in Sect. 2.4, the area below thestress threshold (0.23) is highlighted in red, while the oneabove the field capacity point (0.33) is shown in orange.
Hydrol. Earth Syst. Sci., 18, 3353–3366, 2014 www.hydrol-earth-syst-sci.net/18/3353/2014/
A. Ceppi et al.: Real-time drought forecasting system for irrigation management 3365
Acknowledgements.This work was supported by thePREGI project (PREvisione e Gestione Irrigua) and DoteRicerca Applicata, both funded by the Lombardy region. Theauthors are grateful to the MBL consortium (E. Fanfani, M. Chiesaand G. Meazza) for their support in digital cartographic maps andirrigation information for the area we studied, and to the Livragalandowner (E. Grecchi) for giving us the possibility of usinghis maize field as an experimental test site for 3 years. Last butnot least, the authors thank the Lombardy region ARPA and theMeteonetwork Association for the provision in weather data.
Edited by: E. Toth
References
Allen, R., Pereira, L. S., Raes, D., and Smith, M.: FAO, Irrigationand drainage Paper 56, Crop evapotranspiration, Guidelines forcomputing crop water requirements, 1998.
Azamathulla, Md., H., Wu, F., Ghani, A., Narulkar, S., Zakaria, N.,and Chang, C. Comparison between genetic algorithm and linearprogramming approach for real time operation, J. Hydrol. Envi-ron. Res., 2, 172–181, 2008.
Baroni, G., Facchi, A., Gandolfi, C., Ortuani, B., Horeschi, D., andvan Dam, J. C.: Uncertainty in the determination of soil hydraulicparameters and its influence on the performance of two hydrolog-ical models of different complexity, Hydrol. Earth Syst. Sci., 14,251–270, doi:10.5194/hess-14-251-2010, 2010.
Brown, P. D., Cochrane, T. A., and Krom, T. D.: Optimal on-farmirrigation scheduling with a seasonal water limit using simulatedannealing, Agr. Water Manage., 97, 892–900, 2010.
Cabelguenne, M, Debaeke, Ph., Puech, J., and Bosc, N.: Real timeirrigation management using the EPIC – PHASE model andweather forecasts, Agr. Water Manage., 32, 227–238, 1997.
Cai, J., Liu, Y., Lei, T., and Pereira, L. S.: Estimating reference evap-otranspiration with the FAO Penman – Monteith equation usingdaily weather forecast messages, Agr. Forest Meteorol., 145, 22–35, 2007.
Ceppi, A., Ravazzani, G., Salandin, A., Rabuffetti, D., Montani,A., Borgonovo, E., and Mancini, M.: Effects of temperatureon flood forecasting: analysis of an operative case study inAlpine basins, Nat. Hazards Earth Syst. Sci., 13, 1051–1062,doi:10.5194/nhess-13-1051-2013, 2013.
Ceriani, M. and Carelli, M.: Carta delle Pecipitazioni medie, mas-sime e minime annue del territorio alpino della regione Lombar-dia, registrate nel periodo 1891–1990, Servizio Geologico, Uffi-cio Rischi Geologici Regione Lombardia, 2000 (in Italian).
Corbari, C., Ravazzani, G., and Mancini, M.: A distributed thermo-dynamic model for energy and mass balance computation: FEST-EWB, Hydrol. Process., 25, 1443–1452, 2011.
Craveri, L.: Siccità nel clima lombardo. L’esperienza del 2003, inRegione Lombardia. ERSAF e Agriteam (a c. di) in L’acqua, unarisorsa per il sistema agricolo lombardo, 27–30, 2006 (in Italian).
Eijkelkamp, Guelph Permeameter Model 2800K1: op-erating instructions, 44 pp., 2011 Edn.,http://en.eijkelkamp.com/products/field-measurement-equipment/guelph-constant-head-permeameter.html(last access: Septem-ber 2014), 2011.
English, M. J., Solomon, K. H., and Hoffman, G. J.: A paradigmshift in irrigation management, J. Irrig. Drain. Eng.-ASCE, 128,267–277, 2002.
Farré, I. and Faci, J. M.: Deficit irrigation in maize for reducingagricultural water use in a Mediterranean environment, Agr. Wa-ter Manage., 96, 383–394, 2009.
Geerts, S. and Raes, D.: Deficit irrigation as an on-farm strategy tomaximize crop water productivity in dry areas, Agr Water Man-age., 96, 1275–1284, 2009.
Gowing, J. W. and Ejieji, C. J.: Real-time scheduling of supplemen-tal irrigation for potatoes using a decision model and short termweather forecasts, Agr. Water Manage., 47, 137–153, 2001.
Hargreaves, G. H. and Samani Z. A.: Reference crop evapotranspi-ration from temperature, Appl. Eng. Agr., 1, 96–99, 1985.
Hassanli, A. M., Ebrahimizadeh, M. A., and Beecham, S.: The ef-fects of irrigation methods with effluent and irrigation schedul-ing on water use efficiency and corn yields in an and region, Agr.Water Manage., 96, 93–99, 2009.
IPCC, 2013: Summary for Policymakers, in: Climate Change 2013:The Physical Science Basis. Contribution of Working Group I tothe Fifth Assessment Report of the Intergovernmental Panel onClimate Change, edited by: Stocker, T. F., Qin, D., Plattner, G.-K., Tignor, M., Allen, S. K., Boschung, J., Nauels, A., Xia, Y.,Bex, V. and Midgley, P. M., Cambridge University Press, Cam-bridge, United Kingdom and New York, NY, USA.
Jensen, A. L. and Thysen, I.: Agricultural information and decisionsupport by sms, EFITA Conference, 2003.
Jolliffe, I. T. and Stephenson, D. B.: Forecast Verification: A Prac-titioner’s Guide in Atmospheric Science, John Wiley and Sons,Chichester, England, 2003.
Kuo, S. F. and Liu, C. W.: Simulation and optimization model forirrigation planning and management, Hydrol. Process., 17, 3141–3159, 2003.
Maidment, D. R.: Handbook of Hydrology, McGraw-Hill, NewYork, p. 5.14, 1993.
Masseroni, D., Ravazzani, G., Corbari, C., and Mancini, M.: Turbu-lence integral length and footprint dimension with reference toexperimental data measured over maize cultivation in Po Valley,Italy, Atmosfera, 25, 183–198, 2012.
Maugeri, M. Variabilità e cambiamenti climatici nel corso degli ul-timi due secoli: evidenze osservative e problemi aperti. ERSAF eAgriteam (a c. di) in L’acqua, una risorsa per il sistema agricololombardo, 17–23, 2006 (in Italian).
Montaldo, N., Ravazzani, G., and Mancini, M.: On the prediction ofthe Toce alpine basin floods with distributed hydrologic models,Hydrol. Process., 21, 608–621, 2007.
Montaldo, N., Toninelli, V., Albertson, J. D., Mancini, M., andTroch, P. A.: The effect of background hydrometeorological con-ditions on the sensitivity of evapotranspiration to model param-eters: analysis with measurements from an Italian alpine catch-ment, Hydrol. Earth Syst. Sci., 7, 848–861, doi:10.5194/hess-7-848-2003, 2003.
Monteith, J. L.: Evaporation and environment. Proc., Symposium ofthe Society for Experimental Biology: The State and Movementof Water in Living Organisms, Academic Press, Inc., NY., 19,205–234, 1965.
Nagesh Kumar, D., Srinivasa Raju, K., and Ashok, B.: Optimalreservoir operation for irrigation of multiple crops using geneticalgorithms, J. Irrig. Drain. Eng., ASCE 132, 123–129, 2006.
www.hydrol-earth-syst-sci.net/18/3353/2014/ Hydrol. Earth Syst. Sci., 18, 3353–3366, 2014
3366 A. Ceppi et al.: Real-time drought forecasting system for irrigation management
Nash, J. E. and Sutcliffe, J. V.: River flow forecasting through theconceptual models, Part 1: A discussion of principles, J. Hydrol.,10, 282–290, 1970.
Oweis, T. and Hachum, A.: Optimizing supplemental irrigation:tradeoffs between profitability and sustainability, Agr. WaterManage., 96, 511–516, 2009.
Rabuffetti, D., Ravazzani, G., Corbari, C., and Mancini, M.: Ver-ification of operational Quantitative Discharge Forecast (QDF)for a regional warning system – the AMPHORE case studies inthe upper Po River, Nat. Hazards Earth Syst. Sci., 8, 161–173,doi:10.5194/nhess-8-161-2008, 2008.
Ravazzani, G: MOSAICO, a library for raster based hydrologicalapplications, Comput. Geosci., 51, 1–6, 2013.
Ravazzani, G., Corbari, C., Morella, S., Gianoli, P., and Mancini,M.: Modified Hargreaves-Samani equation for the assessmentof reference evapotranspiration in Alpine river basins, J. Irrig.Drain. Eng., 138, 592–599, 2012.
Ravazzani, G., Giudici, I., Schmidt, C., and Mancini, M.: Evaluat-ing the potential of quarry lakes for supplemental irrigation, J.Irrig. Drain. Eng., 137, 564–571, 2011a.
Ravazzani, G., Mancini, M., Giudici, I., and Amadio, P.: Effectsof soil moisture parameterization on a real- time flood forecast-ing system based on rainfall thresholds, in: Quantification andReduction of Predictive Uncertainty for Sustainable Water Re-sources Management, Proc. Symposium HS 2004 at IUGG 2007,Perugia, July 2007, IAHS Publ., 313, 407–416, 2007.
Ravazzani, G., Rametta, D., and Mancini, M.: Macroscopic CellularAutomata for groundwater modelling: a first approach, Environ.Modell. Softw., 26, 634–643, 2011b.
Salerno, R., Giuliacci, M., and Bertolani, L.: Climate Change inItaly: An assessment of data and reanalysis models, Elsevier, De-velop. Earth Surf. Process., 10, 123–132, 2007.
Skamarock, W. C. and Klemp, J. B.: A time-split non hydrostatic at-mospheric model for research and NWP applications, J. Comput.Phys., 227, 3465–3485, 2008.
Smith, M.: CROPWAT – A computer program for irrigation plan-ning and management, FAO Irrig. Drain. paper 46, Rome, FAO,1992.
Vico, G., and Porporato, A.: Probabilistic description of crop devel-opment and irrigation water requirements with stochastic rain-fall, Water Resour. Res., 49, 1466–1482, 2013.
Vico, G. and Porporato, A. From rainfed agriculture to stress-avoidance irrigation: I. A generalized irrigation scheme withstochastic soil moisture, Adv. Water Resour., 34, 263–271, 2011.
Wilks, D. S.: Statistical Methods in the Atmospheric Sciences”,Academic Press, Elsevier, 2nd Edn., 2006.
Zappa, M., Rotach, M. W., Arpagaus, M., Dorninger, M., Hegg,C., Montani, A., Ranzi, R., Ament, F., Germann, U., Grossi, G.,Jaun, S., Rossa, A., Vogt, S., Walser, A., Wehrhan, J., and Wun-ram, C.: MAP D-PHASE: Real-time demonstration of hydrolog-ical ensemble prediction systems, Atmos. Sci. Lett., 2, 80–87,2008.
Hydrol. Earth Syst. Sci., 18, 3353–3366, 2014 www.hydrol-earth-syst-sci.net/18/3353/2014/