Real-Time Analytics and Visualization of Streaming Big Data with JReport & ScaleDB
20
Real%Time Analy-cs and Visualiza-on of Streaming Big Data Dean Yao Director of Marke/ng Jinfonet So3ware Mike Hogan CMO ScaleDB
-
Upload
mia-yuan-cao -
Category
Technology
-
view
74 -
download
2
Transcript of Real-Time Analytics and Visualization of Streaming Big Data with JReport & ScaleDB
Real%Time)Analy-cs)and)Visualiza-on)of)
Streaming)Big)Data
Dean%Yao%Director%of%Marke/ng%Jinfonet%So3ware
Mike%Hogan%CMO%ScaleDB
2
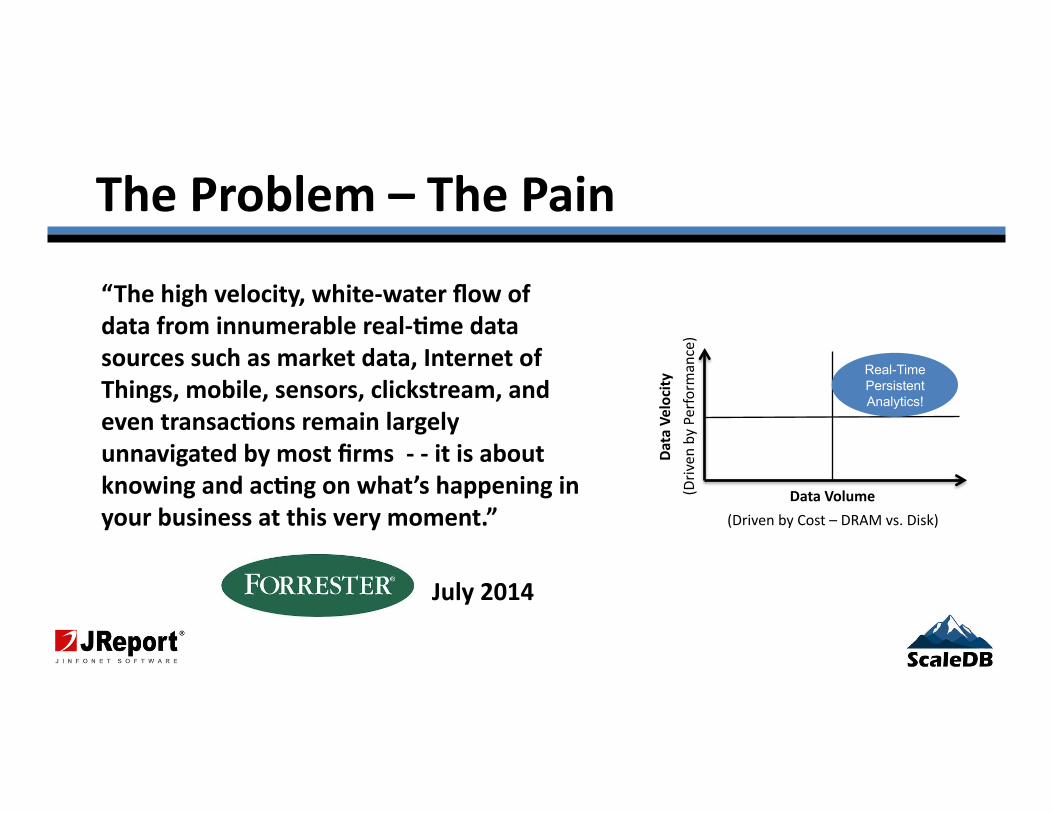
The)Problem)–)The)Pain)
“The)high)velocity,)white%water)flow)of)
data)from)innumerable)real%-me)data)
sources)such)as)market)data,)Internet)of)
Things,)mobile,)sensors,)clickstream,)and)
even)transac-ons)remain)largely)
unnavigated)by)most)firms))%)%)it)is)about)
knowing)and)ac-ng)on)what’s)happening)in)
your)business)at)this)very)moment.”))))
)))))))))))))))))))))))))))))))))))))))))))))))))))))))July)2014)
Data)Velocity)
(Driven%by%Perform
ance)%
Data)Volume)
(Driven%by%Cost%–%DRAM%vs.%Disk)%
Real-Time Persistent Analytics!
3
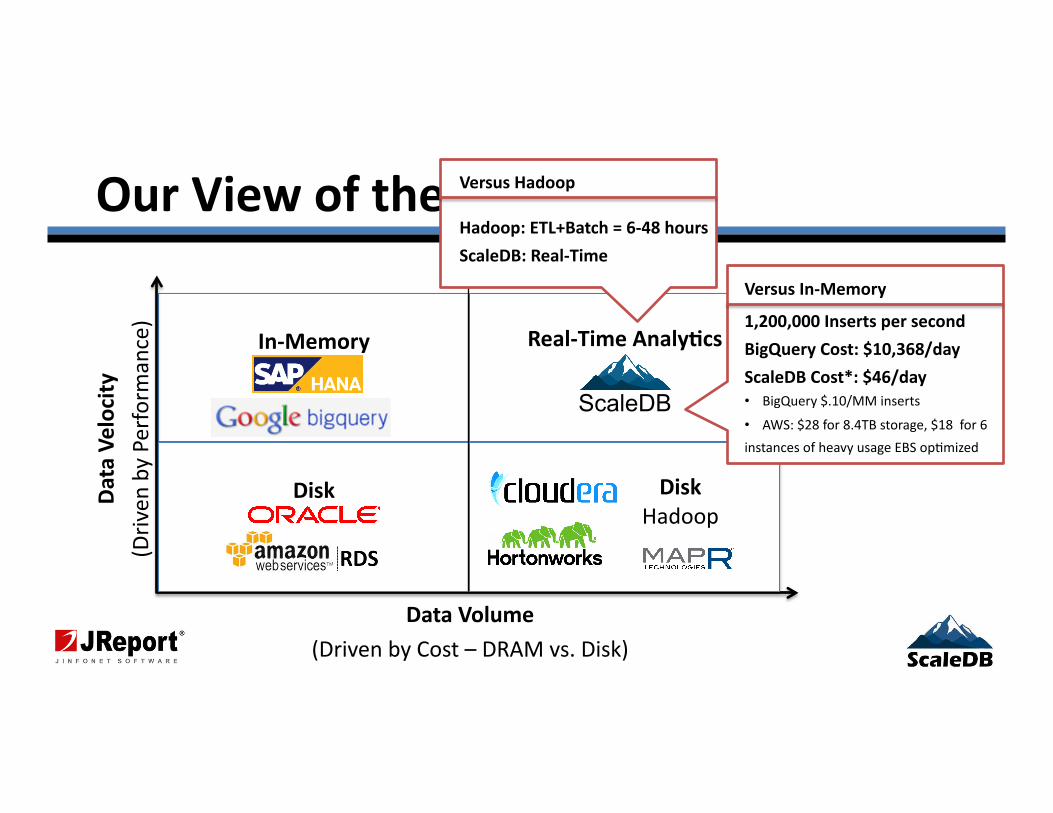
In%Memory) Real%Time)Analy-cs)
ScaleDB
Our)View)of)the)Market)
Data)Velocity)
(Driven%by%Perform
ance)%
Data)Volume)
(Driven%by%Cost%–%DRAM%vs.%Disk)%
Disk)
Versus)In%Memory)
1,200,000)Inserts)per)second)
BigQuery)Cost:)$10,368/day)
ScaleDB)Cost*:)$46/day)
• BigQuery%$.10/MM%inserts%
• AWS:%$28%for%8.4TB%storage,%$18%%for%6%%
instances%of%heavy%usage%EBS%op/mized%
Disk)
Hadoop%
Versus)Hadoop)
Hadoop:)ETL+Batch)=)6%48)hours)
ScaleDB:)Real%Time)

4
High%Velocity)Structured)Data)
MyISAM
ScaleDB Storage
ScaleDB Storage
ScaleDB ScaleDB
ScaleDB Storage
ScaleDB
5
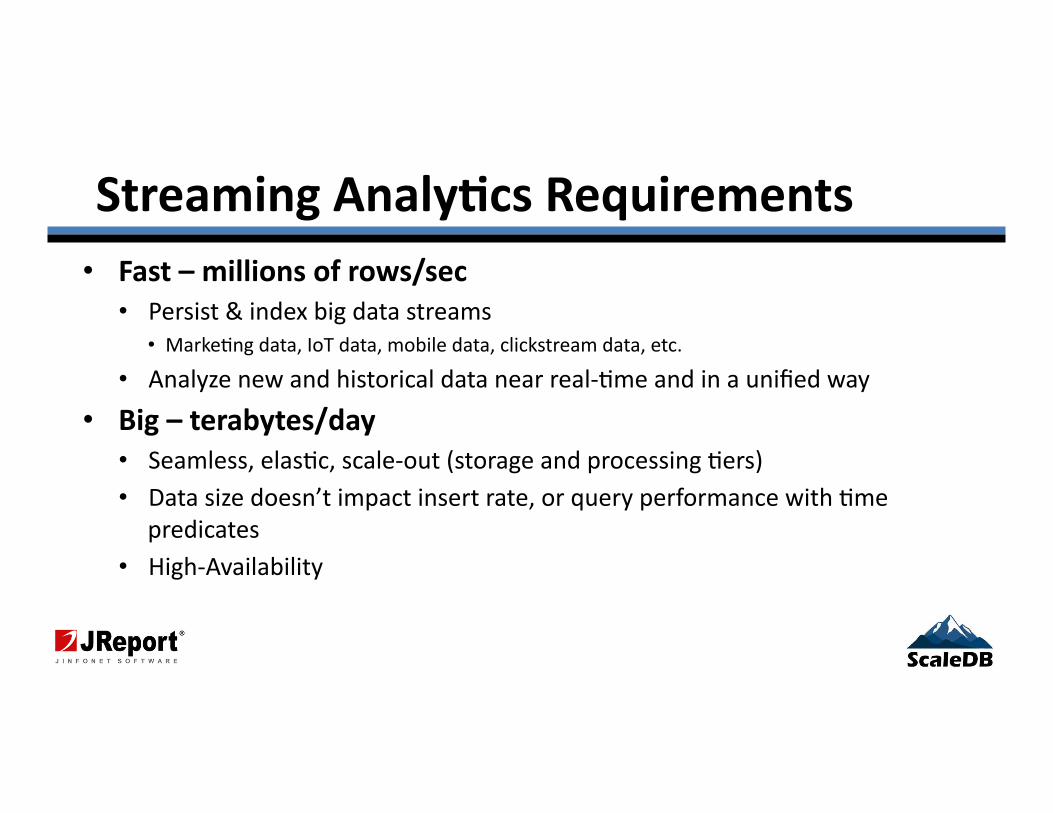
Streaming)Analy-cs)Requirements)
• Fast)–)millions)of)rows/sec)
• Persist%&%index%big%data%streams%%• Marke/ng%data,%IoT%data,%mobile%data,%clickstream%data,%etc.%
• Analyze%new%and%historical%data%near%real\/me%and%in%a%unified%way%
• Big)–)terabytes/day)• Seamless,%elas/c,%scale\out%(storage%and%processing%/ers)%• Data%size%doesn’t%impact%insert%rate,%or%query%performance%with%/me%
predicates%• High\Availability%
6
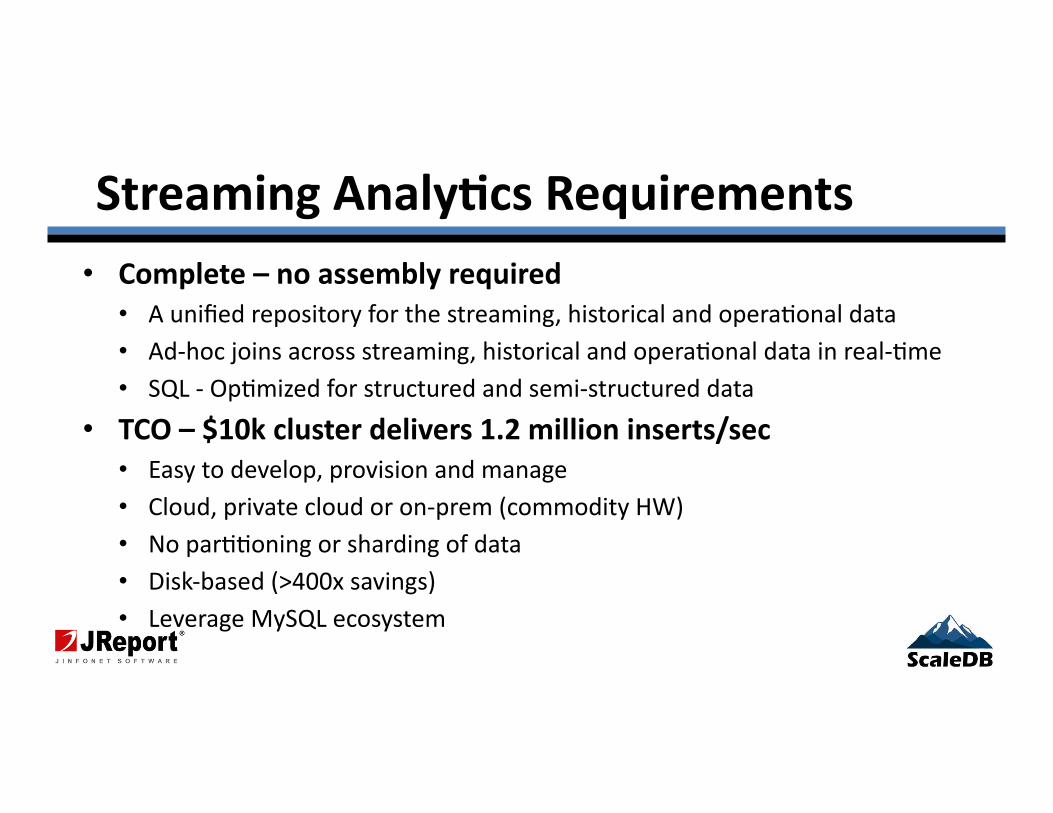
Streaming)Analy-cs)Requirements)
• Complete)–)no)assembly)required)
• A%unified%repository%for%the%streaming,%historical%and%opera/onal%data%• Ad\hoc%joins%across%streaming,%historical%and%opera/onal%data%in%real\/me%• SQL%\%Op/mized%for%structured%and%semi\structured%data)%
• TCO)–)$10k)cluster)delivers)1.2)million)inserts/sec))
• Easy%to%develop,%provision%and%manage%• Cloud,%private%cloud%or%on\prem%(commodity%HW)%• No%par//oning%or%sharding%of%data%• Disk\based%(>400x%savings)%• Leverage%MySQL%ecosystem%
Real-Time Analytics and Visualization of Streaming Big Data
Dean Yao Director of Marketing Jinfonet Software
Mike Hogan CMO ScaleDB
Follow us @Jinfonet
Simplify the Complexity of Reporting
and Visualization
Our Mission
2
3
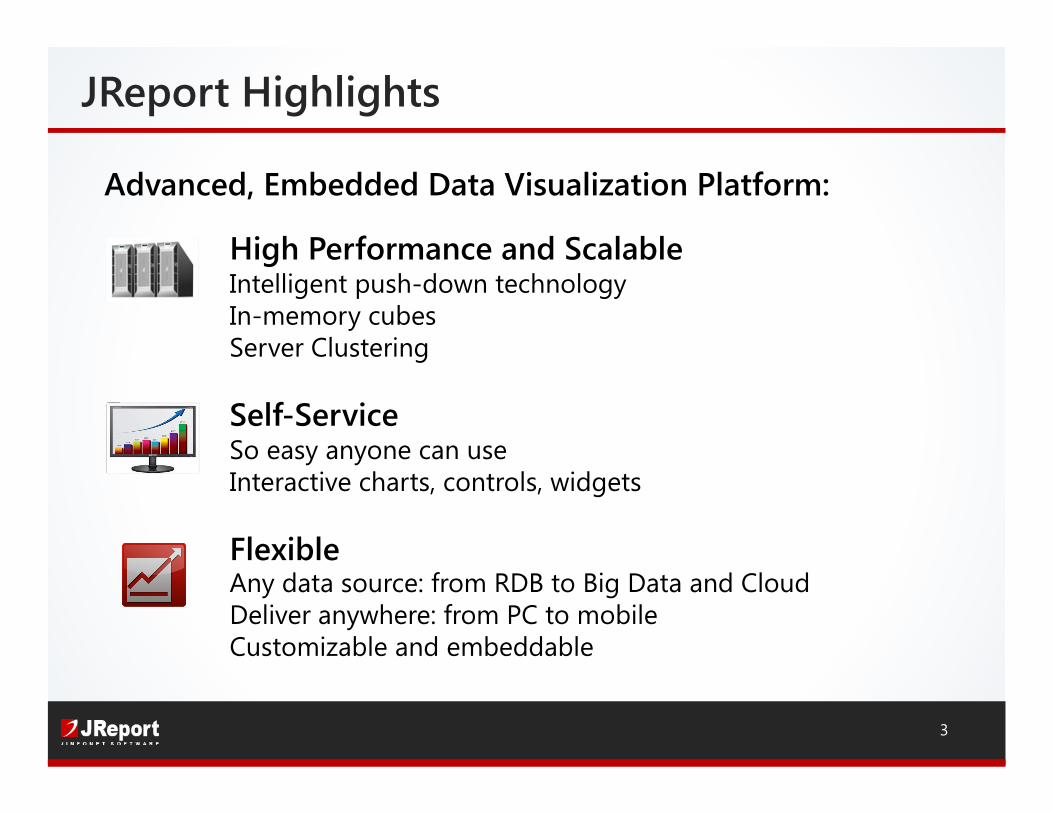
High Performance and Scalable Intelligent push-down technology In-memory cubes Server Clustering
Self-ServiceSo easy anyone can use Interactive charts, controls, widgets
Flexible Any data source: from RDB to Big Data and Cloud Deliver anywhere: from PC to mobile Customizable and embeddable
Advanced, Embedded Data Visualization Platform:
JReport Highlights
4
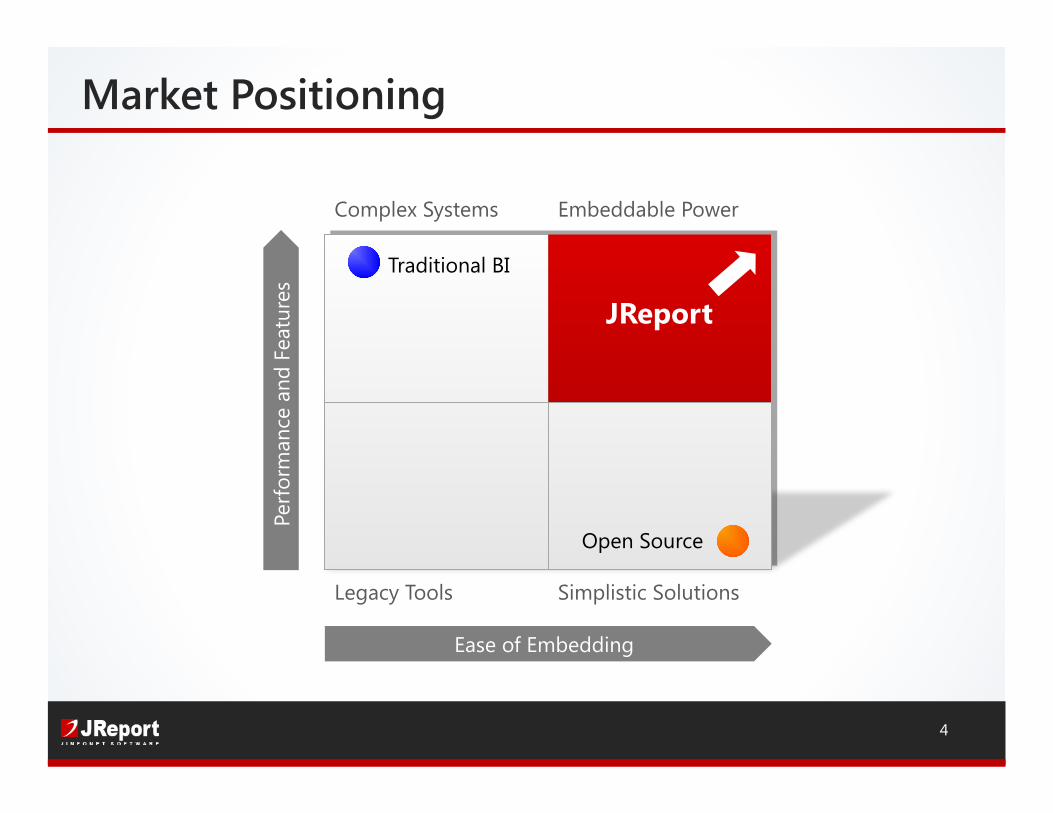
Ease of Embedding
Complex Systems
Simplistic Solutions
Embeddable Power
Legacy Tools
Perf
orm
ance
and
Fea
ture
s Traditional BI
Open Source
JReport
Market Positioning
5
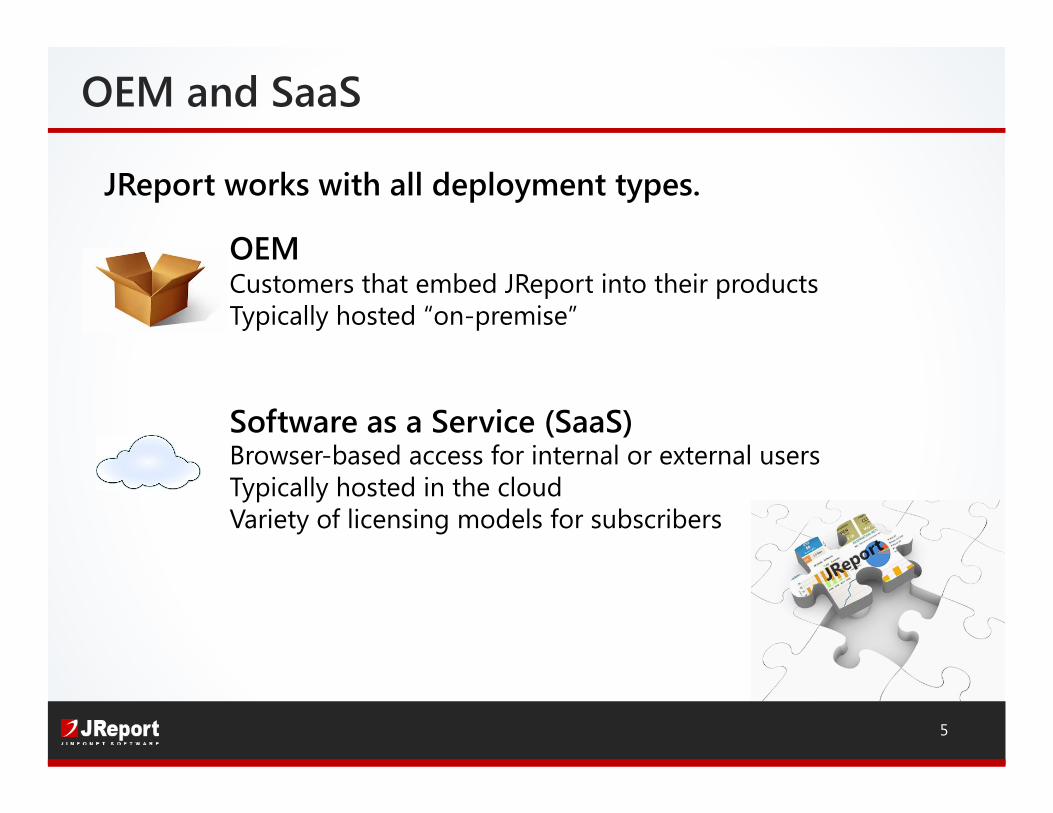
OEMCustomers that embed JReport into their products Typically hosted “on-premise”
Software as a Service (SaaS)Browser-based access for internal or external users Typically hosted in the cloudVariety of licensing models for subscribers
JReport works with all deployment types.
OEM and SaaS
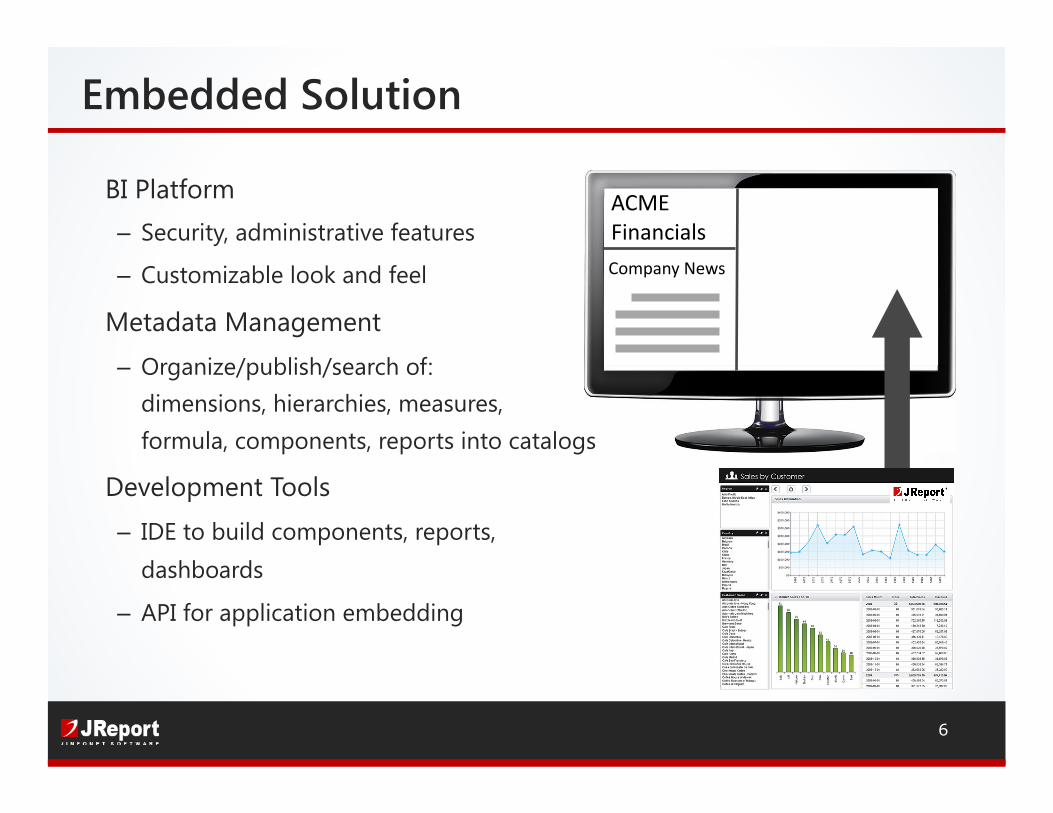
ACME%Financials%
Company%News%
BI Platform – Security, administrative features
– Customizable look and feel
Metadata Management
– Organize/publish/search of: dimensions, hierarchies, measures, formula, components, reports into catalogs
Development Tools
– IDE to build components, reports, dashboards
– API for application embedding
6
Embedded Solution

7
Interactive Visualization
Visual Analysis
Ad Hoc Reporting JDashboard
New Data Sources
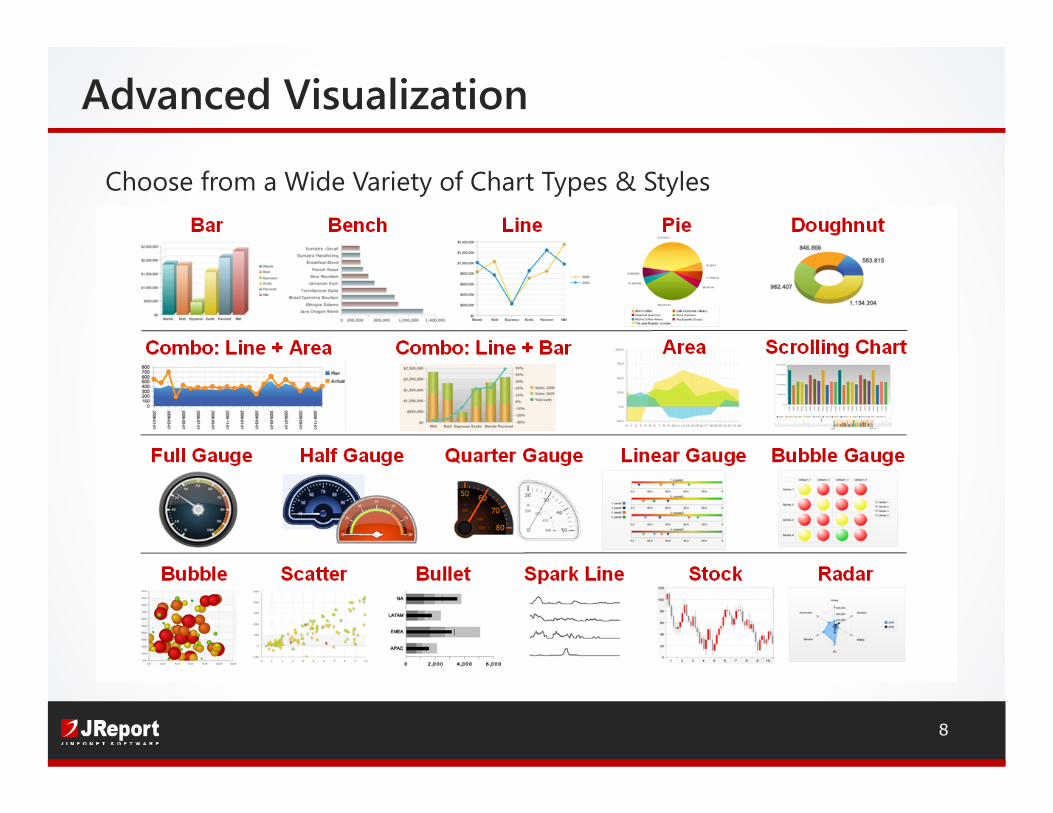
Choose from a Wide Variety of Chart Types & Styles
8
Advanced Visualization
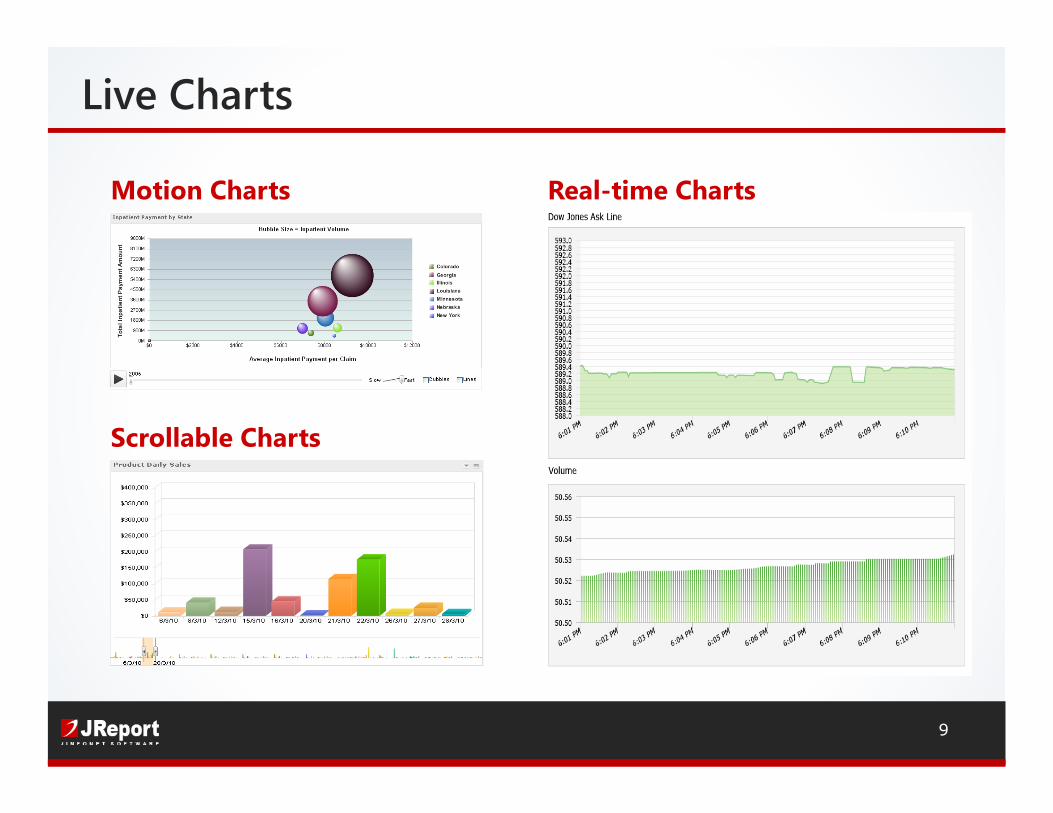
Motion Charts
Scrollable Charts
Real-time Charts
9
Live Charts
10
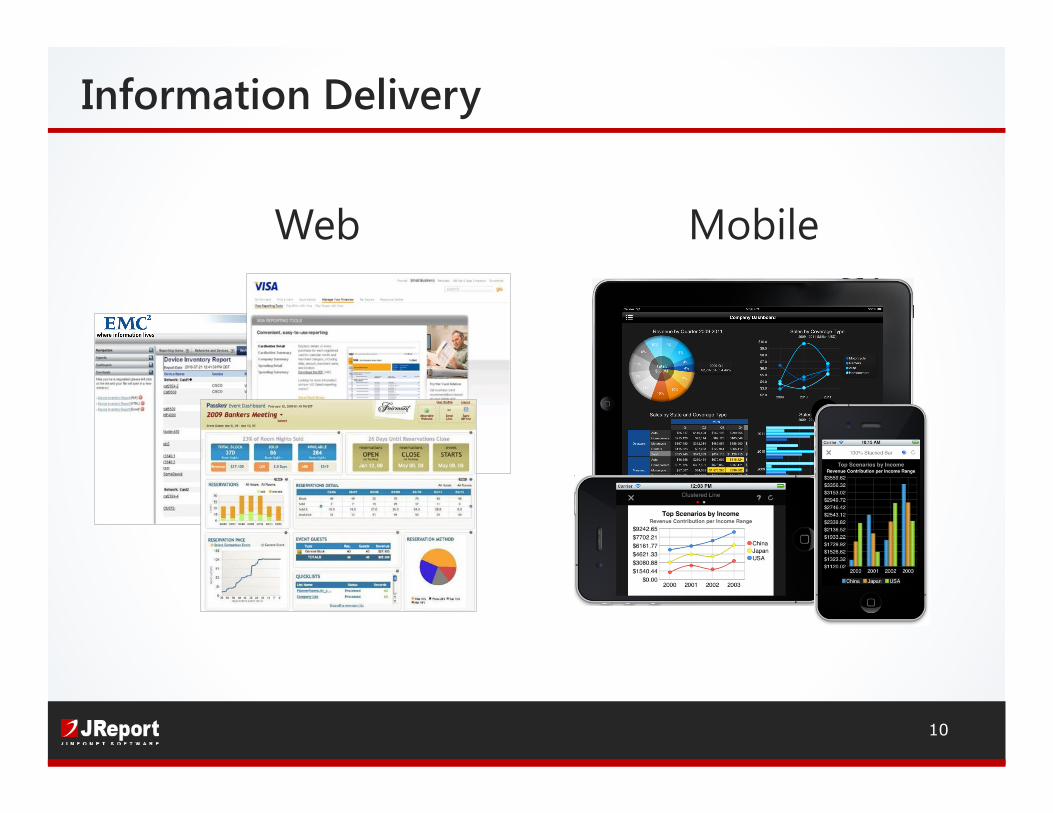
Information Delivery
Web Mobile
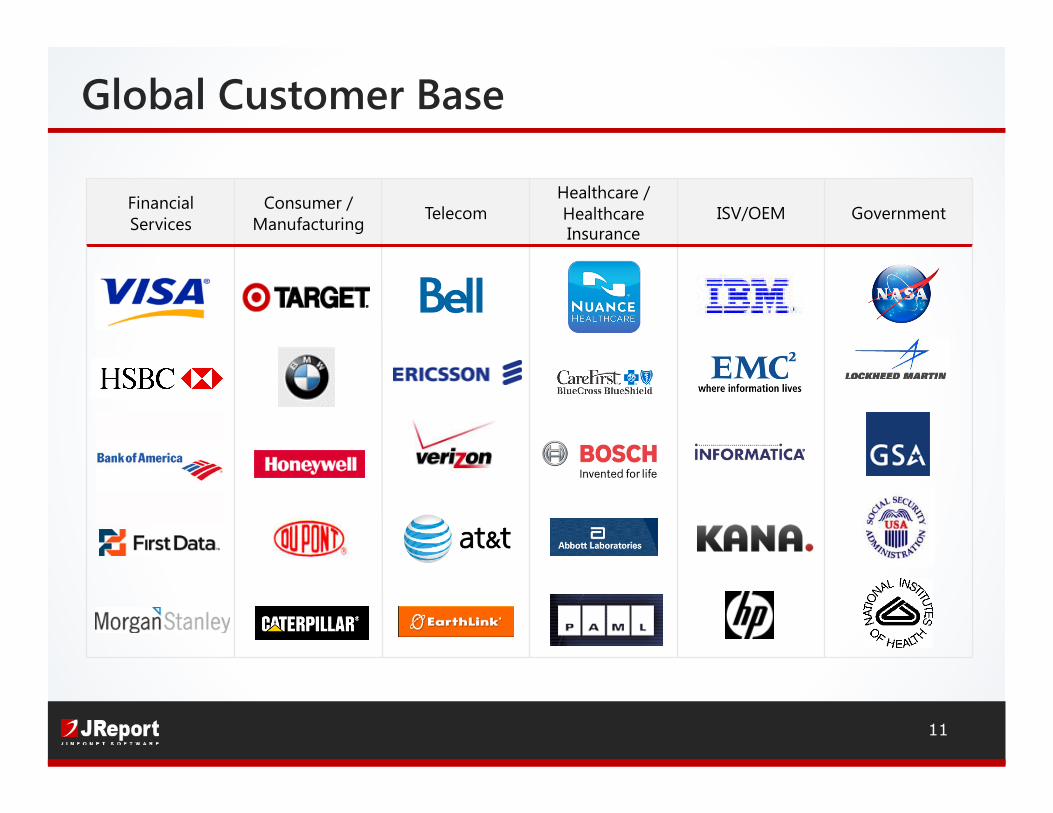
Government ISV/OEM Healthcare / Healthcare Insurance
Telecom Consumer / Manufacturing
Financial Services
Global Customer Base
11
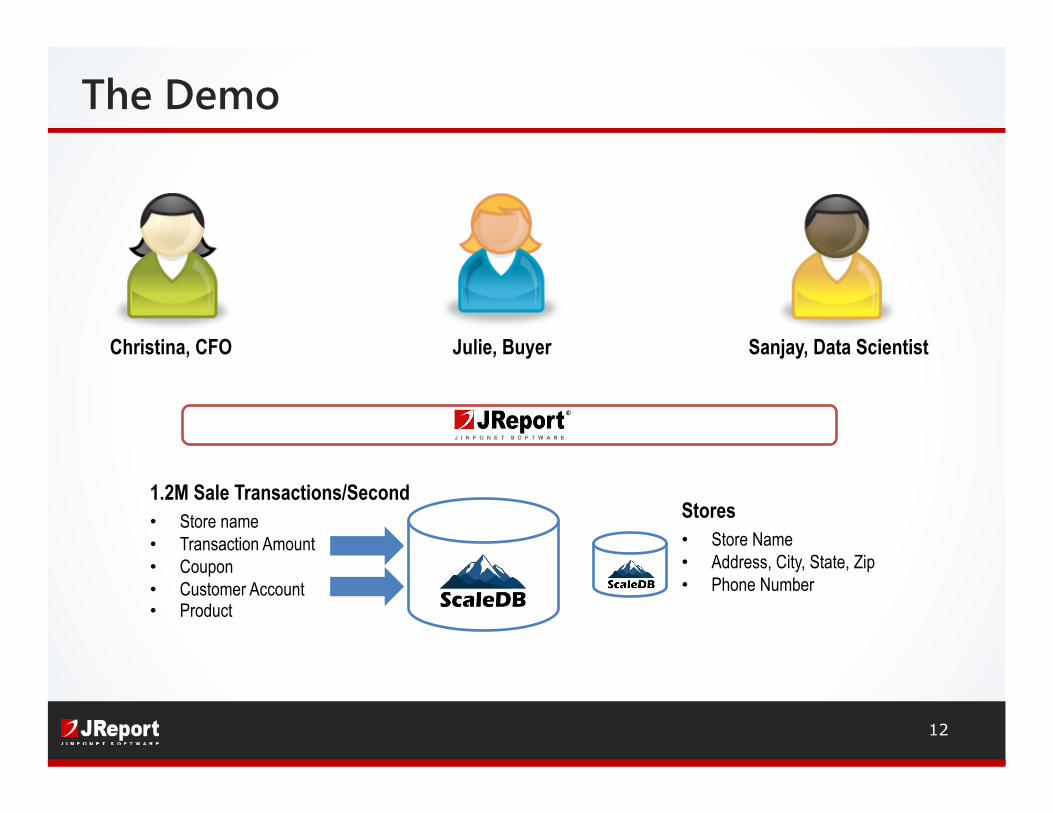
The Demo
12
Christina, CFO Julie, Buyer Sanjay, Data Scientist
1.2M Sale Transactions/Second • Store name • Transaction Amount • Coupon • Customer Account • Product
Stores • Store Name • Address, City, State, Zip • Phone Number
13
• Real-Time Streaming Data Analytics and Visualization • High-Velocity: Millions of Inserts per Second • Powerful: Real-time, ad hoc queries over Big Data • Interactive: Full range of data analysis and OLAP • Total Cost: Low TCO BI platform and real-time DB
JReport + ScaleDB
14
• Look for our follow-up email ! Exclusive JReport 13 Trial ! Free Proof of Concept ! Whitepaper: Streamlining the Process of Business Intelligence for
Mid-Sized Organizations
• On-Demand Product Demo – Watch it anytime
• For more info, visit: www.jinfonet.com and www.scaledb.com E-mail: [email protected], [email protected] Phone: (240) 477-1000 Follow us @Jinfonet
Next Steps