Real proven solutions to enable active demand and ...
32
This project has received funding from the European Union’s Horizon 2020 research and innovation programme under grant agreement No 646.531 Summary of results obtained in WP8 and recommendations D8.5 2015 The UPGRID Consortium Real proven solutions to enable active demand and distributed generation flexible integration, through a fully controllable LOW Voltage and medium voltage distribution grid WP8 - Monitoring & Impact Assessment of Project Demonstrations
Transcript of Real proven solutions to enable active demand and ...
This project has received funding from the European Union’s Horizon 2020 research and innovation programme under
grant agreement No 646.531
Summary of results obtained in WP8 and recommendations
D8.5
2015 The UPGRID Consortium
Real proven solutions to enable active demand and distributed
generation flexible integration, through a fully controllable
LOW Voltage and medium voltage distribution grid
WP8 - Monitoring & Impact Assessment of
Project Demonstrations
Monitoring & Impact Assessment of Project Demonstrations
D8.5 SUMMARY OF RESULTS OBTAINED IN WP8 AND RECOMMENDATIONS
2 | 32
PROGRAMME H2020 – Energy Theme
GRANT AGREEMENT NUMBER 646.531
PROJECT ACRONYM UPGRID
DOCUMENT D8.5
TYPE (DISTRIBUTION LEVEL) ☒ Public
☐ Confidential
☐ Restricted
DUE DELIVERY DATE 31/12/2017
DATE OF DELIVERY 16/02/2018
STATUS AND VERSION Final / v08
NUMBER OF PAGES 32
WP / TASK RELATED WP8 / T8.5
WP / TASK RESPONSIBLE COMILLAS / COMILLAS
AUTHOR (S) COMILLAS (Álvaro Sánchez, Miguel A. Sanz, Miguel
Martín)
PARTNER(S) CONTRIBUTING ITE (Irene Aguado), IMPERIAL (Spyros Giannelos,
Dimitros Papadaskalopoulos), IBERDROLA (Ana
González, Raúl Bachiller), EDP Distribuição
(Gonzalo Faria), VATTENFALL (He Ying, Nicholas
Etherden), ENERGA (Noske Slawomir), INESC
(Luisa Gonçalves).
OFFICIAL REVIEWER/S TECNALIA (Eduardo García), IBERDROLA (Raúl
Bachiller)
FILE NAME UPGRID_WP8_D8 5_WP8_Conclusions_v08
Monitoring & Impact Assessment of Project Demonstrations
D8.5 SUMMARY OF RESULTS OBTAINED IN WP8 AND RECOMMENDATIONS
3 | 32
DOCUMENT HISTORY
VERS. ISSUE DATE CONTENT AND CHANGES
v01 27/09/2017 First preparation of the document by COMILLAS.
v02 01/12/2017 Draft sent to ITE, INESC and IMPERIAL to introduce their
improvements.
v03 05/12/2017 Contributions from ITE, INESC and IMPERIAL.
v04 11/12/2017 Second draft prepared by COMILLAS and sent to the WP8
partners.
v05 19/12/2017 Modifications attending comments coming from Iberdrola, EDP,
Vattenfall, ENERGA and official reviewers.
v06 22/12/2017 Modifications attending comments coming from a second round
of the official reviewers. Including some comments from ENERGA
as well.
v07 07/02/2018 Modifications attending the new changes made in deliverable
D8.4 and D8.6
v08 08/02/2018 Modifications attending comments of v07 from reviewers

Monitoring & Impact Assessment of Project Demonstrations
D8.5 SUMMARY OF RESULTS OBTAINED IN WP8 AND RECOMMENDATIONS
4 | 32
EXECUTIVE SUMMARY
This deliverable describes the most significant results and recommendations obtained during work
package (WP) 8 - Monitoring & Impact Assessment of Project Demonstrations. The objective of WP8 was
the analysis of the four demonstrators implemented in order to compare the results obtained (mainly
contrasting business as usual (BAU) and research & innovation (R&I) scenarios within each
demonstrator) and to formulate experiences learned.
WP8 was developed by tackling the following six tasks:
• Task 8.1. KPIs analysis of the demonstrators
• Task 8.2. Performance monitoring of the demonstrators
• Task 8.3. Life cycle estimation of main components
• Task 8.4. Cost-benefit analysis
• Task 8.5. Conclusions and recommendations
• Task 8.6. System wide benefits of UPGRID services
The present deliverable relates specifically to the task 8.5 which summarizes the most significant points
appeared during the development of the WP8.
The main results and recommendations in this deliverable are organized around the five European
Electricity Grid Initiative (EEGI)1 [12] clusters which were the focus of attention of previous work
packages of the UPGRID project starting in WP1 – Scope and boundaries of project demonstrators, more
precisely in D1.1 – Report on technical specifications [1]:
• EEGI Cluster 1: Integration of smart customers
• EEGI Cluster 2: Integration of DER and new uses
• EEGI Cluster 3: Network operations
• EEGI Cluster 4: Network planning and asset management
• EEGI Cluster 5: Market design
EEGI Cluster 1: Integration of smart customers
The UPGRID project has addressed some of the gaps and barriers identified by the EEGI [16] regarding
this first cluster. Three of the demos have developed web platforms to provide universal availability of
1 In July 2016 the European Technology and Innovation Platform for Smart Networks for the Energy Transition (ETIP SNET) was created. The ETIP SNET merges and replaces the EEGI and the European Technology Platform (ETP) SMARTGRIDS. In the scope of this document, all the references are to EEGI and not to ETIP SNET as the EEGI methodology was selected as the framework of the project at the beginning (January 2015).
Monitoring & Impact Assessment of Project Demonstrations
D8.5 SUMMARY OF RESULTS OBTAINED IN WP8 AND RECOMMENDATIONS
5 | 32
timely information on consumption and prices based on AMI deployments. Furthermore, some demos
have organized events and workshop with final customers in the demo areas to address the “education
about smart grids in general and UPGRID solutions in particular”. That is, what UPGRID has been doing
and how they it can benefit from it [2]. Furthermore, the Portuguese demo has installed home energy
management system (HEMS) in some customer premises [4].
The KPIs [2][7] related to this cluster involve aspects of smart grids that will have important impact in
customers with the main challenge of empowering customers, so they can gain greater control over
their electricity usage to lower costs, improve convenience and support growing environmental
awareness.
Another aspect identified by the EEGI for this cluster was the “widespread availably of smart appliances
and equipment that can be controlled directly or by home energy management systems” and “prices
that reflect the cost of energy at different times”. Responding to these issues, the Portuguese demo has
been dealing with the implementation of a demand side management system in the scope of the
UPGRID project [4].
In order to obtain more information on this cluster, several models were developed in task 8.2 [8]
focused on the analysis of results corresponding to: distributions of customers per distribution
transformer (DT), probability distribution functions of customers participating per DT, probability
distribution function of load per DT. The parameters obtained for these models are similar in the four
demos studied for both scenarios BAU and R&I.
One of the main conclusions in this cluster is that engaging final customers is essential in smart grids
projects to ensure a proper and successful development of those activities related to those customers
(active demand response, training and proactivity in the use of HEMS, workshops participation,
customer behaviour characterization, etc.). Important difficulties have been faced in order to
characterize stakeholders and involve customers in the project, requiring extra effort for the
deployment of dissemination, interaction and participation activities to maximize that involvement
EEGI Cluster 2: Integration of DER and new uses
The second cluster proposed by the EEGI is called “integration of DER and new uses” and involves the
growing integration of distributed energy resources (DER) and distributed generation (DG) to evolve the
conventional central structures towards a distributed electricity system with a bidirectional power flow
under the influence of small DER units feeding in at medium voltage (MV) and low voltage (LV) level of
the network.
The scope of this cluster in the UPGRID project has consisted of introducing some charging stations and
remote management of client premises through home management systems and calculations to

Monitoring & Impact Assessment of Project Demonstrations
D8.5 SUMMARY OF RESULTS OBTAINED IN WP8 AND RECOMMENDATIONS
6 | 32
improve DER hosting capacity. In this way, the Spanish and Polish demos have been able to support
more DER through enabling DER controllability using PoweRline Intelligent Metering Evolution (PRIME)2.
The most significant KPIs elaborated in this cluster have been “generation flexibility” that stands at
3,55% for a proof of concept carried out by the Polish demo [7][6] and the “hosting capacity of electric
vehicles” evaluated in the scope of the Portuguese demo [4][7], while the hosting capacity for solar
photovoltaics was calculated in the Swedish demo [5][7].
Some analyses were done in task 8.2 [8] in order to obtain more information about the impact in this
cluster. Probability distribution functions of voltages per DT were obtained through parametric models
of the three phases of the DTs studied. In an equivalent way, probability distribution functions of
currents per DT were obtained and analysed. As an extension to the analysis of voltages and currents
per phase in the DTs, joint models of the probability density functions current/voltage per DT were
developed. In case of the Spanish demo [3] an analysis of energy losses was carried out for obtaining
profiles of energy losses per DT and joint models of probability density functions for load and energy
losses per DT. This will help to detect problems in the grid where high penetration of DER will be
present.
The main benefits observed in this cluster have been that the network is ready to allocate a high rate of
DER, avoiding overvoltage and achieving a reduction of energy losses thanks to the monitoring and
control systems.
EEGI Cluster 3: Network operations
In the third EEGI cluster called “network operations”, the electricity distribution network, between
transmission network and the customer, is becoming more important than ever due to its key role on
the new electricity scenario (DG connected at any part of the MV and LV grid, load management
capabilities, active participation of the consumers/prosumers in the grid O&M, etc.). This is facilitated by
the deployment of monitoring and control devices (e.g. in secondary substations (SSs) and LV feeders),
millions of smart meters (SMs), DER (e.g. electric vehicles (EV)), active demand management (ADM),
energy storage systems (ESS) and distributed renewable energy sources (DRES)). So the main challenge
regarding the network operation cluster is the exploitation of novel real or near real-time solutions with
inherent security and intelligent communications for smart distribution network operation and
management.
One of the most important impacts of the UPGRID project has been the set of developments in this
cluster in all the demos [3][4][5][6]. As stated by the EEGI, the future electricity distribution network lies
on a strong information layer built from the new intelligent components that are being deployed in the
distribution network. The KPI “availability of intelligent network components” shows up to nearly 300%
2 Swedish demo uses Open Smart Grid Protocol (OSGP) which is one standard more widespread in Sweden. It is a family of specifications published by the European Telecommunications Standards Institute (ETSI) used in conjunction with the ISO/IEC 14908 control networking standard for smart grid applications.
Monitoring & Impact Assessment of Project Demonstrations
D8.5 SUMMARY OF RESULTS OBTAINED IN WP8 AND RECOMMENDATIONS
7 | 32
of higher availability comparing the R&I and BAU scenarios. Moreover, the EEGI explains the need that
“the information potentially available from SMs may be exploited to the advantage of both the
distribution network operation and the customer”. All the UPGRID demos have strongly addressed this
gap as it has been reflected by the KPIs [7], for example, the “Average time for LV faults” has been
improved between 8,1% and 50,21% depending on the demo.
The contribution of the UPGRID project to the “network operations” cluster has not been restricted to
enlarging the information layer, but also has addressed the use of this information to improve the
management and control of the distribution network. All the UPGRID demos have developed new
network systems and procedures taking advantage of the new information available to improve the
distribution management in LV and MV (e.g. low voltage network management system (LV NMS)). This
was reflected by different KPIs as described in this report. In addition, the UPGRID demos have also tried
to improve or to add new functionalities to the already existing procedures, such as the meter readings
and events for LV O&M (e.g. LV incident management and predictive maintenance). Furthermore, with
the objective of improving the visibility of the LV distribution network great efforts have been done to
model the LV network and know the connection of each SM (phase, fuse box, etc.).
The previous information was complemented with analyses carried out in task 8.2 [8] in order to obtain
more information about the impact in this cluster of the UPGRID actions. The most relevant analyses in
this area were: analysis of probability distribution functions of fault duration in LV; analysis of
probability distribution functions of Time Between Fault (TBF); analysis of normal behaviour models
characterising load in a DT and development of models of normal behaviour of the dynamic load
observed per DT.
UPGRID has provided a lot of benefits coming from different implemented functionalities of this cluster
that are detailed in this report such as improvement in voltage regulation, supply restoration and supply
voltage correction. Moreover, the UPGRID project has achieved a collateral effect of reduction of energy
losses using tap changers and reconfiguring the network.
EEGI Cluster 4: Network planning and asset management
The fourth cluster proposed by the EEGI is called “network planning and asset management” and
involves all the aspects of developing efficient planning tools to allow distribution system operators
(DSOs) to reduce their costs without affecting the quality of supply. This is the second most impacting
area where the UPGRID project has reached interesting results. As examples, the Spanish demo
extended the use of PRIME to add LV control capability with an encouraging result of 17,50% success
index comparing the R&I and BAU scenarios according to the KPI “success index in PRIME advanced
functionalities” [3][7]. It is relevant the effort that all the demos have done in increasing the use of
equipment and protocol standards as reflected by the KPI “use of equipment standards” (improvements
between 125% and 140% comparing R&I and BAU scenarios) and the KPI “use of protocol standards”
(improvements up to 135% for some demos).
One model has been developed in task 8.2 [8] that is able to characterize the load profile. This can be
useful in supporting decisions about new network investments and planning. Other important benefits

Monitoring & Impact Assessment of Project Demonstrations
D8.5 SUMMARY OF RESULTS OBTAINED IN WP8 AND RECOMMENDATIONS
8 | 32
that UPGRID project has achieved in this cluster are around the improvement of network
reconfiguration functionalities. Also, the deployment of mobile devices (LV NMS mobile solutions) in the
UPGRID project has facilitated the improvement of the asset management, apart from the previously
mentioned LV network operation.
In this cluster the task 8.3 [9] contributed with its results to a better position to improve the asset
managements through the development of life models representing the lifetime of the most significant
components involved in the UPGRID demos. Some results in this task were obtained by modelling the
lifetime using parametric models, and real cases based on recorded information and some others were
based on manufacturer information. The largest part of the communication devices (remote terminal
units (RTUs), routers, etc.) has a life expectancy between 10 and 20 years, being 15 a very common
value. For batteries and battery chargers (for SS) the expectancy of life is between 8 and 15 years but
usually the batteries are replaced sooner due to either internal DSO procedures or law regulations. In
the case of the SMs the manufactures expect a mean life between 15 and 20 years but, once again, their
replacement might be done earlier. For components of the distribution systems itself, such as
transformers, cables, cabinets, etc. , the mean life expected is upper than 20 years.
EEGI Cluster 5: Market design
The fifth cluster proposed by the EEGI is called “market design”. It involves several market design issues
that need to be addressed at the EU level for future distribution networks. The main contribution to this
cluster has been the attempt of engaging customers to involve them in demonstrations. Also, UPGRID
with several tools developed in the project has prepared the way for the development of a retail
market-related results, such as a Market Hub and web portals to interact with end-users, where future
stakeholders and DSO can interact to share information with business purposes.
Monitoring & Impact Assessment of Project Demonstrations
D8.5 SUMMARY OF RESULTS OBTAINED IN WP8 AND RECOMMENDATIONS
9 | 32
TABLE OF CONTENTS
EXECUTIVE SUMMARY _________________________________________________________________ 4
TABLE OF CONTENTS __________________________________________________________________ 9
LIST OF FIGURES _____________________________________________________________________ 10
ABBREVIATIONS AND ACRONYMS ______________________________________________________ 11
1. INTRODUCTION ___________________________________________________________________ 13
2. SUMMARY OF WP8 FINDINGS ________________________________________________________ 14
2.1 EEGI CLUSTER 1: INTEGRATION OF SMART CUSTOMERS ________________________________________ 14
2.2 EEGI CLUSTER 2: INTEGRATION OF DER AND NEW USES ________________________________________ 16
2.3 EEGI CLUSTER 3: NETWORK OPERATIONS ___________________________________________________ 17
2.4 EEGI CLUSTER 4: NETWORK PLANNING AND ASSET MANAGEMENT _______________________________ 21
2.5 EEGI CLUSTER 5: MARKET DESIGN _________________________________________________________ 22
3. RECOMMENDATIONS TO IMPROVE THE IMPACT & LESSONS LEARNT ________________________ 24
3.1 EEGI CLUSTER 1: INTEGRATION OF SMART CUSTOMERS ________________________________________ 24
3.2 EEGI CLUSTER 2: INTEGRATION OF DER AND NEW USES ________________________________________ 25
3.3 EEGI CLUSTER 3: NETWORK OPERATIONS ___________________________________________________ 26
3.4 EEGI CLUSTER 4: NETWORK PLANNING AND ASSET MANAGEMENT _______________________________ 27
3.5 EEGI CLUSTER 5: MARKET DESIGN _________________________________________________________ 28
4. CONCLUSIONS ____________________________________________________________________ 29
REFERENCES ________________________________________________________________________ 31

Monitoring & Impact Assessment of Project Demonstrations
D8.5 SUMMARY OF RESULTS OBTAINED IN WP8 AND RECOMMENDATIONS
10 | 32
LIST OF FIGURES
FIGURE 1: UPGRID CONTRIBUTIONS TO EEGI OBJECTIVES ......................................................................... 29

Monitoring & Impact Assessment of Project Demonstrations
D8.5 SUMMARY OF RESULTS OBTAINED IN WP8 AND RECOMMENDATIONS
11 | 32
ABBREVIATIONS AND ACRONYMS
ADM Active Demand Management
AMI Advanced Metering Infrastructure
BAU Business as Usual
CBA Cost benefit analysis
DER Distributed energy resource
DES Distributed energy source
DG Distributed Generation
DSM Demand-Side Management
DSO Distributed System Operator
DT Distribution Transformer
EV Electric Vehicle
EEGI European Electricity Grid Initiative
ESS Energy Storage Systems
ETIP SNET European Technology and Innovation Platform for Smart
Networks for the Energy Transition
ETP European Technology Platform
HEMS Home Energy Management System
KPI Key Performance Indicator
LV Low Voltage
MV Medium Voltage
LV NMS Low Voltage Network Management System
O&M Operation and Maintenance

Monitoring & Impact Assessment of Project Demonstrations
D8.5 SUMMARY OF RESULTS OBTAINED IN WP8 AND RECOMMENDATIONS
12 | 32
OSGP Open Smart Grid Protocol
PRIME PoweRline Intelligent Metering Evolution
PV Photo Voltaics
R&I Research and innovation scenario
RTU Remote Terminal Unit
SM Smart meter
SOM Self-Organized Map
SS Secondary Substation
TBF Time Between Faults
WP Work Package
TBF Time Between Faults
Monitoring & Impact Assessment of Project Demonstrations
D8.5 SUMMARY OF RESULTS OBTAINED IN WP8 AND RECOMMENDATIONS
13 | 32
1. INTRODUCTION
The present deliverable is part of the WP8 - Monitoring & Impact Assessment of Project Demonstrations.
The objective is to provide a summary of results obtained in WP8 and recommendations. Therefore, it
has been elaborated taken as reference mainly previous WP8 deliverables: D8.1 - Report about KPIs
analysis and methods of comparison [7], D8.2 - Analysis of performance monitoring and its comparison
among demos [8], D8.3 - Report about the estimated life cycle of the demos and its parameters [9] and
D8.4 - Report about Cost-Benefit Analysis and its components [10]. In this way different perspectives are
considered that facilitates a global and integrated view of the results obtained in this work package task:
• KPIs for BAU and R&I scenarios
• Performance characterization based on parametric and non-parametric models for BAU and R&I
scenarios
• Lifetime of the main components involved in the smart nature of the new distribution networks
• Cost-benefit analysis considering the indirect impacts like environmental issues and social
benefits.
The main results and recommendations in this deliverable are organized around the 5 European
Electricity Grid Initiative (EEGI)3 [12] clusters which were the focus of attention of previous WP of the
UPGRID project starting in WP1 – Scope and boundaries of project demonstrators, more precisely in D1.1
– Report on technical specifications [1]:
• EEGI Cluster 1: Integration of smart customers
• EEGI Cluster 2: Integration of DER and new uses
• EEGI Cluster 3: Network operations
• EEGI Cluster 4: Network planning and asset management
• EEGI Cluster 5: Market design
Further technical details about the four UPGRID demonstrators can be found in their final reports:
Spanish demo [3], Portuguese demo [4], Swedish demo [5] and Polish demo [6].
This report is organized around four chapters. The present chapter describes its objective and provides
these brief introductory notes. The second chapter lists a set of findings from different tasks developed
in WP8. The third chapter provides recommendations suggested from the conclusions obtained in the
work package. Finally, chapter four presents a summary of conclusions.
3 In July 2016 the European Technology and Innovation Platform for Smart Networks for the Energy Transition (ETIP SNET) was created. The ETIP SNET merges and replaces the EEGI and the European Technology Platform (ETP) SMARTGRIDS. In the scope of this document, all the references are to EEGI and not to ETIP SNET as the EEGI methodology was selected as the framework of the project at the beginning (January 2015).

Monitoring & Impact Assessment of Project Demonstrations
D8.5 SUMMARY OF RESULTS OBTAINED IN WP8 AND RECOMMENDATIONS
14 | 32
2. SUMMARY OF WP8 FINDINGS
This chapter describes the main findings and conclusions of the tasks 8.1, 8.2, 8.3 and 8.4 developed in
WP8 [7][8][9][10]. It is structured following the EEGI clusters, since they can be considered as the nexus
between Demos and WP8 results that allows an organized and understandable presentation of WP8
results summary.
2.1 EEGI CLUSTER 1: INTEGRATION OF SMART CUSTOMERS
The UPGRID project has addressed some of the gaps and barriers identified by the EEGI [16] regarding
this first cluster. Three of the demos have developed web platforms to provide universal availability of
timely information on consumption and prices based on AMI deployments. Furthermore, some demos
have organized events and workshop with final customers in the demo areas to address the “education
about smart grids in general and UPGRID solutions in particular”. That is, what UPGRID has been doing
and how they it can benefit from it [2]. Furthermore, the Portuguese demo has installed HEMS in some
customer premises [4].
The KPIs involve all the aspects of smart grids that will ultimately impact customers with the main
challenge of empowering customers, so they can gain greater control over their electricity usage to
lower costs, improve convenience and support growing environmental awareness [12].
The participation of the customer in this kind of activities has been measured through two main KPIs.
The KPI “Participant recruitment” measures the fraction of customers accepting participation in the
different demos and its result, between 10% and 60% depending on the demo, shows the challenge of
engaging customers. The results of KPI “Active participation”, as a measure of the fraction of customer
taking part in the different demos were more encouraging, between 40% and 90% [7].
One of the important barriers identified by the EEGI for this cluster [16] was the “widespread availably
of smart appliances and equipment that can be controlled directly or by HEMs” and “prices that reflect
the cost of energy at different times”. The Portuguese demo has been involved in the implementation of
a demand side management (DSM) system in the scope of the UPGRID project [7].
In order to obtain more information on this cluster, several models were developed in tasks 8.2 [8].
• Analysis of results corresponding to the model [8] “Distributions of customers per Distribution
Transformer (DT)”.
This study analyses the distribution of customers per DT covering the topology of selected parts
of the demonstration areas. The number of customers covered by them differs from demos,
being more relevant for the Swedish case since it is located in a rural area instead of an urban
area as the others. The same happens with the number of SSs. In general, the rated power of
the DTs under study was similar in all the demos. In the Swedish demo there is a lower number
of customers per DT than in the other demos.

Monitoring & Impact Assessment of Project Demonstrations
D8.5 SUMMARY OF RESULTS OBTAINED IN WP8 AND RECOMMENDATIONS
15 | 32
• Analysis of results corresponding to the model [8] “Probability distribution function of customers
participating per DT”.
In general, the parameters found are comparable in all the demos except for the Swedish demo
that are lower, because of the rural nature of the demo. In particular, the values: most
probable number of customers per DT and most probable power contracted (kW) per DT.
• Analysis of results corresponding to the model [8] “Probability distribution function of load per DT”.
The parameters obtained for these models are similar in the four demos studied for both
scenarios BAU and R&I. However, in case of the Polish demo, for the R&I scenario, the values of
the parameters for mean load per customer per hour have been observed with reduced values.
This can be due to several reasons such as change in the consumption profile by customer and
change in the network operation.
Additionally, models based on the reactive power measurement were developed for the demos in Spain
and Portugal as in the previous cases based on active power. In general, the parameters of these models
are comparable as well.
All of this is connected with the active demand for increased network flexibility functionality, which is
implemented in the Portuguese demo, and it has the potential to produce some benefits. More
specifically, this functionality enables control of customer’s load during periods of network constraints.
It involves shifting demand from peak periods to off-peak periods. This action leads to reduced losses
(due to the shifting of the peak load) as well as prevention of conventional network reinforcement.
Hence the associated benefits include:
• Reduction of the economic cost of energy losses.
• Reduction of capital expenses due to achieved deferral / avoidance of conventional
reinforcements.
One of the main conclusions in this cluster is that engaging final customers is essential in smart grids
projects to ensure a proper and successful development of those activities related to those customers.
The results identified groups in middle age, who have elevated levels of education and are available to
participate in the project activities, as the most promising people segment for an active participation in
the Smart Grids Customer-oriented opportunities. It is important to underline two aspects: the
availability of respondents to take part in the demonstration project and the interest to learn more
about smart grids. However, the project faced difficulties to characterise stakeholders and the data
collection gathered for them required a high effort (i.e. time, human and technological resources) to
involve customers in the project. Different strategies and approaches were tested until developing one
that could collect data from customers effectively (face to face workshops, personally supported
surveys, continuous contact, etc.).
Monitoring & Impact Assessment of Project Demonstrations
D8.5 SUMMARY OF RESULTS OBTAINED IN WP8 AND RECOMMENDATIONS
16 | 32
2.2 EEGI CLUSTER 2: INTEGRATION OF DER AND NEW USES
The second cluster proposed by the EEGI is called “integration of DER and new uses”. It involves the
growing integration of DER and DG to evolve the conventional central structures towards a distributed
system with a bidirectional power flow under the influence of small DER units feeding in at MV and LV
level of the network [12].
The scope of this cluster in UPGRID project consists of, on the one hand, introducing some EV charging
stations and remote management of client premises through home management systems in the
Portuguese demo. On the other hand, the Swedish and Polish demos have made some calculations to
improve DER hosting capacity. Finally, the Spanish and Polish demos can support injecting more DER
generation through enabling for example PV controllability using LV control over PRIME together with
the LV monitoring enhancement.
The UPGRID project has worked to address some of the gaps and barriers identified by the EEGI
regarding this second cluster, although it has not been one of the main working lines. The most
significant KPIs with regards to have been “generation flexibility” that stands at 3,55% for a proof of
concept carried out by the Polish demo [6][7] and the “hosting capacity of electric vehicles” evaluated in
the scope of the Portuguese demo [3][7].
Some analyses were done in task 8.2 in order to obtain more information about the impact in this
cluster. Most of these analysis are focuses on the instability and balance of voltages and currents being
impacted by DER.
• Analysis of results corresponding to the model [8] “Probability distribution function of voltages per
DT”.
Parametric models were obtained for the three phases of the DTs studied. These models were
developed for the Spanish and Portuguese cases. The balance of voltages among phases is very
good being even better in the Portuguese demo. Unbalances not allowed were not detected.
• Analysis of results corresponding to the model [8] “Probability distribution function of currents per
DT and demonstrator”.
Similar models created for voltages were developed for currents. These models were
developed for the Spanish and Swedish demos. The currents per phase have very light
unbalances of current.
• As an extension to the analysis of voltages and currents per phase in the DTs, it was developed the
joint model [8] of the probability density functions current/voltage per DT. This model tries to
observe the relationship between current and voltage. This model was developed for the Spanish
demo. The main results were the patterns discovered from data after a clustering method that
relate voltage and current according to different nominal rated power of the DTs.
• An analysis of energy losses was carried out in the following two approaches: the model [8]
“Profiles of energy losses per DT” and the joint models [8] of probability density functions for load
and energy losses per DT. These models characterize in few parameters the typical ranges of losses
observed in the DTs both in copper and iron. In order to do that, the load, voltage and current were

Monitoring & Impact Assessment of Project Demonstrations
D8.5 SUMMARY OF RESULTS OBTAINED IN WP8 AND RECOMMENDATIONS
17 | 32
used and also the losses estimated by the manufacturer for each DT. These models were developed
for the Spanish demo and some particular cases were detected to be monitored.
The main benefits in this cluster in the UPGRID project are coming from the active microgeneration
performed in the Polish demo. It can lead to reduction of losses by actively managing the reactive power
capability of solar PV inverters, provided that such capability is allowed. Besides, EV integration can lead
to capital cost savings considering that the new peaks are managed in such a way that they do not
exceed the thermal limits of existing equipment.
The main conclusion is that the network will be prepared to allocate a high rate of DER, avoiding
overvoltage and achieving a reduction of energy losses thanks to the monitoring system, although
specific analysis must be performed in the selected area to consider all variables.
2.3 EEGI CLUSTER 3: NETWORK OPERATIONS
The third cluster proposed by the EEGI is called “network operations”. As seen by the EEGI, the future
electricity distribution network, between transmission network and the customer, will become
increasingly equipped by instruments due to the mass deployment of network equipment sensors and
monitoring instrumentation, millions of SMs, small-scale generation and responsive load. Therefore, the
main challenge regarding the network operation cluster is the exploitation of novel real-time solutions
with inherent security and intelligent communications for smart distribution network operation and
management [12]. This cluster is the most important one where UPGRID project has achieved more
impact.
The UPGRID project has worked to address most of the gaps and barriers identified by the EEGI
regarding this third cluster, which has been one of the main working lines in the scope of the UPGRID
demos. As stated by the EEGI, the future electricity distribution network lies on a strong information
layer built from the new intelligent components that are being deployed in the distribution network.
The results of the KPI “availability of intelligent network components”, up to nearly 300% comparing the
R&I and BAU scenarios, show the contribution of the UPGRID demos to this barrier identified by the
EEGI [16]. Moreover, the EEGI explains the need that “the information potentially available from SMs
may be exploited to the advantage of both the distribution network operation and the customer”. All
the UPGRID demos have strongly addressed this gap as it has been reflected by the KPI “monitored
information categories” (around 230% for some demos), the KPI “available information categories”
(between 300% and 450% for most of the demos) and the KPI “characterized information categories”
(up to 99% for some demos comparing before and after the UPGRID deployment) [7].
The contribution of the UPGRID project to the “network operations” cluster has not been restricted to
enlarging the information layer, but has addressed the use of this information to improve the
management and control of the distribution network. As stated by the EEGI, “handling future demands
of higher reliability, renewable integration and increased use of SMs will require flexibility, with
interactions on monitoring and control”. All the UPGRID demos have developed new network systems
and procedures taking advantage of the new information available to improve the distribution

Monitoring & Impact Assessment of Project Demonstrations
D8.5 SUMMARY OF RESULTS OBTAINED IN WP8 AND RECOMMENDATIONS
18 | 32
management in LV and MV networks as it has been reflected by the KPI “fulfilment of voltage levels”
(with improvements up to nearly 50% for some demos), the KPI “average for LV faults” (with reductions
in time more than 8% in the demos, with certain fault types being possible to shorten with up to 50,2%
in the Swedish demo), the KPI “average time needed for fault location in MV” (nearly 40% in some
demos), the KPI “quality of supply in LV” (around 50% for some demos), the KPI “quality of supply
improvement in MV” (between 61% and 85% of improvement) and the KPI “energy losses” (with a
reduction of nearly 70% in the Polish demo) [7].
In addition to improving the information layer and developing new procedures for the distribution
network management, the UPGRID demos have also tried to improve or add new functionalities to
already existing system and procedures, such as analysis of the smart meter events or LV grid detailed
representation. With this regard, the KPI “success index in meter reading” has been improved up to 16%
in some demos comparing the R&I scenario and the BAU scenario. Moreover, there has been a proof on
concept to extract also events information from the SMs in the Spanish and Polish demo with results
between 70% and 98% according to the KPI “success index in events reading”. Finally, with the final
objective of improving the visibility of the LV distribution network, some efforts have been done by the
Spanish demo to better know the connection of each SM (phase, fuse box, etc.) with an encouraging
improvement of nearly 50% comparing the R&I and the BAU scenario for the KPI “success index in meter
connectivity”
Some analyses were done in task 8.2 [8] in order to obtain more information about the impact in this
cluster:
• Analysis of results corresponding to the model [8] “Probability distribution function of fault
duration”.
The results present the typical values of the interruption duration in the selected areas of
demonstration. In case of the Spanish demo the values obtained for the R&I scenario were
lower than in the BAU scenario both for interruption duration and fault restauration. This is due
to the installation of the LV NMS and several new devices in the UPGRID project which measure
several different signals in the low voltage network. Moreover, the development of new tools
to take advantage of the new collected data provides an improved management to the
traditional handling of LV interruptions. As a result, the field crews can manage the
interruptions faster and more efficiently.
• Analysis of results corresponding to the model [8] “Probability distribution function of Time
Between Fault (TBF)”.
This model characterizes the distribution function of the time between incidents or faults in the
demonstration areas. On the one hand, in the case of the Spanish demo the values observed
for the R&I scenario have mainly increased with respect to this demo in BAU scenario. On the
other hand, the maximum value of TBF has decreased. This is in line with the explanation
provided in the previous paragraph.
• Analysis of results corresponding to the model [8] “Normal behaviour models characterising load in
a DT” and the model [8] of normal behaviour of the dynamic load observed per DT.

Monitoring & Impact Assessment of Project Demonstrations
D8.5 SUMMARY OF RESULTS OBTAINED IN WP8 AND RECOMMENDATIONS
19 | 32
The dynamic profile of load observed in the four selected demonstration areas in the BAU
scenario is very similar, being almost identical in the cases of the demonstrators in Spain,
Portugal and Poland. The case of Sweden is different due to its rural character. The cases
studied for the R&I scenario are not different to the BAU scenario. However, in the future if the
demos add DSM and DER, the profiles are expected to change. Furthermore, these models can
help to assess the potential in the market participation of the customers. Finally, these models
can also be used to assist in detecting abnormal network behaviours (e.g. failures, fraud).
UPGRID has provided a lot of benefits coming from different implemented functionalities. Firstly,
improved supply restoration is a functionality that enables the DSO to improve the LV incident
management (e.g. faster awareness about the occurrence of LV incidents and increase field work
efficiency while dealing with it) as compared to the traditional case in which DSO was aware about an LV
outage thanks to customer calls. The more detailed, reliable and updated information available together
with the LV NMS capabilities allow to lower supply restoration times. This quality of service
improvement means also lower unserved energy and, as a result, increase the social benefit. Then, the
social and DSO benefits are:
• Social benefits related to the reduced social cost of unserved demand.
• DSO benefits related to the improved efficiency of the DSO O&M processes (e.g. avoidance of
unnecessary field crew displacement, reduction of the duration of field work and improvement
of the quality of information from the field).
Specifically, this functionality is deployed across all Demos and the CBA examines its deployment across
the entire LV grid of Iberdrola Distribución in Spain / LV grid in EDP Distribuição in Portugal / LV and MV
grid in Vattenfall Eldistribution in Sweden / LV grid in Energa Operator in Poland. In each of these grids
the results show that the relative weight of the two types of gross benefits varies depending on the
Demo country given that each Demo representative largely provided a different set of social and DSO
benefits that they deemed important for the CBA. However, overall it can be stated that both gross
benefits are on the same order of magnitude (M€).
Secondly, an example from the Swedish demo is voltage regulation which is a functionality that allows
for automatic voltage regulation through a smart transformer (MV/LV) resulting in eradication of
voltage complications such as the voltage rise effect. Without the implementation of this functionality,
potential development of the voltage rise effect due to deployment of DRES capacity would have to be
dealt with alternatives reinforcement upgrades. This UPGRID functionality presents the DSO with the
capability of reducing the capital expenses in comparison to other evaluated upgrades through the
installation of smart transformers at SSs that perform automatic voltage regulation and successfully
tackle voltage issues. Hence, the benefit associated with voltage regulation is related to capital expenses
reduction through deferral/avoidance of other more costly or less effective reinforcements that would
otherwise be needed. The corresponding CBA performed across the Vattenfall grid in Sweden (870k
customers) has produced a positive net benefit.
Finally, improved testing and correction of supply voltage is a functionality that is aimed at recognizing
rapidly and improving the voltage supply quality at customer premises. Prior to UPGRID implementation
all voltage issues that were detected (e.g. through Customers’ complaints or through the detection of

Monitoring & Impact Assessment of Project Demonstrations
D8.5 SUMMARY OF RESULTS OBTAINED IN WP8 AND RECOMMENDATIONS
20 | 32
related LV incidents) were analysed by field crews, which in most cases led to grid crew displacements
and, in some limited cases, led to the DSO installing a dedicated device at Customers’ premises. This
device could measure voltage for a period of two to three weeks so that the value for various voltage
quality parameters could be confirmed. Confirmed cases resulted in DSO paying compensation to
affected Consumers. However, not all the reported analyses confirmed poor voltage quality episodes;
there were cases that were characterized as “false positives” meaning that the DSO had incurred a cost
for installing the dedicated voltage-monitoring device without an actual need.
As an example of this UPGRID functionality, the Spanish demonstrator involves processing offline SM
events and using a software-based tool (the “Virtual Register”) to monitor SM voltage measurements in
a 5-minute interval and for the duration of 48 hours from selected SMs. This has allowed identifying
potential network areas with voltage issues (e.g. overvoltage and undervoltage). Hence, this approach
improves the management of voltage issues and can even be used to for preventive maintenance
purposes. Overall, this functionality yields economic benefits of two types as follows:
a) Social benefits from the reduced social cost related to voltage issues at Customers’ premises;
b) DSO benefits from cost savings related to the enhanced management of voltage issues (e.g.
reducing field displacements and acquiring more accurate information).
Note that in those cases (‘improved supply restoration’ and ‘improved testing and correction of supply
voltage’) when having considered the enabling cost in its full extension (i.e. cost for new elements but
also the corresponding part of the existing ones), results indicate that the net DSO benefit is negative for
all possible examined amortization periods, while the net total benefit (net social plus DSO benefit)
becomes positive for approximately at least 10-year amortization periods. That is, the DSO cannot justify
the investment using solely its own resources. For this reason, taken into account the relevant social
benefits (cost avoided) that bring the functionalities, it would be advisable for the Regulator to make
sure that the DSO is compensated at least for a significant part so as to make a positive business case.
Hence, these functionalities can deliver significant benefits to the system. This is mainly due to the LV
monitoring enhancement and the use of field data by developed systems (e.g. LV NMS).
The most important conclusions are:
• Increasing LV network observability.
• Reduction of fault detection time (awareness) in LV.
• Reduction of fault location time thanks to LV NMS and using fault indicator devices.
• Improvement of the incident scope included in the fault report in the LV NMS (thanks to
modelling and considering connectivity information).
• Improvement of the quality of supply (customer interruption minutes and number of
interruptions).
• Fulfilment of voltage limits and reduction of voltage variation with, for example, Smart
Transformer and motivating tap changer modifications.
• More efficient field crew management (avoid unnecessary displacements).
Moreover, UPGRID project has achieved a collateral effect of reduction of energy losses using tap
changers and reconfiguring the network.

Monitoring & Impact Assessment of Project Demonstrations
D8.5 SUMMARY OF RESULTS OBTAINED IN WP8 AND RECOMMENDATIONS
21 | 32
2.4 EEGI CLUSTER 4: NETWORK PLANNING AND ASSET MANAGEMENT
The fourth cluster proposed by the EEGI is called “network planning and asset management” and
involves all the aspects of developing efficient planning tools to allow distribution companies to reduce
the costs without a reduction in the quality of supply. The challenge at this point is the real need to
make DSOs more confident about the distributed capability in order to influence future network
investments taking into account how the distributed energy resources, new loads and electric vehicle
charging infrastructure will impact the network sizing [12].
This cluster is the second more important for the UPGRID project, where better results have been
achieved.
The UPGRID project has worked to address some of the gaps and barriers identified by the EEGI
regarding this fourth cluster, mainly through proofs of concept. With this regard the Spanish demo has
proved successfully that the use of PRIME can be extended to new functionalities (e.g. LV control) with
an encouraging result of 17,50% comparing the R&I and BAU scenarios according to the KPI “success
index in PRIME advanced functionalities”.
It is also very important to mention here the relevant effort that all the demos have done in the scope of
the UPGRID project in increasing the use of equipment and protocol standards as reflected by the KPI
“use of equipment standards” (improvements between 125% and 140% comparing R&I and BAU
scenarios) and the KPI “use of protocol standards” (improvements up to 135% for some demos) [7].
One model has been developed in task 8.2 [8] that is able to characterize the load profile. Thanks to this
model, UPGRID can assist in network investments detecting maximum power consumption and
estimating simultaneity factors. Besides, this model has not shown any change in the consumption
profile in the before and after UPGRID project. Maybe, with more time, some changes could be found in
the Portuguese demo.
In this cluster, task 8.3 [9] contributed with its results to a better positioning in order to improve the
asset managements through the development of life models representing the lifetime of the most
significant components involved in the UPGRID demos. Some results in this task were obtained by
modelling the lifetime using parametric models and real examples based on recorded information and
some others were based on manufacturer information. According to the manufacturer information, the
largest part of the communication devices (RTUs, routers, etc.) has a life expectancy between 10 and 20
years, being 15 a very common value. For batteries and battery chargers the expectancy of life is
between 8 and 15 years but usually the batteries are replaced sooner due to internal regulation of the
company or due to law regulations. They are replaced between 5 and 6 years when this occurs. In the
case of the SMs, the manufactures expect a mean life between 15 and 20 years but, once again, their
replacement is done before due to different types of regulations. For components of the power systems
itself, such as cables, LV feeders, etc., the mean life expected is upper 20 years.
Additionally to this information coming from manufacturers, other references based on registered faults
of the mentioned components were also available and used. This information was not extensive and
regular for all the components and for all the demonstration areas. Also, in some cases the data set
Monitoring & Impact Assessment of Project Demonstrations
D8.5 SUMMARY OF RESULTS OBTAINED IN WP8 AND RECOMMENDATIONS
22 | 32
available was not representative. Despite these difficulties, it was considered interesting to contrast the
estimation of lifetime based on real cases of faults with the information coming from the manufactures
in those cases where this was possible. In general, for the components where the analysis was possible
to be carried out, the following information was generated: the two parameters of the Weibull model,
the Mean Time To Failure and the median Life expected. Additionally, model based on time of repairs
was fitted using the available Time To Repair. The estimation of the Mean Time To Repair for some
components can help the strategy of maintenance and time required for their availability in case of
fault.
Regarding the “Network reconfiguration” functionality, both the Portuguese and Polish Demos have
achieved a reduction in energy losses across the grid, making optimal reconfigurations of the network.
The analysis then extended the network under study beyond the borders of the Demo Area and onto
the EDP grid in Portugal (around 5,4M customers) and the ENERGA grid in Poland (around 2,9M
customers). The goal of this analysis has been to perform economic assessment on a potential wide-
scale deployment of the functionality assets across the aforementioned grids. The results indicate that
the net total marginal benefit (only considering the cost of new elements needed for deploying the
solution without accounting other existing solutions) derived from the deployment of the functionality
across both DSOs networks are positive for amortization periods of 1 to 15 years.
As final conclusions, thanks to the network calculation with hourly values, UPGRID can avoid some
expensive copper investments with manual grid reconfiguration, with the estimation of the optimal
common connection point of new customers, and with estimating the best places for smart
transformers. Furthermore, in the Polish demo, an improvement of losses is achieved thanks to the
optimal selection of the distribution transformers size. Additionally, thanks to the deployment of mobile
devices (i.e. the LV NMS mobile solution), UPGRID project has achieved an improvement of the asset
management apart from the LV network O&M improvements. Moreover, UPGRID is prepared for
identifying abnormal conditions through data analytics and anticipated actuation using predictive
maintenance (e.g. using SMs events).
2.5 EEGI CLUSTER 5: MARKET DESIGN
The fifth cluster proposed by the EEGI is called “market design” and involves several market design
issues which need to be addressed at EU level for future distribution networks: charging electricity costs
with tariffs reflecting the marginal cost of electricity, reliability- and quality of supply- based regulations,
quality and safety market impacts induced by the large scale deployment of DER, regulation options to
encourage the development of electricity storage and distributed energy resources, management of the
costs of ownership for DER units when contributing to system services, coupling of electricity and
transport regulations (plug-in hybrid cars) and development of standards for DER (distributed
generation and storage systems) interconnection to the network and telecommunication systems for
DER control [12].

Monitoring & Impact Assessment of Project Demonstrations
D8.5 SUMMARY OF RESULTS OBTAINED IN WP8 AND RECOMMENDATIONS
23 | 32
The main UPGRID project contributions to this cluster have been the attempt of engaging customers to
participate in the demos and the development of a Market Hub. In addition, no specific KPIs for the
market design were defined at the beginning of the project. For these reasons, the conclusions of the
KPI analysis included in the first EEGI cluster can be applied to this cluster too.
The most important functionality in this cluster is the sharing of data among market participants that
needs to follow the corresponding regulation. It is vital for ensuring reliable and effective market
operation as well as for enabling some of the UPGRID functionalities. The benefit of uninterruptible
capability of data exchange is very high as most of the functionalities are based on interaction of various
stakeholders and constant data dissemination.
Furthermore, WP8 can conclude that, in this cluster, UPGRID has developed a Neutral Market Hub as a
preliminary approach to a retail market platform where future stakeholders and utilities can interact to
share information with market purposes. In UPGRID several tools make this real, for example, web
based tools or user data panels where DSOs provide information to customers, and a retail market hub
to involve and inform customers and stakeholders. In this way, UPGRID adds more observability to the
network, enabling new opportunities to establish a retail market.
Finally, WP8 has demonstrated [11] that UPGRID solutions located at the distribution network level are
not only beneficial to these very distribution networks, but they can also offer useful market services to
the wider national and European electricity generation and transmission system. More specifically,
through the monitoring, supervision, communication and control functionalities of UPGRID, flexible
resources located at the distribution level (active demand, microgeneration, energy storage) have the
potential to reduce both a) generation operating costs, by enabling higher utilisation of available RES
and providing various balancing services (primary, secondary and tertiary reserve) to deal with the
inherent variability of this renewable generation, and b) generation and transmission capital costs, by
reducing demand peaks and displacing the need to invest into additional assets. However, a key
challenge behind realizing the value of flexible resources across multiple markets lies on the fact that
the coordination of such types of flexibility entails potential conflicts between the local distribution
network (LV and MV level) and the wider system level (transmission network and generation system).

Monitoring & Impact Assessment of Project Demonstrations
D8.5 SUMMARY OF RESULTS OBTAINED IN WP8 AND RECOMMENDATIONS
24 | 32
3. RECOMMENDATIONS TO IMPROVE THE IMPACT &
LESSONS LEARNT
Once UPGRID project has finished, a lot of lessons have been learnt in the real demonstrations. This
chapter describes some recommendations to improve the impact of the project demonstrations, based
on the results obtained in the tasks 8.1, 8.2, 8.3 and 8.4 developed in WP8 [7][8][9][10]. As the previous
chapter, it is structured following the EEGI clusters to enhance comprehensibility.
3.1 EEGI CLUSTER 1: INTEGRATION OF SMART CUSTOMERS
As previously commented, this cluster was mainly implemented in the Portuguese demo installing some
HEMS's in the customers’ side. UPGRID has learnt that the better results in customer involvement are
obtained when some demonstrative workshops in small areas are made to teach end-users how to use
energy and the importance for the future of an efficient consumption (and generation) management. In
this way, end-user and HEMS interact in a more comprehensive way, since end-user has to program the
HEMS.
Visualising energy consumption is an important tool to increase participation of end-users in the project.
In the case of Portuguese demonstrator, some prototypes were presented during the workshops before
installing the real HEMS’s. The level of engagement increased significantly, and it was reflected in the
increase of survey responses that were also part of a recruitment process to select the houses in which
the system would be installed.
From this cluster, UPGRID recommends installing HEMS in households to involve end-users in the use of
energy. In this way households can provide grid flexibility and also can send very rich information to the
market hub to improve the business of stakeholders and third parties. UPGRID has obtained some
preliminary results to forecast a very important role of the HEMS in the future of the electric sector.
UPGRID recommends the following steps regarding the deployment of HEMS:
• Make energy awareness to end-users, trying to involve them in small workshops and
empowering them with web based tools.
• Install HEMS in their homes, with the following business model: investments need to be made in
an incremental manner (i.e. gradual) rather than all at once. This incremental model will allow
flexibility based on the evolution of factors such as system demand and participation of
customers in the scheme.
• Improve HEMS with self-learning and automation capabilities, to reduce the end-user
intervention.
It is important to note that, prior to make any investment in the system to enable active demand
capability, it is important to study the actual system needs and to recognize whether such technology
will bring benefits to the specific system and when this will happen. Moreover, it is important to take

Monitoring & Impact Assessment of Project Demonstrations
D8.5 SUMMARY OF RESULTS OBTAINED IN WP8 AND RECOMMENDATIONS
25 | 32
into account any other alternative available solution. For example, it has been found that in the
Portuguese demo area such benefits will become significant around the middle of the next decade
because it is possible that load growth will become binding by that period of time.
The net benefits related to active demand can be improved by:
• increasing innovation funding; this will allow devices such as HEMS to attain lower costs.
• making the rewards that customers can get reflect the actual benefits that the actions of the
customers generate to the entire system.
• allowing dynamic tariffs so that customers’ response can be implemented in real-time, given that
Active Demand actions are triggered by the energy price and by grid emergency signals
generated by the DSO.
3.2 EEGI CLUSTER 2: INTEGRATION OF DER AND NEW USES
UPGRID proposes that one of the first steps to achieve an efficient integration of DER is to enhance the
distribution network monitoring and operation. The increase of knowledge about the network status
and having updated information help DSOs to integrate DER without hamper, for example, the quality of
service offered to customers. In this way, the network could be adapted to DER singularities and DSO
could react to unforeseen events. UPGRID has contributed, for example, with advanced cabinets for PV,
extension of PRIME (Spanish and Polish demos) for LV control and developed some models that can be
used to monitor the impact of DER on the electricity sector and also to monitor the incentives for them
(when there is some kind of government incentive, this monitoring system could help to control the
incentives). Further the Swedish and Polish demos ways to quantify and increase hosting capacity have
been implemented which also contributes allowing more DER in the future.
UPGRID also recommends continuing the investigation of new ways to bring flexibility from DER to the
market. Two approaches can be:
• To develop emergency commands to control DER in real time, to avoid black outs.
• To develop a flexible market, taking advantage of the market hub, where DERs can provide
flexibility to improve the performance of the network.
Besides, it is important to highlight that cost is a significant factor that can drive active microgeneration
and EV integration. The CBA carried out suggests that high enabling costs may render the business
model for active microgeneration (i.e. control of reactive power capability of installed solar PV
equipment, with focus on the Polish Demo) positive at the earliest in the beginning of 2021 and this will
be achieved by enhanced capability for loss reduction achieved by solar PV inverters. Hence, it is
recommended that:
• Regulation should allow non-unity power factor operation of existing and future solar PV
generators.
• Innovation attempts on solar PV inverters need to be enhanced in order to allow greater amount
of loss reduction in the grid.

Monitoring & Impact Assessment of Project Demonstrations
D8.5 SUMMARY OF RESULTS OBTAINED IN WP8 AND RECOMMENDATIONS
26 | 32
3.3 EEGI CLUSTER 3: NETWORK OPERATIONS
As aforementioned, this cluster is where UPGRID has widely developed and learnt more lessons. The
main project tool developed within this cluster is the LV NMS deployed in all the demos. It has been
proved to be a key pillar to improve the LV O&M (e.g. LV incident management) what has a direct
positive impact of end-user (e.g. better quality of service). To make the most of the LV NMS, UPGRID
recommends:
• Continue integrating data and information collected from monitoring solutions deployed at field
into the LV NMS to enhance and develop new system capabilities. This will enrich the LV
information to optimize the network operation.
• Spread the use of LV NMS mobile solutions to allow field crews access to updated information
and automatize more the dispatching of LV works.
• Use data analytics to take advantage of the huge and rich amount of data available, to improve
the LV O&M what would lead to, among other things:
– Improve quality of service even more (e.g. faster supply restoration).
– Optimize the configuration of LV.
– Fraud detection.
– Optimal operation of distributed storage and EV charging.
• Take advantage of the LV NMS to develop training courses for the staff. To do that, it is
necessary to find ways to encourage and facilitate people to use this kind of systems and to get
used to new procedures. The O&M staff has different profiles and age what can influence in its
easy and fast adaptation. Training courses could be a good solution to overcome it.
Furthermore, CBA results have shown significant benefits associated with “Improved Supply Restoration
functionality” that is based on the use of LV NMS technology. For this functionality, the following
recommendations apply:
• Based on results achieved, the deployment of this functionality using solely DSO own resources
might not be justified. However, taking into account the important social gross benefit
quantified, it would be advisable for the Regulator to make sure that the DSO is compensated at
least for a significant part so as to make a positive business case.
• Significant innovation (R&I) attempts should be targeted towards the development of LV NMS
technology, SMs and Monitoring equipment installed in SSs for the purposes of reducing the
enabling cost. This will allow more positive business case.
• High quality data handling may require advanced data analytics processes to be implemented in
conjunction with other systems including the GIS for the provision of topology data that are
accurate for further use by the LV NMS system.
In terms of the functionality Improved testing and correction of supply voltage, the following
recommendations apply:

Monitoring & Impact Assessment of Project Demonstrations
D8.5 SUMMARY OF RESULTS OBTAINED IN WP8 AND RECOMMENDATIONS
27 | 32
• Considerable investment in data analytics can reinforce the quality of the results of this
functionality.
• Continued development of monitoring tools (e.g. the Voltage Register) is important to
leverage existing field data.
• Perform high granularity in the monitoring process by the Virtual Register technology is a
significant part of the successful implementation of this functionality.
With respect to the Voltage regulation functionality, the following recommendations apply:
• The installation of smart transformers may have significant cost, especially increasing with the
breadth of the area under coverage. It is, therefore, important to make sure that system needs
justify such investment. This can be achieved by studying the variations of system load,
identifying the feeders and parts of equipment under higher stress and recognizing sources of
uncertainty in the system under study.
• Cases of potential voltage rise effect development need to be clearly indicated through the study
of scenarios for the deployment of PV capacity in the grid. This will indicate those SSs that may
require installation of smart transformers in the near future.
3.4 EEGI CLUSTER 4: NETWORK PLANNING AND ASSET MANAGEMENT
The use of data analytics, taking advantage of the huge and rich amount of data obtained for the
monitoring devices installed in the network, can optimize the CAPEX with the following steps:
• Optimization of the operation scheduling.
• Investment optimization on smart components for the grid.
Using SM data measurement (as additional data) to make more accurate analysis of network capacity.
UPGRID has seen that this kind of analysis is an accurate and efficient way to plan the network.
Additionally, it is important to recognize uncertainty when investing in the network in order to produce
more accurate (optimal) investment decisions.
Besides, the net benefit of network reconfiguration is positive because it can lead to significant loss
reduction. One vital recommendation is that network topology changes can be updated so that
advanced remote and automatic operation becomes the standard for network topology changes
management. With automatic and remote reconfiguration grid losses could be minimized even further
as grid topology changes would adapt to meet the actual system needs.
Finally, predictive maintenance or risk based maintenance can be done, thanks to the information
available of each component of the network. It means, the evaluation of the operation of components
could give very clear hints to know the proper maintenance to extend their lifetime.
Monitoring & Impact Assessment of Project Demonstrations
D8.5 SUMMARY OF RESULTS OBTAINED IN WP8 AND RECOMMENDATIONS
28 | 32
3.5 EEGI CLUSTER 5: MARKET DESIGN
In this last but not least cluster, UPGRID has contributed enhancing the market facilitator role of the
DSO. The Market hub platform, as a neutral market access platform, can be used in the future to
operate the grid in a more efficient manner, for example, with better planned maintenance and better
planning of operations considering load reduction actions (enabled by DSM schemes). This can improve
also the interaction between market players. Based on the achieved results, UPGRID recommends:
• Developing customer consent processes or procedures. (social part)
• Developing new business models where market players can take advantage of the retail market
platform. (business model part)
• Developing means and ways to enable access market players to the market platform.
(operational part)
• Making more attractive retail market to other agents.
It is important to guarantee that technologies developed in UPGRID relevant to market design (e.g.
Retail market hub) are accessible to the necessary players based on the functionalities developed and
are updated on a constant basis. This can be achieved through a regulatory framework that will enable a
neutral actor to be responsible for the efficient data handling. This way, the benefits of all UPGRID
functionalities can be significantly increased given that data collection and analysis are a fundamental
factor to their successful implementation.
Finally, in order to effectively deal with conflicts between the local distribution network and the wider
transmission system, UPGRID recommends that a whole-system market coordination approach should
be adopted, in contrast with the “silo” approach observed in many European countries, where the
coordination between DSOs and TSOs is very limited. Through the employment of a novel optimisation
model, the project has demonstrated that such whole-system coordination achieves the maximum
overall economic benefits of UPGRID services for the whole electricity system, factoring on an equal
footing benefits for the distribution network (e.g. avoiding reinforcements of feeders and substations),
the transmission network (e.g. avoiding expansions of transmission lines) and the generation system
(e.g. enabling higher utilisation of available RES and avoiding investments in additional conventional
generation capacity).
Monitoring & Impact Assessment of Project Demonstrations
D8.5 SUMMARY OF RESULTS OBTAINED IN WP8 AND RECOMMENDATIONS
29 | 32
4. CONCLUSIONS
The four UPGRID demonstrators have been analysed using different perspectives and indicators such as
KPIs, performance characterization of main variables observed based on models parametric and non-
parametric, lifetime of the main components involved in the smart aspect of the new distribution
networks and a cost- benefit analysis. This has been done considering the BAU and R&I scenarios within
each demonstrator. This has allowed to outline the most interesting results of the UPGRID project.
Further technical details about the four UPGRID demonstrators can be found in their final reports:
Spanish demo [3], Portuguese demo [4], Swedish demo [5] and Polish demo [6].
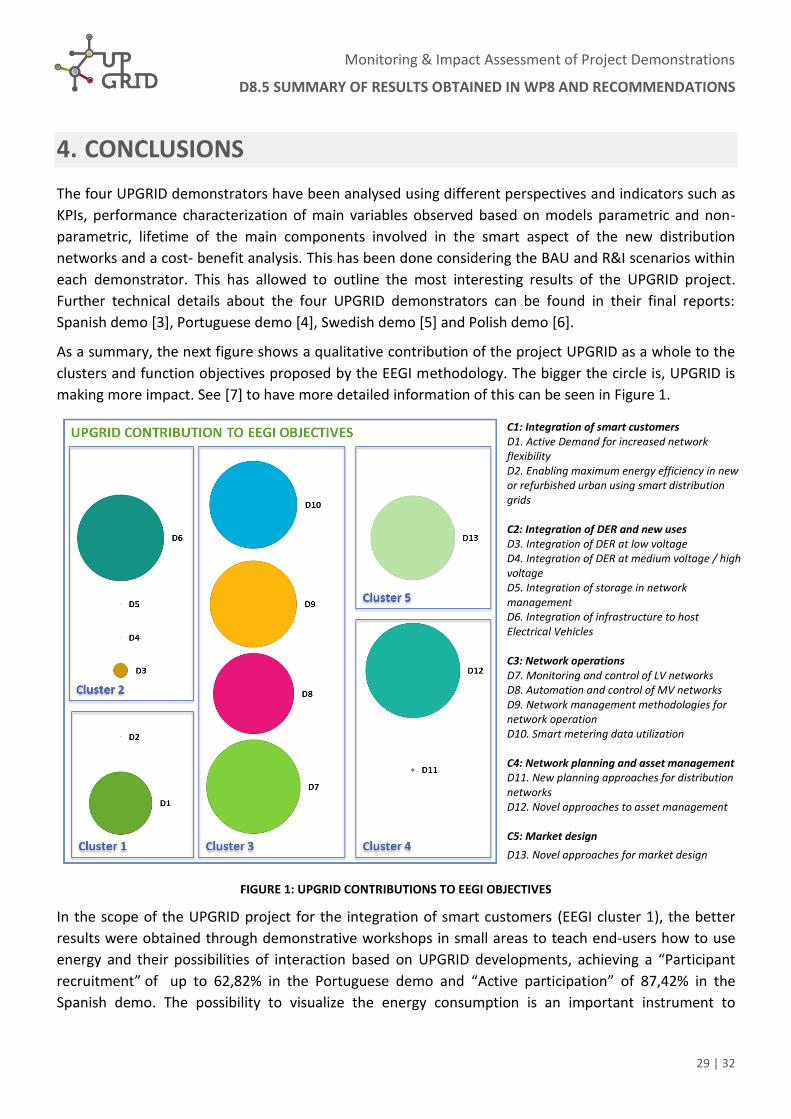
As a summary, the next figure shows a qualitative contribution of the project UPGRID as a whole to the
clusters and function objectives proposed by the EEGI methodology. The bigger the circle is, UPGRID is
making more impact. See [7] to have more detailed information of this can be seen in Figure 1.
C1: Integration of smart customers D1. Active Demand for increased network flexibility D2. Enabling maximum energy efficiency in new or refurbished urban using smart distribution grids C2: Integration of DER and new uses D3. Integration of DER at low voltage D4. Integration of DER at medium voltage / high voltage D5. Integration of storage in network management D6. Integration of infrastructure to host Electrical Vehicles C3: Network operations D7. Monitoring and control of LV networks D8. Automation and control of MV networks D9. Network management methodologies for network operation D10. Smart metering data utilization C4: Network planning and asset management D11. New planning approaches for distribution networks D12. Novel approaches to asset management C5: Market design
D13. Novel approaches for market design
FIGURE 1: UPGRID CONTRIBUTIONS TO EEGI OBJECTIVES
In the scope of the UPGRID project for the integration of smart customers (EEGI cluster 1), the better
results were obtained through demonstrative workshops in small areas to teach end-users how to use
energy and their possibilities of interaction based on UPGRID developments, achieving a “Participant
recruitment” of up to 62,82% in the Portuguese demo and “Active participation” of 87,42% in the
Spanish demo. The possibility to visualize the energy consumption is an important instrument to
Monitoring & Impact Assessment of Project Demonstrations
D8.5 SUMMARY OF RESULTS OBTAINED IN WP8 AND RECOMMENDATIONS
30 | 32
increase the participation of end-users. In this way, a HEMS solution has been implemented that has
enabled the interaction and participation of residential customers in grid management, using market
based resources. Recommendations to enhance these aspects around the users were described in
chapter 3, such as installing HEMS in households, where also some possible benefits related to active
demand have been proposed, i.e. increasing the participation of end-users in the electric market.
With respect to integration of DER and new uses (EEGI cluster 2), UPGRID has shown that a first step
required for a fully integration of DER is to have a better knowledge of the distribution network. UPGRID
has contributed to this enhancing the LV monitoring and control through different solutions (e.g.
advanced cabinets for PV, extension of PRIME for LV control and developed some models that can be
used to monitor the impact of DER on the electric sector and also to monitor the incentives for them),
achieving for example a 99,95% (Portuguese demo) in “Hosting Capacity of Electric Vehicles”. In this
way, the network could be adapted to DER necessities and could react to unforeseen events. Another
conclusion obtained is to continue the investigation in new ways to bring flexibility from DER to the
market. Also, it is mentioned that cost is a significant factor driving active microgeneration and EV
integration, as was obtained from the CBA carried out.
UPGRID has contributed significantly to network operations (EEGI cluster 3) through each four
demonstrators. One of the main developments has been the LV NMS whose performance and impact
evaluation has demonstrated very positive results for LV O&M and end-users. For example, the
“Average time for LV faults” has been improved between 8,1% and 50,21% depending on the demo.
Also, a cost-benefit analysis has evaluated significant benefits associated with all functionalities that LV
NMS enables, for example in improved supply restoration times. In this context, deployment of
functionalities “Improved supply restoration” and “Improved testing and correction of supply voltage”
yield significant economic benefits to both society and the DSO, while functionality “Voltage regulation”
has proven itself as major contributor of economic benefits to the DSO through reinforcement savings
produced by the deferral/avoidance of conventional network reinforcement.
Regarding network planning and asset management (EEGI cluster 4), the use of data analytics, taking
advantage of the huge and rich amount of data obtained for the monitoring devices installed in the
network, can optimize the CAPEX. The possibility of performing network reconfiguration provides a
solution for loss reduction yielding significant economic benefits to society and the DSO alike.
Additionally, data available from field and information obtained after processing it facilitates the
implementation of condition-based maintenance methods for network components. This will contribute
to the improvement of the maintenance applied to these components and to extend their lifetime. For
example, an improvement “Available information categories” between 301% and 447% depending on
the demo.
In market design (EEGI cluster 5) the UPGRID project has suggested that an electrical market hub can
facilitate the interaction of DSO and customers through market agents. At this point, it is important to
guarantee that the technologies developed in UPGRID relevant for market design (e.g. retail market
hub) are accessible to all the potential users and are kept updated.

Monitoring & Impact Assessment of Project Demonstrations
D8.5 SUMMARY OF RESULTS OBTAINED IN WP8 AND RECOMMENDATIONS
31 | 32
REFERENCES
UPGRID DOCUMENTS
[1] UPGRID Consortium, D1.1: Report on technical specifications, 2015.
[2] UPGRID Consortium, D9.3: Report of societal research, socio-economic impact of smart grids,
transfer replication strategy and communication, 2017.
[3] UPGRID Consortium, D3.4: Demonstration results Evaluation and Opportunities - Spanish demo,
2017.
[4] UPGRID Consortium, D4.3: Evaluation of demonstration results and data collection - Portuguese
demo, 2017.
[5] UPGRID Consortium, D5.3: Result of the demonstration project - Swedish demo, 2017.
[6] UPGRID Consortium, D6.5: System testing and optimization - Polish demo, 2017.
[7] UPGRID Consortium, D8.1: Report about KPIs analysis and methods of comparison, 2017.
[8] UPGRID Consortium, D8.2: Analysis of performance monitoring and its comparison among demos,
2017.
[9] UPGRID Consortium, D8.3: Report about the estimated life cycle of the demos and its parameters,
2017.
[10] UPGRID Consortium, D8.4: Report about Cost-Benefit Analysis and its components, 2018.
[11] UPGRID Consortium, D8.6: Report about system wide benefits of UPGRID services, 2018.
EXTERNAL DOCUMENTS
[12] European Electricity Grid Initiative (EEGI), «Research and Innovation Roadmap 2013-2022, 2013.
[13] K. Krishnamoorthy, Handbook of Statistical Distributions with Applications, Chapman and Hall/CRC
Publication, 2006
[14] T. Kohonen, Self-organizing maps, Springer, 2001
[15] A. Ruiz Perez, J. Gomez Sarduy, P. Viego Felipe, Probabilistic evaluation of distribution transformers
losses with unbalanced and deviated voltages, Ingeniería Energética Vol. XXXIV, N0. 1/2013, p. 2-10
(In Spanish).

Monitoring & Impact Assessment of Project Demonstrations
D8.5 SUMMARY OF RESULTS OBTAINED IN WP8 AND RECOMMENDATIONS
32 | 32
[16] (EEGI), European Electricity Grid Initiative, “Research and Innovation Roadmap 2013-2022,” 2012.
[Online]. Available: http://www.gridplus.eu/Documents/20130228_EEGI%20Roadmap%202013-
2022_to%20print.pdf.