
REAL ESTATE SPOTLIGHT - Preqin · 2018-06-21 · PwC’s Emerging Trends in Real Estate survey:...
16
REAL ESTATE SPOTLIGHT VOLUME 13, ISSUE 5 ■ JUNE 2018 All data in this newsletter can be downloaded to Excel for free SIGN UP Sign up to Spotlight, our free monthly newsletter, providing insights into performance, investors, deals and fundraising, powered by Preqin data: Alt Credit Intelligence European and US Fund Services Awards: Best Data and Information Provider | Africa Global Funds Awards 2016: Best Research and Data Provider | The Queen’s Award for Enterprise: International Trade | HedgeWeek Global Awards: Best Global Hedge Fund Research Provider | CAIA Corporate Recognition Award www.preqin.com/contact [email protected] | IN THIS ISSUE FEATURE PwC: Germany, Switzerland and Austria - Growing Relevance to Global Real Estate 2 FEATURE Is Global Diversity Good for Investors? 5 INDUSTRY NEWS 9 THE FACTS ■ Real Estate Market Share ■ Small Funds ■ Mid-Market Funds ■ Large & Mega Funds 11 12 13 15 CONFERENCES 16 PwC: GERMANY, SWITZERLAND AND AUSTRIA – GROWING RELEVANCE TO GLOBAL REAL ESTATE In this article, PwC examine the importance of GSA’s real estate market as well as the growing prominence of investors based in these countries. Find out more on page 2 IS GLOBAL DIVERSITY GOOD FOR INVESTORS? Looking at both pre- and post-Global Financial Crisis figures, we compare the performance of funds focusing on single- and multi-country investments in order to evaluate each of their benefits and drawbacks. Find out more on page 5 RECENTLY RELEASED: THE 2018 PREQIN SOVEREIGN WEALTH FUND REVIEW THE 2018 PREQIN SOVEREIGN WEALTH FUND REVIEW Order Your Copy Download Sample Pages
Transcript of REAL ESTATE SPOTLIGHT - Preqin · 2018-06-21 · PwC’s Emerging Trends in Real Estate survey:...
REAL ESTATE
SPOTLIGHTVOLUME 13, ISSUE 5 ■ JUNE 2018
All data in this newsletter can be downloaded to Excel for free
SIGN UP
Sign up to Spotlight, our free monthly newsletter, providing insights into performance, investors, deals and
fundraising, powered by Preqin data:Alt Credit Intelligence European and US Fund Services Awards: Best Data and Information
Provider | Africa Global Funds Awards 2016: Best Research and Data Provider | The Queen’s Award for Enterprise: International Trade | HedgeWeek Global Awards: Best Global Hedge
Fund Research Provider | CAIA Corporate Recognition Award
www.preqin.com/contact [email protected]|
IN THIS ISSUE
FEATURE PwC: Germany, Switzerland and Austria - Growing Relevance to Global Real Estate
2
FEATUREIs Global Diversity Good for Investors?
5
INDUSTRY NEWS 9
THE FACTS■ Real Estate Market Share■ Small Funds■ Mid-Market Funds■ Large & Mega Funds
11
121315
CONFERENCES 16
PwC: GERMANY, SWITZERLAND AND AUSTRIA – GROWING RELEVANCE TO GLOBAL REAL ESTATE
In this article, PwC examine the importance of GSA’s real estate market as well as the growing prominence of investors based in these countries.
Find out more on page 2
IS GLOBAL DIVERSITY GOOD FOR INVESTORS?
Looking at both pre- and post-Global Financial Crisis figures, we compare the performance of funds focusing on single- and multi-country investments in order to evaluate each of their benefits and drawbacks.
Find out more on page 5
RECENTLY RELEASED: THE 2018 PREQIN SOVEREIGN WEALTH FUND REVIEW
THE 2018PREQIN SOVEREIGN WEALTH FUND REVIEW
in association with
Order Your Copy Download Sample Pages
GERMANY, SWITZERLAND AND AUSTRIA – GROWING RELEVANCE TO GLOBAL REAL ESTATE
© Preqin Ltd. 2018 / www.preqin.com2 Real Estate Spotlight | June 2018
Since the inception of the European Union, the Eurozone has always been a key political and economic player in the global context. However, after major recent events such as the sovereign debt crisis, Brexit and the growing assertiveness in foreign affairs, the economic and political relevance as a grouping of the three German speaking countries of Germany, Switzerland and Austria (GSA) has increased. The GSA countries, though not in any formal political or economic grouping, given their shared language, borders, economic strengths and size of investor pools, are increasingly viewed together as important real estate investment markets with an influential base of investors. Here we discuss two sides of this phenomena being (i) the emergence of GSA as an important global real estate investment market and (ii) the growing relevance of GSA real estate investors globally.
1: GSA’S REAL ESTATE MARKETS ARE INCREASINGLY IMPORTANTWhen the local real estate markets in southern Europe collapsed, investors rapidly refocused their investment activities on European “safe havens” such as Germany, Switzerland, Austria, France and the United Kingdom. As the London and Paris markets have become exceedingly expensive from a comparative point of view, and with the UK market still volatile given the current Brexit negotiations, the number of investors seeking exposure to the GSA markets continue to increase.
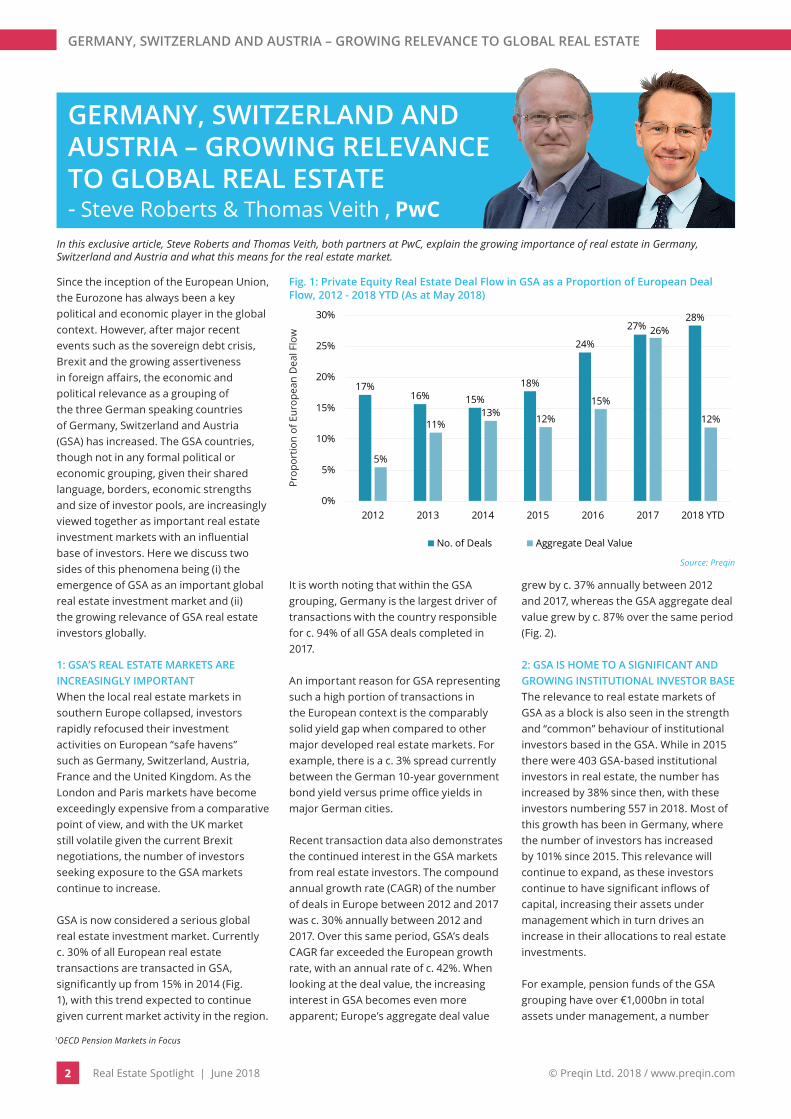
GSA is now considered a serious global real estate investment market. Currently c. 30% of all European real estate transactions are transacted in GSA, significantly up from 15% in 2014 (Fig. 1), with this trend expected to continue given current market activity in the region.
It is worth noting that within the GSA grouping, Germany is the largest driver of transactions with the country responsible for c. 94% of all GSA deals completed in 2017.
An important reason for GSA representing such a high portion of transactions in the European context is the comparably solid yield gap when compared to other major developed real estate markets. For example, there is a c. 3% spread currently between the German 10-year government bond yield versus prime office yields in major German cities.
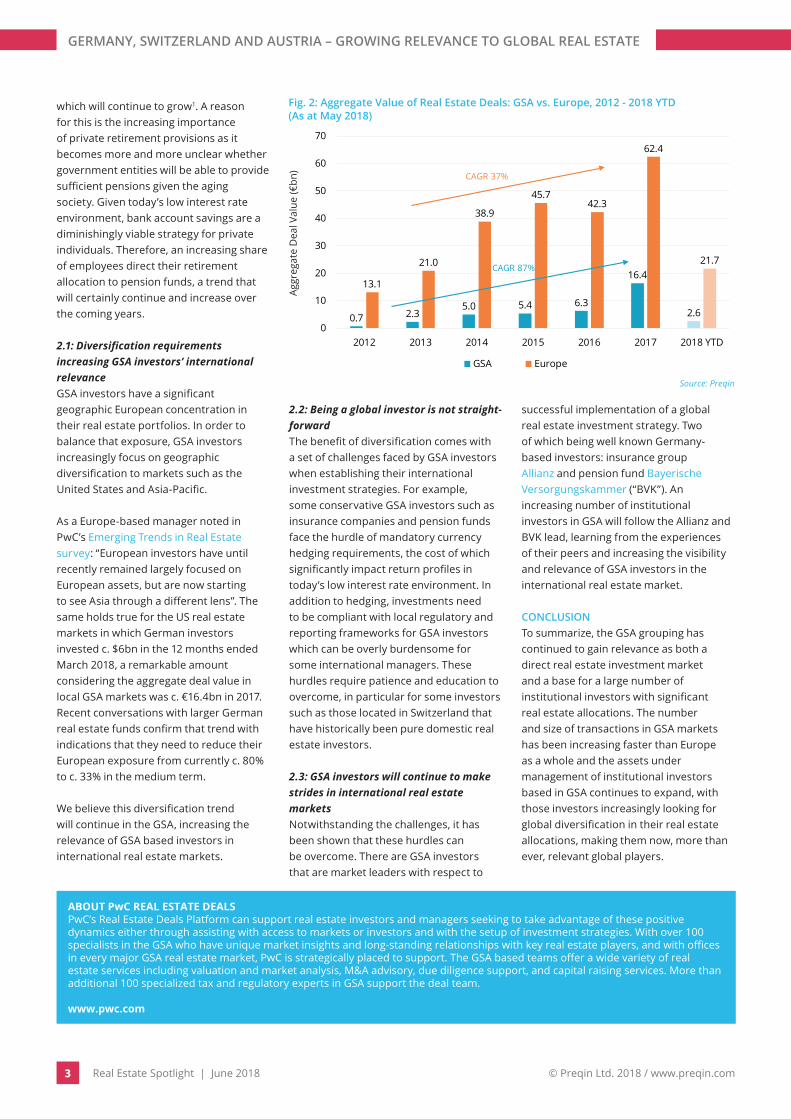
Recent transaction data also demonstrates the continued interest in the GSA markets from real estate investors. The compound annual growth rate (CAGR) of the number of deals in Europe between 2012 and 2017 was c. 30% annually between 2012 and 2017. Over this same period, GSA’s deals CAGR far exceeded the European growth rate, with an annual rate of c. 42%. When looking at the deal value, the increasing interest in GSA becomes even more apparent; Europe’s aggregate deal value
grew by c. 37% annually between 2012 and 2017, whereas the GSA aggregate deal value grew by c. 87% over the same period (Fig. 2).
2: GSA IS HOME TO A SIGNIFICANT AND GROWING INSTITUTIONAL INVESTOR BASEThe relevance to real estate markets of GSA as a block is also seen in the strength and “common” behaviour of institutional investors based in the GSA. While in 2015 there were 403 GSA-based institutional investors in real estate, the number has increased by 38% since then, with these investors numbering 557 in 2018. Most of this growth has been in Germany, where the number of investors has increased by 101% since 2015. This relevance will continue to expand, as these investors continue to have significant inflows of capital, increasing their assets under management which in turn drives an increase in their allocations to real estate investments.
For example, pension funds of the GSA grouping have over €1,000bn in total assets under management, a number
In this exclusive article, Steve Roberts and Thomas Veith, both partners at PwC, explain the growing importance of real estate in Germany, Switzerland and Austria and what this means for the real estate market.
Prop
ortio
n of
Eur
opea
n D
eal F
low
17%16% 15%
18%
24%
27%28%
5%
11%13% 12%
15%
26%
12%
0%
5%
10%
15%
20%
25%
30%
2012 2013 2014 2015 2016 2017 2018 YTD
No. of Deals Aggregate Deal Value
Source: Preqin
Fig. 1: Private Equity Real Estate Deal Flow in GSA as a Proportion of European Deal Flow, 2012 - 2018 YTD (As at May 2018)
GERMANY, SWITZERLAND AND AUSTRIA – GROWING RELEVANCE TO GLOBAL REAL ESTATE- Steve Roberts & Thomas Veith , PwC
1OECD Pension Markets in Focus
GERMANY, SWITZERLAND AND AUSTRIA – GROWING RELEVANCE TO GLOBAL REAL ESTATE
© Preqin Ltd. 2018 / www.preqin.com3 Real Estate Spotlight | June 2018
which will continue to grow1. A reason for this is the increasing importance of private retirement provisions as it becomes more and more unclear whether government entities will be able to provide sufficient pensions given the aging society. Given today’s low interest rate environment, bank account savings are a diminishingly viable strategy for private individuals. Therefore, an increasing share of employees direct their retirement allocation to pension funds, a trend that will certainly continue and increase over the coming years.
2.1: Diversification requirements increasing GSA investors’ international relevanceGSA investors have a significant geographic European concentration in their real estate portfolios. In order to balance that exposure, GSA investors increasingly focus on geographic diversification to markets such as the United States and Asia-Pacific.
As a Europe-based manager noted in PwC’s Emerging Trends in Real Estate survey: “European investors have until recently remained largely focused on European assets, but are now starting to see Asia through a different lens”. The same holds true for the US real estate markets in which German investors invested c. $6bn in the 12 months ended March 2018, a remarkable amount considering the aggregate deal value in local GSA markets was c. €16.4bn in 2017. Recent conversations with larger German real estate funds confirm that trend with indications that they need to reduce their European exposure from currently c. 80% to c. 33% in the medium term.
We believe this diversification trend will continue in the GSA, increasing the relevance of GSA based investors in international real estate markets.
2.2: Being a global investor is not straight-forwardThe benefit of diversification comes with a set of challenges faced by GSA investors when establishing their international investment strategies. For example, some conservative GSA investors such as insurance companies and pension funds face the hurdle of mandatory currency hedging requirements, the cost of which significantly impact return profiles in today’s low interest rate environment. In addition to hedging, investments need to be compliant with local regulatory and reporting frameworks for GSA investors which can be overly burdensome for some international managers. These hurdles require patience and education to overcome, in particular for some investors such as those located in Switzerland that have historically been pure domestic real estate investors.
2.3: GSA investors will continue to make strides in international real estate marketsNotwithstanding the challenges, it has been shown that these hurdles can be overcome. There are GSA investors that are market leaders with respect to
successful implementation of a global real estate investment strategy. Two of which being well known Germany-based investors: insurance group Allianz and pension fund Bayerische Versorgungskammer (“BVK”). An increasing number of institutional investors in GSA will follow the Allianz and BVK lead, learning from the experiences of their peers and increasing the visibility and relevance of GSA investors in the international real estate market.
CONCLUSIONTo summarize, the GSA grouping has continued to gain relevance as both a direct real estate investment market and a base for a large number of institutional investors with significant real estate allocations. The number and size of transactions in GSA markets has been increasing faster than Europe as a whole and the assets under management of institutional investors based in GSA continues to expand, with those investors increasingly looking for global diversification in their real estate allocations, making them now, more than ever, relevant global players.
0.7 2.35.0 5.4 6.3
16.4
2.6
13.1
21.0
38.9
45.742.3
62.4
21.7
0
10
20
30
40
50
60
70
2012 2013 2014 2015 2016 2017 2018 YTD
GSA Europe
CAGR 37%
CAGR 87%
Source: Preqin
Fig. 2: Aggregate Value of Real Estate Deals: GSA vs. Europe, 2012 - 2018 YTD (As at May 2018)
Aggr
egat
e D
eal V
alue
(€bn
)
ABOUT PwC REAL ESTATE DEALSPwC’s Real Estate Deals Platform can support real estate investors and managers seeking to take advantage of these positive dynamics either through assisting with access to markets or investors and with the setup of investment strategies. With over 100 specialists in the GSA who have unique market insights and long-standing relationships with key real estate players, and with offices in every major GSA real estate market, PwC is strategically placed to support. The GSA based teams offer a wide variety of real estate services including valuation and market analysis, M&A advisory, due diligence support, and capital raising services. More than additional 100 specialized tax and regulatory experts in GSA support the deal team.
www.pwc.com

CLAIM YOUR FREE COPY OF THE 2019 PREQIN PRIVATE CAPITAL COMPENSATION AND EMPLOYMENT REVIEW
Preqin is pleased to partner once again with FPL Associates L.P. to conduct the 2019 Preqin Private Capital Compensation and Employment Survey, the largest global private capital survey of its kind. Participants that fully complete the survey will get a free copy of the Review plus a free excelsheet of all the compensation data for further analysis.
The objective of the survey is to provide clients and participants with customized, real-time compensation trends and data that can be used at all levels of the organization to assist with human capital decisions.
THE SURVEY IS OPEN NOW!
Please click here for more information or contact Sonya Nicks at [email protected] to participate.
© Preqin Ltd. 2018 / www.preqin.com
IS GLOBAL DIVERSITY GOOD FOR INVESTORS?
5 Real Estate Spotlight | June 2018
We evaluate global real estate fundraising activity, and performance by geographic focus, in order to see whether funds with specific targets or those casting wider investment nets produce the best results.
0
20
40
60
80
100
120
140
160
2003
2004
2005
2006
2007
2008
2009
2010
2011
2012
2013
2014
2015
2016
2017
2018
YTD
Single Country Multi-Country Continental Multi-Continental
Source: Preqin
Aggr
egat
e Ca
pita
l Rai
sed
($bn
)
Fig. 2: Aggregate Capital Raised for Closed-End Private Real Estate Funds by Geographic Focus, 2003 - 2018 YTD (As at May 2018)
IS GLOBAL DIVERSITY GOOD FOR INVESTORS?
There has never been a time where the investment landscape has been more
integrated than it is now. The real estate asset class in particular has benefitted from more open channels, with cross-border acquisitions now commonplace and many multinational real estate firms with operational capabilities across the globe. Newer economies continue to grow and evolve, and as such their need for institutional-quality property rises. These factors, alongside the rising numbers and sophistication of the institutional real estate population have helped propel growth, and shape an environment where multi-billion-dollar fundraises are relatively routine.
For fundraisers, it is crucial to remember that institutions’ primary motivations for real estate investment lay beyond headline returns, with diversification a stronger pull over the direction of investment. However, this poses a number of questions to allocators: are geographically diverse funds better performers than their more localized counterparts? Are they riskier?
Before we can tackle those questions, we must provide the wider context
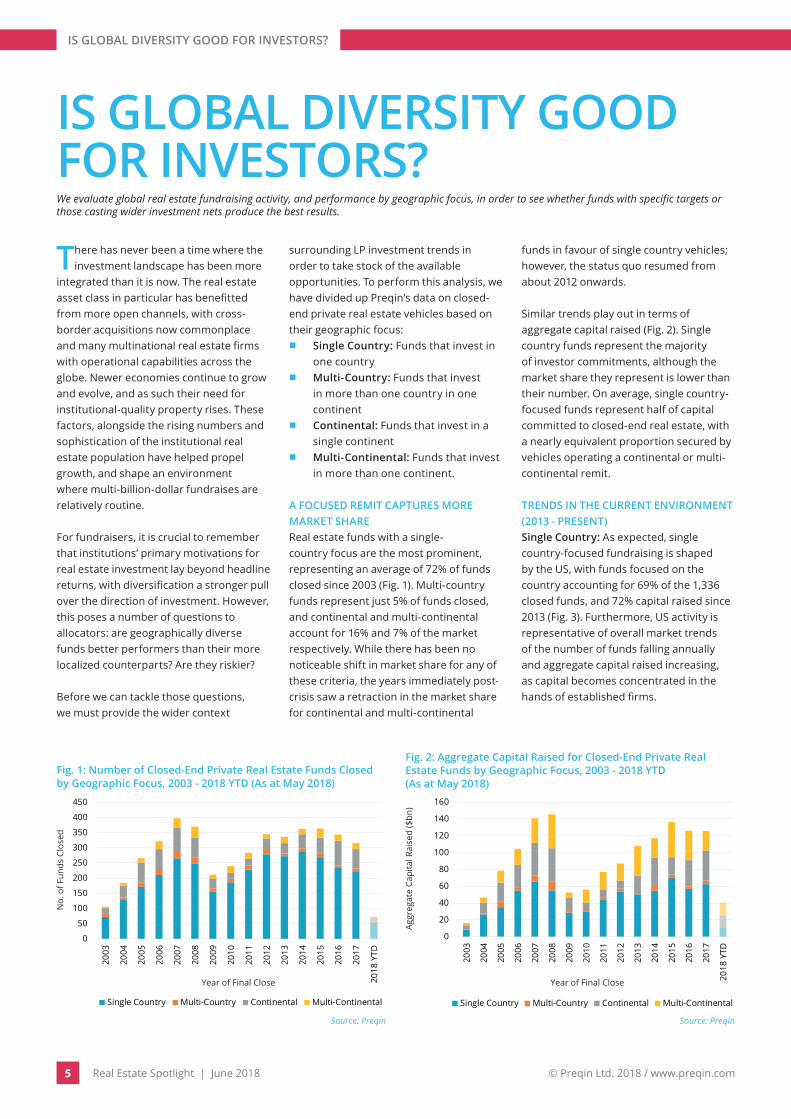
surrounding LP investment trends in order to take stock of the available opportunities. To perform this analysis, we have divided up Preqin’s data on closed-end private real estate vehicles based on their geographic focus:
■ Single Country: Funds that invest in one country
■ Multi-Country: Funds that invest in more than one country in one continent
■ Continental: Funds that invest in a single continent
■ Multi-Continental: Funds that invest in more than one continent.
A FOCUSED REMIT CAPTURES MORE MARKET SHAREReal estate funds with a single-country focus are the most prominent, representing an average of 72% of funds closed since 2003 (Fig. 1). Multi-country funds represent just 5% of funds closed, and continental and multi-continental account for 16% and 7% of the market respectively. While there has been no noticeable shift in market share for any of these criteria, the years immediately post-crisis saw a retraction in the market share for continental and multi-continental
funds in favour of single country vehicles; however, the status quo resumed from about 2012 onwards.
Similar trends play out in terms of aggregate capital raised (Fig. 2). Single country funds represent the majority of investor commitments, although the market share they represent is lower than their number. On average, single country-focused funds represent half of capital committed to closed-end real estate, with a nearly equivalent proportion secured by vehicles operating a continental or multi-continental remit.
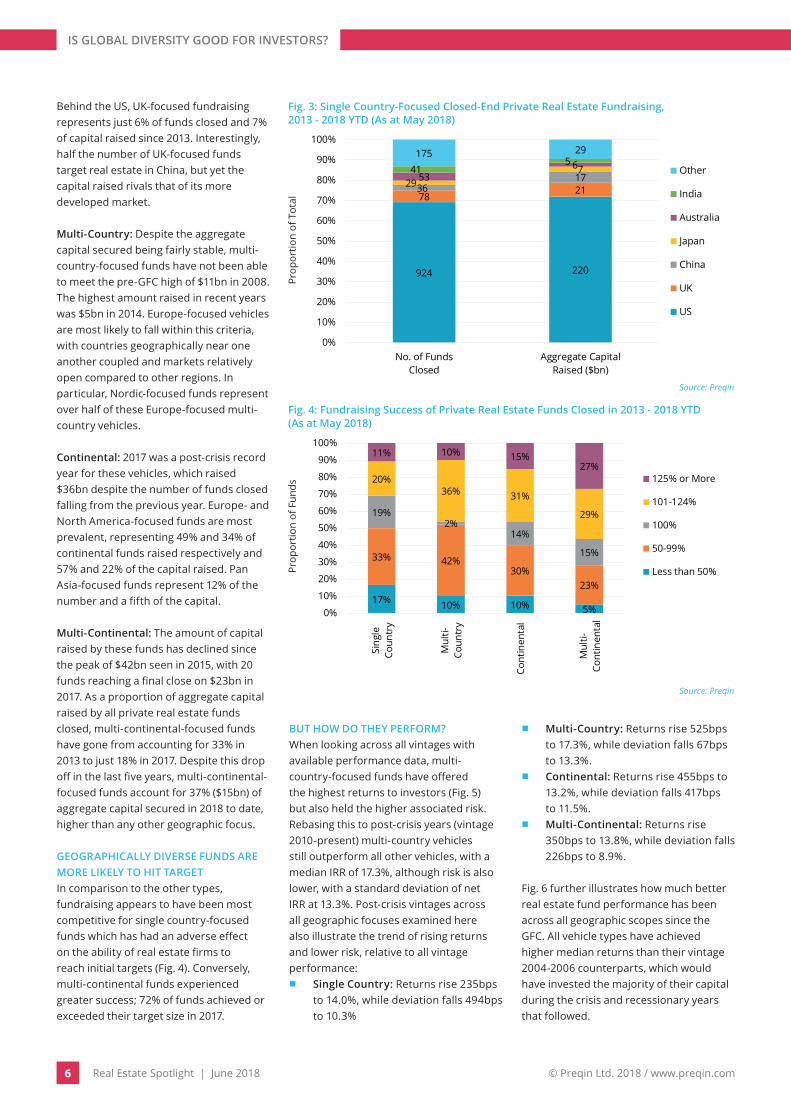
TRENDS IN THE CURRENT ENVIRONMENT (2013 - PRESENT)Single Country: As expected, single country-focused fundraising is shaped by the US, with funds focused on the country accounting for 69% of the 1,336 closed funds, and 72% capital raised since 2013 (Fig. 3). Furthermore, US activity is representative of overall market trends of the number of funds falling annually and aggregate capital raised increasing, as capital becomes concentrated in the hands of established firms.
0
50
100
150
200
250
300
350
400
450
2003
2004
2005
2006
2007
2008
2009
2010
2011
2012
2013
2014
2015
2016
2017
2018
YTD
Single Country Multi-Country Continental Multi-Continental
Source: Preqin
No.
of F
unds
Clo
sed
Fig. 1: Number of Closed-End Private Real Estate Funds Closed by Geographic Focus, 2003 - 2018 YTD (As at May 2018)
Year of Final Close Year of Final Close
© Preqin Ltd. 2018 / www.preqin.com
IS GLOBAL DIVERSITY GOOD FOR INVESTORS?
6 Real Estate Spotlight | June 2018
Behind the US, UK-focused fundraising represents just 6% of funds closed and 7% of capital raised since 2013. Interestingly, half the number of UK-focused funds target real estate in China, but yet the capital raised rivals that of its more developed market.
Multi-Country: Despite the aggregate capital secured being fairly stable, multi-country-focused funds have not been able to meet the pre-GFC high of $11bn in 2008. The highest amount raised in recent years was $5bn in 2014. Europe-focused vehicles are most likely to fall within this criteria, with countries geographically near one another coupled and markets relatively open compared to other regions. In particular, Nordic-focused funds represent over half of these Europe-focused multi-country vehicles.
Continental: 2017 was a post-crisis record year for these vehicles, which raised $36bn despite the number of funds closed falling from the previous year. Europe- and North America-focused funds are most prevalent, representing 49% and 34% of continental funds raised respectively and 57% and 22% of the capital raised. Pan Asia-focused funds represent 12% of the number and a fifth of the capital.
Multi-Continental: The amount of capital raised by these funds has declined since the peak of $42bn seen in 2015, with 20 funds reaching a final close on $23bn in 2017. As a proportion of aggregate capital raised by all private real estate funds closed, multi-continental-focused funds have gone from accounting for 33% in 2013 to just 18% in 2017. Despite this drop off in the last five years, multi-continental-focused funds account for 37% ($15bn) of aggregate capital secured in 2018 to date, higher than any other geographic focus.
GEOGRAPHICALLY DIVERSE FUNDS ARE MORE LIKELY TO HIT TARGETIn comparison to the other types, fundraising appears to have been most competitive for single country-focused funds which has had an adverse effect on the ability of real estate firms to reach initial targets (Fig. 4). Conversely, multi-continental funds experienced greater success; 72% of funds achieved or exceeded their target size in 2017.
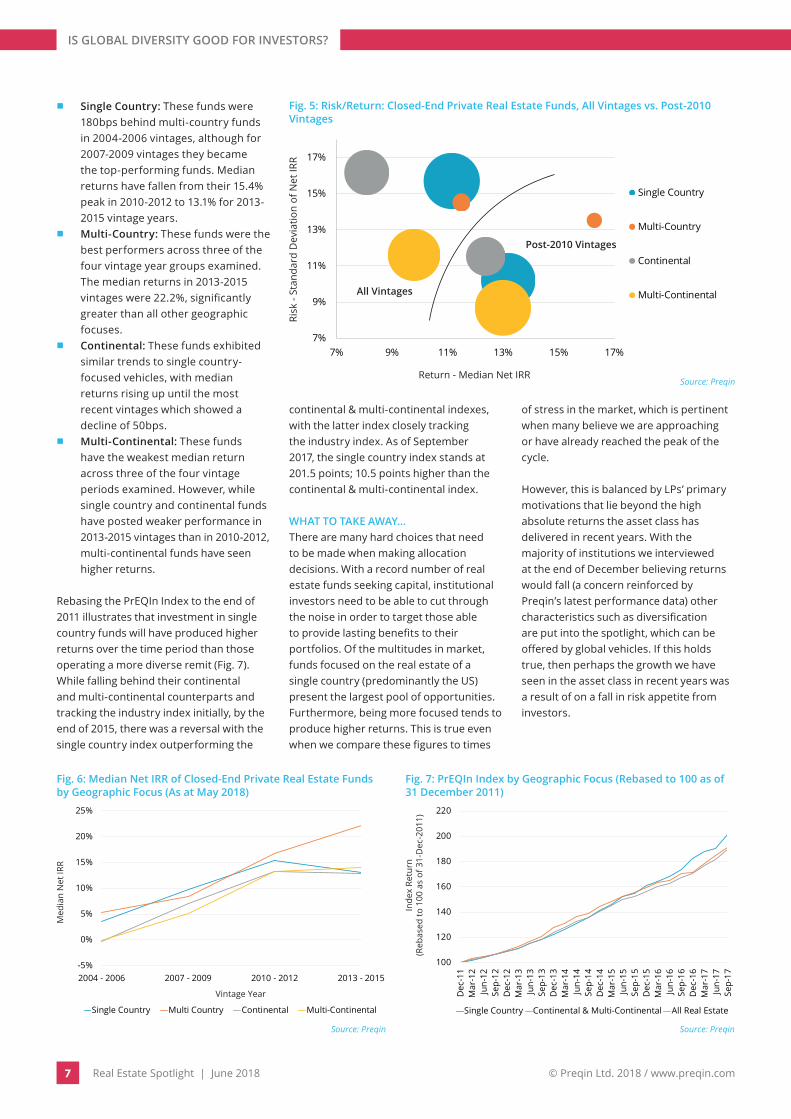
BUT HOW DO THEY PERFORM?When looking across all vintages with available performance data, multi-country-focused funds have offered the highest returns to investors (Fig. 5) but also held the higher associated risk. Rebasing this to post-crisis years (vintage 2010-present) multi-country vehicles still outperform all other vehicles, with a median IRR of 17.3%, although risk is also lower, with a standard deviation of net IRR at 13.3%. Post-crisis vintages across all geographic focuses examined here also illustrate the trend of rising returns and lower risk, relative to all vintage performance:
■ Single Country: Returns rise 235bps to 14.0%, while deviation falls 494bps to 10.3%
■ Multi-Country: Returns rise 525bps to 17.3%, while deviation falls 67bps to 13.3%.
■ Continental: Returns rise 455bps to 13.2%, while deviation falls 417bps to 11.5%.
■ Multi-Continental: Returns rise 350bps to 13.8%, while deviation falls 226bps to 8.9%.
Fig. 6 further illustrates how much better real estate fund performance has been across all geographic scopes since the GFC. All vehicle types have achieved higher median returns than their vintage 2004-2006 counterparts, which would have invested the majority of their capital during the crisis and recessionary years that followed.
924 220
78213617297
53641
5175 29
0%
10%
20%
30%
40%
50%
60%
70%
80%
90%
100%
No. of FundsClosed
Aggregate CapitalRaised ($bn)
Other
India
Australia
Japan
China
UK
US
Source: Preqin
Prop
ortio
n of
Tot
al
Fig. 3: Single Country-Focused Closed-End Private Real Estate Fundraising, 2013 - 2018 YTD (As at May 2018)
17% 10% 10% 5%
33% 42%30%
23%
19%2%
14%
15%
20%36% 31%
29%
11% 10% 15%27%
0%
10%
20%
30%
40%
50%
60%
70%
80%
90%
100%
Sing
leCo
untr
y
Mul
ti-Co
untr
y
Cont
inen
tal
Mul
ti-Co
ntin
enta
l
125% or More
101-124%
100%
50-99%
Less than 50%
Source: Preqin
Prop
ortio
n of
Fun
ds
Fig. 4: Fundraising Success of Private Real Estate Funds Closed in 2013 - 2018 YTD(As at May 2018)
© Preqin Ltd. 2018 / www.preqin.com
IS GLOBAL DIVERSITY GOOD FOR INVESTORS?
7 Real Estate Spotlight | June 2018
■ Single Country: These funds were 180bps behind multi-country funds in 2004-2006 vintages, although for 2007-2009 vintages they became the top-performing funds. Median returns have fallen from their 15.4% peak in 2010-2012 to 13.1% for 2013-2015 vintage years.
■ Multi-Country: These funds were the best performers across three of the four vintage year groups examined. The median returns in 2013-2015 vintages were 22.2%, significantly greater than all other geographic focuses.
■ Continental: These funds exhibited similar trends to single country-focused vehicles, with median returns rising up until the most recent vintages which showed a decline of 50bps.
■ Multi-Continental: These funds have the weakest median return across three of the four vintage periods examined. However, while single country and continental funds have posted weaker performance in 2013-2015 vintages than in 2010-2012, multi-continental funds have seen higher returns.
Rebasing the PrEQIn Index to the end of 2011 illustrates that investment in single country funds will have produced higher returns over the time period than those operating a more diverse remit (Fig. 7). While falling behind their continental and multi-continental counterparts and tracking the industry index initially, by the end of 2015, there was a reversal with the single country index outperforming the
continental & multi-continental indexes, with the latter index closely tracking the industry index. As of September 2017, the single country index stands at 201.5 points; 10.5 points higher than the continental & multi-continental index.
WHAT TO TAKE AWAY…There are many hard choices that need to be made when making allocation decisions. With a record number of real estate funds seeking capital, institutional investors need to be able to cut through the noise in order to target those able to provide lasting benefits to their portfolios. Of the multitudes in market, funds focused on the real estate of a single country (predominantly the US) present the largest pool of opportunities. Furthermore, being more focused tends to produce higher returns. This is true even when we compare these figures to times
of stress in the market, which is pertinent when many believe we are approaching or have already reached the peak of the cycle.
However, this is balanced by LPs’ primary motivations that lie beyond the high absolute returns the asset class has delivered in recent years. With the majority of institutions we interviewed at the end of December believing returns would fall (a concern reinforced by Preqin’s latest performance data) other characteristics such as diversification are put into the spotlight, which can be offered by global vehicles. If this holds true, then perhaps the growth we have seen in the asset class in recent years was a result of on a fall in risk appetite from investors.
100
120
140
160
180
200
220
Dec
-11
Mar
-12
Jun-
12Se
p-12
Dec
-12
Mar
-13
Jun-
13Se
p-13
Dec
-13
Mar
-14
Jun-
14Se
p-14
Dec
-14
Mar
-15
Jun-
15Se
p-15
Dec
-15
Mar
-16
Jun-
16Se
p-16
Dec
-16
Mar
-17
Jun-
17Se
p-17
Single Country Continental & Multi-Continental All Real Estate
Source: Preqin
Inde
x Re
turn
(Reb
ased
to 1
00 a
s of
31-
Dec
-201
1)
Fig. 7: PrEQIn Index by Geographic Focus (Rebased to 100 as of 31 December 2011)
7%
9%
11%
13%
15%
17%
7% 9% 11% 13% 15% 17%
Single Country
Multi-Country
Continental
Multi-Continental
Source: Preqin
Risk
- St
anda
rd D
evia
tion
of N
et IR
R
Fig. 5: Risk/Return: Closed-End Private Real Estate Funds, All Vintages vs. Post-2010 Vintages
Return - Median Net IRR
All Vintages
Post-2010 Vintages
-5%
0%
5%
10%
15%
20%
25%
2004 - 2006 2007 - 2009 2010 - 2012 2013 - 2015
Single Country Multi Country Continental Multi-Continental
Source: Preqin
Med
ian
Net
IRR
Fig. 6: Median Net IRR of Closed-End Private Real Estate Funds by Geographic Focus (As at May 2018)
Vintage Year
PREQIN GLOBAL DATA COVERAGE
+PLUS
Comprehensive coverage of:
+ Placement Agents + Dry Powder+ Fund Administrators + Compensation+ Law Firms + Plus much more...+ Debt Providers
THE PREQIN DIFFERENCE+ Over 390 research, support and development staff+ Global presence - New York, London, Singapore, San Francisco, Hong Kong, Manila and Guangzhou+ Depth and quality of data from direct contact methods+ Unlimited data downloads+ The most trusted name in alternative assets
*Private equity includes buyout, growth, venture capital, turnaround, private equity fund of funds, private equity secondaries, direct secondaries, balanced, hybrid, hybrid fund of funds, PIPE, co-investment and co-investment multi-manager funds.
PRIVATE EQUITY* HEDGE FUNDS REAL ESTATE INFRASTRUCTURE PRIVATE DEBT NATURAL
RESOURCES
INVESTORCOVERAGE
7,284Active
Private Equity LPs
5,497Active
Hedge Fund Investors
6,549Active
Real Estate LPs
3,462Active
InfrastructureLPs
3,351Active
Private Debt Investors
3,411Active
Natural Resources Investors
FUNDCOVERAGE
20,841Private Equity
Funds
26,539Hedge Funds
7,343PE Real Estate
Funds
1,343Infrastructure
Funds
2,648Private Debt
Funds
2,068Natural Resources
Funds
FIRMCOVERAGE
15,149Private Equity Firms
9,651Hedge Fund
Firms
5,044PE Real Estate
Firms
563Infrastructure
Firms
1,666Private Debt
Firms
1,072Natural Resources
Firms
PERFORMANCECOVERAGE
6,170Private Equity
Funds
18,678Hedge Funds
1,873PE Real
Estate Funds
276Infrastructure
Funds
890Private Debt
Funds
582Natural Resources
Funds
FUNDRAISINGCOVERAGE
2,901Private Equity
Funds
17,516Hedge Funds
1,274PE Real
Estate Funds
183Infrastructure
Funds
368Private Debt
Funds
268Natural Resources
Funds
Alternatives Investment Consultants Coverage:
581Consultants Tracked
Funds Terms Coverage: Analysis Based on Data for Around
18,161Funds
Best Contacts: Carefully Selected from our Database of over
463,226Contacts
2015 Annual CAIA CorporateRecognition Award Winner
As at 1st June 2018
ALTERNATIVES COVERAGE
FIRMS FUNDS FUNDS OPEN TO INVESTMENT
INVESTORSMONITORED
FUNDS WITH PERFORMANCE DEALS & EXITS
33,145 60,782 22,510 16,649 28,469 343,345
DEALS & EXITSCOVERAGE
BUYOUT VENTURE CAPITAL REAL ESTATE INFRASTRUCTURE PRIVATE DEBT
89,018Buyout Deals and Exits
161,642Venture Capital Deals
and Exits
55,947Real Estate Deals
28,224Infrastructure Deals
8,514Private Debt Deals

INDUSTRY NEWS
© Preqin Ltd. 2018 / www.preqin.com9 Real Estate Spotlight | June 2018
INDUSTRY NEWSIn this month’s Industry News, we highlight key fund closes and launches with reference to fund size classification across the PERE market, as well as recent investor commitments within the last six months.
Do you have any news you would like to share with the readers of Spotlight?
Send your updates to [email protected] and we will endeavour to publish them in the next issue.
SHARE YOUR NEWS
RECENT FUNDS CLOSED
■ Small Funds (less than $100mn): Watermark Partners Real Estate closed their fourth fund, Watermark Partners Fund IV, on $50mn in April 2018. The fund will adopt value added and opportunistic strategies, focusing on the acquisition and management of residential properties across the Midwest US.
■ Lower Mid-Market Funds ($100-249mn): Fidentia BeLux Investments secured its target of €180mn ($222mn) by its final close in March 2018. Fidentia Real Estate Investment’s value-added vehicle will target office properties across Belgium and Luxembourg.
■ Mid-Market Funds ($250-749mn): Commercial Real Estate Debt Fund II, managed by Octopus Property, surpassed its target size by 15%, closing on £230mn ($324mn) in March 2018. The fund provides bridging finance for a diversified range of real estate investments located across England.
■ Upper Mid-Market Funds ($750-999mn): Europa Fund V reached a final close in January 2018, securing €716mn ($889mn). Managed by Europa Capital, the fund employs an opportunistic strategy with a diversified property focus across Europe.
■ Large Funds ($1-4.9bn): GreenOak US III, managed by GreenOak US, surpassed its target by 55%, securing a final close of $1.6bn in May 2018. The fund employs a value-added strategy, targeting office and multi-family properties across the US.
■ Mega Funds ($5bn or more): Blackstone Real Estate Partners Asia II closed in March 2018, securing $7bn, $2bn above target. The fund employs an opportunistic strategy, targeting assets such as warehouses and shopping centres in Southeast Asia, Australia, China and India.
RECENT FUND LAUNCHES IN 2018
There are currently more than 600 private real estate funds in market seeking $201bn in capital; of these funds, 8% are large or mega funds targeting $1bn or more. Madison International Realty is one such firm looking for $1bn via Madison International Prime Property Investors Series I, to target core Class A properties across the US. Seventy percent of funds currently in market are mid-market vehicles, targeting $100-999mn. TH Real Estate’s New York City Property Fund launched in February 2018, and is seeking $750mn to target value added and opportunistic real estate assets located in the greater New York City area. Assets will be diversified by property type with an emphasis on office, for-rent multifamily, retail and for-sale residential condominiums located in emerging and established neighbourhoods.
Small funds currently account for 22% of funds in market; one such fund, managed by Alpha Capital Partners, is ARG Fund IV which launched in March 2018. It is seeking $50mn to invest in middle-market, multi-family and student housing properties in the US, using a value-added strategy. The fund reached a first close on $25mn in March 2018.
RECENT INVESTOR COMMITMENTS
Ontario Teachers’ Pension Plan invested $15mn in Carroll Multifamily Real Estate Fund V, a core and value-added vehicle that aims to create a portfolio of high quality multi-family real estate assets across the US. Ontario Teachers’ Pension Plan has a preference for debt, opportunistic and core strategies in North and South America and is known for its responsible investment strategy, targeting both socially and environmentally sustainable opportunities.
Texas Permanent School Fund State Board of Education has recently committed $75mn to Longpoint Realty Fund I. May 2018 saw the fund reach its third close on $207mn and is seeking to raise $375mn in total to primarily target underperforming ‘last mile’ industrial warehouses, and infill culturally-relevant retail properties to capitalize on changing demographics, technology and consumer behaviour.
South Carolina Retirement Systems recently committed $125mn to Digital Colony Partners, managed by Colony NorthStar, which held its first close on $1.4bn in March 2018. The opportunistic fund is targeting $3bn to invest in data centres and cell towers globally.

THE FACTS
© Preqin Ltd. 2018 / www.preqin.com10 Hedge Fund Spotlight | June 2018
THE 2018 PREQIN SOVEREIGN WEALTH
FUND REVIEWThe indispensable, comprehensive guide to sovereign wealth funds and their
investment activity.
Produced in association with PwC, the Review contains exclusive information gained via direct communication with sovereign wealth funds and their advisors, plus valuable intelligence from fi lings, fi nancial statements and hundreds of other data sources.
For more information or to purchase the book, please visit:
www.preqin.com/swf
VIEWdetailed profi les for 78 sovereign wealth funds
located around the world
EXAMINEin-depth analysis on key trends in SWF activity by
asset class and region
IDENTIFYkey SWF contacts and their
contact information
THE FACTS
© Preqin Ltd. 2018 / www.preqin.com11 Real Estate Spotlight | June 2018
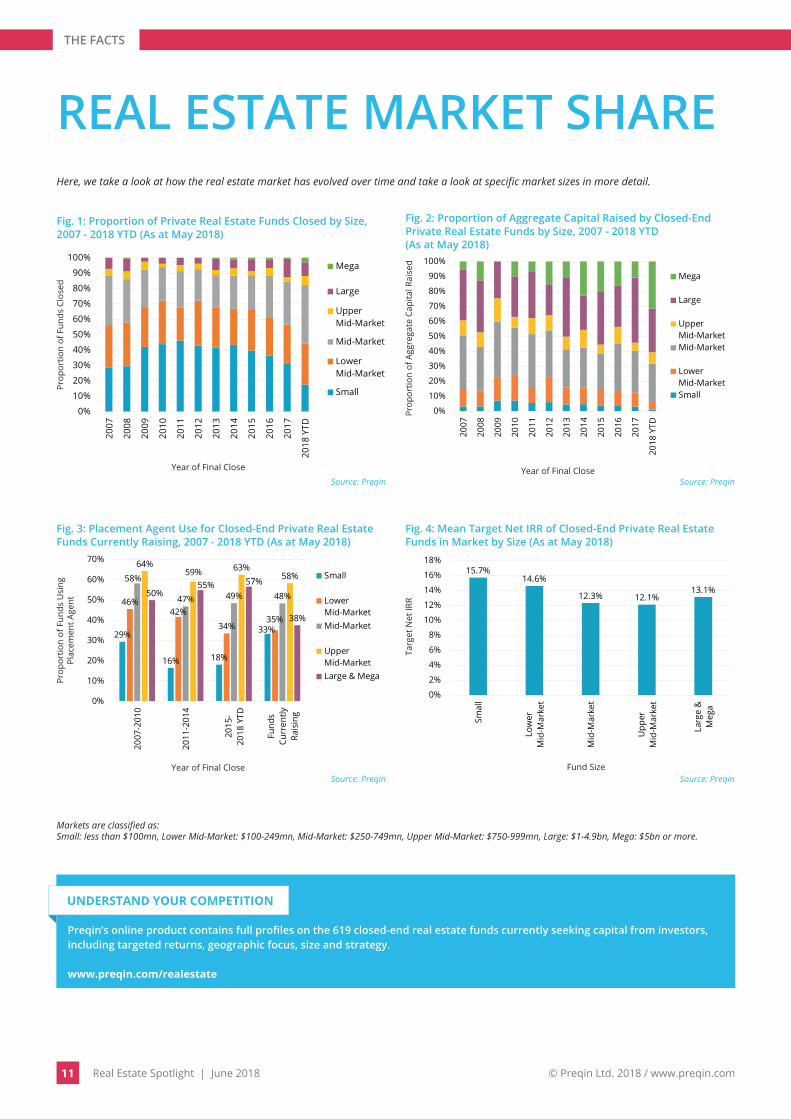
REAL ESTATE MARKET SHAREHere, we take a look at how the real estate market has evolved over time and take a look at specific market sizes in more detail.
0%
10%
20%
30%
40%
50%
60%
70%
80%
90%
100%
2007
2008
2009
2010
2011
2012
2013
2014
2015
2016
2017
2018
YTD
Mega
Large
UpperMid-Market
Mid-Market
LowerMid-Market
Small
Source: Preqin
Prop
ortio
n of
Fun
ds C
lose
d
Fig. 1: Proportion of Private Real Estate Funds Closed by Size, 2007 - 2018 YTD (As at May 2018)
Year of Final Close
0%
10%
20%
30%
40%
50%
60%
70%
80%
90%
100%
2007
2008
2009
2010
2011
2012
2013
2014
2015
2016
2017
2018
YTD
Mega
Large
UpperMid-MarketMid-Market
LowerMid-MarketSmall
Source: Preqin
Prop
ortio
n of
Agg
rega
te C
apita
l Rai
sed
Fig. 2: Proportion of Aggregate Capital Raised by Closed-End Private Real Estate Funds by Size, 2007 - 2018 YTD(As at May 2018)
Year of Final Close
29%
16% 18%
33%
46%42%
34%35%
58%
47% 49% 48%
64%59% 63%
58%
50%55% 57%
38%
0%
10%
20%
30%
40%
50%
60%
70%
2007
-201
0
2011
-201
4
2015
-20
18 Y
TD
Fund
sCu
rren
tlyRa
isin
g
Small
LowerMid-MarketMid-Market
UpperMid-MarketLarge & Mega
Source: Preqin
Prop
ortio
n of
Fun
ds U
sing
Pl
acem
ent A
gent
Fig. 3: Placement Agent Use for Closed-End Private Real Estate Funds Currently Raising, 2007 - 2018 YTD (As at May 2018)
Year of Final Close
UNDERSTAND YOUR COMPETITION
Preqin’s online product contains full profiles on the 619 closed-end real estate funds currently seeking capital from investors, including targeted returns, geographic focus, size and strategy.
www.preqin.com/realestate
15.7%14.6%
12.3% 12.1%13.1%
0%
2%
4%
6%
8%
10%
12%
14%
16%
18%
Smal
l
Low
erM
id-M
arke
t
Mid
-Mar
ket
Upp
erM
id-M
arke
t
Larg
e &
Meg
a
Source: Preqin
Targ
et N
et IR
R
Fig. 4: Mean Target Net IRR of Closed-End Private Real Estate Funds in Market by Size (As at May 2018)
Fund Size
Markets are classified as: Small: less than $100mn, Lower Mid-Market: $100-249mn, Mid-Market: $250-749mn, Upper Mid-Market: $750-999mn, Large: $1-4.9bn, Mega: $5bn or more.
THE FACTS
© Preqin Ltd. 2018 / www.preqin.com12 Real Estate Spotlight | June 2018
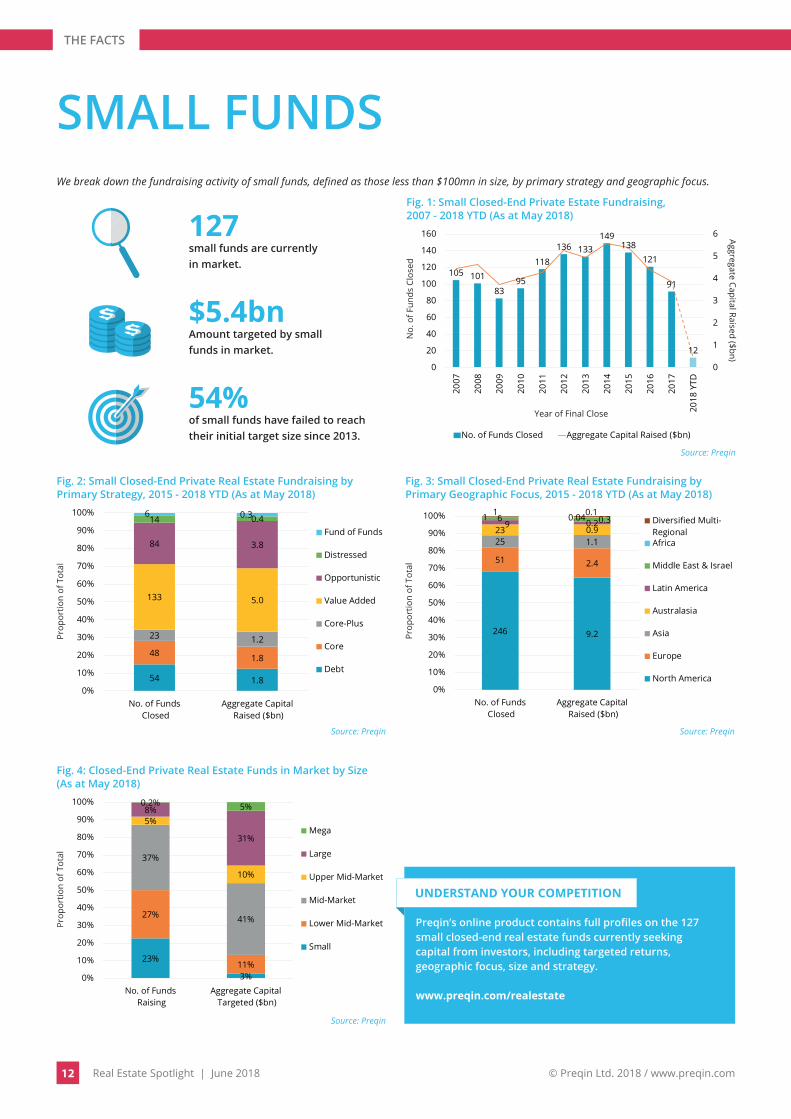
SMALL FUNDSWe break down the fundraising activity of small funds, defined as those less than $100mn in size, by primary strategy and geographic focus.
54 1.8
48 1.8
23 1.2
133 5.0
84 3.8
14 0.46 0.3
0%
10%
20%
30%
40%
50%
60%
70%
80%
90%
100%
No. of Funds Closed
Aggregate Capital Raised ($bn)
Fund of Funds
Distressed
Opportunistic
Value Added
Core-Plus
Core
Debt
Source: Preqin
Prop
ortio
n of
Tot
al
Fig. 2: Small Closed-End Private Real Estate Fundraising by Primary Strategy, 2015 - 2018 YTD (As at May 2018)
246 9.2
51 2.4
25 1.123 0.99 0.26 0.31 0.041 0.1
0%
10%
20%
30%
40%
50%
60%
70%
80%
90%
100%
No. of Funds Closed
Aggregate Capital Raised ($bn)
Diversified Multi-RegionalAfrica
Middle East & Israel
Latin America
Australasia
Asia
Europe
North America
Source: Preqin
Prop
ortio
n of
Tot
al
Fig. 3: Small Closed-End Private Real Estate Fundraising by Primary Geographic Focus, 2015 - 2018 YTD (As at May 2018)
23%
3%
27%
11%
37%
41%
5%
10%
8%
31%
0.2% 5%
0%
10%
20%
30%
40%
50%
60%
70%
80%
90%
100%
No. of Funds Raising
Aggregate Capital Targeted ($bn)
Mega
Large
Upper Mid-Market
Mid-Market
Lower Mid-Market
Small
Source: Preqin
Prop
ortio
n of
Tot
al
Fig. 4: Closed-End Private Real Estate Funds in Market by Size (As at May 2018)
105 101
8395
118
136 133149
138121
91
12
0
1
2
3
4
5
6
0
20
40
60
80
100
120
140
160
2007
2008
2009
2010
2011
2012
2013
2014
2015
2016
2017
2018
YTD
No. of Funds Closed Aggregate Capital Raised ($bn)
Source: Preqin
No.
of F
unds
Clo
sed
Fig. 1: Small Closed-End Private Estate Fundraising, 2007 - 2018 YTD (As at May 2018)
Aggregate Capital Raised ($bn)
Year of Final Close
127small funds are currently in market.
$5.4bnAmount targeted by small funds in market.
54%of small funds have failed to reach their initial target size since 2013.
UNDERSTAND YOUR COMPETITION
Preqin’s online product contains full profiles on the 127 small closed-end real estate funds currently seeking capital from investors, including targeted returns, geographic focus, size and strategy.
www.preqin.com/realestate
THE FACTS
© Preqin Ltd. 2018 / www.preqin.com13 Real Estate Spotlight | June 2018
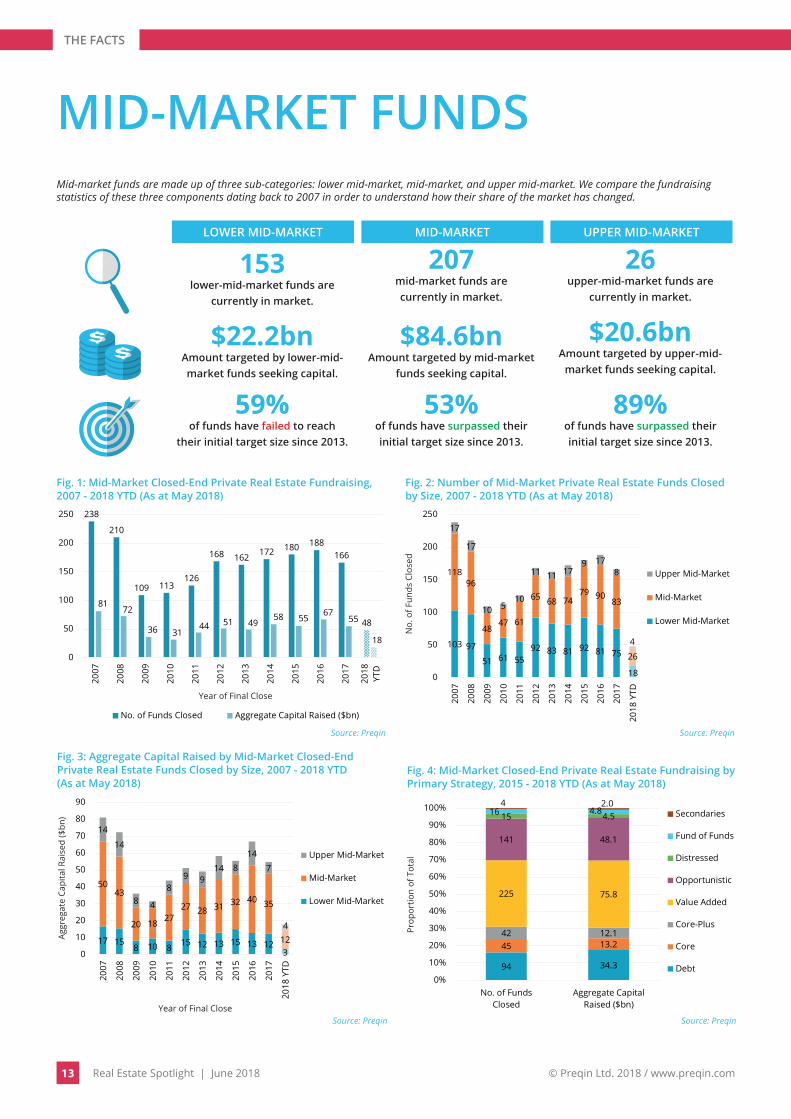
MID-MARKET FUNDSMid-market funds are made up of three sub-categories: lower mid-market, mid-market, and upper mid-market. We compare the fundraising statistics of these three components dating back to 2007 in order to understand how their share of the market has changed.
103 97
51 61 5592 83 81 92 81 75
18
11896
4847 61
65 68 7479 90
83
26
17
17
10 510
11 11 179 17
8
4
0
50
100
150
200
250
2007
2008
2009
2010
2011
2012
2013
2014
2015
2016
2017
2018
YTD
Upper Mid-Market
Mid-Market
Lower Mid-Market
Source: Preqin
No.
of F
unds
Clo
sed
Fig. 2: Number of Mid-Market Private Real Estate Funds Closed by Size, 2007 - 2018 YTD (As at May 2018)
94 34.3
45 13.242 12.1
225 75.8
141 48.1
15 4.516 4.84 2.0
0%
10%
20%
30%
40%
50%
60%
70%
80%
90%
100%
No. of FundsClosed
Aggregate CapitalRaised ($bn)
Secondaries
Fund of Funds
Distressed
Opportunistic
Value Added
Core-Plus
Core
Debt
Source: Preqin
Prop
ortio
n of
Tot
al
Fig. 4: Mid-Market Closed-End Private Real Estate Fundraising by Primary Strategy, 2015 - 2018 YTD (As at May 2018)
238
210
109 113126
168 162 172 180 188166
48
8172
36 3144 51 49
58 5567
55
18
0
50
100
150
200
250
2007
2008
2009
2010
2011
2012
2013
2014
2015
2016
2017
2018
YTD
No. of Funds Closed Aggregate Capital Raised ($bn)
Source: Preqin
Fig. 1: Mid-Market Closed-End Private Real Estate Fundraising, 2007 - 2018 YTD (As at May 2018)
Year of Final Close
17 158 10 8 15 12 13 15 13 12
3
5043
20 18 2727 28 31 32 40 35
12
14
14
8 4
89 9
14 814
7
4
0
10
20
30
40
50
60
70
80
90
2007
2008
2009
2010
2011
2012
2013
2014
2015
2016
2017
2018
YTD
Upper Mid-Market
Mid-Market
Lower Mid-Market
Source: Preqin
Aggr
egat
e Ca
pita
l Rai
sed
($bn
)
Fig. 3: Aggregate Capital Raised by Mid-Market Closed-End Private Real Estate Funds Closed by Size, 2007 - 2018 YTD (As at May 2018)
Year of Final Close
153lower-mid-market funds are
currently in market.
207mid-market funds are currently in market.
26upper-mid-market funds are
currently in market.
$22.2bnAmount targeted by lower-mid-market funds seeking capital.
$84.6bnAmount targeted by mid-market
funds seeking capital.
$20.6bnAmount targeted by upper-mid-
market funds seeking capital.
59%of funds have failed to reach
their initial target size since 2013.
53%of funds have surpassed their initial target size since 2013.
89%of funds have surpassed their initial target size since 2013.
LOWER MID-MARKET MID-MARKET UPPER MID-MARKET
THE FACTS
© Preqin Ltd. 2018 / www.preqin.com14 Real Estate Spotlight | June 2018
164151
16
5978 18
26 2836 54 7 121 44 5
0%
10%
20%
30%
40%
50%
60%
70%
80%
90%
100%
Lower Mid-Market
Mid-Market Upper Mid-Market
Diversified Multi-RegionalAfrica
Middle East & Israel
Latin America
Australasia
Asia
Europe
North America
Source: Preqin
Prop
ortio
n of
Fun
ds C
lose
d
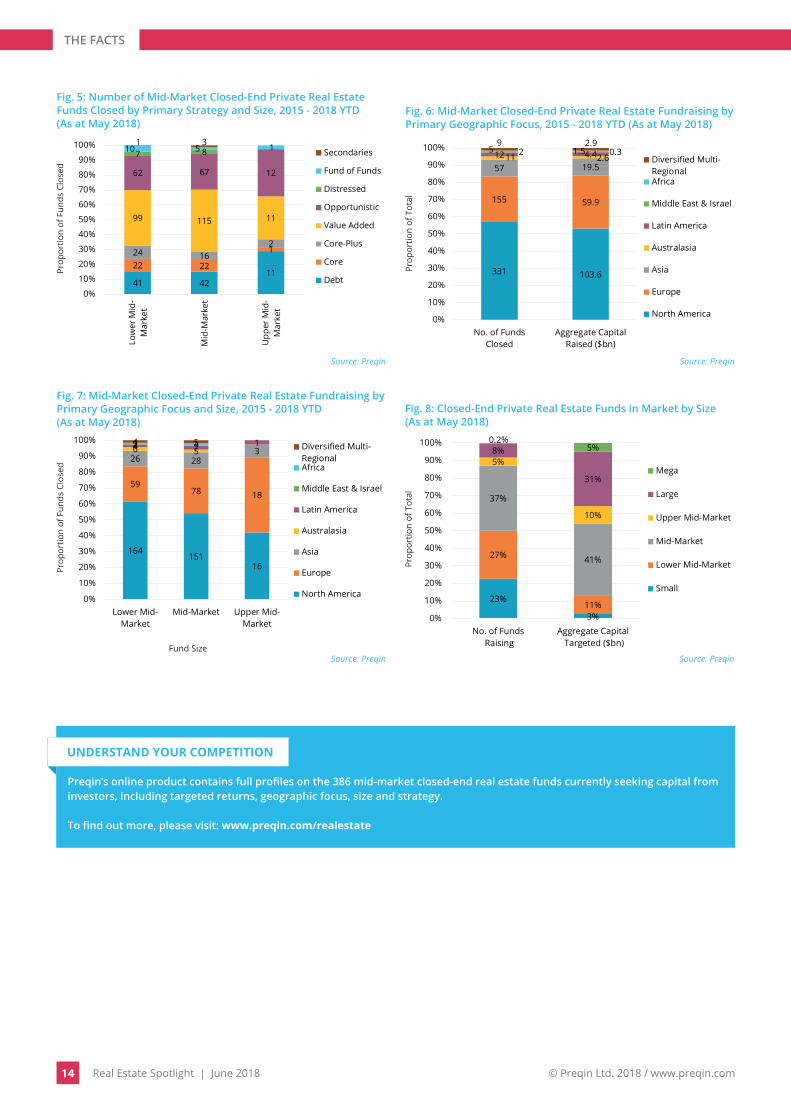
Fig. 7: Mid-Market Closed-End Private Real Estate Fundraising by Primary Geographic Focus and Size, 2015 - 2018 YTD(As at May 2018)
23%
3%
27%
11%
37%
41%
5%
10%
8%
31%
0.2%5%
0%
10%
20%
30%
40%
50%
60%
70%
80%
90%
100%
No. of Funds Raising
Aggregate Capital Targeted ($bn)
Mega
Large
Upper Mid-Market
Mid-Market
Lower Mid-Market
Small
Source: Preqin
Prop
ortio
n of
Tot
alFig. 8: Closed-End Private Real Estate Funds in Market by Size (As at May 2018)
Fund Size
41 4211
22 22
124 162
99 115 11
62 67 12
7 810 5 11 3
0%
10%
20%
30%
40%
50%
60%
70%
80%
90%
100%
Low
er M
id-
Mar
ket
Mid
-Mar
ket
Upp
er M
id-
Mar
ket
Secondaries
Fund of Funds
Distressed
Opportunistic
Value Added
Core-Plus
Core
Debt
Source: Preqin
Prop
ortio
n of
Fun
ds C
lose
d
Fig. 5: Number of Mid-Market Closed-End Private Real Estate Funds Closed by Primary Strategy and Size, 2015 - 2018 YTD (As at May 2018)
331 103.6
155 59.9
57 19.511 2.612 4.42 0.35 1.5
9 2.9
0%
10%
20%
30%
40%
50%
60%
70%
80%
90%
100%
No. of FundsClosed
Aggregate CapitalRaised ($bn)
Diversified Multi-RegionalAfrica
Middle East & Israel
Latin America
Australasia
Asia
Europe
North America
Source: Preqin
Prop
ortio
n of
Tot
al
Fig. 6: Mid-Market Closed-End Private Real Estate Fundraising by Primary Geographic Focus, 2015 - 2018 YTD (As at May 2018)
UNDERSTAND YOUR COMPETITION
Preqin’s online product contains full profiles on the 386 mid-market closed-end real estate funds currently seeking capital from investors, including targeted returns, geographic focus, size and strategy.
To find out more, please visit: www.preqin.com/realestate
THE FACTS
© Preqin Ltd. 2018 / www.preqin.com15 Real Estate Spotlight | June 2018
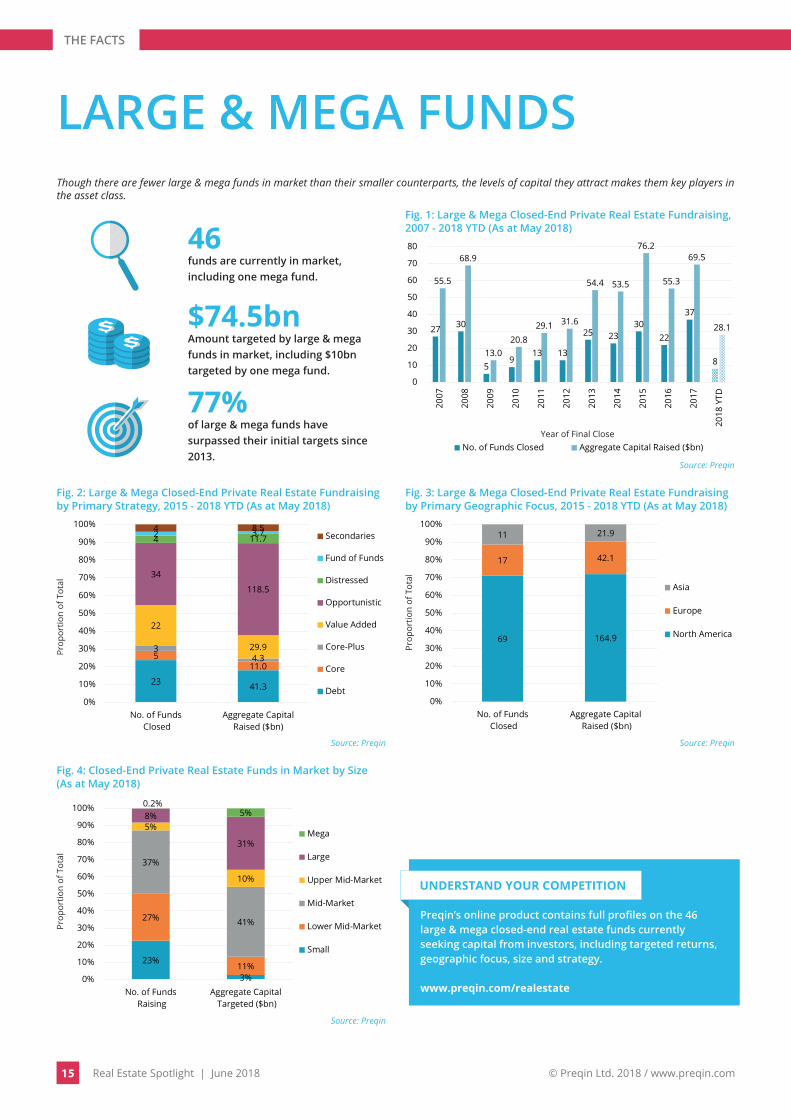
LARGE & MEGA FUNDSThough there are fewer large & mega funds in market than their smaller counterparts, the levels of capital they attract makes them key players in the asset class.
27 30
59
13 13
25 2330
22
37
8
55.5
68.9
13.020.8
29.1 31.6
54.4 53.5
76.2
55.3
69.5
28.1
0
10
20
30
40
50
60
70
80
2007
2008
2009
2010
2011
2012
2013
2014
2015
2016
2017
2018
YTD
No. of Funds Closed Aggregate Capital Raised ($bn)
Source: Preqin
Year of Final Close
Fig. 1: Large & Mega Closed-End Private Real Estate Fundraising, 2007 - 2018 YTD (As at May 2018)
23 41.3
511.0
34.3
22
29.9
34
118.5
4 11.72 3.74 8.5
0%
10%
20%
30%
40%
50%
60%
70%
80%
90%
100%
No. of Funds Closed
Aggregate CapitalRaised ($bn)
Secondaries
Fund of Funds
Distressed
Opportunistic
Value Added
Core-Plus
Core
Debt
Source: Preqin
Prop
ortio
n of
Tot
al
Fig. 2: Large & Mega Closed-End Private Real Estate Fundraising by Primary Strategy, 2015 - 2018 YTD (As at May 2018)
69 164.9
17 42.1
11 21.9
0%
10%
20%
30%
40%
50%
60%
70%
80%
90%
100%
No. of Funds Closed
Aggregate Capital Raised ($bn)
Asia
Europe
North America
Source: Preqin
Prop
ortio
n of
Tot
al
Fig. 3: Large & Mega Closed-End Private Real Estate Fundraising by Primary Geographic Focus, 2015 - 2018 YTD (As at May 2018)
23%
3%
27%
11%
37%
41%
5%
10%
8%
31%
0.2%5%
0%
10%
20%
30%
40%
50%
60%
70%
80%
90%
100%
No. of Funds Raising
Aggregate Capital Targeted ($bn)
Mega
Large
Upper Mid-Market
Mid-Market
Lower Mid-Market
Small
Source: Preqin
Prop
ortio
n of
Tot
al
Fig. 4: Closed-End Private Real Estate Funds in Market by Size(As at May 2018)
46funds are currently in market, including one mega fund.
$74.5bnAmount targeted by large & mega funds in market, including $10bn targeted by one mega fund.
77%of large & mega funds have surpassed their initial targets since 2013.
UNDERSTAND YOUR COMPETITION
Preqin’s online product contains full profiles on the 46 large & mega closed-end real estate funds currently seeking capital from investors, including targeted returns, geographic focus, size and strategy.
www.preqin.com/realestate

CONFERENCES
© Preqin Ltd. 2018 / www.preqin.com16 Real Estate Spotlight | June 2018
CONFERENCES
Conference Dates Location Organizer Preqin Speaker Discount Code
FundForum International 2018 11 - 13 June 2018 Berlin KNect365 Amy Bensted 10% Discount - FKN2546PQL
Elite Summit 11 - 13 June 2018 Montreux marcus evans Summits - -
Family Office Summit 14 June 2018 Mumbai IVCA - -
Infrastructure & Real Estate Investment Strategies for Pension Funds
14 June 2018 London SPS Conferences - -
19th Annual US Real Estate Opportunity & Private Funds Investing Forum
24 - 26 June 2018 Newport, RI IMN Leopold Peavy 15% Discount - PQ15
JUNE 2018
Conference Dates Location Organizer Preqin Speaker Discount Code
Family Office & Private Wealth Management Forum 16 - 18 July 2018 Newport, RI Opal Financial Group - -
Real Estate Fund Investing 16 July 2018 New York, NY Catalyst Financial Partners - -
JULY 2018
Conference Dates Location Organizer Preqin Speaker Discount Code
FundForum Asia 2018 3 - 5 September 2018 Hong Kong KNect365 TBC 10% Discount - FKN2544PQL
Total Alts 6 - 7 September 2018 San Francisco, CA IMN - 15% Discount - PQ15
Preqin Breakfast Seminar – Future of Alternatives - London 12 September 2018 London Preqin - -
Europe GRI 12 - 13 September 2018 Paris GRI - -
Emerging Managers Summit 12 - 13 September 2018 New York, NY Opal Financial Group - -
SuperReturn Asia 17 - 20 September 2018 Hong Kong KNect365 Patrick Adefuye Felice Egidio
10% Discount - FKR2449PRQ
7th Annual Real Estate CFO & COO Forum (East) 19 - 20 September 2018 New York, NY IMN - 15% Discount -
PQ15
Finovate Fall 24 - 26 September 2018 New York, NY KNect365 - 20% Discount - FKV2343PQT
The 6th Annual Real Estate Private Equity Forum on Land & Homebuilding (West)
24 - 25 September 2018 Las Vegas, NV IMN - 15% Discount - PQ15
Brazil Breakfast in association with LAVCA´s Annual Summit and Investor Roundtable
25 September 2018 New York, NY ABVCAP - -
SEPTEMBER 2018