REAL ESTATE IN THE INVESTMENT PORTFOLIO - … · REAL ESTATE IN THE INVESTMENT PORTFOLIO A report...
94
REAL ESTATE IN THE INVESTMENT PORTFOLIO A report prepared for the Investment Strategy Council of the Royal Ministry of Finance Professor Martin Hoesli Professor Colin Lizieri March 2007 Revised May 2007
Transcript of REAL ESTATE IN THE INVESTMENT PORTFOLIO - … · REAL ESTATE IN THE INVESTMENT PORTFOLIO A report...

REAL ESTATE IN THE INVESTMENT PORTFOLIO
A report prepared for the Investment Strategy Council of the Royal Ministry of Finance
Professor Martin Hoesli
Professor Colin Lizieri
March 2007 Revised May 2007

Executive Summary
This report attempts to distill research on the role of commercial real estate within
mixed-asset portfolios. It draws on research-based literature from Asia, Australasia,
Europe and North America, augmented with some primary research findings, in an
attempt to help the Ministry of Finance’s Strategy Council to address whether there is
a role for real estate in the Government Pension Fund - Global.
The report covers five principal areas:
o The Structure of the Market and Real Estate Investment Vehicles;
o The Risk-Return Characteristics of Real Estate Investment Assets;
o The Distribution of Real Estate Returns;
o The Role of Real Estate in the Mixed-Asset Portfolio; and
o Performance Measurement and Benchmarking of Real Estate.
A. Market Structure
Real estate is an under-researched asset class. Despite major improvements over the
last decade, research and analysis is hampered by poor data availability. Many
markets have only low frequency, short time series data;
The growth of specialist research and data provider services has greatly improved the
transparency of real estate markets in recent years;
There are no definitive figures for the size of the global commercial real estate market.
Estimates range from $8trillion to $22trillion. The low estimate represents around
16% of the capitalization of global equity markets, the high end, some 40%.
Pension fund investment in non-residential real estate varies around the world. U.S.
pension funds hold around 3.5% of their assets in property; the share in some other
major economies exceeds 10%.
There are now many routes to gaining exposure to real estate markets, with available
investment vehicles possessing distinct risk-return characteristics, market structures,
liquidity and transparency. These differences alter the impact of inclusion of real
estate in the mixed-asset portfolio.
i

Available means of gaining exposure include direct private market ownership and
development of investment property, private collective investment vehicles, open ended
and exchange traded unitized funds, listed real estate companies and REITs, property
derivatives, commercial mortgage backed securities and other debt vehicles.
Some commentators treat infrastructure investment as equivalent to real estate. There
are both similarities and differences. However, there is little formal analysis of risk
and return characteristics due to data deficiencies and the relative immaturity of the
infrastructure investment market.
The new investment vehicles and opportunities have brought new types of investors
into the commercial real estate market, with private capital and hedge funds playing
an increasingly significant role relative to traditional institutional investors.
B. Risk and Return
Analysis of risk and return is hampered by short time series. However, longer and
more robust time series exist for Australia, the United Kingdom and the United States.
These can be used to provide a benchmark for consideration of real estate risk and
return.
Available commercial real estate market performance indicators are based not on
transactions but on appraisals (valuations). This is believed to result in a
“smoothing” or moving average process which understates risk. It is thus important
to address the smoothing issue when comparing real estate returns with other asset
classes.
Over the last twenty years in the United States, Equities generate real annualized
returns of around 11%, listed Real Estate Investment Trusts 8% and Bonds and
Private Real Estate around 5%. However, the reported risk of real estate (at around
3%) is far lower than bonds (8%), REITs (14%) and stocks (16%). Correcting for
appraisal smoothing produces a higher estimate of risk, of around 8%.
Analysis of the risk-return performance of different asset classes in Australia and the
U.K. produces similar results to those of the United States. In Australia, Listed
Property Trusts have outperformed the equity market and exhibit both higher returns
and greater volatility than directly-held private real estate.
ii

U.K, listed Property Companies produce similar returns to stocks but are more risky.
Private real estate returns are higher than bonds; the smoothed risk measure is lower
than for bonds: desmoothing suggests higher risk, closer to that expected in a risk-
return framework, but still significantly below that of property companies.
Multi-factor approaches have attempted to identify factors that determine real estate
returns. Most studies find that macro-economic variables (GDP, industrial output,
consumption/spending) and financial variables (real interest rates and term structure)
are important factors. However, many studies detect a unique, priced, real estate
factor, making a case for inclusion of real estate in the mixed-asset portfolio.
The evidence on the inflation hedging properties of real estate is mixed. Generally,
real estate appears to be a partial hedge. It has long-run hedging qualities, but does
not adjust quickly to inflation shocks. This might be related to the constraints of lease
contracts (which delay rental adjustment) or to interest rate sensitivity and the
interaction between inflation increases and intervention by monetary authorities.
The available time series data are too short and too low frequency to permit reliable
testing of mean reversion in private real estate markets. There are observable, but
irregular, cycles of high and low returns around trend lines. Evidence on the
behavior of listed real estate securities points to weak mean reversion.
Listed real estate typically exhibits low correlation with direct private real estate
indices – which, alongside the higher volatility, has led some to question whether or
not real estate securities are a property investment. In many markets, listed property
returns exhibit strong positive correlations with the general equity market.
The low correlations may be misleading. Listed real estate firms make use of debt, so
the returns should be degeared. Direct market returns should be desmoothed to
reduce valuation smoothing effects. This results in higher correlations and there is
evidence of long-run integration of public and private real estate returns.
Furthermore, a “price discovery” effect can be observed, with information in the
listed real estate market processed and priced well in advance of price movements in
the private market. Again desmoothing reduces this lag effect.
Illiquidity is a significant issue in private real estate markets. The high value and
indivisibility of real estate, high transaction costs and the lengthy and uncertain time
taken to sell assets produces additional risk for investors. It is hard to quantify this
additional risk. Research points to a 50-100 basis point premium for typical holding
periods and market volatility.
iii

C: Return Distributions
Research consistently finds that real estate returns are not distributed normally, with
kurtosis and skewness outside standard parameters. This has implications for the
appropriateness of risk measures in standard portfolio allocation models.
There is evidence of non-linearity and asymmetry in return distributions. For listed
property returns, there is some evidence that correlation with other asset classes
increases when those asset classes are performing poorly (tail dependence), eroding
some of the benefits of diversification.
For private real estate, analysis of return distributions must confront the appraisal
smoothing issue. The valuation process seems to result in very high serial correlation,
with returns in one period influencing those in another. Desmoothing procedures seek
to remove this effect by extracting the “new” information from valuation-based
returns.
There is no consensus on the “best” method for desmoothing appraisal-based data.
The most frequently used model attempts to remove first order autocorrelation (the
relationship between the return this period and that of the previous period). Initial
results from transaction-based, repeat sales indices provide confirmation of the
benefits of the first order autocorrelation method.
Leverage also influences return distributions, adding capital structure risk to the
underlying asset risk. U.S. REITs typically have debt to value ratios of around 40%
while private real estate equity vehicles at the high risk-return end of the spectrum
(value added or opportunity funds) frequently have debt to asset value ratios in excess
of 70%. The impact of exposure to interest rate risk needs to be disentangled from the
underlying real estate market risk.
D: Real Estate, the Portfolio and Diversification
Correlation analysis indicates that real estate investment should bring diversification
benefits to the mixed-asset portfolio. Generally, directly-held private real estate
indices exhibit low positive correlations with equities and near zero correlations with
bond returns in a wide range of countries.
iv

Where there are longer time series available, as in Australia, U.K. and the U.S., the
correlation results appear to stand. There is variation over time and correlations are
unstable, but rarely appear to be strongly positive.
In mean-variance analysis, the efficient frontier for a portfolio that includes real
estate (even where desmoothed and with an illiquidity premium accounted for)
dominates the efficient frontier with just stocks and bonds.
Optimal weightings for real estate depend on return targets and risk tolerance: it is
usual to find substantial weightings for real estate in national and international
analyses – weightings typical larger than institutional holdings of property.
Securitized, listed real estate offers less apparent diversification and risk-adjusted
return benefits than directly owned property, with stronger correlation to overall
equity market movement and higher volatility – possibly offset by liquidity benefits.
Given that there is return uncertainty due to the appraisal basis of private real estate
returns, some researchers have constructed “fuzzy” frontiers with a range of values
rather than a point estimate. Even here, most researchers point to a substantial real
estate weighting.
There is some debate as to what are appropriate risk measures for real estate, given
non-normality and other distributional issues. Researchers using downside risk
measures such as maximum drawdown, semi-variance or VaR find reduced but still
substantial weightings for real estate in mixed-asset portfolios. Constant liquidity
adjustment models produce similar results.
Asset-Liability Matching models tend to produce lower weightings to real estate than
do conventional mean-variance approaches but the property weightings remain larger
than those typically found in pension fund portfolios.
A weighting of 10% or more in real estate would be consistent with an investment
strategy that was mindful of the global market capitalization of different asset classes.
With respect to international diversification, research confirms the benefits of
diversifying real estate portfolios internationally and of including real estate in an
internationally diversified mixed-asset portfolio.
Cross-national real estate returns appear to exhibit lower correlation than cross-
national equity returns. However there is some evidence of convergence of
international real estate returns: a global real estate factor has been identified by a
number of researchers, while others have pointed to regional factors (e.g. for Asian
markets).
v

There are significant practical difficulties in assembling a diversified international
portfolio. Most studies use national index data. However, with relatively small
numbers of properties in each country, there is a risk of tracking error. The cost of
reducing that tracking error to a small figure may be prohibitive for most investors.
There are high information and monitoring costs associated with international real
estate investment and a risk of information asymmetry and lack of awareness of local
market practice and circumstances. This has driven the growth of international
collective investment vehicles that provide economies of scale in acquisition and
management.
Hedging currency risk at project or building level is complex in real estate with the
long and uncertain holding period and exit value not matching available hedging
products. This may be less of a problem if exchange rate hedging is based on a
portfolio level currency overlay approach.
Within the property portfolio, evidence suggests that sector diversification is more
effective than geographical diversification, although care should be taken to
distinguish between administrative regions and economically-functioning regions.
There is some evidence that there is considerable building-level variation within
sectors and regions, casting some doubt on their effectiveness in structuring the
optimal portfolio. Tenancy structures, yields and size are other possible dimensions
structuring the risk-return profile.
E: Performance Measurement and Benchmarking
Benchmarking performs multiple roles – to communicate performance to stake
holders, to provide accountability for fund managers, and to support research. In all
three areas, data issues in real estate cause problems.
There is an increasing availability of market performance indices in commercial real
estate. The Achilles’ heel of such indices is that they are appraisal-based creating
uncertainty as to the value of performance measures and benchmarks. While
transaction-based indices assist in promoting understanding of overall market
behavior, at fund level appraisals will remain an integral part of the measurement
process.
One consequence of valuation uncertainly (and low frequency data) is that it is very
difficult to prove that a fund manager has outperformed (or underperformed) a target
in any sense of statistical significance.
vi

Targets for fund managers may be absolute (achieve a real return of 5%) or relative
(outperform IPD by 1%). The performance should be risk adjusted. Benchmarking
international performance is more problematic, as not only is there incomplete
coverage of return series, it is also unclear as to what weights should be applied to the
national components.
Benchmarking and performance measurement must be mindful of leverage. Use of
debt combines asset performance and performance that is related to capital structure.
Debt levels are a particular issue for public real estate securities and for value-added
and opportunity funds amongst private equity real estate vehicles.
The sheer diversity of private equity vehicles, allied to lack of standardization, makes
performance measurement particularly difficult. There are major problems in
quantifying the impact of fractional valuation, realization-based performance fees and
management costs, the right to exit and the impact of debt on structure of returns.
Despite major improvements in transparency and attempts by interest groups to
impose standardization of reporting, there remain numerous unanswered questions
concerning the performance of private real estate investment vehicles, not least in that
their behavior has not been observed over a complete real estate cycle.
In summary, the risk-return characteristics of real estate, the apparent existence of a
priced real estate factor and the relationship between real estate returns and those of
other asset classes point to a role for real estate as a diversifier in the mixed-asset
portfolio at national and at national scales of analysis.
An investor building a real estate portfolio strategy faces a number of complex
practical difficulties both in portfolio construction and in performance measurement
and benchmarking. These are compounded by a market timing issue, given cyclicality
in property markets and concerns over the sustainability of values in certain markets
where demand for product seems to exceed demand.
vii

Contents Executive Summary i Contents viii 1. Introduction 1 2. Real Estate Investments and Real Estate Markets: The General Context 3 3. Risk and Return in Real Estate Markets 15 4. The Distribution of Real Estate Returns and Measurement Issues 39 5. The Fund's Allocation to Real Estate 46 6. Performance Measurement and Benchmarking 65 7. Conclusions: Real Estate in the Investment Portfolio 73 Bibliography 76 Appendix - Acronyms 84
viii

REAL ESTATE IN THE INVESTMENT PORTFOLIO: A REPORT PREPARED FOR THE INVESTMENT STRATEGY COUNCIL OF THE ROYAL MINISTRY OF FINANCE 1. Introduction
This report is prepared for the Ministry of Finance of Norway to provide the necessary
background to analyze whether real estate should be included in the Government Pension
Fund – Global (formerly known as the Government Petroleum Fund) and, if so, how that real
estate allocation should be structured. The approach is very much one of a digest of the
relevant literature bearing in mind that the report will be used for investment decision
purposes. Hence, although academic in its thoroughness, the report is not an academic piece.
Some empirical analyses have been conducted when it was felt that these would add to the
discussion of results contained in the literature.
It is important to note the size of the portfolio: US$240 billion as of mid-2006. This is
significant in influencing possible products and strategies. An allocation of just 3% to real
estate – less than that found in the United States – would imply a portfolio with a gross asset
value of $8.4billion – sufficiently large to permit acquisition of a large private direct real
estate portfolio, and consideration of a range of real estate investment products and ease
problems associated with constructing an international real estate portfolio.
The report begins with a consideration of the overall size of the global real estate market and
the available real estate investment vehicles that give exposure to those markets: these can
broadly be divided into private and public market vehicles and into direct and indirect
vehicles. Acquisition of a directly managed portfolio of buildings represents private, direct
investment; purchase of shares in listed real estate is public, indirect investment, but there
exists a whole spectrum of products between those two poles. Section three, the core of the
report, examines risk and return in real estate markets, analyzing data for three major real
estate markets and summarizing the key findings from the real estate literature. This section
also considers the relationship between private and public real estate markets.
1

The fourth section develops some of the themes of part three in examining the distribution of
real estate returns and some of the measurement problems encountered in private real estate –
in particular the fact that the appraisal-based nature of most real estate performance indices is
believed to “smooth” returns and, hence, to understate the risks inherent in real estate
investment.
The final substantive section considers performance measurement and benchmarking in real
estate. What targets are appropriate for real estate fund managers and to what extent can their
performance be assessed reliably, given the measurement problems discussed in section four?
The final section summarizes the findings.
2

2. Real Estate Investments and Real Estate Markets: The General Context
For a long time, commercial real estate has been a relatively under-researched market,
certainly by comparison to the major financial asset classes. This may seem surprising given
the size of the market, but probably reflects data issues caused by the characteristics of the
asset class (largely traded in private markets, with inaccessible private data and often poor
quality public data). Up until the early 1990s, benchmarks were only available in a very
limited number of countries (the U.S., U.K., Canada, Ireland, Australia, and New Zealand).
In terms of major markets, benchmarks only really existed for the U.S. and U.K. markets.
From the 1990s, new benchmarks emerged for many countries. The Investment Property
Databank (IPD), a major provider of commercial real estate benchmarks, now reports on 14
European markets, and three outside Europe (Australia, Canada and South Africa).
Consultation releases are also available for Japan and Belgium, and development projects well
advanced in Korea and New Zealand.
There is a much wider acceptance that real estate investment decision making needs to be
informed. In particular, the linkages between real estate and financial markets need to be
analyzed. There are many more quality journal articles, and also books, monographs, industry
publications and reports. That research has become more international in nature, with the
development of global and regional real estate conferences, both academic and trade-related.
These developments parallel the growth of international real estate service providers
(particularly following the wave of international merger and acquisition activity in the late
1990s and early 2000s) who provide both a “one stop shop” for international investors and a
growing standardization in terminology and statistics. In addition, international data
providers, interest groups and trade associations (such as EPRA and INREV) have appeared
improving the quality of research.
There are no official statistics on the overall size of the commercial real estate market. The
capital value of the global commercial real estate market has been estimated to be as little as
$8,000 billion1 and as large $22,000 billion2 – the differences in part reflecting whether or not
1 Chen and Mills (2006). 2 La Salle Investment Management (2007).
3

corporate real estate is included, but also whether or not “core” assets only are considered3.
This compares to an estimated market capitalization of $49,000 billion for global stock
markets and $60,000 billion for bond markets (SIFM, 2006). However, investment in real
estate is more complex. The European Public Real estate Association, EPRA (2007) estimate
that $1,525 billion is in listed real estate securities – 8.8% of their estimated total real estate
market of $17,329 billion and around 3.1% of the equity market. AME Capital (2006)
produce a higher estimate of the market capitalization of the global real estate equity market
at around $1,900billion, 32% of which is in Asian markets, 31% in North America and 25%
in Europe. 39% of the companies listed were REITs or equivalent – a proportion likely to
grow as more countries introduce REIT legislation. The differences reflect the treatment of
property development and construction companies and real estate service providers,
particularly in Asian markets.
The table below sets out allocations to real estate by pension funds in six countries studied in
an international project by the Pensions Real Estate Association (PREA) of the United States4.
As can be seen, there is considerable variation, but three of the countries have allocations of
10% or more. The U.K.’s allocation is understated, since stakes in property companies have
been counted as equity rather than real estate investments. Explanations for the differences
across countries include history, culture, pension fund regulation, but also the structure of the
market in terms of other participants and the tenure choice decisions of both commercial real
estate and housing.
Figure 2.1 Pension Fund Allocations to Real Estate Country Real Estate as
% of Portfolio % of Real Estate
Direct % of Real Estate
Indirect Australia 11% 45% 55% Germany 12% 58% 42% Netherlands 10% 56% 42% United Kingdom 6% 100%(*) United States 3.5% 46% 54% Source: PREA (2006) Note: (*) Property equities classed with equity asset class not real estate. Understates use of managed
funds and private collective investment vehicles. 3 The $8,000 billion figure is as of the end of 2005, whereas the $22,000 billion figure is as of the second quarter
of 2006. 4 PREA is a not-for-profit organization with more than 1,500 individual members representing more than 438
member firms, including retirement plans, real estate asset managers, REITs, and others.
4

Until comparatively recently, most investors seeking exposure to commercial real estate had
two main options: assembling a directly-owned real estate portfolio in the private market or
owning shares in listed real estate companies. The last decade or so has seen the creation of
many new routes to investment with real estate vehicles providing a considerable range of
risk-return options. We briefly review the types of vehicles that are available and their
characteristics. Later in the report, the risk-return characteristics of the major vehicles are
considered in more detail.
Directly-owned real estate
Owning a portfolio of buildings clearly gives real estate returns! However, some of the
characteristics of real estate as an asset mean that the returns will not necessarily track a
performance index. Real estate is characterized by large lot size, heterogeneity (partly as a
function of the importance of location), high transaction costs, high management costs and
illiquidity. The high transaction costs lead to longer holding periods than would be the norm
in financial asset markets which, in turn, means that real estate markets tend to be thinly
traded. The heterogeneity creates low correlations and high specific risk in the return
performance of individual properties (which contributes towards tracking error while the large
lot size makes it very difficult to diversify away specific risk). Clearly this is a constraint that
applies most markedly to smaller funds. The scale of the Government Pension Fund – Global
is sufficient to permit both diversification and economies of scale in management given a
reasonable allocation to real estate.
Private Collective Investment Vehicles
The last decade has seen a dramatic rise in the use of private collective investment vehicles as
a mechanism for channeling capital into real estate markets. There exist a wide range of
unlisted vehicle structures, ranging from limited partnerships and master limited partnerships
(as a vehicle for joint venture investing) to unit trust and private company structures. More
recently, fund of fund products have emerged. Many such vehicles are domiciled in tax
havens. The vehicles tend to be structured to be tax-transparent, tax-neutral or tax efficient,
avoiding the tax leakage that can occur from public vehicles. The major benefits of such
vehicles are that they permit access to markets (both geographical and sectoral – for example
few smaller investors could directly invest in shopping malls or build a diversified global
5

portfolio) for lower amounts of capital eroding entry barriers; provide access to specialist
management; reduce search and monitoring costs; and permit investors who are excluded
from borrowing to acquire real estate access to geared property returns (Baum and Fear,
2001).
Figure 2.2 European Private Real Estate Vehicles
Source: Property Funds Research (2006)
European Private VehiclesGrowth by Style
0
50000
100000
150000
200000
250000
300000
350000
Up to1995
1996 1997 1998 1999 2000 2001 2002 2003 2004 2005
Eur m
.
OpportunityValue-addedCoreGerman O/Ended Fund
While the underlying vehicle structure is important, so too are the capital structure and target
market. Unlisted vehicles are classified by their risk-return characteristics and their target
markets. Core funds typically have low gearing and aim to invest in fully let prime (Class A)
real estate assets in established markets. Core-plus funds may have higher gearing levels and
target markets with greater upside rental growth prospects. Value added funds seek more
explicit growth opportunities through repositioning, re-leasing and redevelopment.
Opportunity funds use high levels of gearing and generate returns through development,
investment in distressed or emerging markets, and via financial engineering. The target
internal rates of returns for these funds reflect the increased risk as one moves from core to
opportunity. INREV, the European Association for Investors in Non-listed Real Estate
Vehicles, provide a classification framework for funds. The risk inherent in value-added and
opportunity funds has, perhaps, been masked by the strength of real estate markets and the
compression of yields over the last five years.
6

Figure 2.3 Real Estate Vehicles: Risk-Return Spectrum
CoreFully leased multi-tenant property
Core PlusStable lease roll,
moderate NOI upside
OpportunisticDistressed sellers, development, financial
engineering, emerging sectors
While such funds provide direct real estate returns, subject to gearing and interest rate
payments, a number of issues emerge in relation to unlisted funds. These include questions
about the value of fractional interests (subdividing ownership of a property asset may result in
an increased aggregate value, through the erosion of entry barriers and exposure to specific
asset risk, or a decreased aggregate value, due to management control issues); questions about
the amount and basis of management performance fees; concerns about liquidity and about
exit strategies for finite life funds. These issues will be considered further below, in relation
to performance measurement. For many funds, the fund sponsor will co-invest, reducing
agency problems.
Unitised and Open Ended Structures
The German open ended funds (Offene Immobilienfonds) have been a major investment force
in commercial real estate. Recent problems relating to corporate governance and valuation
have emerged that have dented public confidence. A major problem with open ended
structures relates to investment timing and the illiquidity of real estate – particularly where
many investors are from the retail market or are less informed. Capital inflows tend to follow
stronger real estate market performance – forcing managers to acquire assets in strong and
rising markets. Similarly, demands for redemption in poor market conditions create problems
for managers who must sell assets (possibly at below the redemption valuation).
Return:8-10% Leverage:0-30%
Return: 16-19% Leverage: 60-65%
Value-AddedRepositioning, redevelopment, re-leasing
Return:11-14% Leverage:30-50%
Return:20%+ Leverage:70%+
Risk
Ret
urn
CoreFully leased multi-tenant property
Core PlusStable lease roll,
moderate NOI upside
OpportunisticDistressed sellers, development, financial
engineering, emerging sectorsValue-Added
Repositioning, redevelopment, re-leasing
Return:20%+ Leverage:70%+
Return: 16-19% Leverage: 60-65%
Return:11-14% Leverage:30-50%
Return:8-10% Leverage:0-30%
Risk
Ret
urn
7

Further, illiquidity in the underlying real estate market makes it difficult to redeem quickly,
forcing managers to hold cash reserves. This is less of a problem for non-regulated unit trust
and open ended fund structures where the manager may have more control over capital flows
and redemption.
The price of units in unit trust structures is generally based on appraised values of the assets
under management – that is the net asset value of the fund is divided by the number of units
issued. Generally there is a bid-ask spread around that unit value. Given the strong link
between NAV and unit price, unit trust return performance tends to track underlying market
indices. Actual delivered returns will be dependent on whether income is reinvested or
distributed to unit holders. For many authorized and regulated trusts in Europe, there is some
leakage with trust income taxed, albeit often at a lower rate.
Listed Real Estate Vehicles
In considering listed real estate vehicles, it is important to distinguish Real Estate Investment
Trust (REIT) structures from property company structures. The latter, as corporate entities,
are subject to taxation at company level, leading to tax leakage effects both for taxed and
untaxed investors. REITs typically do not pay tax at corporate level, subject to a set of
qualifying rules which specify the nature of activities and asset base, ownership
concentration, gearing structure and distribution policy. REIT rules vary by nation but
common features are the requirement to be primarily a real estate investor and the
requirement to distribute a high proportion of net operating income to shareholders. This
restriction on retained earnings is intended to create returns that are closer to those of the
underlying real estate market and less dependent on management decisions. REIT markets
have proved extremely successful in U.S. and Australia, with growth expected in the “new”
REIT markets in Asia and in Europe.
The risk-return characteristics of REITs and property companies are considered in more depth
below. To preview the conclusions of research, listed real estate securities are linked in the
long run to the performance of their assets and the real estate market but, in the short run,
exhibit volatility and price movements that are linked to the equity market. REIT structures
tend to have lower correlations with the equity market than do property company structures.
8
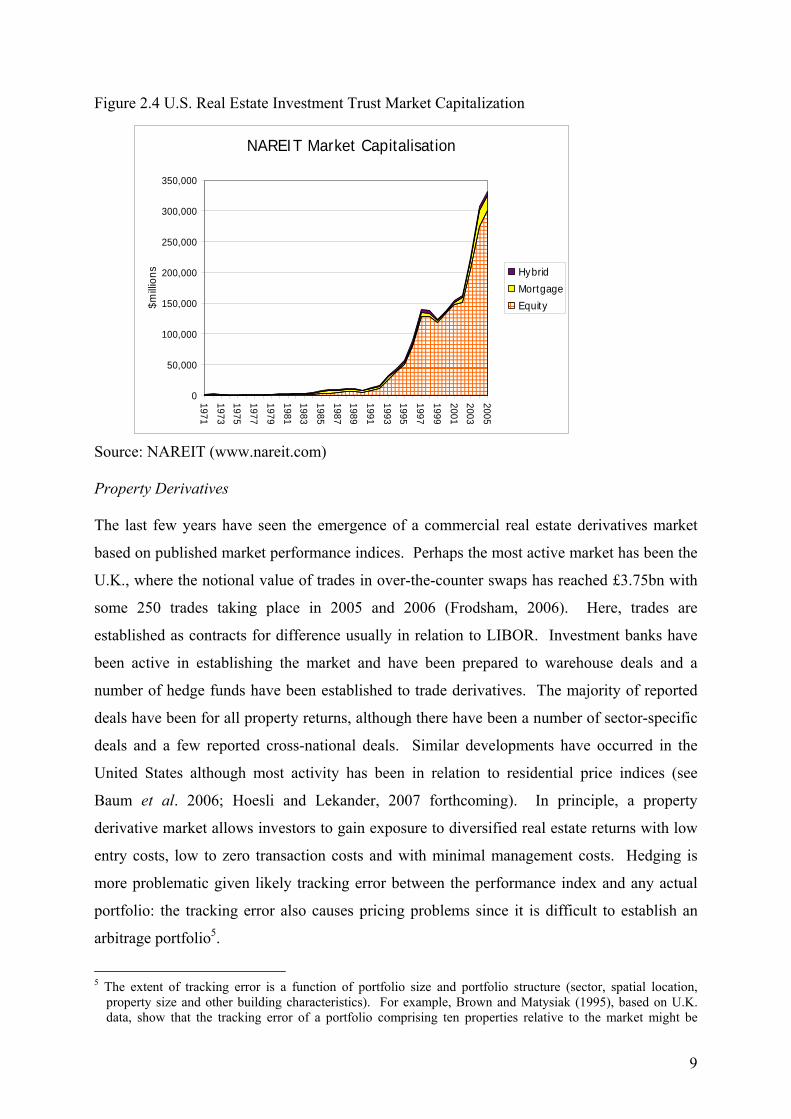
Figure 2.4 U.S. Real Estate Investment Trust Market Capitalization Source: NAREIT (www.nareit.com)
NAREIT Market Capitalisation
0
50,000
100,000
150,000
200,000
250,000
300,000
350,000
1971
1973
1975
1977
1979
1981
1983
1985
1987
1989
1991
1993
1995
1997
1999
2001
2003
2005
$mill
ions Hybrid
Mortgage
Equity
Property Derivatives The last few years have seen the emergence of a commercial real estate derivatives market
based on published market performance indices. Perhaps the most active market has been the
U.K., where the notional value of trades in over-the-counter swaps has reached £3.75bn with
some 250 trades taking place in 2005 and 2006 (Frodsham, 2006). Here, trades are
established as contracts for difference usually in relation to LIBOR. Investment banks have
been active in establishing the market and have been prepared to warehouse deals and a
number of hedge funds have been established to trade derivatives. The majority of reported
deals have been for all property returns, although there have been a number of sector-specific
deals and a few reported cross-national deals. Similar developments have occurred in the
United States although most activity has been in relation to residential price indices (see
Baum et al. 2006; Hoesli and Lekander, 2007 forthcoming). In principle, a property
derivative market allows investors to gain exposure to diversified real estate returns with low
entry costs, low to zero transaction costs and with minimal management costs. Hedging is
more problematic given likely tracking error between the performance index and any actual
portfolio: the tracking error also causes pricing problems since it is difficult to establish an
arbitrage portfolio5.
5 The extent of tracking error is a function of portfolio size and portfolio structure (sector, spatial location,
property size and other building characteristics). For example, Brown and Matysiak (1995), based on U.K. data, show that the tracking error of a portfolio comprising ten properties relative to the market might be
9

As a result, the reported margins over LIBOR have been difficult to explain using
conventional derivative pricing models (Baum et al., 2006). Nonetheless, the rapid growth of
the market, the wide variety of market participants and the growing sophistication of pricing
models and strategy offer the potential for the development of an actively-traded property
derivatives market with the critical mass to survive cyclical market fluctuations in the private
real estate market. The development of the market would improve the liquidity and efficiency
of the real estate market. It remains to be seen, however, how widely used these products will
become.
Commercial Mortgage Backed Securities
As with private unlisted real estate vehicles, the last decade has seen the rapid development of
a commercial mortgage backed securities market. Barclays Capital (2007) report that new
issuance in 2006 amounted to €65billion, with some 83 deals. They forecast close to
€100billion new issuance in 2007. The CMBS market in Europe now is a significant factor in
the operation of the commercial real estate market, strongly influencing interest rate margins,
bank lending policies and capital availability.
Do CMBS represent a real estate investment? To some extent it depends on the particular
structure of the issue. A conventional bond held to maturity provides a bond like cash flow
which does not fluctuate with real estate market conditions. However, bond prices and ratings
in the secondary market will reflect the real estate market environment, since repayments are
sustained by rental income and security is provided by capital value. There is, however, little
research on this topic either in Europe or in the U.S. where CMBS market penetration is
greater. It seems likely that CMBS returns will be more strongly influenced by general bond
factors (real interest rates, term structure and credit risk spread) than real estate factors. As a
result, this report will focus on equity real estate investment not debt vehicles.
around 4.7% per annum; for a similar property mix, a portfolio of 50 properties might have a tracking error of around 2.1%. Large funds (for example unit trusts) may thus exhibit relatively modest tracking error on an appraisal basis. However, the notional principal of most current derivatives contracts is relatively small, meaning that an actually-held arbitrage portfolio might exhibit quite distinct behavior from the underlying benchmark index.
10

Figure 2.5 European CMBS Issuance
European CMBS Issuance 1995-2006Source: Barclays Capital
0
10
20
30
40
50
60
70
80
90
1995 1996 1997 1998 1999 2000 2001 2002 2003 2004 2005 2006
EUR
bn
Issu
es
EURbnIssues
With the expansion of investment opportunities in real estate markets, innovation in vehicles
and products, the last few years have seen the arrival of specialist real estate hedge funds and
more established hedge funds moving into property markets. Examples include Blackacre
Capital Management, Cambridge Place, Grove Capital, Principal Real Estate Investors, and
Walton Street Capital. While the majority of these funds focus on listed real estate securities,
more recent developments have seen more complex portfolios and strategies. The activities
of hedge funds are outside the scope of this report.
Infrastructure
Over the last ten years, infrastructure investment has attracted considerable attention, fuelled
in part by governments seeking Public-Private Partnerships as an alternative to deficit
financing of major projects. Some pension funds – notably in Australia and Canada – have
made substantial allocations to infrastructure (sometimes in excess of 5% - see, e.g. Hobbs,
2006). The growth of the market raises a number of investment questions. For the purpose of
this report, two are of particular importance: first, whether or not infrastructure investment is
a real estate investment; and, second, if not, whether infrastructure offers diversification
benefits alongside or instead of real estate in the portfolio.
11

One immediate difficulty that is faced in examining infrastructure is the lack of data. Data
deficiencies are evident in real estate but, by comparison to infrastructure, real estate market
data has longer time series and substantially more robust measures. In part, this reflects the
comparative immaturity of infrastructure as an investment class; in part it results from the
considerable heterogeneity of infrastructure assets. These can vary from transport (toll roads,
bridges), utilities (power generation, storage and distribution), communications (fixed
networks, switching systems, satellites) and social provision (hospitals, housing); can be
based on development and transfer of assets (e.g. port or airport construction) or operational
running of services (private provision of health or prison services). Cashflow may be secured
under government contract or may come from public demand, with consequent variations in
volatility. Given these differences and the absence of reliable data, it is hard to be definitive
about the role of infrastructure in mixed-asset portfolios.
Infrastructure shares some characteristics with real estate. Investment requirements are large;
generally investment is in real assets that have a long asset life; often cashflows are
contractual over long periods, bringing income stability. There are high levels of
heterogeneity. In the absence of frequent transactions, periodic return calculations rely on
valuation and that valuation process is complex. However there are differences that suggest
that infrastructure may form a separate alternative asset class. These include the frequent
presence of government or quasi-government contracts and guarantees; the long maturity of
cashflows; the quasi-monopolistic position of many projects (which includes the entry barriers
for competitors and, often, inelastic demand for the services provided); and the absence of an
effective secondary market. For these reasons, many commentators treat infrastructure as a
distinct asset (for example, Clark and Evans, 1998; Hobbs, 2006; ING, 2006; Rakowski,
2004).
What, then, are the risk-return characteristics of infrastructure compared to real estate? There
is no definitive answer to this question and researchers have come out with very distinct
answers. Clark and Evans (1998) suggest that infrastructure is high risk, high return. They
argue that including a substantial weight of infrastructure to a balanced mixed-asset portfolio
leads to an increase in returns and risk but that the risk-adjusted returns are higher. The
analysis appears to be based on simulation analysis and no evidence is provided of actual
returns or correlation. ING (2006), by contrast, portray infrastructure returns as low risk, low
return (pointing to low sensitivity to GDP growth and interest rate shocks) and suggest low
12

“hypothetical” correlation with equity (0.1 to 0.4), real estate (0.2 to 0.5) and bonds (-0.2 to
+0.2). No support or source for these numbers is provided. Hobbs (2006) similarly argues
that infrastructure has low volatility cashflows – but notes uncertainty in the capital value
component. Rakowski (2004), based on Australian evidence, suggests moderate risk and high
return.
Macquarie Bank produce a global index of listed companies investing in infrastructure. Data
were available from the end of 2000. In dollar terms, infrastructure firms outperformed
global stocks (measured by the Morgan Stanley MSCI index) and global bonds (Lehman
Brothers composite), but trailed REIT performance (GPR global). The volatility of the
infrastructure index was comparable to both REITs and general stocks. The data show
correlations of around 0.5 with stocks and REITs and close to zero with bonds6. On this
basis, the benefits of infrastructure in the portfolio seem less evident but caution is necessary.
The analysis period is short and possibly exceptional (encompassing the global stock market
correction) and the composition of firms in the Macquarie index and the extent to which their
returns are influenced by leverage is unknown. For the remainder of the report, we will focus
on “conventional” real estate assets, leaving issues of infrastructure investment to those with
more specific expertise.
6 We acknowledge the assistance of Gordon Drysdale, MSc student at the University of Reading, in providing
these data.
13

Section 2: Summary
Real estate is an under-researched asset class. Despite major improvements over the
last decade, research and analysis is hampered by poor data availability. Many
markets have only low frequency, short time series data;
The growth of specialist research and data provider services has greatly improved the
transparency of real estate markets in recent years;
There are no definitive figures for the size of the global commercial real estate market.
Estimates range from $8trillion to $22trillion. The low estimate represents around
16% of the capitalization of global equity markets, the high end, some 40%.
Pension fund investment in non-residential real estate varies around the world. U.S.
pension funds hold around 3.5% of their assets in property; the share in some other
major economies exceeds 10%.
There are now many routes to gaining exposure to real estate markets, with available
investment vehicles possessing distinct risk-return characteristics, market structures,
liquidity and transparency. These differences alter the impact of inclusion of real
estate in the mixed-asset portfolio.
Available means of gaining exposure include direct private market ownership and
development of investment property, private collective investment vehicles, open ended
and exchange traded unitized funds, listed real estate companies and REITs, property
derivatives, commercial mortgage backed securities and other debt vehicles.
Some commentators treat infrastructure investment as equivalent to real estate. There
are both similarities and differences. However, there is little formal analysis of risk
and return characteristics due to data deficiencies and the relative immaturity of the
infrastructure investment market.
The new investment vehicles and opportunities have brought new types of investors
into the commercial real estate market, with private capital and hedge funds playing
an increasingly significant role relative to traditional institutional investors.
14
3. Risk and Return in Real Estate Markets
In this section, we examine the investment characteristics of real estate investment, analyzing
risk and return for both direct property investment and investment in listed real estate
securities. We begin by examining data from three countries for which longer time series of
commercial real estate performance are available – Australia, the U.K. and the U.S. We then
examine published evidence on risk and return from the real estate literature. Much of that
research – driven by data availability – also covers the U.S. and U.K. markets. Where
possible, we cite evidence from a broader range of markets.
3.1 Empirical Analysis of Risk and Return
As a first step to discussing real estate risk and return, we have examined three countries
which possess reasonably long time series of direct private commercial real estate returns: the
United States (the NCREIF index), the United Kingdom (the IPD index) and Australia (the
IPD index, formerly the PCA index). We compare the returns from real estate in those
countries with returns from listed (indirect) real estate (Real Estate Investment Trusts – REITs
– in the U.S.; Listed Property Trusts – LPTs – from Australia and listed property companies
from the U.K.) and with returns from the two major asset classes, stocks and bonds. To
provide clearer information on long-run performance, we have deflated the returns using the
appropriate consumer price index for each country.
Before detailing the results, it is important to emphasize that the three national private real
estate indices have characteristics that distinguish them from measures of the other asset
classes. First, they are ungeared asset returns, while the returns for equity markets and listed
property are influenced by leverage. Second, they only represent a sub-set of investment
quality real estate in the respective countries. Third, and most important, the returns are based
on appraisals (valuations) of the real estate in each database, rather than on actual transactions
prices. This has important implications, discussed elsewhere in the report. In particular,
appraisal-based indices are assumed to be “smoothed” – both due to temporal aggregation
effects (the appraisals are spread around the reporting date) and due to appraiser behavior in
updating prior information7.
7 There may also be compositional changes in the indices over time. This is especially true in countries where
indices have been developed recently. In such countries, differences may arise as the coverage is improved. Also, indices will largely reflect the holdings of institutional investors. As these are likely to change over time, so will the composition of the index. It has been reported for instance that more weight is now placed on
15
This creates a moving average process that reduces the reported risk measures, creates lags in
responsiveness to information shocks and may distort correlation with other asset classes.
Evidence for this can be seen in the presence of serial correlation in the returns series
(apparently violating market efficiency assumptions), particularly for higher frequency data.
The U.S. NCREIF quarterly data are further distorted by a “stale appraisal” problem: many
properties are appraised only annually but are left in the quarterly analysis even where no
appraisal has occurred. This is not a problem for the U.K. and Australian indices, which only
consider buildings which have been valued in the relevant time period. Nonetheless, there is
likely to be an information effect where many more buildings are valued at year end or at the
end of the relevant tax year.
To counter the effects of smoothing, we have desmoothed the three series using standard
desmoothing techniques based on correction of the serial correlation in the real estate returns.
We report both the smoothed and desmoothed series. For the United States, a further source
of evidence comes from the MIT Transactions Based Index (TBI), an index estimated using a
repeat sales method from the NCREIF database. Although there are some questions about the
reliability of the methods used to correct for changes in the quality of buildings between
transactions (e.g. as a result of capital improvements), the TBI provides valuable evidence
about underlying risk in the private real estate market.
3.1.1. The United States
For the United States, the NCREIF8 and MIT Transactions Based indices are compared to the
NAREIT index of REIT returns, the MCSI USA index as a proxy for stock market returns and
an benchmark index of US Government 10 year Treasury bonds. The figure below shows real
quarterly return indices for the U.S. asset classes between 1985 and 2006. As can readily be
seen, stocks have produced much higher returns than the other asset classes and sectors,
despite the post-2000 correction.
larger properties in the IPD U.K. index. However, we do not expect these compositional changes to invalidate, nor influence in any significant way, the analyses which can be done using such indices.
8 The NCREIF index consists of properties acquired by tax-exempt institutions and held in a fiduciary environment. As at Q4 2006, the database consisted of 5,333 buildings with an appraised value of $247billion.
16

The three measures of private real estate markets track each other closely, while the listed
REIT sector produces stronger performance from the late 1990s.
Figure 3.1 U.S. Real Asset Returns 1985-2006
0.0
100.0
200.0
300.0
400.0
500.0
600.0
700.0
800.0
900.0
1000.0
Q4 1984
Q4 198
5
Q4 1986
Q4 1987
Q4 198
8
Q4 198
9
Q4 1990
Q4 1991
Q4 199
2
Q4 1993
Q4 1994
Q4 1995
Q4 1996
Q4 1997
Q4 1998
Q4 1999
Q4 2000
Q4 2001
Q4 2002
Q4 2003
Q4 2004
Q4 2005
NAREITNCREIFNCREIF desmoothedTBI EquitiesBonds
The mean quarterly real return for stocks over the 1985-2005 period was 2.6% (an annualized
real return of 10.9%). REITs produced an annualized return of around 8%, direct real estate
as measured by NCREIF, 5%, slightly lower than bonds over the period. Given the expected
risk-return trade-off, it would be expected that a ranking of the standard deviation of returns
should match that of the returns themselves. Stocks do have the highest standard deviation
(an annualized 16%), followed by REITs (14%) and Bonds (8%). However, the annualized
reported risk for the NCREIF index, at just 3.4%, seems far too low. Evidence that the series
is smoothed can be seen in the first order serial correlation coefficient – which implies that
almost half of the variation in return in any one quarter is explained by the return in the
previous period. Both the desmoothed series and the MIT transactions based index show
levels of risk that are more than double that of the NCREIF index, figures which seem closer
to intuition of the risk of commercial real estate as an asset class.
17

Figure 3.2 Descriptive Statistics, Quarterly Returns, U.S. Markets 1985-20059 Stocks Bonds REITs NCREIF Desmoothed TBI Arithmetic Mean 2.63% 1.33% 1.98% 1.23% 1.39% 1.54% Compound Growth 2.29% 1.25% 1.74% 1.22% 1.29% 1.47% Standard Deviation 8.17% 4.12% 6.97% 1.71% 4.36% 3.80% Skewness -0.5602 0.3737 0.2107 -1.278 -1.579 0.445 Serial Correlation -0.034 -0.2022 0.4011 0.705 0.359 0.066 3.1.2 The United Kingdom Quarterly returns for the U.K. direct market were estimated from the IPD monthly index. The
monthly index – a subset of the main database – does not perfectly proxy the IPD annual
index as there are some compositional differences, but provides the best sub-annual indicator
of the performance of U.K. investment-quality real estate10. Data are available from
December 1987. IPD returns are compared to the Financial Times all share index (as the best
measure of the overall performance of the U.K. stock market), the FT property index (which
measures the performance of the approximately 40 firms classified as real estate investment
holding or development companies on the London exchange) and an index of medium-dated
government bonds from the WM company. Returns were deflated using the all items retail
price index with mortgage costs removed (RPIX).
The real return series are plotted in the figure below. The stocks series shows the effect of the
dot.com boom and bust. In the boom period, property company returns lagged (prompting a
number of prominent property firms to be taken private in the late 1990s and early 2000s), to
subsequently recover sharply (aided by the declared intention to introduce a U.K. REIT,
implemented in January 2007). The recent real estate market boom has contributed to the
strong relative performance of private real estate.
9 Using the Jarque-Bera criterion, normality is rejected for all these series, with the exception of the NAREIT
series. This is largely as a result of positive kurtosis. The direct, private real estate series appear to be considerably “less normal” than the equity and bond series – for example, the TBI series has a Jarque-Bera statistic of 43.9, compared to 16.8 for bonds and 29.6 for stocks.
10 As at December 2006, the IPD monthly database contained 3,820 buildings with a capital value of £50.5billion. The IPD database as a whole covered 12,137 buildings with a capital value of £192billion – some 49% of the real estate assets of institutional investors and listed property companies.
18
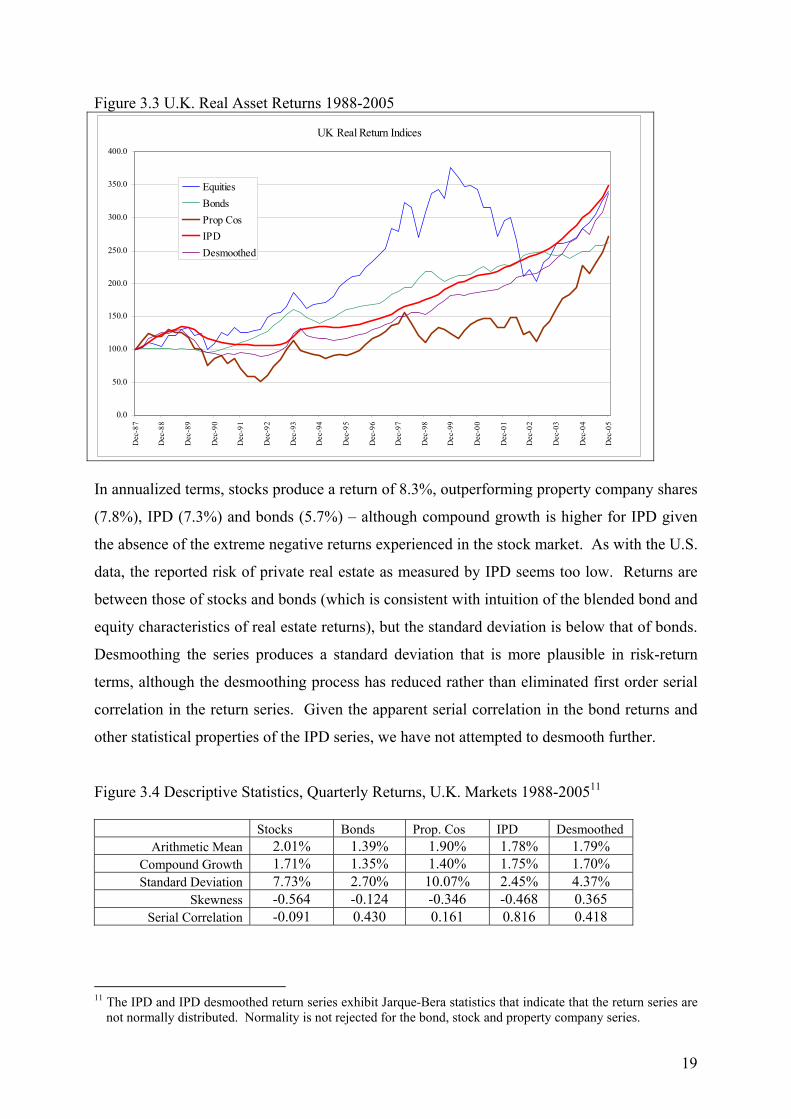
Figure 3.3 U.K. Real Asset Returns 1988-2005
UK Real Return Indices
0.0
50.0
100.0
150.0
200.0
250.0
300.0
350.0
400.0
Dec
-87
Dec
-88
Dec
-89
Dec
-90
Dec
-91
Dec
-92
Dec
-93
Dec
-94
Dec
-95
Dec
-96
Dec
-97
Dec
-98
Dec
-99
Dec
-00
Dec
-01
Dec
-02
Dec
-03
Dec
-04
Dec
-05
EquitiesBondsProp CosIPDDesmoothed
In annualized terms, stocks produce a return of 8.3%, outperforming property company shares
(7.8%), IPD (7.3%) and bonds (5.7%) – although compound growth is higher for IPD given
the absence of the extreme negative returns experienced in the stock market. As with the U.S.
data, the reported risk of private real estate as measured by IPD seems too low. Returns are
between those of stocks and bonds (which is consistent with intuition of the blended bond and
equity characteristics of real estate returns), but the standard deviation is below that of bonds.
Desmoothing the series produces a standard deviation that is more plausible in risk-return
terms, although the desmoothing process has reduced rather than eliminated first order serial
correlation in the return series. Given the apparent serial correlation in the bond returns and
other statistical properties of the IPD series, we have not attempted to desmooth further.
Figure 3.4 Descriptive Statistics, Quarterly Returns, U.K. Markets 1988-200511
Stocks Bonds Prop. Cos IPD Desmoothed Arithmetic Mean 2.01% 1.39% 1.90% 1.78% 1.79%
Compound Growth 1.71% 1.35% 1.40% 1.75% 1.70% Standard Deviation 7.73% 2.70% 10.07% 2.45% 4.37%
Skewness -0.564 -0.124 -0.346 -0.468 0.365 Serial Correlation -0.091 0.430 0.161 0.816 0.418
11 The IPD and IPD desmoothed return series exhibit Jarque-Bera statistics that indicate that the return series are
not normally distributed. Normality is not rejected for the bond, stock and property company series.
19
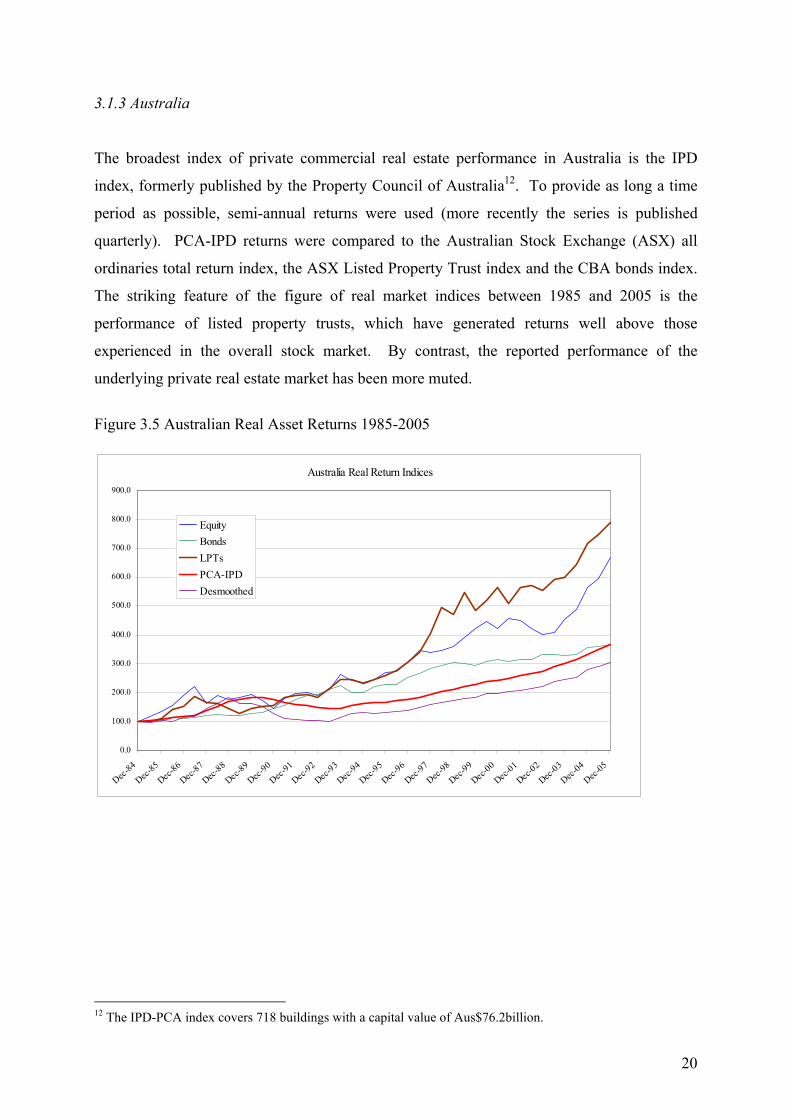
3.1.3 Australia
The broadest index of private commercial real estate performance in Australia is the IPD
index, formerly published by the Property Council of Australia12. To provide as long a time
period as possible, semi-annual returns were used (more recently the series is published
quarterly). PCA-IPD returns were compared to the Australian Stock Exchange (ASX) all
ordinaries total return index, the ASX Listed Property Trust index and the CBA bonds index.
The striking feature of the figure of real market indices between 1985 and 2005 is the
performance of listed property trusts, which have generated returns well above those
experienced in the overall stock market. By contrast, the reported performance of the
underlying private real estate market has been more muted.
Figure 3.5 Australian Real Asset Returns 1985-2005
Australia Real Return Indices
0.0
100.0
200.0
300.0
400.0
500.0
600.0
700.0
800.0
900.0
Dec-84
Dec-85
Dec-86
Dec-87
Dec-88
Dec-89
Dec-90
Dec-91
Dec-92
Dec-93
Dec-94
Dec-95
Dec-96
Dec-97
Dec-98
Dec-99
Dec-00
Dec-01
Dec-02
Dec-03
Dec-04
Dec-05
EquityBondsLPTsPCA-IPDDesmoothed
12 The IPD-PCA index covers 718 buildings with a capital value of Aus$76.2billion.
20

Figure 3.6 Descriptive Statistics Semi-annual Returns, Australian Markets 1985-200513 Stocks Bonds LPTs PCA-IPD Desmoothed
Mean 5.18% 3.23% 5.49% 3.21% 2.97% Compound Growth 4.63% 3.13% 5.04% 3.14% 2.69% Standard Deviation 10.59% 4.47% 9.88% 3.79% 7.65%
Skewness -0.694 -0.152 0.103 -0.258 0.119 Serial Correlation -0.032 0.072 -0.036 0.815 0.321
3.2 The Determinants of Real Estate Returns
Now that we have established how real estate returns fare in comparison to other asset classes,
it is important to review some main results from the literature on the determinants of real
estate returns, whether real estate returns are predictable and how real estate reacts to
inflation. Ling and Naranjo (1997) find that the growth rate in real per capita consumption,
the real T-bill rate, the term structure of interest rates, and unexpected inflation are
fundamental drivers that systematically affect real estate returns. Quan and Titman (1999)
find that real estate prices are influenced by GDP growth rates. Importantly, Mei and Lee
(1994) find that a real estate factor is useful in explaining direct real estate returns in addition
to stock and bond factors. The method which is used by Mei and Lee (1994) is a factor
analysis. They find that real estate loads highly on a factor which is not common to that of
stocks or bonds. This is the factor they name the ‘real estate factor’. This factor is thus a
statistical factor and no straightforward intuition can be given for it. The important
implication of their work is that real estate is linked to a factor other than those of financial
assets. Hence, an allocation to real estate would be warranted to get exposure to that factor.
Ling and Naranjo (1997, 1999) similarly find that a substantial component of real estate
returns can only be explained in relation to a unique real estate factor.
Real estate returns appear to be slightly more predictable than the returns on other asset
classes. Mei and Liu (1994) find that the level of predictability associated with real estate
leads to moderate success in market timing, this not being the case for other asset classes.
Chau et al. (2001) find that the level of predictability associated with real estate leads to
moderate success in market timing, although this is not necessarily the case for the other asset
classes examined in general. As always with real estate data, caution has to be exercised so
that the conclusions are not biased by the quality of inputs.
13 Normality is not rejected using the Jarque-Bera criterion, for any of these series. The PCA-IPD returns
(smoothed or unsmoothed) exhibit higher kurtosis than the public market series. Caution is necessary in interpreting these statistics given the low frequency time series employed in the analysis.
21

In researching the inflation hedging qualities of commercial (investment) real estate, a
distinction needs to be made between private and public assets. In both cases, there are
conceptual and data-related issues. For private real estate, researchers are forced to rely
largely on appraisal-based portfolio indices such as those provided by NCREIF in the U.S. or
IPD in the U.K., or on proxy series based on rental values and capitalization rates.
Securitized real estate returns are based on transactions; however, the delivered returns
depend, in addition to the performance of the underlying property assets, on the leverage of
firms and on management behavior. This last effect will depend on the structure of the firm,
with the high distribution requirements of REIT-like structures providing less flexibility for
management influence than, say, U.K. property company structures.
The results are mixed with early research tending to show real estate as a partial hedge
(Hartzell et al., 1987), while subsequent research has provided more equivocal results (Hoesli
et al., 1997). These results, however, are based on appraisal-based indices which are
influenced by appraiser behavior (for example, an appraiser might adjust a prior value to
reflect known inflation) and may be distorted by appraisal smoothing. Building on the
literature in financial economics, Hoesli et al. (2007 forthcoming) suggest that findings are
somewhat mixed due to the difficulty of distinguishing long run from short run impacts and
from the nature of transmission mechanisms. For this purpose, they use an error correction
mechanism approach that separately identifies long run relationships and short run adjustment
processes. Inflation is decomposed into anticipated and unexpected components, alongside a
number of real and monetary variables. U.S. and U.K. stock, small cap stock, public and
private real estate returns are examined for the period 1977-2003.
For U.S. markets, the long run models all include expected inflation with a significantly
positive coefficient indicating that property returns do act as a long-run inflation hedge. Real
GDP is positively linked to returns, while money supply is negatively linked to equity and
small cap returns but not to real estate returns. In all of the short run models, there is very
little evidence of short-term adjustment to changes in inflation (either anticipated or
unexpected). The error correction variable is positive, with slow adjustment – which provides
confirmation for the argument that short run analysis based on high frequency return data is
unlikely to detect hedging qualities of assets. Further analysis of the U.S. private market
results comparing the NCREIF results with the MIT transaction-based series suggest that the
ECM adjustment process is much faster for the transaction-based series.
22

Reaction to shock variables is otherwise broadly similar. However, over the shorter analysis
period (1984-2003), the sign on the coefficient for expected inflation in the private real estate
long run model turns from positive to negative, suggesting time-varying behavior, perhaps
linked to economic and monetary regimes. U.K. results are found to be similar to U.S. results
in many respects.
In summary, directly-owned real estate returns seem to act as a long-run hedge against
anticipated inflation, through the link to real economic variables affecting supply and demand.
However they do not appear to adjust quickly to changes in inflation – particularly where the
changes are unanticipated. In part, this may reflect measurement issues, in part, it may relate
to the impact of lease contracts that prevent the landlord adjusting the rent on a regular basis.
There does not appear to be any rigorous work analyzing real estate returns in markets where
lease contracts include inflation-index rental uplift clauses. Since real estate performance is
strongly influenced by (real) interest rates, the policy actions of monetary authorities in
response to upward pressure on inflation may provide a further factor driving short-run
divergence of property performance and inflation. Available data point to positive long-run
real returns14.
3.3 Real Estate Returns and Mean Reversion
The absence of long-run, high frequency time series for real estate markets means that it is not
feasible to test mean reversion in directly-owned, private property returns with any statistical
reliability. Tentative preliminary results have been produced. Real property cash flows per
unit space have been shown to be mean or trend reverting series in Australia (Hendershott,
1996), the U.S. (Wheaton and Torto, 1994) and the U.K. (Hendershott and MacGregor,
2005a). This appears to be intuitive. Surging real rents on newly written leases owing, for
example, to rising demand for space, should be partially reversing when existing tenants face
these higher rates at renewal. Moreover, higher real rents mean higher real property values
and thus increased development. The additional space, too, will act to reverse the initial rise
in real rents.
14 While stocks historically exhibit marginally higher long run real returns, this additional return comes at the
expense of higher volatility and lower short-run correlation between inflation and asset returns.
23

The results on whether real estate prices rationally reflect mean reversion are more mixed.
Hendershott (2000) and Hendershott and MacGregor (2005b) argue that Australian and U.S.
investors have not built the “obvious” mean reversion of real rents into their forecasts of real
rental growth (see also Hendershott et al., 2003). As a result, investors have overvalued
property at rental cyclical peaks and undervalued them at cyclical troughs. That is, investors
have behaved irrationally. The reverse conclusion is reached by Hendershott and MacGregor
(2005a) for the U.K. office and retail sectors. They demonstrate that their proxies for
expected real rental growth forecast future real growth and that capitalization rates reflect
rational expectations of mean reversion in future real cash flows. This latter result is
interesting as better quality data are used and also an error correction framework is utilized.
There is also some evidence in the literature pertaining to securitized real estate. Stevenson
(2002) concludes that there is no mean reversion using data from 11 markets for the period
1987-2000. His portfolio switching tests reveal price continuation on a short-term basis with
the winner portfolio significantly outperforming both the loser and contrarian portfolios. Liu
and Mei (1994) point to weaker mean reversion in listed real estate than in equity markets.
Using a VAR approach, they suggest that a significant proportion of unexplained real estate
risk relates to cash flow risk and that investors become apprehensive when there is good news
on cash flows, demanding higher returns – which might imply anticipating a cycle.
To examine the behavior in time of real property returns we again use data for the U.S., U.K.
and Australia. The nest two figures below show the NCREIF and TBI real returns each with a
linear trend line superimposed. Two features are apparent: first, the presence of distinct, if
erratic, cycles, particularly with the NCREIF and, second, the apparent upward trending
returns (although the slope is not statistically significant). This may result from the sample
period and the incomplete recent cycle, but may also reflect the yield compression that has
followed from the fall in inflation and the glut of savings in the global economy.
24

Figure 3.7 U.S. Real Returns: NCREIF and Trend
Real Returns: NCREIF
-8.00%
-6.00%
-4.00%
-2.00%
0.00%
2.00%
4.00%
6.00%
1985 Q
1
1986 Q
1
1987 Q
1
1988 Q
1
1989 Q
1
1990 Q
1
1991 Q
1
1992 Q
1
1993 Q
1
1994 Q
1
1995 Q
1
1996 Q
1
1997 Q
1
1998 Q
1
1999 Q
1
2000 Q
1
2001 Q
1
2002 Q
1
2003 Q
1
2004 Q
1
2005 Q
1
Figure 3.8 U.S. Real Returns: TBI and Trend
Real Returns: MIT Transactions Based Index
-10.00%
-5.00%
0.00%
5.00%
10.00%
15.00%
20.00%
1985
Q1
1986
Q1
1987
Q1
1988
Q1
1989
Q1
1990
Q1
1991
Q1
1992
Q1
1993
Q1
1994
Q1
1995
Q1
1996
Q1
1997
Q1
1998
Q1
1999
Q1
2000
Q1
2001
Q1
2002
Q1
2003
Q1
2004
Q1
2005
Q1
25
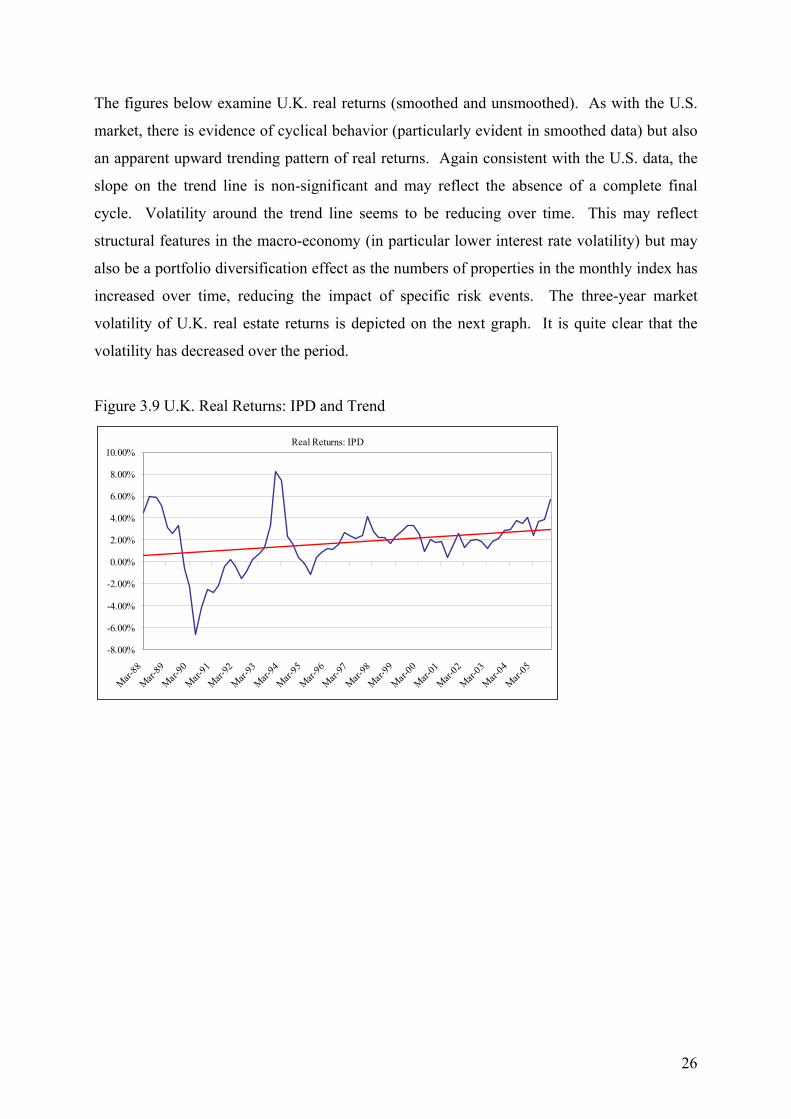
The figures below examine U.K. real returns (smoothed and unsmoothed). As with the U.S.
market, there is evidence of cyclical behavior (particularly evident in smoothed data) but also
an apparent upward trending pattern of real returns. Again consistent with the U.S. data, the
slope on the trend line is non-significant and may reflect the absence of a complete final
cycle. Volatility around the trend line seems to be reducing over time. This may reflect
structural features in the macro-economy (in particular lower interest rate volatility) but may
also be a portfolio diversification effect as the numbers of properties in the monthly index has
increased over time, reducing the impact of specific risk events. The three-year market
volatility of U.K. real estate returns is depicted on the next graph. It is quite clear that the
volatility has decreased over the period.
Figure 3.9 U.K. Real Returns: IPD and Trend
Real Returns: IPD
-8.00%
-6.00%
-4.00%
-2.00%
0.00%
2.00%
4.00%
6.00%
8.00%
10.00%
Mar-88
Mar-89
Mar-90
Mar-91
Mar-92
Mar-93
Mar-94
Mar-95
Mar-96
Mar-97
Mar-98
Mar-99
Mar-00
Mar-01
Mar-02
Mar-03
Mar-04
Mar-05
26
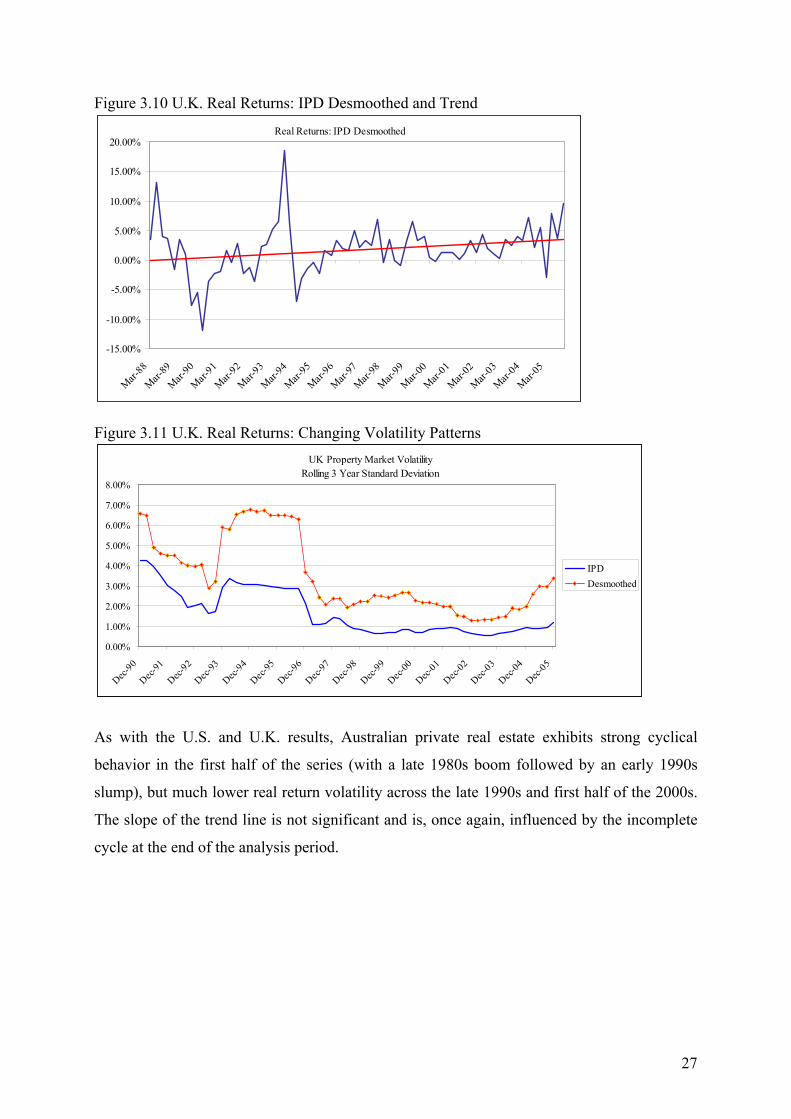
Figure 3.10 U.K. Real Returns: IPD Desmoothed and Trend
Real Returns: IPD Desmoothed
-15.00%
-10.00%
-5.00%
0.00%
5.00%
10.00%
15.00%
20.00%
Mar-88
Mar-89
Mar-90
Mar-91
Mar-92
Mar-93
Mar-94
Mar-95
Mar-96
Mar-97
Mar-98
Mar-99
Mar-00
Mar-01
Mar-02
Mar-03
Mar-04
Mar-05
Figure 3.11 U.K. Real Returns: Changing Volatility Patterns
UK Property Market VolatilityRolling 3 Year Standard Deviation
0.00%
1.00%
2.00%
3.00%
4.00%
5.00%
6.00%
7.00%
8.00%
Dec-90
Dec-91
Dec-92
Dec-93
Dec-94
Dec-95
Dec-96
Dec-97
Dec-98
Dec-99
Dec-00
Dec-01
Dec-02
Dec-03
Dec-04
Dec-05
IPDDesmoothed
As with the U.S. and U.K. results, Australian private real estate exhibits strong cyclical
behavior in the first half of the series (with a late 1980s boom followed by an early 1990s
slump), but much lower real return volatility across the late 1990s and first half of the 2000s.
The slope of the trend line is not significant and is, once again, influenced by the incomplete
cycle at the end of the analysis period.
27
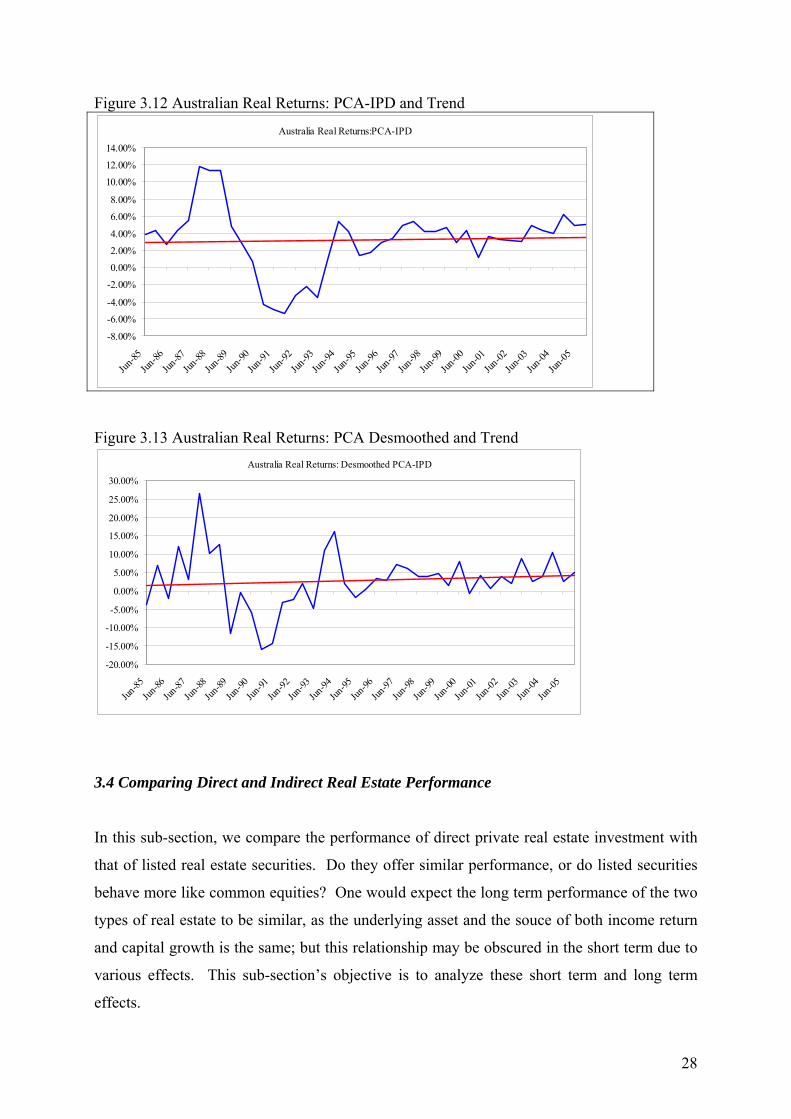
Figure 3.12 Australian Real Returns: PCA-IPD and Trend
Australia Real Returns:PCA-IPD
-8.00%
-6.00%
-4.00%
-2.00%
0.00%
2.00%
4.00%
6.00%
8.00%
10.00%
12.00%
14.00%
Jun-85
Jun-86
Jun-87
Jun-88
Jun-89
Jun-90
Jun-91
Jun-92
Jun-93
Jun-94
Jun-95
Jun-96
Jun-97
Jun-98
Jun-99
Jun-00
Jun-01
Jun-02
Jun-03
Jun-04
Jun-05
Figure 3.13 Australian Real Returns: PCA Desmoothed and Trend
Australia Real Returns: Desmoothed PCA-IPD
-20.00%
-15.00%
-10.00%
-5.00%
0.00%
5.00%
10.00%
15.00%
20.00%
25.00%
30.00%
Jun-85
Jun-86
Jun-87
Jun-88
Jun-89
Jun-90
Jun-91
Jun-92
Jun-93
Jun-94
Jun-95
Jun-96
Jun-97
Jun-98
Jun-99
Jun-00
Jun-01
Jun-02
Jun-03
Jun-04
Jun-05
3.4 Comparing Direct and Indirect Real Estate Performance
In this sub-section, we compare the performance of direct private real estate investment with
that of listed real estate securities. Do they offer similar performance, or do listed securities
behave more like common equities? One would expect the long term performance of the two
types of real estate to be similar, as the underlying asset and the souce of both income return
and capital growth is the same; but this relationship may be obscured in the short term due to
various effects. This sub-section’s objective is to analyze these short term and long term
effects.
28

Drawing on the data for the three markets discussed above, we are able to calculate
correlation coefficients between institutional quality real estate returns and the listed property
sector performance. We limit our discussion to the correlation between direct and indirect
real estate (highlighted in the tables) - the correlations of real estate with other financial
assets are discussed in Section 5. We then review evidence from the literature on the
relationship between the private and public markets.
3.4.1 Correlation in the Three Markets
The correlation between U.S. REITs and private real estate markets is very low. The
correlation between REIT and equity returns, at 0.42, is higher than that between REITs and
the MIT transaction based index (TBI). Given that REITs are untaxed real estate entities with
a high distribution requirement and relatively modest leverage, this must lead to some concern
as to the quality of information in the private market indices. In part, this seems to result from
lags in processing information in the private market. The correlations increase if the NAREIT
index is lagged – comparing NAREIT lagged two quarters to the TBI (that is, comparing
NAREIT Q1 with TBI Q3) produces a correlation of 0.33, suggesting information processed
in the public markets filters out slowly to the private market (further evidence on this issue is
reported below).
Figure 3.14 Contemporaneous Correlation, U.S. Markets 1985-200515
Stocks Bonds REITs NCREIF Desmoothed TBI Stocks 1.000 Bonds -0.054 1.000 REITs 0.428 0.158 1.000 NCREIF 0.042 -0.017 0.041 1.000 Desmoothed -0.016 -0.097 0.136 0.767 1.000 TBI 0.184 0.010 0.181 0.488 0.479 1.000
U.K. property company share returns exhibit a strong positive correlation with the stock
market (with over 40% of the variation in property company returns explained by movements
in the stock market index) and a weaker positive correlation with the IPD index, which
strengthens with desmoothing.
15 The correlation between stocks and REITs is significantly positive at the 95% level, while the correlation
between REITs and direct real estate is not statistically distinguishable from zero. The latter result holds with raw and desmoothed appraisal-based returns, and also with TBI returns.
29

The stronger stock market – property company correlation compared to the correlation
between REITs and stocks observed in the U.S. may be attributed to the status of property
companies as taxable entities with the right to retain and reinvest earnings (unlike REITs) and
to the fact that a significant number of property companies are ranked highly by market
capitalization and hence may well feature in index-tracking portfolios.
Figure 3.15 Contemporaneous Correlation, U.K. Markets 1988-200516 Stocks Bonds Prop Cos IPD Desmoothed
Stocks 1.000 Bonds 0.113 1.000 Prop Cos 0.641 0.119 1.000 IPD 0.116 -0.014 0.277 1.000 Desmoothed 0.159 0.209 0.391 0.772 1.000
The impact of smoothing on correlation structures can be seen by examining the lag structures
between property company and IPD returns. The contemporaneous correlation coefficient is
0.21. This increases to 0.51 lagging the property company returns two quarters, with positive
correlations persisting for four quarters. Desmoothing the series reduces this lag effect: the
correlation peaks at a one quarter lag and falls sharply. This is consistent with the price
discovery effects discussed below, although it is important to note that transaction costs and
illiquidity constrain the ability to exploit these timing differences in the processing of
information between public and private markets.
In Australia, the divergence between the reported performance of Listed Property Trusts
(LPTs) and private real estate is an important indicator of the difference between the return
generating processes in public and private markets. LPTs have been extremely successful in
attracting capital, both retail and professional/institutional. Some estimates suggest that LPTs
own over 50% of investment grade real estate in Australia (and this high level of domestic
ownership has prompted many LPTs to seek international real estate opportunities). LPTs,
like REITs, have constraints on activity and gearing and a high distribution requirement.
Nonetheless, the risk-return behavior in the public and private markets is quite distinct, with
LPTs exhibiting volatility similar to the all equity index and high returns, while the IPD-PCA
measure shows returns and risk similar to bonds.
16 The 95% confidence interval for the correlation between stock and property company returns is [0.48; 0.76].
The correlation between property company and direct real estate returns is also statistically different from zero, but the confidence intervals are much closer to zero. When real estate returns are desmoothed, for instance, the interval is [0.18; 0.57].
30

The correlation between LPT returns and IPD-PCA returns is negative (and is only weakly
positive with LPT returns lagged one year). Desmoothing the IPD-PCA series proved
difficult. The model utilized results in a doubling of the risk measure (comparable to the U.S.
and U.K. results), but does little to improve the correlation between listed and private markets
(the contemporaneous correlation remains negative, but the correlation with LPTs lagged six
months is positive with a correlation of 0.31).
Figure 3.16 Contemporaneous Correlation, Australian Markets 1985-2005 Stocks Bonds LPTs PCA-IPD Desmoothed
Stocks 1.000 Bonds 0.164 1.000 LPTs 0.459 0.401 1.000 PCA-IPD -0.106 -0.455 -0.228 1.000 Desmoothed -0.117 -0.392 -0.154 0.734 1.000
3.4.2 Evidence from the Literature
Three streams of the literature appear important on the topic of the behavior of indirect and
direct real estate. These are (1) whether indirect and direct real estate returns are driven by
the same factors, (2) whether the two markets are integrated and (3) if there is information
transmission between the securitized market and the direct market (so-called price discovery).
These topics are of course linked in many ways. For two asset classes to be integrated, for
instance, the same risk factors have to be priced identically on both markets. Also, it could be
that some common factors drive both direct and indirect returns but that these factors have a
faster impact on the indirect market given the greater liquidity of that market. This would
then mean that the indirect market leads the direct market leading to price discovery effects.
Concerning the return determinants, Mei and Lee (1994) find evidence that equity REITs and
the Russell-NCREIF index are driven by the same underlying real estate factor. Clayton and
MacKinnon (2003) investigate the relative impact of stock, bond and real estate factors in
explaining REIT returns in the U.S. They find that the REIT market went from being driven
largely by the same economic factors that drive large cap stocks through the 1970s and 1980s
to being more strongly related to both small cap stock and real estate-related factors in the
1990s. Hoesli and Serrano (2007) provide international evidence on this issue. They find
securitized real estate returns to be positively associated with stock and direct real estate
31

returns, but negatively related to bond returns. Financial assets contribute greatly to the
variance of securitized real estate, while the impact of direct real estate is limited. Chan et al.
(2005) claim that the change in REIT structure and the increase in institutional participation in
the REIT market in the 1990s make REIT stocks behave more like other equities in the stock
market.
This stream of research leads into the integration issue between real estate and stock markets.
For the U.S., Ling and Naranjo (1999) find that the direct real estate market and the stock
market are segmented, while the indirect market and the stock market are integrated. Liu et
al. (1990) find preliminary evidence for the segmentation of real estate and stock markets in
the U.S. For Singapore, Sing (2004) does not find any evidence of the integration of direct
and indirect markets. Li and Wang (1995) find that REITs and stocks are integrated.
Glascock et al. (2000) find that REIT returns are co-integrated with bond returns prior to
1992, but not thereafter. They also find that REITs and direct real estate are co-integrated.
Pagliari et al. (2005) control for property-type mix, leverage and appraisal smoothing and find
that the mean and volatility of the two types of real estate (direct and indirect) are not
different from a statistical perspective. Finally, Bond and Hwang (2003) report that the nature
of the fundamental volatility process underlying the securitized and unsecuritized commercial
real estate markets is the same. This means that once the impact of noise on the volatility of
both series is controlled for, both direct and indirect real estate exhibit a similar volatility
process.
Barkham and Geltner (1995) find that price discovery occurs in U.S. and U.K. securitized
markets, and that this information does not transmit to the direct market for a year or more17.
This phenomenon is observed in other markets. Myer and Webb (1993) find that equity REIT
index returns Granger cause unsecuritized real estate returns18. However, Chau et al. (2001)
show that the returns to securitized real estate in Hong Kong are a mirror of broader
international capital market movements. Once international capital market variables are
included in the regressions, the returns to securitized real estate in Hong Kong convey little
information about the appraisal-based returns to Hong Kong real estate.
17 For a thorough discussion on price discovery, see Geltner et al. (2003). 18 Granger causality is a technique for determining whether one time series is useful in forecasting another. It
does not imply any economic link between two series, but merely a statistical relationship – that one series exhibits changes (e.g. price movements) in advance of the other.
32

It should be stressed that the lags observed in processing price-sensitive information in the
private markets do not prove a violation of market efficiency. Illiquidity, high transaction
costs and tracking errors between individual portfolios and market indices make profitable
exploitation of such observed lags near impossible in the direct private market.
3.5 Property Market Liquidity
In examining the qualities of real estate as an investment asset, “illiquidity” is a much cited
disadvantage. Institutional, professional and private investors express concern at the lack of
liquidity or require higher returns in compensation. Much of the justification for real estate
investment vehicles - such as REITs – comes from their ability to enhance liquidity.
Surprisingly, there has been very little research into such a key concept. Liquidity is a
complex, multi-dimensional concept, which captures much more than the time taken to
execute a trade. Liquidity also includes:
o the costs, direct and indirect, of trading;
o risk and uncertainty concerning the timing of the sale;
o risk and uncertainty concerning the achieved sale price;
o trading volume and frequency; and
o the price impacts of the act of sale and purchase.
The importance of these dimensions of liquidity will vary across asset classes and, within
property, by type of building, sector and location. Importance will also vary according to
market conditions. It is, thus, not possible to have a single, portmanteau definition of liquidity
(for a more detailed discussion, see Lizieri and Bond, 2004). Investors will be concerned
about liquidity both because of the additional ex ante uncertainty and because of potential
difficulties in realizing values quickly in order to meet unexpected liabilities. Since most
investors face such risks, then it is reasonable to expect a premium19 for the asset class.
Investors with long term horizons and low liability risk might benefit from such a premium.
19 An analogy might be the return premium that is frequently found for small capitalization stocks: many
researchers attribute this in part to the problems that an investor would face executing a block trade in the absence of an actively traded market.
33

In bond and stock market literature, the emphasis is on pricing impacts of trading. Five main
aspects of liquidity are used to characterize markets: the cost of liquidating a portfolio
quickly; the ability to sell without affecting prices; the ability of prices to recover from
shocks; the costs of selling now rather than waiting; and transaction costs - the direct and
indirect costs of trading. These apply largely to public traded markets where depth and the
presence of market makers ensure that adjustment to supply and demand occur through the
price mechanism. Real estate’s high transaction costs drive longer holding periods (which,
may also lead to sub-optimal portfolio allocations). Given thin trading, a fund attempting to
sell out of property may suffer losses due to forced sale values. Large investors shifting their
real estate weightings may influence prices. Real estate prices are sticky and change slowly.
A major difference in direct (private) real estate markets, however, is that adjustments to
changes in supply and demand occur as much through transactions volume and time to trade
as through shifts in values and prices. The figure below (taken from the Investment Property
Forum’s liquidity research project, Bond et al., 2004) shows the variation in turnover rate in
the U.K. commercial real estate market, as measured by IPD, and the wider real estate market
based on Office for National Statistics data for 1987-2002 illustrating the variability in
transactions activity. Fisher et al. (2003) report similar pro-cyclical variation in the U.S.
commercial real estate market. They report that the turnover in the NCREIF database was
4.5% in 1992 at the bottom of the cycle, while it was 17.9% in 1997 during the upsurge prior
to the subsequent peak.
Figure 3.17 Turnover Rate, U.K. Investment Property, 1987-2002
0
5
10
15
20
25
1987 1988 1989 1990 1991 1992 1993 1994 1995 1996 1997 1998 1999 2000 2001 2002
IPD Turnover Rate %ONS Turnover Rate %
34
The ability to enter and exit the real estate market depends on how long it takes to buy or sell.
Crosby and McAllister (2004) examined the sales process analysis for 200 sales records from
major professional U.K. real estate investors. They found considerable variation in the time
taken from the decision to sell to final completion and receipt of proceeds. The average time
from initial decision to completion was some ten months, with the mean time from formal
marketing to sale averaging over six months. These averages hide considerable variation in
time on the market. The distribution of times to sale was heavily skewed, with a small
number of sales taking a very long time. Moreover, the funds examined tended to “filter”
properties considered unsuitable for sale, biasing the averages downwards.
Bond et al. (2007 forthcoming) develop work by Bond and Hwang (2004) and Lin and
Vandell (2006) that contrasts reported ex post returns from real estate with the ex ante risk of
investing in real estate. The rationale for their analysis is that there is an additional source of
risk that is related to uncertainty as to time on the market (that is, the time from the decision
to sell an asset through price agreement to exchange and completion of the transaction).
Given price volatility over this time on the market, there will be an additional source of risk.
For liquid markets (such as stock markets), the additional risk will be trivial. For asset
markets with an uncertain (and potentially lengthy) time on the market, there may be a
significant additional ex ante risk facing a potential investor.
Making assumptions about the distribution of returns and times to sale based on the empirical
evidence reported in Crosby and McAllister (2004), Bond et al. attempt to calibrate the
impact of marketing uncertainty and illiquidity. They produce a table of “Marketing Period
Risk Factors” which, for different holding periods and average times on the market, estimate
the total variance including ex ante risk. Taking the Collett et al. (2003) estimate of an
average institutional real estate holding period of seven years and the Crosby and McAllister
(2004) estimate of an average six months time to sale, the multiple of the variance is shown to
be 1.384. Applying this to the U.K. risk measure reported above increases the reported
(annualized) risk from 4.90% to 5.72%. Depending on risk return preference, this suggests a
risk premium of 50-100 basis points, given these assumptions. It should be stressed that this
reflects only the uncertain time taken to market and sell the property. Other liquidity-related
risks include difficulties faced in realizing asset value to meet liabilities and the dangers of
significant asset sales (or acquisitions) causing price effects in thinly-traded markets.
35

Other analyses have rather subtracted an illiquidity premium from the average return on real
estate. Such premium is typically measured as the difference between the observed return on
real estate and the “normal” return measured in an equilibrium model.
Bond et al. also observe that combining properties into a portfolio rapidly diversifies away the
single asset ex ante risk. They also suggest that applying the model to desmoothed real estate
returns results in lower risk factors (suggesting some sort of interaction with the ex ante risk,
marketing period and the appraisal smoothing process). Finally, as a note of caution, it should
be stressed that time on the market and uncertainty of time to sale are time varying. As Fisher
et al. (2003) note, marketing period times are often much longer in down markets (and shorter
in up markets). This may lead the Bond et al. results to understate the actual number of
properties required to achieve diversification of marketing period risk and the potential risks
faced by investors entering the market.
It is important too to consider the typical holding period of commercial real estate assets.
Real estate, characterized as an asset class with high round-trip transaction costs, thin trading
and information asymmetries, might be expected to exhibit different patterns of holding
periods compared to more liquid assets traded in public market places. Collett et al. (2003)
analyze holding periods of commercial real estate in the U.K. using the IPD database. They
report falling holding periods from about 12 years in the early 1980s to less than eight years at
the end of the 1990s. The holding period is also found to vary by property type. For the U.S.,
Fisher and Young (2000) report an average holding period just shy of 10 years for NCREIF
properties sold in 1999 and 2000. The holding period is substantially shorter for apartment
buildings (6.2 years) than for retail properties (12.1 years).
36

Section 3: Summary
Analysis of risk and return is hampered by short time series. However, longer and
more robust time series exist for Australia, the United Kingdom and the United States.
These can be used to provide a benchmark for consideration of real estate risk and
return.
Available commercial real estate market performance indicators are based not on
transactions but on appraisals (valuations). This is believed to result in a
“smoothing” or moving average process which understates risk. It is thus important
to address the smoothing issue when comparing real estate returns with other asset
classes.
Over the last twenty years in the United States, Equities generate real annualized
returns of around 11%, listed Real Estate Investment Trusts 8% and Bonds and
Private Real Estate around 5%. However, the reported risk of real estate (at around
3%) is far lower than bonds (8%), REITs (14%) and stocks (16%). Correcting for
appraisal smoothing produces a higher estimate of risk, of around 8%.
Analysis of the risk-return performance of different asset classes in Australia and the
U.K. produces similar results to those of the United States. In Australia, Listed
Property Trusts have outperformed the equity market and exhibit both higher returns
and greater volatility than directly-held private real estate.
In the U.K., listed Property Companies produce similar returns to the equity market
but are more risky. Private real estate returns are higher than bonds; the smoothed
risk measure is lower than for bonds, but desmoothing produces a higher risk
estimate, closer to that expected in a risk-return framework. The desmoothed risk
measure is still significantly below that of property companies.
Multi-factor approaches have attempted to identify factors that determine real estate
returns. Most studies find that macro-economic variables (GDP, industrial output,
consumption/spending) and financial variables (real interest rates and term structure)
are important factors. However, many studies detect a unique, priced, real estate
factor, making a case for inclusion of real estate in the mixed-asset portfolio.
37

The evidence on the inflation hedging properties of real estate is mixed. Generally,
real estate appears to be a partial hedge. It has long-run hedging qualities, but does
not adjust quickly to inflation shocks. This might be related to the constraints of lease
contracts (which delay rental adjustment) or to interest rate sensitivity and the
interaction between inflation increases and intervention by monetary authorities.
The available time series data are too short and too low frequency to permit reliable
testing of mean reversion in private real estate markets. There are observable, but
irregular, cycles of high and low returns around trend lines. Evidence on the
behavior of listed real estate securities points to weak mean reversion.
Listed real estate typically exhibits low contemporaneous correlation with direct
private real estate indices – which, alongside the higher volatility, has led some to
question whether or not real estate securities are a property investment. In many
markets, listed property returns exhibit strong positive correlations with the general
equity market.
The low correlations may be misleading. Listed real estate firms make use of debt, so
the returns should be deleveraged. Direct market returns should be desmoothed to
reduce valuation smoothing effects. This results in higher correlations and there is
evidence of long-run integration of public and private real estate returns.
Furthermore, a “price discovery” effect can be observed, with information in the
listed real estate market processed and priced well in advance of price movements in
the private market. Again desmoothing reduces this lag effect.
Illiquidity is a significant issue in private real estate markets. The high value and
indivisibility of real estate, high transaction costs and the lengthy and uncertain time
taken to sell assets produces additional risk for investors. It is hard to quantify this
additional risk. Research points to a 50-100 basis point premium for typical holding
periods and market volatility.
38
4. The Distribution of Real Estate Returns and Measurement Issues
In this brief section, we review the literature on real estate return distributions and highlight
some key measurement problems in real estate markets – notably the issue of valuation or
appraisal smoothing in private real estate markets. Many portfolio allocation and
performance measurement models used in finance implicitly assume normal or log-normal
returns. The available evidence suggests that this is not a sound assumption in real estate
markets – a finding which suggests that careful consideration is needed in the choice of risk
measures. The earlier analyses of real estate returns utilized desmoothed real estate returns.
This section explores the problems of index construction, the dampening of reported risk
measures and the potential distortion of correlation measures between asset markets that result
from the use of appraisal-based indices.
4.1 Return distributions
Myer and Webb (1993) found evidence of non-normality in terms of both skewness and
kurtosis; Lizieri and Ward (2000) find that monthly data are non-normal, while quarterly data
are normal (see also Brown and Matysiak, 2000b). Maurer et al. (2004) compare the
distributional properties of U.S., U.K., and German direct real estate returns. Using quarterly
data, they find that U.K. returns are normal, but not U.S. and German returns. For German
data, normality is rejected due to significant positive skewness, while the U.S. data could not
be classified as normal due to significant negative skewness and leptokurtosis. Once the data
were desmoothed, the results changed with normality being accepted for Germany, but
rejected for the U.K. and the U.S. data. Nonetheless, when annual data were used, the
assumption of normality could not be rejected for any country, either using the appraisal-
based or desmoothed data. Other authors, however, do reject normality at annual frequency.
As noted above, in the U.S., directly-held real estate appears to be less normal than other asset
classes, while in the U.K. normality is rejected for the IPD-based series but not for the public
asset classes. Various attempts have been made to find a suitable return distribution for real
estate returns. Lizieri and Ward (2000) find that the most appropriate distribution appears to
be the logistic distribution, but that even this is rejected in most cases; Bond et al. (2007
forthcoming) use a negative exponential distribution to model volatility in the marketing
period. Young et al. (2006) decisively reject normality for private U.K. real estate returns.
39
They also find that the characteristics of return distributions – including skewness – are time-
varying. Similar findings emerge for U.S. real estate returns – see, for example, Young and
Graff (1995); Chen (2005); or Young (2007 forthcoming), and for Australia (Graff et al.,
1997).
There is also some evidence of non-linearity and asymmetry in the behavior of real estate
returns. Both Lizieri et al. (1998) and Maitland-Smith & Brooks (1999) obtain results that
suggest there are distinct “return regimes” in which return processes vary. Lizieri et al. use a
threshold autoregressive model conditioned on real interest rates to show that volatility
increases sharply in high real interest rate environments compared to low real interest
regimes. In the former, returns trend downwards sharply; in the latter there is a more erratic
upward movement. Maitland-Smith and Brooks use a Markov switching model that implies
periods of quite distinct performance in terms of returns and, in particular, of volatility. These
results have implications for performance benchmarking and for the assessment of asset risk.
Okunev and Wilson (1997) use non-linear statistical techniques to suggest that the REIT
market and the general equity market are partially integrated but that, with weak mean
reversion, differences may persist, providing diversification benefits.
These characteristics of asset behavior have led to suggestions that portfolio allocation models
including real estate should use a risk measure other than (or in addition to) the variance.
Thus Byrne and Lee (1997) propose use of a mean absolute deviation risk measure, Hamelink
and Hoesli (2004a) use a maximum drawdown function and others have suggested a semi-
variance measure (for example Bond and Patel, 2003). The literature, however, has not
considered explicitly whether diversification benefits are uniform across the distribution.
Knight et al. (2005) report preliminary evidence that both global and U.K. real estate stocks
exhibit tail dependence with common equities – that is, that there are correlations in the
presence of extreme events. The results for the U.K. in particular suggest that correlations are
strongest in the negative tail – i.e. that diversification is absent when it is needed most.
Similarly, Liu and Mei (1998) observe that international real estate stocks show a higher
correlation with U.S. stocks when U.S. markets are performing badly.
40

4.2. Desmoothing
Using real estate data is not straightforward as it is usually acknowledged that appraisal-based
real estate indices are smoothed, i.e. that there is significant serial correlation in returns20.
Some authors have suggested that this results from appraisers using weighted averages of the
contemporaneous information set and historical appraisals (see e.g. Geltner et al., 2003).
Such behavior has been documented empirically. The results by Diaz and Wolverton (1998),
for instance, support the hypothesis of insufficient adjustment from previous value judgments.
Also, Clayton et al. (2001) find evidence that appraisers valuing the same property in
consecutive periods anchor onto their previous appraised values. Transaction-based indices
have also been shown to exhibit greater volatility and less lagging than appraisal-based
indices (Fisher et al., 1999; Fisher et al., 2003). Smoothing will predominantly lead real
estate indices to underestimate the volatility of real estate returns (see also Edelstein and
Quan, 2006), although it may marginally impact on the correlation between real estate returns
and the returns on other asset classes as well.
Several desmoothing approaches have been suggested. There is no clear consensus on what
approach should be used, but two methods have been widely used in the literature. The first
approach assumes that real estate markets are fully efficient, and hence that real estate returns
should not exhibit any serial correlation. “True” real estate returns are recovered as follows:
αα−−= −
1*1
*ttu
trrr
where is the desmoothed return in period t, is the smoothed return in period t, α is the
first order serial correlation coefficient, and is the smoothed return during the previous
period. An alternative desmoothing method which has been widely used is that devised by
Geltner (1993), which applies a similar reverse filtering model (see also Cho et al., 2003).
The appealing property of this model is that it does not assume that the real estate market is
efficient, and hence does not get rid of all serial correlation. It does require, however, that
some assumption be made regarding the standard deviation of real estate.
utr *tr
*1−tr
20 See Brown and Matysiak (2000a; 2000b, chapter 12); Geltner et al. (2003); Geltner et al. (2007, chapter 25).
41
The common assumption is to assume that real estate’s volatility is one half that of stocks
(Geltner, 1993; Corgel and deRoos, 1999). An alternative to this is to consider a target serial
correlation level or to assume a priori a value for α. There have also been attempts to use a
time-varying desmoothing parameter (see e.g. Brown and Matysiak, 2000b).
Although there is overwhelming support for smoothing in appraisal-based real estate returns,
the smoothing assumption has been challenged by some authors. Lai and Wang (1998) argue
that much of the smoothing literature starts from an assumption that smoothing exists. They
argue that the favorable risk-adjusted returns observed for real estate can be explained much
more by the fact that investors need to be compensated for the illiquidity and high information
costs, than by the fact that the data are noisy. They analyze each of the smoothing arguments,
and conclude that the variance of real estate returns can in fact be less than the variance of
appraisal-based returns (empirical evidence of this is found e.g. in Webb et al., 1992).
4.3 Leverage and Real Estate Returns
The returns reported in private real estate market performance indices not only rely on
appraisal-based data, they also represent unleveraged asset returns. However, most private
funds and listed real estate companies utilize debt alongside equity in acquiring asset
portfolios. This clearly creates problems of comparison. Use of debt increases the potential
volatility of equity returns and exposes investors to additional interest rate risk (which is
generally assumed to be priced as a systematic risk factor). In the absence of tax shield
effects or a relationship between loan-to-value ratio and debt costs, the risk return trade-off
will be broadly linear. Figure 4.1 below shows risk-return for U.K. (IPD) real estate returns,
based on a one year holding period, a cost of debt equivalent to LIBOR + 110bp and different
debt/value ratios from 0% to 80%. The first panel shows the implied return (based on the
standard Modigliani-Miller decomposition), the second the “ex post” delivered return. In
both cases, risk and return are linked in a linear relationship with both increasing as the
proportion of debt rises. Tyrell (2007) points out that, in practice, higher loan-to-value ratios
(particularly at project level) are generally accompanied by higher costs of debt – due to
higher margins and arrangement fees, from the use of mezzanine finance for the “top slice” of
debt or the cost for insurance, guarantees and additional security. He suggests that this results
in a curve in the risk-return relationship at higher proportions of debt.
42

Figure 4.1 The Impact of Gearing
Implied Geared Return
11.50%
12.00%
12.50%
13.00%
13.50%
14.00%
5.00% 7.50% 10.00% 12.50% 15.00%
Risk
Ret
urn
Ex Post Geared Return
10.00%
12.00%
14.00%
16.00%
18.00%
20.00%
22.00%
24.00%
26.00%
0.00% 10.00% 20.00% 30.00% 40.00% 50.00% 60.00%Risk
Ret
urn
Real estate practitioners often argue that theoretical models of the additional risk from gearing
are misplaced and that leverage enhances returns. In part, this reflects a time-horizon
problem. The fall in interest rates over the last decade meant that lending rates in many
markets were below capitalization rates making debt funding a very favorable option.
However, the experience of the major global real asset market difficulties in the late 1980s
and early 1990s and the market crisis of 1973 reveal the potential risks of excess borrowing.
Figure 4.2 U.K. Cap Rates and Borrowing Rates 1999-2006
Interest Rates and YieldsSource: Bank of England / IPD
4.5
5.0
5.5
6.0
6.5
7.0
7.5
8.0
8.5
9.0
Jan/19
99
May/
1999
Sep/19
99
Jan/20
00
May/20
00
Sep/20
00
Jan/20
01
May/20
01
Sep/20
01
Jan/20
02
May/20
02
Sep/20
02
Jan/20
03
May/20
03
Sep/20
03
Jan/20
04
May/20
04
Sep/20
04
Jan/20
05
May/20
05
Sep/20
05
Jan/20
06
May/20
06
Sep/20
06
Ave
rage
Rat
e (%
)
Non-Financial Lending RatesIPD Equivalent Yield
Comparisons of listed real estate investments with the private real estate market should
strictly adjust for the capital structure of the vehicle (although the investor purchasing shares
faces the additional financial risk from the leverage). Pagliari et al. (2005) estimate that U.S.
REITs had an average debt-to-value ratio of around 40% in the period 1981-2001 (with the
average rising to 50% towards the end of their analysis period).
43

Correcting for this leverage and for differences in the property type composition of REITs and
NCREIF, they demonstrate that REIT volatility is statistically indistinguishable from
desmoothed NCREIF volatility. Riddiough et al. (2005) perform a similar analysis, and
demonstrate a convergence of the NCREIF indices and REIT performance adjusted for
leverage and other factors. Nonetheless they find that REIT returns are on average some 300
basis points higher than NCREIF returns in the 1980-1998 period. While they suggest that
this might reflect superior efficiency in public ownership of real estate, the difference could
also be attributed to the analysis period, since it ends before the downward correction of
equity markets after the dot.com “exuberance”.
44

Section 4: Summary
Research consistently finds that real estate returns are not distributed normally, with
kurtosis and skewness outside standard parameters. This has implications for the
appropriateness of risk measures in standard portfolio allocation models.
There is evidence of non-linearity and asymmetry in return distributions. For listed
property returns, there is some evidence that correlation with other asset classes
increases when those asset classes are performing poorly (tail dependence), eroding
some of the benefits of diversification.
For private real estate, analysis of return distributions must confront the appraisal
smoothing issue. The valuation process seems to result in very high serial correlation,
with returns in one period influencing those in another. Desmoothing procedures seek
to remove this effect by extracting the “new” information from valuation-based
returns.
There is no consensus on the “best” method for desmoothing appraisal-based data.
The most frequently used model attempts to remove first order autocorrelation (the
relationship between the return this period and that of the previous period). Initial
results from transaction-based, repeat sales indices provide confirmation of the
benefits of the first order autocorrelation method.
Leverage also influences return distributions, adding capital structure risk to the
underlying asset risk. U.S. REITs typically have debt to value ratios of around 40%
while private real estate equity vehicles at the high risk-return end of the spectrum
(value added or opportunity funds) frequently have debt to asset value ratios in excess
of 70%. The impact of exposure to interest rate risk needs to be disentangled from the
underlying real estate market risk.
45
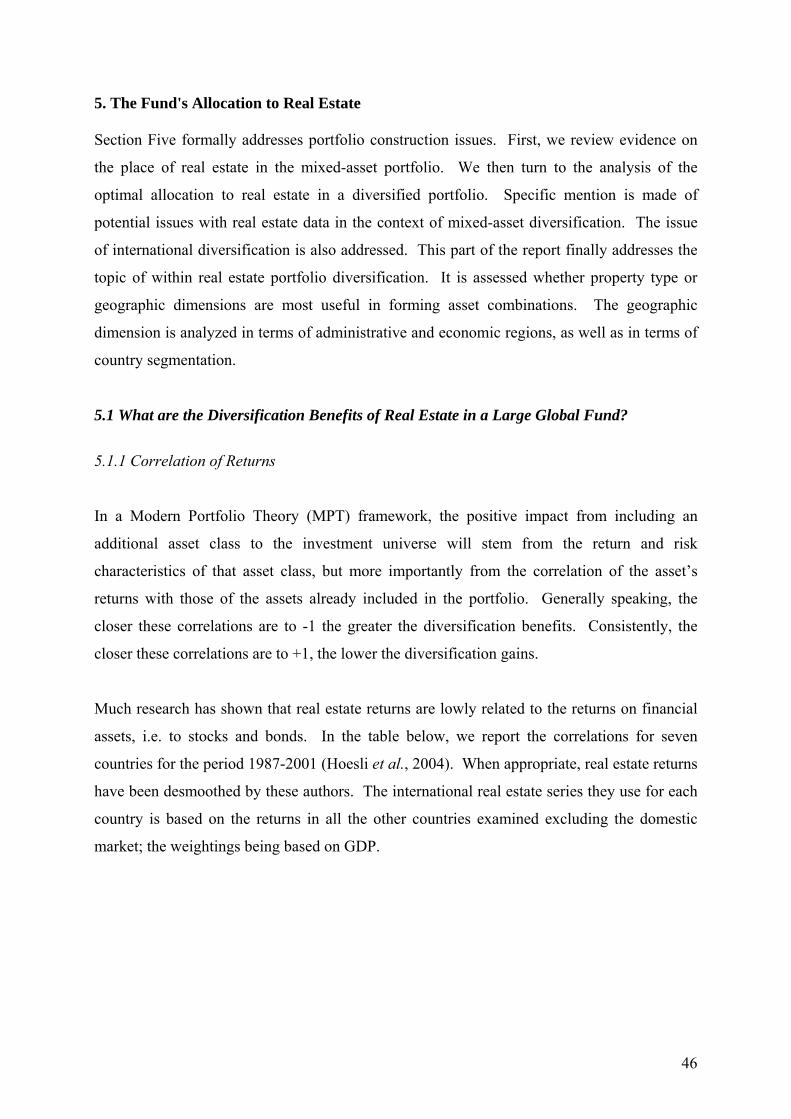
5. The Fund's Allocation to Real Estate Section Five formally addresses portfolio construction issues. First, we review evidence on
the place of real estate in the mixed-asset portfolio. We then turn to the analysis of the
optimal allocation to real estate in a diversified portfolio. Specific mention is made of
potential issues with real estate data in the context of mixed-asset diversification. The issue
of international diversification is also addressed. This part of the report finally addresses the
topic of within real estate portfolio diversification. It is assessed whether property type or
geographic dimensions are most useful in forming asset combinations. The geographic
dimension is analyzed in terms of administrative and economic regions, as well as in terms of
country segmentation.
5.1 What are the Diversification Benefits of Real Estate in a Large Global Fund?
5.1.1 Correlation of Returns
In a Modern Portfolio Theory (MPT) framework, the positive impact from including an
additional asset class to the investment universe will stem from the return and risk
characteristics of that asset class, but more importantly from the correlation of the asset’s
returns with those of the assets already included in the portfolio. Generally speaking, the
closer these correlations are to -1 the greater the diversification benefits. Consistently, the
closer these correlations are to +1, the lower the diversification gains.
Much research has shown that real estate returns are lowly related to the returns on financial
assets, i.e. to stocks and bonds. In the table below, we report the correlations for seven
countries for the period 1987-2001 (Hoesli et al., 2004). When appropriate, real estate returns
have been desmoothed by these authors. The international real estate series they use for each
country is based on the returns in all the other countries examined excluding the domestic
market; the weightings being based on GDP.
46

Figure 5.1 Correlation of real estate with domestic and international stock and bond returns
Correlation
(RE, domestic stocks)
Correlation
(RE, foreign stocks)
Correlation
(RE, domestic bonds)
Correlation
(RE, foreign bonds)
Australia -0.25 -0.14 -0.42 -0.53
France 0.42 0.35 -0.49 -0.01
Netherlands 0.40 0.37 0.27 0.38
Sweden 0.21 0.22 -0.33 -0.20
Switzerland 0.44 0.35 -0.12 0.17
U.K. 0.24 0.38 -0.02 -0.17
U.S. 0.11 0.30 -0.20 -0.16
Source: Hoesli et al. (2004).
Real estate returns appear to be positively correlated with the returns on common stocks, both
domestic and international. The only exception to this is Australia, where the relationship is
negative. In contrast, the relationship between real estate and bond returns is negative except
in the Netherlands. In fact, the negative relation is quite strong in five out of the seven
countries. The results pertain to 7 countries; they pertain however to a relatively short time
period. Hence it is of importance to analyze results for longer time periods. Geltner et al.
(2007) report a correlation of -0.23 between desmoothed U.S. real estate returns and long term
government bonds over the period 1972-2004, while the correlation between real estate and
stocks is 0.18 (see also Francis and Ibbotson, 2001). Further evidence on the weak relation
between real estate returns and stock returns on an international basis is provided by Quan and
Titman (1999). When we use data for the U.S., U.K. and Australia for the period 1985-2005
(1988-2005 for the U.K.), we find further evidence of a weak relationship between real estate
returns and the returns on financial assets. Direct real estate returns have a near zero
correlation with both stock and bond returns, a result that holds whether or not the real estate
returns are desmoothed.
47

Figure 5.2 Contemporaneous Correlation, U.S. Markets 1985-200521
Stocks Bonds REITs NCREIF Desmoothed TBI Stocks 1.000 Bonds -0.054 1.000 REITs 0.428 0.158 1.000 NCREIF 0.042 -0.017 0.041 1.000 Desmoothed -0.016 -0.097 0.136 0.767 1.000 TBI 0.184 0.010 0.181 0.488 0.479 1.000
In the U.K., IPD returns have a low correlation with the equity market and a zero correlation
with the bond market; desmoothing the series makes little difference to the equity market
correlation but leads to an increase in the correlation with bonds (possibly reflecting a faster
adjustment to interest rate shocks). Australian real estate returns are lowly negatively
correlated with the stock market and negatively related to the bond market. Hence the
relationship between real estate and stocks is usually close to zero, while the relation between
real estate and bonds is close to zero or negative. In all cases, the potential benefits of
including real estate in a mixed-asset portfolio appear high.
Figure 5.3 Contemporaneous Correlation, U.K. Markets 1988-200522
Stocks Bonds IPD DesmoothedEquities 1.000 Bonds 0.113 1.000 IPD 0.116 -0.014 1.000 Desmoothed 0.159 0.209 0.772 1.000
Figure 5.4 Contemporaneous Correlation, Australian Markets 1985-200523
Stocks Bonds PCA-IPD Desmoothed Equity 1.000 Bonds 0.164 1.000 PCA-IPD -0.106 -0.455 1.000 Desmoothed -0.117 -0.392 0.734 1.000
There is evidence, however, that these correlations are somewhat unstable (e.g., Fraser et al.,
2002; Maroney and Naka, 2006). For this purpose, we calculate correlations for varying time
periods using U.S. data. Two types of analyses are performed. We first examine the case of
an investor who entered the real estate market in 1985 and exited the market at various time
21 The correlation coefficients between direct real estate (however measured) and stocks or bonds are both
indistinguishable from zero at the 95% confidence level. 22 The correlation coefficient between direct real estate and both stocks and bonds is indistinguishable from zero
at the 95% confidence level. 23 At the 95% confidence level, the correlation between stocks and direct real estate is not significantly different
from zero, while the correlation between bonds and real estate is significantly negative.
48

periods (the minimum holding period is set at 10 years, i.e. for 1985-1994). We then posit
that we are looking at the correlation coefficients as of the end of 2005 with varying years of
entry on the real estate market. We start with a 10-year holding period (1996-2005), and then
expand the period by adding one year at a time up to the period 1985-2005, suggesting that an
investor would have entered the market a year earlier every time. The analyses are reported in
Figures 5.5 and 5.6. The correlation of real estate returns with bonds returns is low in all
cases. The correlation with stocks is higher but never distinguishable from zero statistically.
These results suggest that the inclusion of real estate in a mixed-asset portfolio leads to
substantial and sustained diversification benefits.
Figure 5.5 Correlation between U.S. Real Estate and Stocks or Bonds, Nominal Returns:
Investment Made in 1985, Various Exit Periods
-0.05
0.00
0.05
0.10
0.15
0.20
0.25
0.30
1985-1994
1985-1995
1985-1996
1985-1997
1985-1998
1985-1999
1985-2000
1985-2001
1985-2002
1985-2003
1985-2004
1985-2005
Real estate - Stocks
Real estate - Bonds
Figure 5.6 Correlation between U.S. Real Estate and Stocks or Bonds, Nominal Returns:
Investment Made at Various Periods, End of 2005 Market Exit
49
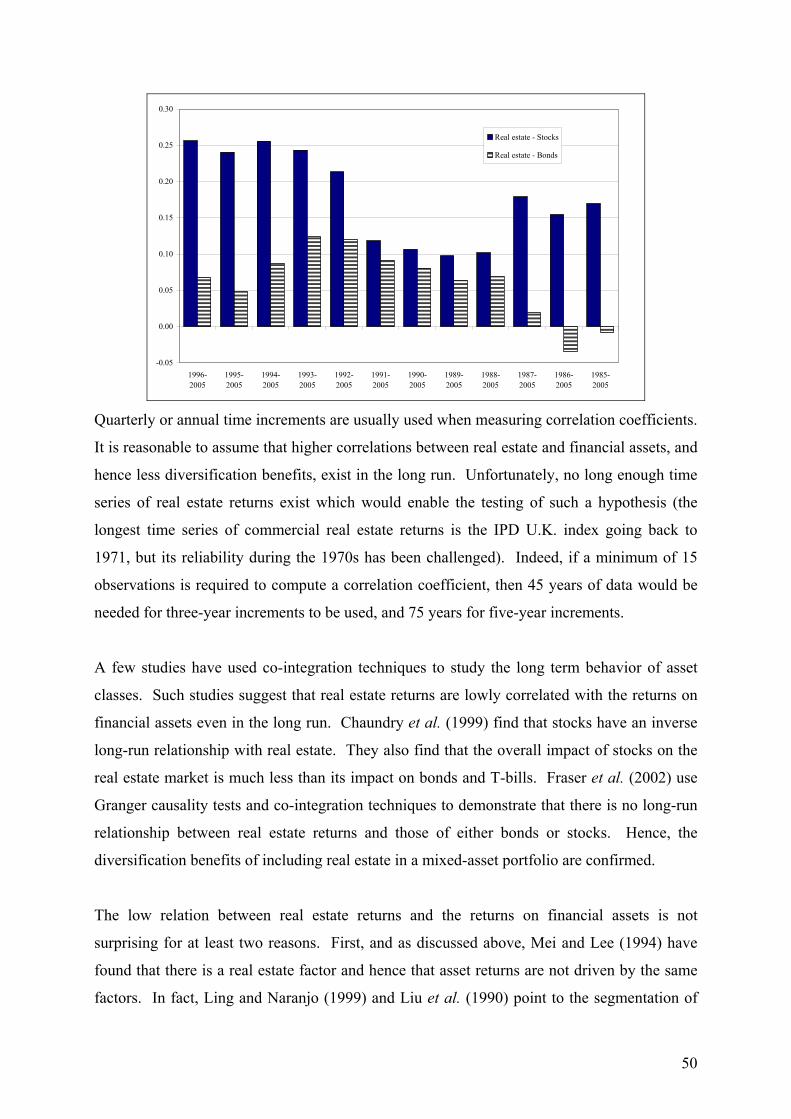
-0.05
0.00
0.05
0.10
0.15
0.20
0.25
0.30
1996-2005
1995-2005
1994-2005
1993-2005
1992-2005
1991-2005
1990-2005
1989-2005
1988-2005
1987-2005
1986-2005
1985-2005
Real estate - Stocks
Real estate - Bonds
Quarterly or annual time increments are usually used when measuring correlation coefficients.
It is reasonable to assume that higher correlations between real estate and financial assets, and
hence less diversification benefits, exist in the long run. Unfortunately, no long enough time
series of real estate returns exist which would enable the testing of such a hypothesis (the
longest time series of commercial real estate returns is the IPD U.K. index going back to
1971, but its reliability during the 1970s has been challenged). Indeed, if a minimum of 15
observations is required to compute a correlation coefficient, then 45 years of data would be
needed for three-year increments to be used, and 75 years for five-year increments.
A few studies have used co-integration techniques to study the long term behavior of asset
classes. Such studies suggest that real estate returns are lowly correlated with the returns on
financial assets even in the long run. Chaundry et al. (1999) find that stocks have an inverse
long-run relationship with real estate. They also find that the overall impact of stocks on the
real estate market is much less than its impact on bonds and T-bills. Fraser et al. (2002) use
Granger causality tests and co-integration techniques to demonstrate that there is no long-run
relationship between real estate returns and those of either bonds or stocks. Hence, the
diversification benefits of including real estate in a mixed-asset portfolio are confirmed.
The low relation between real estate returns and the returns on financial assets is not
surprising for at least two reasons. First, and as discussed above, Mei and Lee (1994) have
found that there is a real estate factor and hence that asset returns are not driven by the same
factors. In fact, Ling and Naranjo (1999) and Liu et al. (1990) point to the segmentation of
50

real estate and stock markets in the U.S. Second, behavioral effects, such as herd behavior, is
likely to make some asset classes “hot” at given time periods and hence increase returns even
further, while other asset classes are considered to be less attractive. Stated differently,
investment strategies linked to behavioral aspects are likely to make real estate even more
counter cyclical than it would otherwise be. To some extent, the growth of public listed real
estate, securitised real estate debt markets and the presence of hedge funds may dampen
cyclical movement while introducing greater trading volatility.
51

5.1.2 Diversification Benefits
In terms of the return and risk benefits, the results can be summarized as follows. For a given
return level, the addition of real estate to a portfolio containing financial assets leads to the
portfolio’s standard deviation being diminished by 5 to 15%. For a given risk level, the
average annual return can be enhanced by 50 to 70 basis points. Figure 5.7 shows the benefits
from including real estate in a mixed-asset portfolio in the U.S. over the period 1985-2005.
We perform the analysis without and with taking into account a 50 basis point illiquidity
premium which is subtracted from the average return on real estate. We also include a
frontier where the allocation to real estate is capped at 10%. The diversification gains from
adding real estate emerge clearly.
Figure 5.7 Efficient frontiers without and with real estate in the U.S., 1985-2005
Efficient Frontier (U.S.), 1985-2005
2.2%
2.4%
2.6%
2.8%
3.0%
3.2%
3.4%
3.6%
2% 3% 4% 5% 6% 7% 8% 9%
Risk (Standard Deviation)
Ret
urn
Stocks + BondsStocks + Bonds + Real EstateStocks + Bonds + Real Estate (net of 50 bp illiquidity premium)Stocks + Bonds + Real Estate (net of 50 bp illiquidity premium and limited to 10%)
52

5.2 What is the Proper Weight of Real Estate in a Mixed-Asset Portfolio?
5.2.1 Basic Results
Several U.S. authors have suggested an optimal weight for real estate in mixed-asset
portfolios in the 10-20% range (Fogler, 1984; Ennis and Burik, 1991; Ziobrowski and
Ziobrowski, 1997). An analysis of the ability of real estate assets in diversifying a portfolio
of financial assets has been conducted for many other countries (e.g. the U.K., Australia,
France, Ireland, and Switzerland). Fairly similar weights as those for the U.S. are reported in
these studies (see e.g. Brown and Schuck, 1996, for the U.K. and Hoesli and Hamelink, 1997,
for Switzerland).
For our analysis of the impact of including real estate in a mixed-asset U.S. portfolio over the
period 1985-2005, Figure 5.8 and 5.9 show the relative asset weights for the two frontiers
with real estate (without and with taking into account a 50 basis point illiquidity premium
which is subtracted from the average return on real estate).
Figure 5.8 Portfolio weights with real estate (no illiquidity premium)
Portfolio Composition along the Efficient Frontier
0%10%20%30%40%50%60%70%80%90%
100%
2.67%2.81%
3.18%3.71%
4.35%5.05%
5.80%6.57%
7.37%8.19%
Std. Dev.
Cum
ulat
ed W
eigh
t of t
he A
sset
s
Real EstateBondsStocks
53

Figure 5.9 Portfolio Weights with Real Estate in the U.S., 1985-2005 (50bp annual illiquidity premium)
Portfolio Composition along the Efficient Frontier
0%10%20%30%40%50%60%70%80%90%
100%
2.67% 2.81% 3.18% 3.71% 4.35% 5.05% 5.80% 6.57% 7.36% 8.19%
Std. Dev.
Cum
ulat
ed W
eigh
t of t
he A
sset
s
Real Estate (Netof Illiq Prem)
Bonds
Stocks
A study by Hoesli et al. (2004) supports the general consensus by providing evidence for
seven countries on three continents. The following table gives the allocation to domestic real
estate in each of seven countries for various portfolios along the efficient frontier. The
minimum variance portfolio denotes the least risky portfolio, while the maximum risk
portfolio is the portfolio with the highest variance. The latter portfolio contains exclusively
stocks in all seven countries. The other five portfolios are calculated at various distances
between the least risky and the most risky portfolios. The “10% of distance” portfolio, for
instance, relates the portfolio which is 10% of the distance between the minimum and
maximum variance portfolios. Note that the absolute variance levels are not the same across
countries.
Figure 5.10 The Efficient Frontier, Real Estate Allocation and Risk, Seven Countries
Minimum
variance
portfolio
10% of
distance
30% of
distance
50% of
distance
70% of
distance
90% of
distance
Maximum
risk
portfolio
Australia 14.9% 13.9% 10.9% 8.9% 14.3% 7.7% 0.0%
France 6.6% 11.4% 18.5% 2.5% 0.0% 0.0% 0.0%
Netherlands 3.4% 5.4% 7.0% 7.4% 5.4% 3.3% 0.0%
Sweden 2.1% 6.7% 12.2% 16.2% 0.0% 0.0% 0.0%
Switzerland 4.7% 6.9% 5.0% 3.2% 0.0% 0.0% 0.0%
U.K. 13.0% 13.1% 12.2% 11.2% 10.3% 1.3% 0.0%
U.S. 3.6% 8.0% 15.6% 20.4% 15.8% 5.2% 0.0%
54

These allocations to real estate result from using returns calculated from available
performance benchmarks. Two comments are warranted. First, returns have been adjusted to
take into account the smoothing of appraisal-based indices. Second, the returns to real estate
do not take into account the possibility to gear investments. Indeed, the most widely used
return indices are based on investment-grade 100% equity financed properties. The possible
impact of leveraging properties can be summarized as follows. Gearing should have no major
impact on the correlation coefficients between real estate returns and the returns on financial
assets. The return on real estate will increase insofar as the return on investment is greater
than the mortgage interest rate. The variability of real estate returns will also increase.
Whereas the benefits from including real estate in a mixed-asset portfolio are traditionally at
the bottom end of the efficient frontier, leveraging properties will shift those benefits towards
the right of the efficient frontier.
An investment in securitized real estate constitutes an investment with gearing in most cases.
However, as discussed above, securitized real estate returns have been found to be quite
highly correlated with the returns on common stocks and much more so than direct real estate
investments. It should come as no surprise then that the benefits from including securitized
real estate in a mixed-asset portfolio are more limited than when direct real estate is
considered. Hoesli et al. (2004) show that the allocation to real estate stocks is in most cases
well below 10% or even zero over the period 1987-2001. The only exception is for Australia
where real estate stocks experienced a higher return and lower risk than common stocks.
When direct real estate is added to the portfolio, the allocations to securitized real estate
diminish even further. These results are based on short holding periods; the returns to private
and public real estate however are likely to be more related in the longer run (Glascock et al.,
2000). This would suggest greater diversification potential from investing in REITs in the
long run (Lee and Stevenson, 2005).
5.2.2 Further Analyses
The results discussed above by and large rely on studies have been conducted in a Modern
Portfolio Theory (MPT) framework. The basic MPT framework has been challenged and
enhanced in various ways. Kallberg et al. (1996), for instance, examine the role of real estate
investment in a portfolio context incorporating the real estate imperfections of indivisible
assets and no short sales. Their study suggests that a 9% allocation to real estate is optimal.
55

Some authors have suggested that confidence bounds should be constructed around the
efficient frontiers to assess the statistical significance of results. Liang et al. (1996) use
bootstrap simulation and show that the confidence intervals are large enough to render
efficient frontiers effectively useless24. They argue that the efficient frontier is fuzzy and the
weight vectors even fuzzier. Bootstrapping, however, relies on very loose assumptions
regarding the distribution of asset returns; large confidence bounds thus would be expected.
Moreover, the confidence intervals for the weights of the other asset classes are wide as well.
The results by Liang et al. (1996) have been challenged by Ziobrowski et al. (1997) who
show that confidence intervals are not as large as those reported by Liang, Myer and Webb.
More to the point, Ziobrowski et al. (1999) show that the optimum amount of real estate in
mixed-asset portfolios is remarkably stable at all risk levels when investors hold their
portfolios for five years rather than for one year or less.
The issue of the width of confidence intervals of optimal weights is a consequence of the
impact of parameter uncertainty, which is the focus of much research. It has been shown that
the practical application of portfolio analysis is hampered by estimation error, especially in
expected returns. Variances and covariances are also unknown, but are somewhat more stable
over time (Jorion, 1985, for common stocks; Stevenson, 2001, for international real estate
stocks). Given these results, it would seem appropriate to increase the reliability of the
means’ point estimates for the optimal asset allocations. This can be done using the Bayes-
Stein shrinkage approach (Jorion, 1985). When such an approach is used, the means are
“shrunk” towards a common value (the common mean, i.e. the mean across all assets
considered). This approach is used by Hoesli et al. (2004), whose main results are discussed
in this section.
It has further been argued that the theoretical weights that are reported in the literature are
flawed by the fact that real estate returns are in several instances not normally distributed, and
hence that Markowitz portfolio optimization may be inadequate. It has been suggested that in
such cases a downside risk framework should be used, i.e. that risk should be measured as the
deviation below a pre-specified target rate of return. Sing and Ong (2000) show that the
weights allocated to real estate do no change in any substantial manner when downside risk is
24 See also Rubens et al. (1998) and Gold (1996).
56

considered, but Cheng and Wolverton (2001) argue that comparing the results obtained in
such a framework with those obtained in a classic modern portfolio theory framework is not
as straightforward as it may appear. Hamelink and Hoesli (2004a), using data for
Switzerland, show that portfolio allocations to real estate are slightly less when the maximum
drawdown, i.e. the loss suffered when an asset is bought at a local maximum, and sold at the
next local minimum, is used as the measure of risk rather than the standard deviation.
Finally, Fisher et al. (2003) examine the impact of constant liquidity on portfolio weights in
the U.S. Constant liquidity is defined by these authors as a constant time to sell. When
unadjusted appraisal-based returns are used, the portfolio with the highest Sharpe ratio
contains 52% of real estate. This weight drops to 33% when a transaction-based index is
used, and to 9% with a constant liquidity transaction-based index. Bond et al. (2006) find that
the allocations to real estate in a portfolio with a short holding period (one year) fall
dramatically following the incorporation of the illiquidity risk into the analysis. For longer
holding period portfolios (five years), however, the impact of the illiquidity risk on portfolio
allocation is less significant.
It has also been argued that an asset-liability optimization framework, rather than an asset
only framework, should be used when making investment decisions. In other words,
institutions aim at optimizing their net wealth portfolio, subtracting the present value of future
liabilities from the present value of assets, and an appropriate framework should be used. In
such a context, institutions would place stronger emphasis on assets that are negatively
correlated to the present value of liabilities, e.g. on bonds, and hence less emphasis on real
estate. Chun et al. (2000) report that the optimal weight which should be allocated to real
estate is approximately 10%, again at the bottom end of the suggested allocations to real
estate (see also Craft, 2001). If pension obligations, however, are sensitive to inflation, then
real estate’s inflation-hedging effectiveness may still call for a large allocation to real estate,
even in an asset-liability framework.
Booth (2002) shows that the importance of ALM depends a bit on the regulatory structure of
the pensions industry and a bit on the balance between defined contribution and defined
benefit pension schemes. In a strongly regulated environment and with a preponderance of
defined benefit schemes, a failure to match the changes in liabilities can leave pension funds
under-funded with adverse effects; furthermore, an asset mix that does not move in line with
57

changes in liabilities may force frequent portfolio rebalancing with associated costs. Booth
(2002) shows that the allocations obtained using a mean variance (Markowitz) approach differ
from those based on ALM. For a mature pension fund, real estate ALM allocations are
around 10% of total assets for low to medium risk portfolios, compared to 14-19% in an asset
only, mean variance analysis. However, for an immature fund, the real estate allocation is
markedly lower and only appears if index-linked bonds and non-domestic equities are
excluded from the opportunity set (see also Craft, 2005).
In sum, whereas there has been some debate on the issue of mixed-asset portfolio
diversification with real estate, in particular due to data concerns, an allocation to real estate is
warranted. A very conservative allocation would entail 10% of the portfolio. The
diversification benefits stem for the low relation between real estate returns and the returns of
financial assets, even in the longer term. Also, there is also some evidence on real estate as an
inflation hedge.
5.2.3 Consistency with Market Size Estimates
The question which arises is whether the suggested allocation to real estate in a portfolio is
consistent with the size of real estate markets. Real estate is estimated to account for 14% of
global market capitalization as of the end of 2003 (Chen and Mills, 2004). The size of the
real estate universe is estimated at $6,200 billion by these authors. The size of global real
estate markets has been continuously increasing since then and the figure is updated to $8,000
billion in Chen and Mills (2006). Breakdowns by region are given: North America $3,338
billion, U.K. $582 billion, Continental Europe $2,343 billion, Asia (ex-Japan) $662 billion,
Japan $874 billion and Australia/New Zealand $170 billion). As mentioned previously, there
is significant discrepancy in the global commercial real estate market estimates, with figures
ranging from $8,000 billion to $17,000 billion (EPRA, 2007) and even $22,000 billion in the
latest report by La Salle Investment Management (2007). The discrepancy primarily arises
from various market definitions, i.e. whether or not core assets only are considered and
whether or not corporate real estate is included. A real estate share of between 7% and 17%
of global market capitalization is consistent with the suggested allocation to real estate from
empirical analyses. From a financial economics perspective, an investor would hold the
market portfolio if 10-15% of its assets were invested in the real estate market.
58
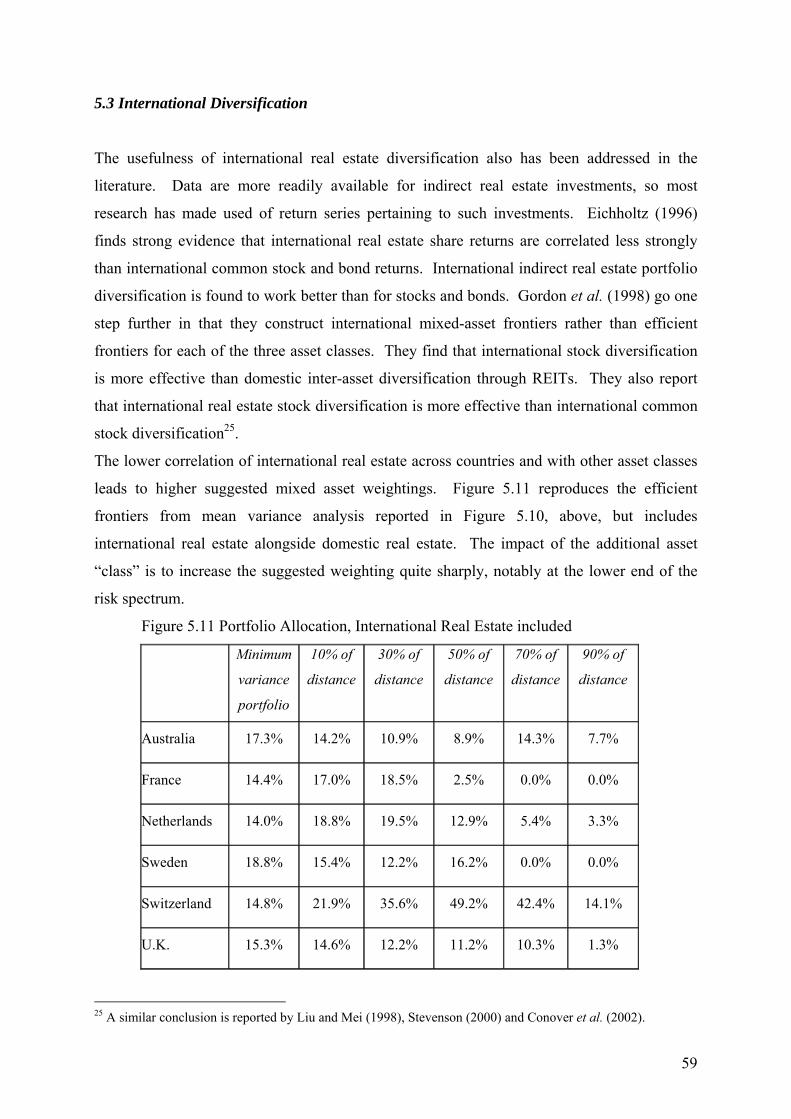
5.3 International Diversification
The usefulness of international real estate diversification also has been addressed in the
literature. Data are more readily available for indirect real estate investments, so most
research has made used of return series pertaining to such investments. Eichholtz (1996)
finds strong evidence that international real estate share returns are correlated less strongly
than international common stock and bond returns. International indirect real estate portfolio
diversification is found to work better than for stocks and bonds. Gordon et al. (1998) go one
step further in that they construct international mixed-asset frontiers rather than efficient
frontiers for each of the three asset classes. They find that international stock diversification
is more effective than domestic inter-asset diversification through REITs. They also report
that international real estate stock diversification is more effective than international common
stock diversification25.
The lower correlation of international real estate across countries and with other asset classes
leads to higher suggested mixed asset weightings. Figure 5.11 reproduces the efficient
frontiers from mean variance analysis reported in Figure 5.10, above, but includes
international real estate alongside domestic real estate. The impact of the additional asset
“class” is to increase the suggested weighting quite sharply, notably at the lower end of the
risk spectrum.
Figure 5.11 Portfolio Allocation, International Real Estate included
Minimum
variance
portfolio
10% of
distance
30% of
distance
50% of
distance
70% of
distance
90% of
distance
Australia 17.3% 14.2% 10.9% 8.9% 14.3% 7.7%
France 14.4% 17.0% 18.5% 2.5% 0.0% 0.0%
Netherlands 14.0% 18.8% 19.5% 12.9% 5.4% 3.3%
Sweden 18.8% 15.4% 12.2% 16.2% 0.0% 0.0%
Switzerland 14.8% 21.9% 35.6% 49.2% 42.4% 14.1%
U.K. 15.3% 14.6% 12.2% 11.2% 10.3% 1.3%
25 A similar conclusion is reported by Liu and Mei (1998), Stevenson (2000) and Conover et al. (2002).
59

Nonetheless, there is some evidence of convergence of real estate returns across Europe.
Lizieri et al. (2003) and McAllister and Lizieri (2006) examine the impact of the introduction
of the Euro on the return performance of listed real estate in Europe. An increase in cross-
national correlation is observed, for both Eurozone and non-Eurozone countries. There is no
clear evidence that this is related to monetary integration (as opposed to broader economic
integration). There is evidence that national returns are influenced both by a global and a
European real estate factor. Although there is evidence of convergence, the cross-market
linkages appear to be lower than for common equities and small capitalization stocks.
More limited evidence exists concerning the benefits of international direct real estate
diversification. Using data for 21 cities world-wide, Case et al. (1997) find that international
real estate diversification within the three types of commercial property would have been
beneficial for a U.S.-based investor. Quan and Titman (1997) find that U.S real estate returns
are less highly correlated with real estate returns in other countries, than is the case of U.S.
stocks with international stocks, suggesting significant benefits from international real estate
portfolio strategies. Similar results are reported by Newell and Webb (1996) for the U.S.,
Canada, the U.K., Australia and New Zealand.
It is important to address practical issues with respect to international direct investment
strategies in real estate. Models typically utilize national indices (or hypothetical city returns)
and implicitly assume that an investor will be able to track such indices. However, as noted
above, large lot size makes it difficult to diversify away specific risk, since most investors will
only hold a handful of properties. Given information asymmetry (and local knowledge),
higher search and monitoring costs and currency issues, global investment strategies are more
complex than theoretical papers imply (Lizieri and Finlay, 1995; Baum, 2002). Furthermore,
concentration of investment in a small range of cities (those with more mature markets,
greater liquidity and which offer market research) can induce correlation risk since returns are
more likely to be driven by common global demand factors (for example, the office markets
of major financial centers are all influenced by the state of global capital markets).
The somewhat limited evidence in the area of currency hedging suggests that currency
fluctuations can be – at least partially – hedged, and that swaps constitute the best hedging
instrument (Worzala et al., 1997; Ziobrowski et al., 1997). When hedging costs are taken into
account, however, the benefits of international diversification appear limited.
60

These studies, however, have only investigated the case of real estate in one foreign country.
If a full-blown diversification strategy is carried out, the risk reduction benefits should be
substantially greater (as illustrated in the studies by Case et al., 1997, and Quan and Titman,
1997), and some of the currency effects will diversify away. In such a context, it can be
argued that hedging strategies may not be needed when several currencies are considered; in
any case the cost of hedging should be weighted against the risk it eliminates.
The results in Hoesli et al. (2004) make it possible to examine the impact of including both
domestic and international direct real estate in a mixed-asset portfolio. Generally speaking,
the allocation to domestic real estate diminishes as international real estate is added to the
investment universe. The only exception to this is the U.S. where the allocation remains
exclusively in domestic real estate. This result reflects the fact that in small countries the size
of the real estate market will not allow for a large allocation to a diversified real estate
portfolio and that investment opportunities have to be sought after in other countries.
5.4 How Should an Investor Diversify a Real Estate Portfolio?
The question of how to diversify optimally a real estate portfolio has been the focus of much
academic and professional research. One of the fundamental questions, especially in large
economies such as those of the U.S. and U.K., is whether real estate diversification by
property type of by region is the most appropriate. There is a general consensus that sector
diversification, i.e. diversification across the various property types, is more useful than
regional diversification based on administratively defined areas (see, for instance, Eichholtz et
al., 1995). Most of these studies have made use of efficient frontiers. Another approach
which has been used is one of decomposing property type and regional influences on property
returns. Lee (2001) finds that for the U.K., over the period 1981 to 1995, the performance of
real estate is largely property type-driven (a similar conclusion prevails in the U.S., Fisher and
Liang, 2000). This implies that the property type composition of the real estate fund should
be the first level of analysis in constructing and managing the real estate portfolio. Hoesli et
al. (1997) use cluster analysis and also find that property type is the most important
dimension in determining different market behavior.
61

Within countries, there has also been quite some debate on whether economically defined
areas would provide for better diversification opportunities than administratively defined
regions. Early studies on this topic include Malizia and Simons (1991) and Mueller (1993).
Economic areas are found to offer greater diversification potential than administrative
regions. The intuition is appealing: returns on properties located in regions with different
economic bases should be less correlated than returns of properties across arbitrarily defined
areas. Hamelink et al. (2000) use cluster analysis to construct homogenous property
groupings in 157 U.K. local markets, by means of commercial real estate returns. Strong
property-type dimensions and only very broad geographical dimensions emerge in the
clusters. So property type still appears to emerge as the main dimension of real estate
portfolio diversification. But the economic base of regions is important, on an international
basis of course as well. Hartzell et al. (1993) use regional employment characteristics to
investigate diversification in European real estate portfolios. This confirms the need to think
of geographical diversification not in terms of broad regions, but rather in terms of smaller
and economically homogeneous areas.
The benefits of sector or regional diversification of the property portfolio are predicated on
the validity of the definitions of sector and region used in performance indices and the extent
to which actual properties within a sector-region segment behave in a similar manner.
Hamelink et al. (2000) found that, for the U.K., standard geographical boundaries did not
adequately capture local market variation. Devaney and Lizieri (2005) examine the extent to
which individual properties are correctly classified by sector-region groupings. Their results
are not encouraging. Analyzing building level return data for some 1,500 properties using a
multiple discriminant analysis technique, they found that just 35% of individual properties
were correctly classified by IPD’s standard ten segment Portfolio Analysis Service
classification (which is used for performance measurement and attribution analysis). By
implication, there is little guarantee that two individual buildings within a sector or region
grouping will perform in similar fashion. As with other U.K. research, sector performed
better than region. The Devaney and Lizieri analysis suggests that yield (capitalization rate)
and tenancy structure may be important factors explaining variation in returns.
An important question is that of cross-country diversification versus property type
diversification, especially in smaller countries. The evidence on this issue is limited to the
work by Case et al. (1997). They find that returns to commercial real estate tend to move
62

together (although not perfectly) across property types within each country and that
international diversification within three segments of the real estate market (industrial, office
and retail) would have been beneficial over the period 1986-1994. This result is appealing as
one would expect the drivers of returns to differ across property types; it is very likely,
however, that the drivers of real estate returns across countries exhibit even more
dissimilarities. There is quite ample evidence of the latter in the literature, mainly based on
traded real estate securities data. Ling and Naranjo (2002), for instance, report evidence of a
worldwide factor in international indirect real estate returns, but also of a highly significant
country-specific factor. Hamelink and Hoesli (2004b) use data for the ten largest real estate
security markets and find that country factors are the dominant factors. Eichholtz et al.
(1998) find evidence of a continental factor in Europe and in North America, but not in the
Asia-Pacific region. Their results also suggest growing integration within Europe. Hence, a
parsimonious international real estate diversification strategy may be most beneficial when
conducted across continents rather than within continents.
63

Section 5: Summary
Correlation analysis indicates that real estate investment should bring diversification
benefits to the mixed-asset portfolio. Generally, directly-held private real estate
indices exhibit low positive correlations with equities and near zero correlations with
bond returns in a wide range of countries.
Where there are longer time series available, as in Australia, U.K. and the U.S., the
correlation results appear to stand. There is variation over time and correlations are
unstable, but rarely appear to be strongly positive.
In mean-variance analysis, the efficient frontier for a portfolio that includes real
estate (even where desmoothed and with an illiquidity premium accounted for)
dominates the efficient frontier with just stocks and bonds.
The optimal weighting for real estate depends on return targets and risk tolerance, but
it is usual to find substantial weightings for real estate in national and international
analyses – weightings that are larger than typical institutional holdings of property as
an asset class.
Securitized, listed real estate offers less apparent diversification and risk-adjusted
return benefits than directly owned property, with stronger correlation to overall
equity market movement and higher volatility – possibly offset by liquidity benefits.
Given that there is return uncertainty due to the appraisal basis of private real estate
returns, some researchers have constructed “fuzzy” frontiers with a range of values
rather than a point estimate. Even here, most researchers point to a substantial real
estate weighting.
There is some debate as to what are appropriate risk measures for real estate, given
non-normality and other distributional issues. Researchers using downside risk
measures such as maximum drawdown, semi-variance or VaR find reduced but still
substantial weightings for real estate in mixed-asset portfolios. Constant liquidity
adjustment models produce similar results.
Asset-Liability Matching models tend to produce lower weightings to real estate than
do conventional mean-variance approaches but the property weightings remain larger
than those typically found in pension fund portfolios.
A weighting of 10% or more in real estate would be consistent with an investment
strategy that was mindful of the global market capitalization of different asset classes.
64

With respect to international diversification, research confirms the benefits of
diversifying real estate portfolios internationally and of including real estate in an
internationally diversified mixed-asset portfolio.
Cross-national real estate returns appear to exhibit lower correlation than cross-
national equity returns. However there is some evidence of convergence of
international real estate returns: a global real estate factor has been identified by a
number of researchers, while others have pointed to regional factors (e.g. for Asian
markets).
There are significant practical difficulties in assembling a diversified international
portfolio. Most studies use national index data. However, with relatively small
numbers of properties in each country, there is a risk of tracking error. The cost of
reducing that tracking error to a small figure may be prohibitive for most investors.
There are high information and monitoring costs associated with international real
estate investment and a risk of information asymmetry and lack of awareness of local
market practice and circumstances. This has driven the growth of international
collective investment vehicles that provide economies of scale in acquisition and
management.
Hedging currency risk at project or building level is complex in real estate with the
long and uncertain holding period and exit value not matching available hedging
products. This may be less of a problem if exchange rate hedging is based on a
portfolio level currency overlay approach.
Within the real estate portfolio, evidence suggests that sector diversification is more
effective than geographical diversification, although care should be taken to
distinguish between administrative regions and economically-functioning regions.
There is some evidence that there is considerable building-level variation within
sectors and regions, casting some doubt on their effectiveness in structuring the
optimal portfolio. Tenancy structures, yields and size are other possible dimensions
structuring the risk-return profile.
65

6. Performance Measurement and Benchmarking Brown and Matysiak (1999) suggest that performance measurement performs three principal
tasks:
Communication: informing trustees, shareholders and stakeholders about the
performance of the fund;
Accountability: judging the performance of professional advisors and managers,
usually in relation to a pre-set target;
Research: investigating ways in which performance can be improved.
In all of these areas, the nature of real estate as an asset presents problems. These are most
acute in relation to direct, private investment in real estate, since public listed real estate can
be subjected to the same market analyses as general equities. Even here, though, the impact
of the general equity market on returns, considered above, makes it hard to assess the (short-
run) performance of REITs or property companies as a real estate investment.
The growth of private market real estate indices like the NCREIF index and the IPD indices
have led to greater transparency in private real estate investment. As coverage improves and
time series lengthen, it becomes increasingly possible to conduct detailed research and subject
fund performance to more rigorous analyses. The Achilles heel of such indices, however, is
that they are based on appraisals and not on transactions, with the attendant problems of
smoothing discussed earlier in the report. Superficially, it might seem that the arrival of
transaction-based indices offer a solution to this problem. However, individual fund
performance will still need to be valuation-based since transaction costs mean that individual
properties will continue to be traded infrequently and holding periods will remain long.
In judging the performance of a fund manager, it is customary to set an ex ante target. This
might be an absolute return target – to achieve a real return of 5% per annum, for example.
Often, however, the manager is judged on a relative basis. A common target is to beat the
national market index by a fixed percentage (IPD plus 1%). If that is basis for performance
measurement, it is important to select an appropriate benchmark. In most instances, this
would be the broadest available for the target market. There is a case, however, for a
customized benchmark that reflects competitor funds or funds of comparable size.
66

In the latter case, the large lot size of certain types of property (for example, regional
shopping malls or prime offices in global cities) exclude many smaller investors, so the broad
national benchmark may be inappropriate. IPD offer a customized benchmark service in the
U.K., but this requires a large database to provide reliable sub-indices.
Given the low frequency of real estate benchmark indices and of periodic fund valuations, a
problem exists in demonstrating the statistical significance of any observed out-performance.
As Geltner et al. (2007) note, superior investment ability implies the ability to outperform the
benchmark consistently. They show how low frequency data creates large standard errors
around the benchmark and fund return, making it near impossible to prove under- or over-
performance. Specifically the standard error for abnormal performance is given by σBi / √n ,
where σBi is tracking error26, {σi2 + σB
2 - 2ριΒσiσB}½ , σi is the variance of the fund, σB is the
variance of the benchmark and ριΒ is the correlation between the fund and the benchmark.
Applying this model to the transaction-based U.S. risk-return data considered above,
assuming that both the benchmark and the fund have quarterly standard deviations of 3.8%,
that the fund has a 0.7 correlation with the benchmark and that the analysis uses 20 quarters of
data, then the standard error is 0.0157, implying that to be 95% confident that out-
performance had occurred, one would need a return 2.7% above the benchmark27. Typical
performance targets are 0.5% to 1% above a national benchmark.
Indices such as NCREIF and IPD report investment returns without leverage. This provides
an appropriate benchmark for assessing asset performance, but may need adjusting if fund
returns are reported on a geared basis. Clearly, the use of debt exposing the fund to interest
rate risk and increases the potential volatility of equity returns. There is thus a trade-off
between higher expected returns and greater risk. This is reflected in the target returns of the
different types of private real estate equity investment vehicles, with low geared core funds
offering much lower anticipated returns than, for example, opportunity funds – the differences
reflecting both capital structure and the nature of activities performed.
Booth et al. (2002) provide a comprehensive analysis of risk and performance measurement
in an Investment Property Forum research review. They point out that risk is context specific
and depends on the objective of the fund, the level of aggregation (that is risk of a specific 26 That is, the standard deviation of the difference between the fund return and the benchmark. 27 T-statistic, one tailed, for 19 degrees of freedom = 1.729.
67

asset class or contribution to overall portfolio risk) and the targets set for the fund managers.
Thus a fund manager may be given an absolute return target, a target relative to an investment
benchmark or a target relative to a liabilities benchmark. Even given a particular benchmark,
investors might be concerned with total variability (for example a measure based on the
standard deviation), downside risk (or the risk of performing worse than an absolute value),
value at risk (the maximum loss for a particular probability) and other risk metrics.
In similar fashion, there exist a broad range of risk-adjusted return ratios (for example, the
Sharpe ratio, Treynor ratio, Jensen’s alpha, the Sortino ratio). A general review of risk
measurement can be found in Dowd (2002). He demonstrates, based on a sample of 83
property funds, that there is very little consistency in the ranking of performance based on the
different measures. While all measures are positively correlated, correlations as low as 0.3
were observed. The implication of this result is that performance measurement has to be
strongly linked to fund objectives and that there can be no one “preferred” measure.
Tracking error measures are problematic in direct private real estate due to the appraisal based
nature of the benchmark (e.g. IPD, NCREIF) and the characteristics of real estate as an asset:
the large lot size and heterogeneity making it difficult for most investors to assemble
portfolios that reliably track an index28. Similar problems occur in attribution analysis –
wherein manager performance is split into the effects of portfolio allocation decisions (the
proportion invested in particular types of building or market) and stock selection (the actual
properties acquired for the fund). Standard attribution analysis systems tend to use sector and
geographical factors to classify portfolio structure and hence to measure the allocation effect.
However, as the Devaney and Lizieri (2005) research, shows, there is considerable variation
within sector-geography segments. This suggests that the stock selection component of
performance may be understated in conventional attribution analyses models.
Particular problems are faced when benchmarking an international portfolio. It has only been
comparatively recently that real estate market performance indices have become available in a
wide range of countries. They are not accompanied by accurate statistics on the size of the
investment real estate market in those countries. Yet the national indices must be weighted
somehow to create any international index. It would be possible to use the market values of
28 This also has implications for the development of real estate derivatives markets, since it is extremely difficult to assemble an arbitrage portfolio.
68
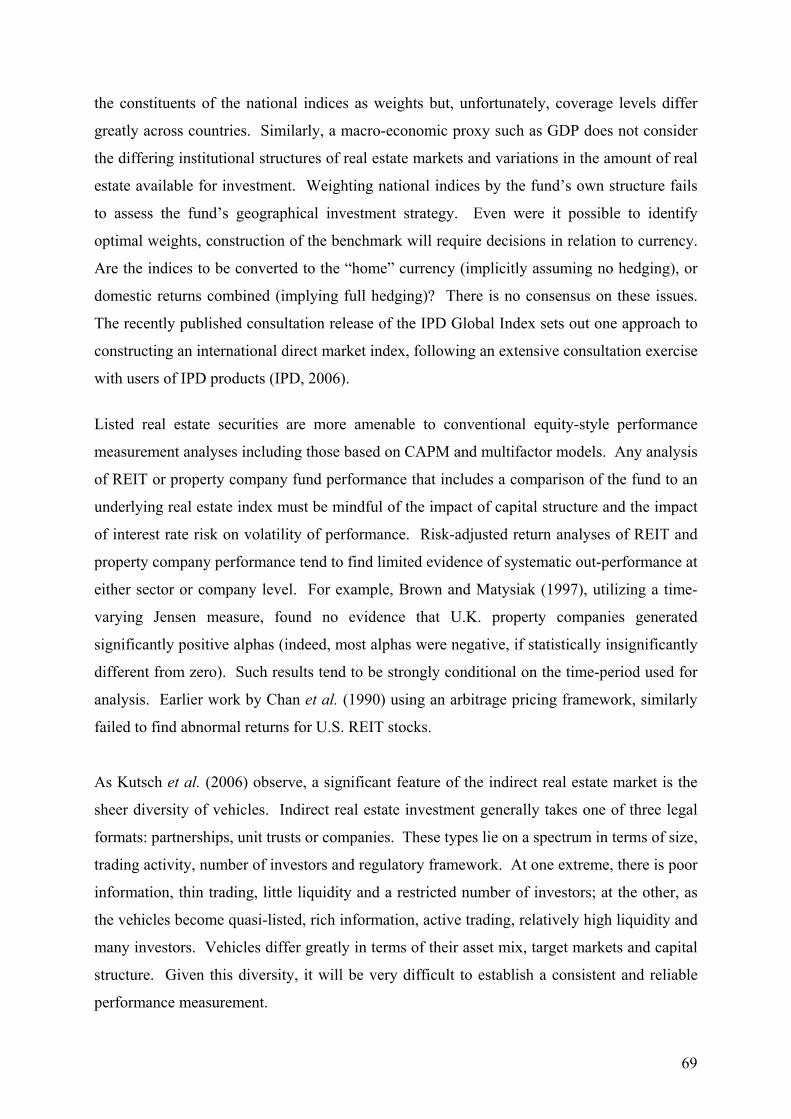
the constituents of the national indices as weights but, unfortunately, coverage levels differ
greatly across countries. Similarly, a macro-economic proxy such as GDP does not consider
the differing institutional structures of real estate markets and variations in the amount of real
estate available for investment. Weighting national indices by the fund’s own structure fails
to assess the fund’s geographical investment strategy. Even were it possible to identify
optimal weights, construction of the benchmark will require decisions in relation to currency.
Are the indices to be converted to the “home” currency (implicitly assuming no hedging), or
domestic returns combined (implying full hedging)? There is no consensus on these issues.
The recently published consultation release of the IPD Global Index sets out one approach to
constructing an international direct market index, following an extensive consultation exercise
with users of IPD products (IPD, 2006).
Listed real estate securities are more amenable to conventional equity-style performance
measurement analyses including those based on CAPM and multifactor models. Any analysis
of REIT or property company fund performance that includes a comparison of the fund to an
underlying real estate index must be mindful of the impact of capital structure and the impact
of interest rate risk on volatility of performance. Risk-adjusted return analyses of REIT and
property company performance tend to find limited evidence of systematic out-performance at
either sector or company level. For example, Brown and Matysiak (1997), utilizing a time-
varying Jensen measure, found no evidence that U.K. property companies generated
significantly positive alphas (indeed, most alphas were negative, if statistically insignificantly
different from zero). Such results tend to be strongly conditional on the time-period used for
analysis. Earlier work by Chan et al. (1990) using an arbitrage pricing framework, similarly
failed to find abnormal returns for U.S. REIT stocks.
As Kutsch et al. (2006) observe, a significant feature of the indirect real estate market is the
sheer diversity of vehicles. Indirect real estate investment generally takes one of three legal
formats: partnerships, unit trusts or companies. These types lie on a spectrum in terms of size,
trading activity, number of investors and regulatory framework. At one extreme, there is poor
information, thin trading, little liquidity and a restricted number of investors; at the other, as
the vehicles become quasi-listed, rich information, active trading, relatively high liquidity and
many investors. Vehicles differ greatly in terms of their asset mix, target markets and capital
structure. Given this diversity, it will be very difficult to establish a consistent and reliable
performance measurement.
69

Kutsch et al. (2006) argue that a vital issue facing investors using real estate private collective
vehicles rather than through acquisition of a directly-held portfolio of property assets
themselves, is that “investors are investing in assets with different investment qualities than
ownership of the underlying assets. Relative to direct ownership, there are significant
differences in, among other things, liquidity, trading and price formation, search costs,
management control, lot size, taxation and transaction costs. A priori, we expect these
differences to have pricing implications. It would be surprising if a simple pro-rata division
of NAV accurately reflected their pricing implications - even if the NAV was reliably
appraised.” They highlight problems linked to “fractional valuation” – the value of a part
stake in a building. There are arguments both in favor of a discount (for example, the lack of
management control of the asset, the additional risk imposed by vehicle-level gearing and the
need to deal with partners) and in favor of a premium (the reduction of the “large lot-size”
problem that can exclude certain investors from acquiring particular types of asset, economies
of scale and the spread of risk across investors) – but no empirical research to quantify the
impacts. The private nature of the vehicles, their unregulated structure and absence of public
information on transactions forces researchers to rely on survey-based research and
simulations.
Baum and Fear (2001) identified a number of other issues which complicate performance
measurement. These included the lack of standardization or consistency in the reporting of
fund and asset management fees (and, in particular, performance fees), gearing, issues
concerning the life of the fund (and possible extension of that life), pre-emption rights held by
other investors in the fund or vehicle, concerns over liquidity – particularly in falling markets
– and a general lack of transparency. All of these are problematic in assessing performance of
funds or portfolios of funds. The fee issue is particularly problematic. Most vehicles provide
an incentive structure for managers in the form of a performance fee relative to an absolute or
relative target. However, until the fund is wound up, any total return performance can only be
based on appraisal values (and for most vehicles, there is no necessity to obtain arms-length
independent valuations): investors are reluctant to pay fees based on valuations alone.
However, realization-based fees create two major problems: first, they assume that the fund
will be wound up; second, if an investor wishes to withdraw from the fund before expiry, then
there must be an adjustment between buyer and seller that reflects the contingent liability for
that performance fee – but with no basis to estimate the reliability of the fee.
70
There appears to be little consistency as to whether contingent fees are deducted from the
fund’s net asset value in determining the “price” of a unit or share in the fund. In similar
fashion, there appears to be no consistency as to whether or not debt in the vehicle is marked
to market or left at historic cost29.
Organizations such as INREV (the European Association for Investors in Non-Listed Real
Estate Vehicles) play an important role in establishing common standards for reporting which
help reduce the problems of fund comparison. For example the Core Definitions (INREV,
2006), published in December 2006, set out definitions of fund type (including a classification
into Core, Value Added and Opportunity) and a wide range of financial and property-related
reporting items, ranging from net and gross asset value and yields to fund and asset
management fees and hurdle rates. Although these definitions have no legal or regulatory
backing (and many are couched in very general terms), the support of a significant body of
institutional and professional investors helps to ensure adherence. The growing significance
of the CFA Institute’s Global Investment Performance Standards should also help to create
standardization in reporting – Norway, through the Norwegian Society of Financial Analysts,
has adopted a translated version of GIPS as its standard, for example30.
A further issue in assessing the performance of indirect real estate vehicles occurs with open
ended fund structures. In an open ended structure – particularly where the fund is regulated
(for example, within the EU and the EEA under the national implementation of UCITS31) –
the manager may have little control over flow of funds. Where there are significant numbers
of retail investors, this may result in an inflow of funds when markets have been performing
well and an outflow of funds in depressed markets – that is, capital follows returns. This can
damage performance. In real estate markets, given illiquidity, forced redemptions can be
particularly problematic – even in balanced markets, it takes considerable time to sell a real
asset, a problem exacerbated in falling markets. This forces managers to hold cash or liquid
assets, potentially damaging returns. In similar fashion, in “hot” markets, it may be difficult
for fund managers to find product in response to inflows of capital. Use of time-weighted,
rather than money-weighted, rates of return reduce this problem to some extent.
29 In passing, it is worth noting that many of these vehicles have relatively high asset and fund management fees,
generally as a percentage of the gross asset value. Fund-of-fund vehicles result in the layering of fee structures, which dampens the benefit of reduced search and monitoring costs.
30 See www.finansanalytiker.no. 31 In Norway through the Norwegian Securities Funds Act.
71

In summary, there are problems in assessing the performance of private indirect real estate
funds and vehicles that result from the lack of a standard structure, the lack of transparency
and difficult issues concerned with fractional valuation and fee structures. Given that the
market has grown from a minor part of overall real estate activity to a dominant feature of the
property investment market in less than a decade, such measurement and monitoring issues
are, perhaps, to be expected and much progress has been made with the efforts of INREV,
AREF, IPD and private data providers such as Property Funds Research playing a significant
role in achieving greater transparency. We should also note that the market has evolved in the
context of sustained strong commercial real estate performance (particularly in the U.K.) and
there is little information about the performance of such funds across a complete cycle. This
is particularly important for the highly geared opportunity end of the fund spectrum.
72

Section 6: Summary
Benchmarking performs multiple roles – to communicate performance to stake
holders, to provide accountability for fund managers, and to support research. In all
three areas, data issues in real estate cause problems.
There is an increasing availability of market performance indices in commercial real
estate. The Achilles’ heel of such indices is that they are appraisal-based creating
uncertainty as to the value of performance measures and benchmarks. While
transaction-based indices assist in promoting understanding of overall market
behavior, at fund level appraisals will remain an integral part of the measurement
process.
One consequence of valuation uncertainly (and low frequency data) is that it is very
difficult to prove that a fund manager has outperformed (or underperformed) a target
in any sense of statistical significance.
Targets for fund managers may be absolute (achieve a real return of 5%) or relative
(outperform IPD by 1%). The performance should be risk adjusted. Benchmarking
international performance is more problematic, as not only is there incomplete
coverage of return series, it is also unclear as to what weights should be applied to the
national components.
Benchmarking and performance measurement must be mindful of leverage. Use of
debt combines asset performance and performance that is related to capital structure.
Debt levels are a particular issue for public real estate securities and for value-added
and opportunity funds amongst private equity real estate vehicles.
The sheer diversity of private equity vehicles, allied to lack of standardization, makes
performance measurement particularly difficult. There are major problems in
quantifying the impact of fractional valuation, realization-based performance fees and
management costs, the right to exit and the impact of debt on structure of returns.
Despite major improvements in transparency and attempts by interest groups to
impose standardization of reporting, there remain numerous unanswered questions
concerning the performance of private real estate investment vehicles, not least in that
their behavior has not been observed over a complete real estate cycle.
73

7. Conclusions: Real Estate in the Investment Portfolio In analyzing the investment potential and portfolio contribution of real estate, an important
first step is understanding the nature of the product. There are now many routes and vehicles
that provide an exposure to the commercial real estate market. Some are traded in private
markets, some trade on public markets; some involve direct management of the underlying
real estate, others are financial, paper, investment underpinned by real estate cashflows but
where the returns may be as much influenced by capital market as asset market factors. The
risk-return characteristics of the different vehicles and products differ, as does the potential to
offer diversification gains in the mixed-asset portfolio.
Analysis of private ownership of, and investment in, commercial real estate is hampered by
data deficiencies. Most available time series are short and relatively low frequency. They are
also generally based on appraisals rather than transactions. This can have a distorting effect
on reported risk, return and correlation measures. However, a growing body of research
exists that addresses the valuation smoothing issue and that attempts to provide more
comparable returns. In general, average private real estate returns fall between those of equity
and bonds, and exhibit, even adjusted for valuation effects, considerably lower risk than
equity. While standard deviations tend to be low, there is evidence of cyclic behavior in the
market. Public listed real estate returns (from REITs or property companies) exhibit volatility
that has similar characteristics to the general equity market. Some of that extra volatility
relates to capital structure, the use of debt and exposure to interest rate risk.
Correlation analysis indicates that real estate has considerable potential as a risk diversifier in
the mixed-asset portfolio. Even correcting for valuation smoothing and liquidity, private real
estate tends to have low correlation with equities and bonds. As a result, in a mean-variance
framework, most portfolios on the efficient frontier tend to contain substantial proportions of
real estate, and the efficient frontier containing real estate dominates that excluding real estate
as an investment. These results hold with use of alternative (downside) risk measures and in
an asset-liability matching framework: while the real estate weightings are lower than for
conventional mean-variance analysis, they still typically exceed those observed in the
portfolios of institutional investors. In part, this may reflect management issues; in part
concern over tracking error and exposure to specific risk due to the scale of investment
required in building a diversified portfolio.
74

Large investors can overcome these problems directly by achieving economies of scale;
smaller investors can utilize the growing private property fund sector to achieve a similar
effect, albeit one with concerns over liquidity and transparency.
There is some evidence that international real estate investment provides an efficient
mechanism for global diversification. Although there do seem to be global and regional real
estate factors and convergence in performance over time, these effects are more muted than
those observed in relation to equity markets. Particular practical difficulties face any investor
attempting to construct an international real estate portfolio, including the scale of investment
required to overcome tracking error, additional, search, information and monitoring costs,
dangers of information asymmetry in local markets and the difficulty in establishing
benchmarks.
Benchmarking and performance measurement is problematic in commercial real estate,
particularly where a relative benchmark is used rather than an absolute benchmark. For
private directly-owned real estate there are data issues relating to the valuation-based
comparator indices and the valuation-based fund performance measures. For private real
estate equity vehicles, there are questions about fee structure, the impact of performance
bonuses, fractional valuation of property interests, illiquidity and the ability to exit. For
public traded real estate, the investor must unpack the influence of the wider equity market,
the leverage structure of the company and the role of management in determining cashflow
over time. There has been great progress in risk management procedures in real estate but the
available techniques are still constrained by data.
One final issue fell outside the brief, but needs to be considered: market timing. If it were
decided to build a weighting in commercial real estate, what is the correct time to enter the
market? There have been many commentaries that have highlighted the amount of capital
chasing real estate assets in Europe and in other parts of the world. The creation of new
investment vehicles, the arrival of new market players, the widespread availability of debt and
equity capital has led to an apparent excess of demand over supply of product. Many argue
that this has driven prices up and capitalization rates down to levels where the sustainability
of value is open to question.
75

Not all analysts accept this view. Some argue that structural changes to interest rates and
inflation expectations, allied to the greater transparency of the market and the ability to
separate out cashflow components allowing investors greater flexibility in risk-return choices,
has meant that required returns have fallen sharply, that values are sustainable and that there
remain buying opportunities. Others, though, flag a possible correction in real asset markets
or question whether income growth will be sufficient to generate target rates of return. Given
those concerns, any market entry strategy needs to be pursued with care.
76

Bibliography AME Capital (2006). Global Real Estate Equity Research, December 2006, London: AMEC
Ltd. Anson, M. and Hudson-Wilson, S. (2003). “Should one use leverage in a private equity real
estate portfolio?” Journal of Portfolio Management, Special issue, 54-61. Barclays Capital (2007). European Securitisation Annual, January 2007, London: Barclays
Capital. Barkham, R. and Geltner, D. (1995). “Price discovery in American and British property
markets”, Real Estate Economics, 23(1), 21-44. Barkham, J. and Ward, C. (1999). “Investor sentiment and noise traders: discount to net asset
value in listed property companies in the U.K.”, Journal of Real Estate Research, 18(2), 291-309.
Baum, A. (2002). Commercial Real Estate Investment, London: Estates Gazette. Baum, A. and Fear, E. J. (2001). Liquidity in Private Property Vehicles: Where Next?
London: Investment Property Forum. Baum, A., Lizieri, C. and Marcato, G. (2006). Pricing Property Derivatives: An Initial
Review, Report prepared for the Investment Property Forum. Bond, S., Crosby, N., Hwang, S., Key, T., Lizieri, C., Matysiak, G., McAllister, P. and Ward,
C. (2004). Liquidity in Commercial Property Markets, London: Investment Property Forum.
Bond, S. and Hwang, S. (2003). “A measure of fundamental volatility in the commercial property market”, Real Estate Economics, 31(4), 577-600.
Bond, S. A., Hwang, S., Lin, Z. and Vandell, K. D. (2007 forthcoming), “Marketing period risk in a portfolio context: theory and empirical estimates from the U.K. commercial real estate market”, Journal of Real Estate Finance and Economics.
Bond, S., Hwang, S. and Richards, K. (2006). “Optimal allocation to real estate incorporating illiquidity risk”, Journal of Asset Management, 7(1), 2-16.
Bond, S, Karolyi, G. and Sanders, A. (2003). “International real estate returns, a multi-factor, multi country approach”, Real Estate Economics, 31(3), 481-500.
Bond, S. and Patel, K. (2002). “The conditional distribution of real estate returns: are higher moments time varying?” Journal of Real Estate Finance and Economics, 26(2), 319-339.
Booth, P. (2002). “Real estate investment in an asset/liability modeling context”, Journal of Real Estate Portfolio Management, 8(3), 183-198.
Booth, P. and Marcato, G. (2004). “The measurement and modeling of commercial real estate performance”, British Actuarial Journal, 10(1), 5-61.
Booth, P., Matysiak, G. and Ormerod, P. (2002). Risk Measurement and Management for Real Estate Portfolios. Report for the Investment Property Forum, London: IPF.
Boyd, J. W., Ziobrowski, A. J., Ziobrowski, B. J. and Cheng, P. (1998). “Leverage and real estate investment in mixed-asset portfolios”, Journal of Real Estate Portfolio Management, 4(2), 135-147.
Brown, G. and Matysiak, G. (1995). “Using commercial property indices for measuring portfolio performance”, Journal of Property Finance, 6(3), 27-38.
Brown, G. and Matysiak, G. (1998). “Valuation smoothing without temporal aggregation”, Journal of Property Research, 15(2), 89-103.
Brown, G. R. and Matysiak, G. (2000a). “Sticky valuations, aggregation effects and property indices”, Journal of Real Estate Finance and Economics, 20(1), 49-56.
Brown, G. R. and Matysiak, G. A. (2000b). Real Estate Investment: A Capital Market Approach, Harlow: Financial Times Prentice Hall.
77

Brown, G. R. and Schuck, E. J. (1996). “Optimal portfolio allocations to real estate”, Journal of Real Estate Portfolio Management, 2(1), 63-73.
Byrne P. and Lee, S. (1997). “Real estate portfolio analysis under conditions of non-normality: the case of NCREIF”, Journal of Real Estate Portfolio Management, 3(1), 37-46.
Case, B., Goetzmann, W. N. and Wachter, S. (1997). “The global commercial property market cycles: a comparison across property types”, paper presented at the AREUEA 6th international real estate conference, University of California at Berkeley.
Chan, K. C., Hendershott, P. H. and Sanders, A. B. (1990). “Risk and return on real estate: evidence from equity REITs”, AREUEA Journal, 18(4), 431-452.
Chan, S. H., Leung, W.-K. and Wang, K. (2005). “Changes in REIT structure and stock performance: evidence from Monday stock anomaly”, Real Estate Economics, 33(1), 89-120.
Chau, K. W., MacGregor, B. D. and Schwann, G. M. (2001). “Price discovery in the Hong Kong real estate market”, Journal of Property Research, 18(3), 187-216.
Chaundry, M. K., Myer, F. C. N. and Webb, J. R. (1999). “Stationarity and cointegration in systems with real estate and financial assets”, Journal of Real Estate Finance and Economics, 18(3), 339-349.
Chen, L. and Mills, T. I. (2004). Global real estate investment – Going mainstream, Hartford (USA): UBS Real Estate Research, available at www.ubs.com/realestate.
Chen, L. and Mills, T. I. (2006). Global real estate investable universe continues to expand and develop, Hartford (USA): UBS Real Estate Research, available at www.ubs.com/realestate.
Cheng, P. (2005). “Asymmetric risk measures and real estate returns”, Journal of Real Estate Finance and Economics, 30(1), 89-102.
Cheng, P. and Wolverton, M. L. (2001). “MPT and the downside risk framework: a comment on two recent studies”, Journal of Real Estate Portfolio Management, 7(2), 125-131.
Cho, H., Kawaguchi, Y. and Shilling, J. D. (2003). “Unsmoothing commercial property returns: a revision to Fisher-Geltner-Webb's unsmoothing methodology”, Journal of Real Estate Finance and Economics, 27(3), 393-405.
Chun, G. H., Ciochetti, B. A. and Shilling, J. D. (2000). “Pension-plan real estate investment in an asset-liability framework”, Real Estate Economics, 28(3), 467-491.
Clark, G. L. and Evans, J. (1998). “The private provision of urban infrastructure: financial intermediation through long-term contracts”, Urban Studies, 35(2), 301-319.
Clayton, J., Geltner, D. and Hamilton, S. W. (2001). “Smoothing in commercial property valuations: evidence from individual appraisals, Real Estate Economics, 29(3), 337-360.
Clayton, J. and MacKinnon, G. (2003). “The relative importance of stock, bond and real estate factors in explaining REIT returns”, Journal of Real Estate Finance and Economics, 27(1), 39-60.
Collett, D., Lizieri, C. and Ward, C. (2003). “Timing and the Holding Periods of Institutional Real Estate”, Real Estate Economics, 31(2), 205-222.
Conover, C. M., Friday, H. S. and Sirmans, G. S.. (2002). “Diversification benefits from foreign real estate investments”, Journal of Real Estate Portfolio Management, 8(1), 17-25.
Corgel, J. B. and deRoos, J. A. (1999). “Recovery of real estate returns for portfolio allocation”, Journal of Real Estate Finance and Economics, 18(3), 279-296.
Craft, T. M. (2001). “The role of private and public real estate in pension plan portfolio allocation choices”, Journal of Real Estate Portfolio Management, 7(1), 17-23.
Craft, T. M. (2005). “How funding ratios affect pension plan portfolio allocations”, Journal of Real Estate Portfolio Management, 11(1), 29-36.
78

Crosby, N. and McAllister, P. (2004) Deconstructing the Transaction Process: An Analysis of Fund Transaction Data. In: Lizieri, C. (ed.) Liquidity in Commercial Property Markets: Research Findings. London: Investment Property Forum, pp22-39.
Devaney, S. and Lizieri, C. (2005). “Individual assets, market structure and the drivers of return”, Journal of Property Research, 22(4), 287-307.
Diaz, J. III and Wolverton, M. L. (1998). “A longitudinal examination of the appraisal smoothing hypothesis”, Real Estate Economics, 26(2), 349-358.
Dowd, K. (2002). An Introduction to Market Risk Measurement, London: John Wiley & Sons Ltd.
Edelstein, R. and Quan, D. (2006). “How does appraisal smoothing bias real estate returns measurement?” Journal of Real Estate Finance and Economics, 32(1), 41-60.
Eichholtz, P. M. A. (1996). “Does international diversification work better for real estate than for stocks and bonds?” Financial Analysts Journal, 52(1), 56-62.
Eichholtz, P., Hoesli, M., MacGregor, B. and Nanthakumaran, N. (1995). “Real estate portfolio diversification by property type and region”, Journal of Property Finance, 6(3), 39-59.
Eichholtz, P., Huisman, R., Koedijk, K. and Schuin, L. (1998). “Continental factors in international real estate returns”, Real Estate Economics, 26(3), 493-509.
Ennis, R. M. and Burik, P. (1991). “Pension fund real estate investment under a simple equilibrium pricing model”, Financial Analysts Journal, 47(3), 20-30.
EPRA (2007). FTSE EPRA/NAREIT Global Real Estate Index Monthly Bulletin January 2007, Schipol: European Public Real Estate Association.
Fisher, J., Gatzlaff, D., Geltner, D. and Haurin, D. (2003). “Controlling for the impact of variable liquidity in commercial real estate price indices”, Real Estate Economics, 31(2), 269-303.
Fisher, J. D. and Young, M. S. (2000). “Holding periods for institutional real estate in the NCREIF database”, Real Estate Finance, 17(3), 27-34.
Fisher, J. D. and Liang, Y. (2000). “Is sector diversification more important than regional diversification?” Real Estate Finance, 17(3), 35-40.
Fisher, J., Miles, M. and Webb, R. (1999). “How reliable are commercial property appraisals? Another look”, Real Estate Finance, 16(3), 9-15.
Fogler, H. R. (1984). “20% in real estate: can theory justify it?” Journal of Portfolio Management, 10(2), 6-13.
Francis, J. C. and Ibbotson, R. (2001). “Empirical risk-return analysis of real estate investments in the U.S., 1972-1999”, Journal of Alternative Investments, 4(1), 1-7.
Fraser, W. D., Leishman, C. and Tarbert, H. (2002). “The long-run diversification attributes of commercial property”, Journal of Property Investment and Finance, 20(4), 354-373.
Frodsham, M. (2006). “IPD property derivatives: trading levels and volumes update”, paper presented to the IPD/IPF Property Derivatives Briefing, Brighton, November 2006.
Geltner, D. (1993). “Estimating market values from appraised values without assuming an efficient market”, Journal of Real Estate Research, 8(3), 325-346.
Geltner, D., Miller, N. G., Clayton, J. and Eichholtz, P. (2007). Commercial real estate analysis and investments, 2nd edition, Mason (OH): Thomson South-Western.
Geltner, D., MacGregor, B. D. and Schwann, G. M. (2003). “Appraisal smoothing and price discovery in real estate markets”, Urban Studies, 40(5-6), 1047-1064.
Glascock, J. L., Lu, C. and So, R. W. (2000). “Further evidence on the integration of REIT, bond, and stock returns”, Journal of Real Estate Finance and Economics, 20(2), 177-194.
Gold, R. B. (1996). “The use of MPT for real estate portfolios in an uncertain world”, Journal of Real Estate Portfolio Management, 2(2), 95-106.
79

Gordon, J. N., Canter, T. A. and Webb, J. R. (1998). “The effect of international real estate securities on portfolio diversification”, Journal of Real Estate Portfolio Management, 4(2), 83-92.
Graff, R., Harrington, A. and Young, M. (1997). “The shape of Australian real estate return distributions and comparisons to the United States”, Journal of Real Estate Research, 14(3), 291-308.
Gyourko, J. and Keim, D. (1992). “What does the stock market tell us about real estate returns?” Journal of the American Real Estate and Urban Economics Association, 20(3), 475-485.
Hamelink, F. and Hoesli, M. (2004a). “Maximum drawdown and the allocation to real estate”, Journal of Property Research, 21(1), 5-29.
Hamelink, F. and Hoesli, M. (2004b). “What factors determine international real estate security returns”, Real Estate Economics, 32(3), 437-462.
Hamelink, F., Hoesli, M., Lizieri, C. and MacGregor, B. D. (2000). “Homogeneous commercial property market groupings and portfolio construction in the United Kingdom”, Environment and Planning A, 32(2), 323-344.
Hartzell, D. J., Eichholtz, P. and Selender, A. (1993). “Economic diversification in European real estate portfolios”, Journal of Property Research, 10(1), 5-25.
Hartzell, D., Hekman, J. S. and Miles, M. E. (1987). “Real estate returns and inflation”, AREUEA Journal, 15(1), 617-637.
Hendershott, P. H. (1996). “Rental adjustment and valuation in overbuilt markets: evidence from the Sydney office market”, Journal of Urban Economics, 39(1), 51-67.
Hendershott, P. H. (2000). “Property asset bubbles: evidence from the Sydney office market”, Journal of Real Estate Finance and Economics, 20(1), 67-81.
Hendershott, P., Hendershott, R. and Ward, C. (2003). “Corporate equity and commercial property market ‘bubbles’”, Urban Studies, 40(5/6), 993-1009.
Hendershott, P. H. and MacGregor, B. D. (2005a). “Investor rationality: evidence from U.K. property capitalization rates”, Real Estate Economics, 33(2), 299–322.
Hendershott, P. H. and MacGregor, B. D. (2005b). “Investor rationality: an analysis of NCREIF commercial property data”, Journal of Real Estate Research, 27(4), 445-475.
Hobbs, P. (2006). Bridging the gap, London: Deutsche Bank Asset Management. Hoesli, M. and Hamelink, F. (1997). “An examination of the role of Geneva and Zurich
housing in Swiss institutional portfolios”, Journal of Property Valuation and Investment, 15(4), 354-371.
Hoesli, M., Lekander, J. and Witkiewicz, W. (2003). “Real estate in the institutional portfolio: a comparison of suggested and actual weights”, Journal of Alternative Investments, 7(3), 53-59.
Hoesli, M., Lekander, J. and Witkiewicz, W. (2004). “International evidence on real estate as a portfolio diversifier”, Journal of Real Estate Research, 26(2), 161-206.
Hoesli, M. and Lekander, J. (2005). “Suggested vs. actual institutional allocations to real estate in Europe: A matter of size?”, Journal of Alternative Investments, 8(2), 62-70.
Hoesli, M. and Lekander, J. (2007 forthcoming). “Real estate portfolio strategy and product innovation in Europe”, Journal of Property Investment and Finance.
Hoesli, M., Lizieri, C. M. and MacGregor, B. D. (1997). “The spatial dimensions of the investment performance of U.K. commercial property”, Urban Studies, 34(9), 1475-1494.
Hoesli, M., Lizieri, C. and MacGregor, B. (2007 forthcoming). “The inflation hedging characteristics of U.S. and U.K. investments: a multi-factor error correction approach”, Journal of Real Estate Finance and Economics.
80

Hoesli, M., MacGregor, B. D., Matysiak, G. A. and Nanthakumaran, N. (1997). “The short-term inflation-hedging characteristics of U.K. real estate”, Journal of Real Estate Finance and Economics, 15(1), 27-57.
Hoesli, M. and Serrano Moreno, C. (2007). “Securitized real estate and its link with financial assets and real estate: an international analysis”, Journal of Real Estate Literature, 15(1), 59-84.
ING Real Estate (2006). An introduction to infrastructure investment, London: ING Real Estate.
INREV (2006). “Core Definitions, December 2006”, Amsterdam: INREV. IPD (2006). Global Index: Consultation Release, London: Investment Property Databank. Jorion, P. (1985). “International portfolio diversification with estimation risk”, Journal of
Business, 58(3), 259-278. Kallberg, J. G., Liu, C. H. and Greig, D. W. (1996). “The role of real estate in the portfolio
allocation process”, Real Estate Economics, 24(3), 359-377. Knight, J., Lizieri, C. and Satchell, S. (2005). “Diversification when it hurts? The joint
distribution of real estate and equity markets”, Journal of Property Research, 22(4), 309-323.
Kutsch, N., McAllister, P. and Newell, G. (2006). Private property vehicles: the valuation of interests in limited partnerships, RICS Research Papers Series 6, No. 12.
Lai, T.-Y. and Wang, K. (1998). “Appraisal smoothing: the other side of the story”, Real Estate Economics, 26(3), 511-535.
La Salle Investment Management (2007). Investment Strategy Annual, 2007, Chicago: La Salle Investment Management.
Lee, S. L. (2001). “The relative importance of property type and regional factors in real estate returns”, Journal of Real Estate Portfolio Management, 7(2), 159-167.
Lee, S. and Stevenson, S. (2005). “The case for REITs in the mixed-asset portfolio in the short and long run”, Journal of Real Estate Portfolio Management, 11(1), 55-80.
Li, Y. and Wang, K. (1995). “The predictability of REIT returns and market segmentation”, Journal of Real Estate Research, 10(4), 471-482.
Liang, Y., Myer, F. C. N. and Webb, J. R. (1996). “The bootstrap efficient frontier for mixed-asset portfolios”, Real Estate Economics, 24(2), 247-256.
Lin, Z. and Vandell, K. D. (2006). “Illiquidity and pricing biases in the real estate market”, available at http://www.usc.edu/schools/sppd/lusk/research/pdf/wp-2006-1001.pdf.
Ling, D. C. and Naranjo, A. (1997). “Economic risk factors and commercial real estate returns”, Journal of Real Estate Finance and Economics, 14(3), 283-307.
Ling, D. C. and Naranjo, A. (1999). “The integration of commercial real estate markets and stock markets”, Real Estate Economics, 27(3), 483-515.
Ling, D. C. and Naranjo, A. (2002). “Commercial real estate return performance: a cross-country analysis”, Journal of Real Estate Finance and Economics, 24(1/2), 119-142.
Liu, C. H. and Mei, J. (1994). “An analysis of real-estate risk using the present value model”, Journal of Real Estate Finance and Economics, 8(1), 5-20.
Liu, C. H. and Mei, J. (1998). “The predictability of international real estate markets, exchange rate risks and diversification consequences”, Real Estate Economics, 26(1), 3-39.
Liu, C. H., Hartzell, D. J., Greig, W. and Grissom, T. V. (1990). “The integration of the real estate market and the stock market: some preliminary evidence”, Journal of Real Estate Finance and Economics, 3(3), 261–282.
Lizieri, C. and Bond, S. (2004). Defining Liquidity in Property, Investment Property Forum Liquidity in Commercial Property Working Paper 1, London: IPF.
81

Lizieri, C., McAllister, P. and Ward, C. (2003). “Continental shift? An analysis of convergence trends in European real estate equities”, Journal of Real Estate Research, 23(1), 1-23.
Lizieri, C., Satchell, S., Worzala, E. and Dacco, R. (1998). “Real interest regimes and real estate performance: a comparison of UK and US markets”, Journal of Real Estate Research, 16(3), 339-356.
Lizieri, C. M. and Ward, C. W. R. (2000). “Commercial real estate return distributions: a review of the literature and empirical evidence”, in J. Knight and S. Satchell (Eds), Return Distributions in Finance, 47–74, Oxford: Butterworth-Heinemann.
MacGregor, B. and Schwann, G. (2003). “Common features in UK commercial property returns”, Journal of Property Research, 20(1), 22-48.
Maitland-Smith, J. and Brooks, C. (1999). “Threshold autoregressive and Markov switching models: an Application to commercial real estate”, Journal of Property Research, 16(1), 1-19.
Malizia, E. E. and Simons, R. A. (1991). “Comparing regional classifications for real estate portfolio diversification”, Journal of Real Estate Research, 6(1), 53-77.
Maroney, N. and Naka, A. (2006). “Diversification benefits of Japanese real estate over the last four decades”, Journal of Real Estate Finance and Economics, 33(3), 259-274.
Matysiak, G. and Brown, G. (1997). “A time-varying analysis of abnormal performance of UK property companies”, Applied Financial Economics, 7(4), 367-377.
Maurer, R., Reiner, F. and Sebastian, S. (2004). “Characteristics of German real estate return distributions: evidence from Germany and comparisons to the U.S. and U.K.”, Journal of Real Estate Portfolio Management, 10(1), 59–76.
McAllister, P., Baum, A., Crosby, N., Gallimore, P. and Gray, A. (2004). “Appraiser behaviour and appraisal smoothing: some qualitative and quantitative evidence”, Journal of Property Research, 20(3), 261-280.
McAllister, P. and Lizieri, C. (2006). “Monetary integration and real estate markets: the impact of the Euro on European real estate equities”, Journal of Property Research, 23(4), 281-303.
Mei, J. and Lee, A. (1994). “Is there a real estate factor premium?” Journal of Real Estate Finance and Economics, 9(2), 113-126.
Mei, J. and Liu, C. H. (1994). “The predictability of real estate returns and market timing”, Journal of Real Estate Finance and Economics, 8(2), 115-135.
Mueller, G. R. (1993). “Refining economic diversification strategies for real estate portfolios”, Journal of Real Estate Research, 8(1), 55-68.
Myer, F. C. N. and Webb, J. R. (1993). “Return properties of equity REITs, common stocks and commercial real estate: a comparison”, Journal of Real Estate Research, 8(1), 87-106.
Newell, G. and Webb, J. (1996). “Assessing risk for international real estate investments”, Journal of Real Estate Research, 11(2), 103-115.
Okunev, J. and Wilson, P. (1996). “Evidence of segmentation in domestic and international property markets”, Journal of Property Finance 7(4), 78-97.
Okunev, J. and Wilson, P. (1997). “Using non-linear tests to examine integration between real estate and stock markets”, Real Estate Economics, 25(3), 487-503.
Pagliari, J. L., Jr., Scherer, K. A. and Monopoli, R. T. (2005). “Public versus private real estate equities: a more refined, long term comparison”, Real Estate Economics, 33(1), 147-187.
PREA (2006). An International Comparative Study of the Pension Plan Community and Real Estate Investments, with contributions by Worzala, E., Sirmans, C. F., Lizieri, C., Schulte, K.-W., Ooi, J., Hordijk, A. and Newell, G., Hartford (CT): Pensions Real Estate Association.
82

Property Funds Research (2006). The Indirect Real Estate Universe, Reading: Property Funds Research.
Quan, D. C. and Titman, S. (1997). “Commercial real estate prices and stock market returns: an international analysis”, Financial Analysts Journal, 53(3), 21-34.
Quan, D. C. and Titman, S. (1999). “Do real estate prices and stock prices move together? An international analysis”, Real Estate Economics, 27(2), 183-207.
Rakowski, J. (2004). “Infrastructure: a hidden gem?” Global Pensions, November 2004, 41. Riddiough, T., Moriaty, M. and Yeatman, P. (2005). “Privately versus publicly held asset
investment performance”, Real Estate Economics, 33(1), 121-146. Rubens, J. H., Louton, D. A. and Yobaccio, E. J. (1998). “Measuring the significance of
diversification gains”, Journal of Real Estate Research, 16(1), 73-86. Seck, D. (1996). “The substitutability of real estate assets”, Real Estate Economics, 24(1), 75–95. Seiler, M. J., Webb, J. R. and Myer, F. C. N. (1999). “Diversification issues in real estate
investment”, Journal of Real Estate Literature, 7(2), 163-179. Shilling, J. (2003). “Is there a risk premium puzzle in real estate”, Real Estate Economics,
31(4), 501-525. SIFM (2006). “Fact Book Global Addendum, 2006”, New York: Securities Industry and
Financial Markets. Sing, T. F. (2004). “Common risk factors and risk premia in direct and securitized real estate
markets”, Journal of Property Research, 21(3), 189-207. Sing, T. F. and Ong, S. E. (2000). “Asset allocation in a downside risk framework”, Journal
of Real Estate Portfolio Management, 6(3), 213-223. Stevenson, S. (2000). “International real estate diversification: empirical tests using hedged
indices”, Journal of Real Estate Research, 19(1/2), 105-131. Stevenson, S. (2001). “Bayes-Stein estimators and international real estate asset allocation”,
Journal of Real Estate Research, 21(1/2), 89-103. Stevenson, S. (2002). “Momentum effects and mean reversion in real estate securities”,
Journal of Real Estate Research, 23(1), 47-64. Tyrrell, N. (2007). “Solving the Leverage Riddle”, IPE Real Estate, January-February 2007,
14-15. Webb, R. B., Miles, M. and Guilkey, D. (1992). “Transactions-driven commercial real estate
returns: the panacea to asset allocation models?” Journal of the American Real Estate and Urban Economics Association, 20(2), 325-357.
Wheaton, W. C. and Torto, R. G. (1994). “Office market rent indices and their behavior over time”, Journal of Urban Economics, 35(2), 121-139.
Wilson, P. J. and Okunev, J. (1996). “Evidence of segmentation in domestic and international property markets”, Journal of Property Finance, 7(4), 78-97.
Worzala, E. M., Johnson, R. D. and Lizieri, C. M. (1997). “Currency swaps as a hedging technique for an international real estate investment, Journal of Property Finance, 8(2), 134-151.
Young, M. S. (2007 forthcoming). “Revisiting non-normal real estate return distributions by property type in the U.S.”, Journal of Real Estate Finance and Economics.
Young, M. S. and Graff, R. A. (1995). “Real estate is not normal: a fresh look at real estate return distributions”, Journal of Real Estate Finance and Economics, 10(3), 225-259.
Young, M. S., Lee, S. L., and Devaney, S. P. (2006). “Non-normal real estate return distributions by property type in the U.K.”, Journal of Property Research, 23(2), 109-133.
Ziobrowski, A. J., Caines, R. W. and Ziobrowski, B. J. (1999). “Mixed-asset portfolio composition with long-term holding periods and uncertainty”, Journal of Real Estate Portfolio Management, 5(2), 139-144.
83

Ziobrowski, A. J., Cheng, P. and Ziobrowski, B. J. (1997). “Using a bootstrap to measure optimum mixed-asset portfolio composition: a comment”, Real Estate Economics, 25(4), 695-705.
Ziobrowski, B. J. and Ziobrowski, A. J.. (1997). “Higher real estate risk and mixed-asset portfolio performance”, Journal of Real Estate Portfolio Management, 3(2), 107-115.
Ziobrowski, A. J., Ziobrowski, B. J. and Rosenberg, S. (1997). “Currency swaps and international real estate investment”, Real Estate Economics, 25(2), 223-251.
84

APPENDIX: ACRONYMS ALM Asset-Liability Matching APT Arbitrage Pricing Theory AREF The Association of Real Estate Funds ASX Australian Stock Exchange CAPM The Capital Asset Pricing Model CMBS Commercial Mortgage Backed Securities CPI Consumer Price Index ECM Error Correction Mechanism EPRA The European Public Real Estate Association FT Financial Times FTSE Financial Times - Stock Exchange INREV The European Association for Investors in Non-listed Real Estate Vehicles IPD Investment Property Databank GAV Gross Asset Value GDP Gross Domestic Product GIPS Global Investment Performance Standards LIBOR London Inter-Bank Offer Rate LPTs Listed Property Trusts (Australian REITs) MIT Massachusetts Institute of Technology MPT Modern Portfolio Theory NAREIT National Association of Real Estate Investment Trusts NAV Net Asset Value NCREIF National Council of Real Estate Investment Fiduciaries ONS Office for National Statistics (UK) PCA Property Council of Australia / Principal Components Analysis PREA The Pensions Real Estate Association (USA) REIT Real Estate Investment Trust RPIX Retail Price Index excluding mortgage costs TBI Transactions Based Index VaR Value at Risk VAR Vector AutoRegression
85