Real estate market report colletion the woodlands tx july august 2012
Upload
ken-brandCategory
view
341download
1
The$Home$Sales$Real$Estate$Sales$Report$$The$Woodlands$|$September$2013$Lis<ng$Inventory$Month$By$Month$Home$Sales$Month$By$Month$$Average$Sold$Price$/$Median$Sold$Price$–$Month$By$Month$Average$Price$Per$Square$Foot$–$Month$By$Month$Average$Days$On$Market$–$Month$By$Month$Months$Supply$of$For$Sale$Inventory$–$Month$By$Month$$$
9000 Forest Crossing Drive | The Woodlands TX 77381 | 281-367-3531
281-367-3531
Jan Feb Mar Apr May Jun Jul Aug Sep Oct Nov Dec20132012201120102009
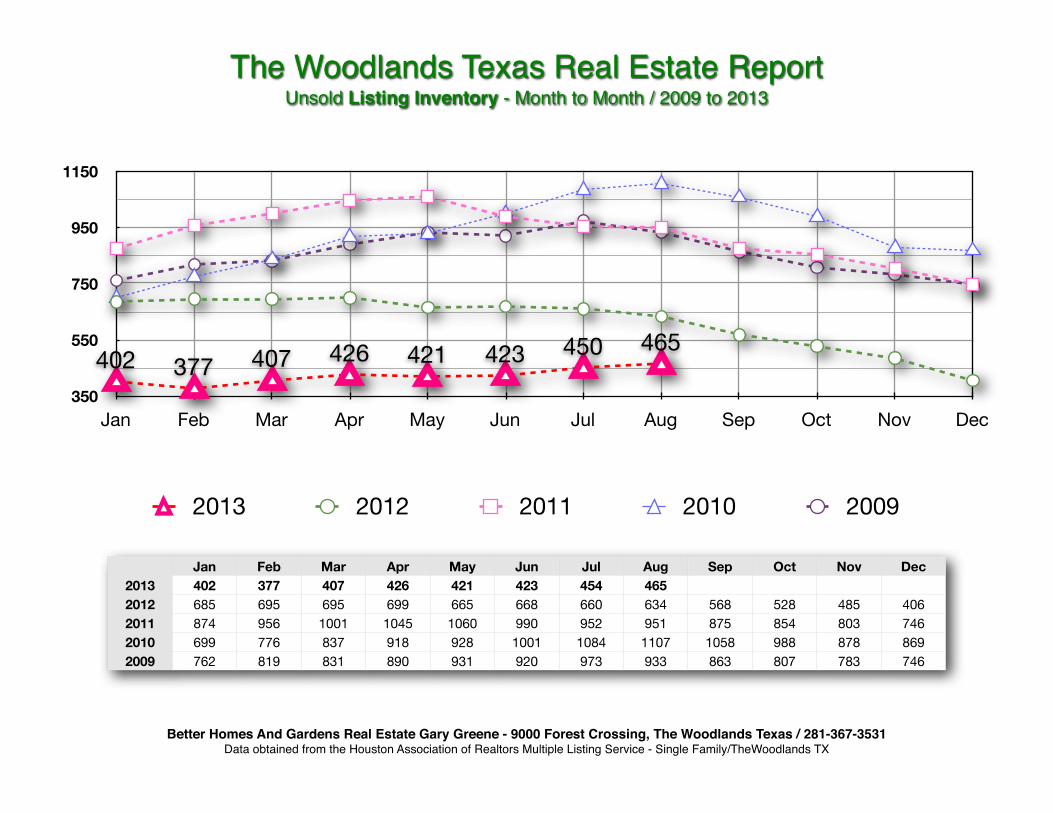
402 377 407 426 421 423 454 465685 695 695 699 665 668 660 634 568 528 485 406874 956 1001 1045 1060 990 952 951 875 854 803 746699 776 837 918 928 1001 1084 1107 1058 988 878 869762 819 831 890 931 920 973 933 863 807 783 746
350
550
750
950
1150
Jan Feb Mar Apr May Jun Jul Aug Sep Oct Nov Dec
402 377 407 426 421 423 450 465
2013 2012 2011 2010 2009
The Woodlands Texas Real Estate ReportUnsold Listing Inventory - Month to Month / 2009 to 2013
Better Homes And Gardens Real Estate Gary Greene - 9000 Forest Crossing, The Woodlands Texas / 281-367-3531Data obtained from the Houston Association of Realtors Multiple Listing Service - Single Family/TheWoodlands TX
Jan Feb Mar Apr May Jun Jul Aug Sep Oct Nov Dec20132012201120102009
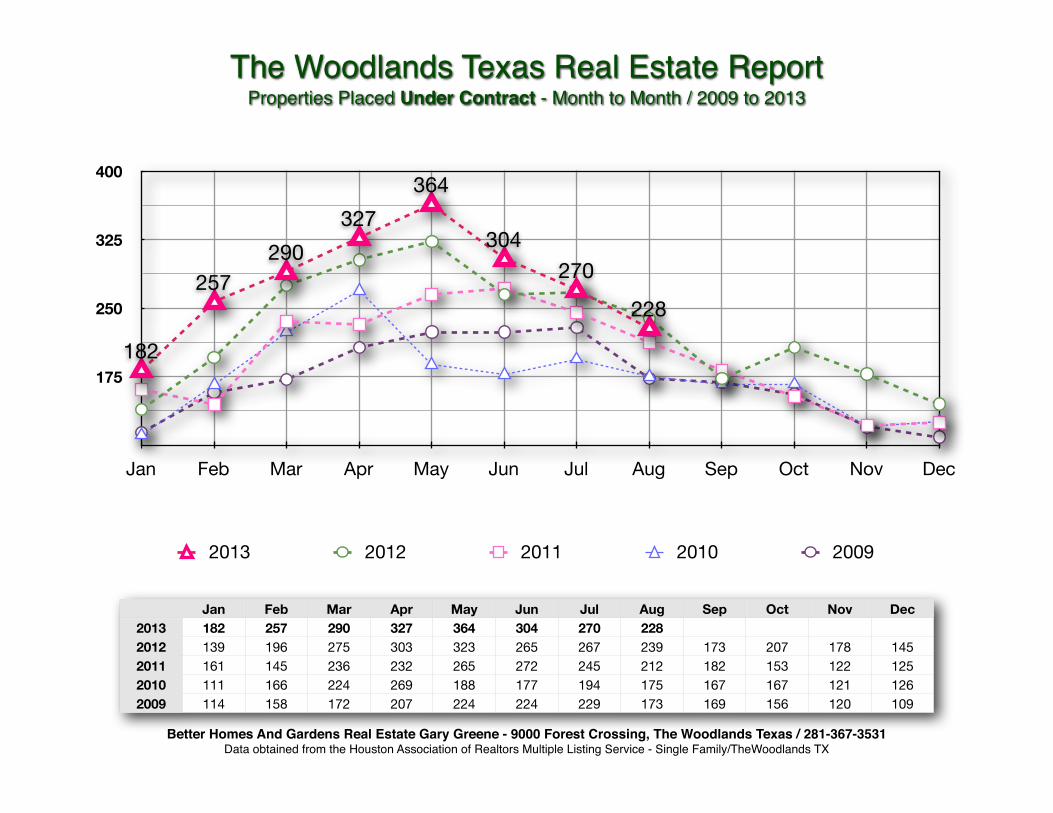
182 257 290 327 364 304 270 228139 196 275 303 323 265 267 239 173 207 178 145161 145 236 232 265 272 245 212 182 153 122 125111 166 224 269 188 177 194 175 167 167 121 126114 158 172 207 224 224 229 173 169 156 120 109
175
250
325
400
Jan Feb Mar Apr May Jun Jul Aug Sep Oct Nov Dec
182
257290
327364
304270
228
2013 2012 2011 2010 2009
The Woodlands Texas Real Estate ReportProperties Placed Under Contract - Month to Month / 2009 to 2013
Better Homes And Gardens Real Estate Gary Greene - 9000 Forest Crossing, The Woodlands Texas / 281-367-3531Data obtained from the Houston Association of Realtors Multiple Listing Service - Single Family/TheWoodlands TX
KEY INFORMATION
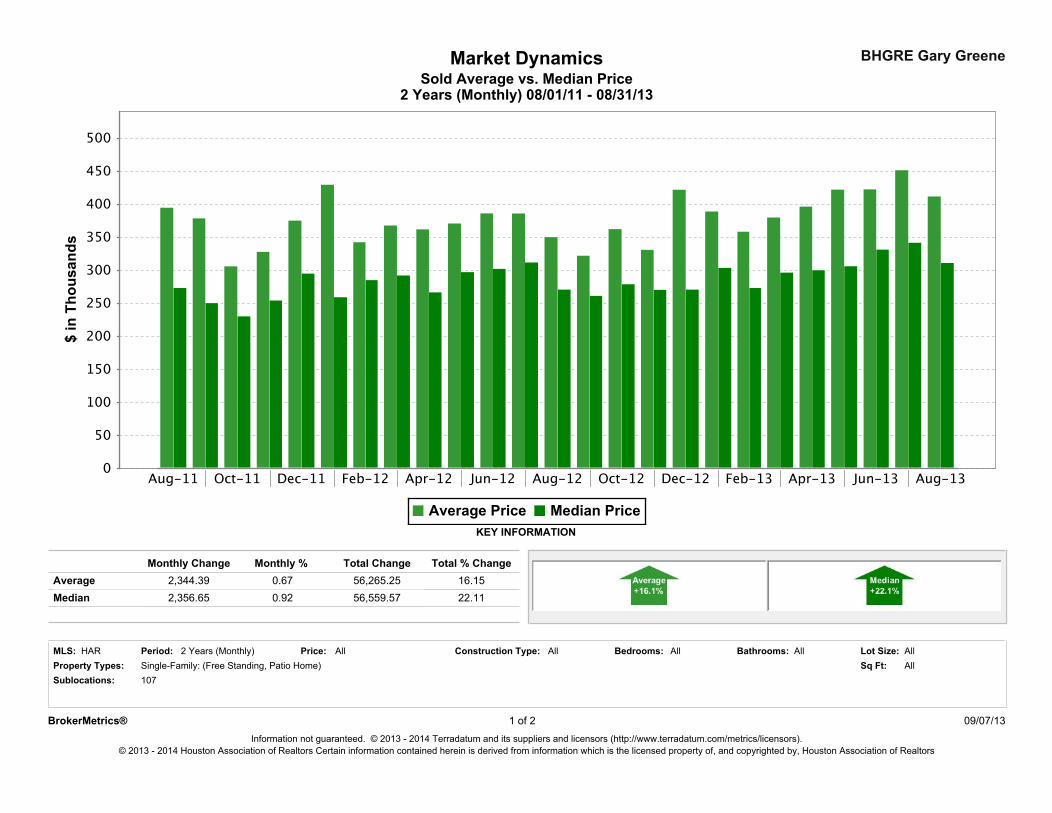
2 Years (Monthly) 08/01/11 - 08/31/13
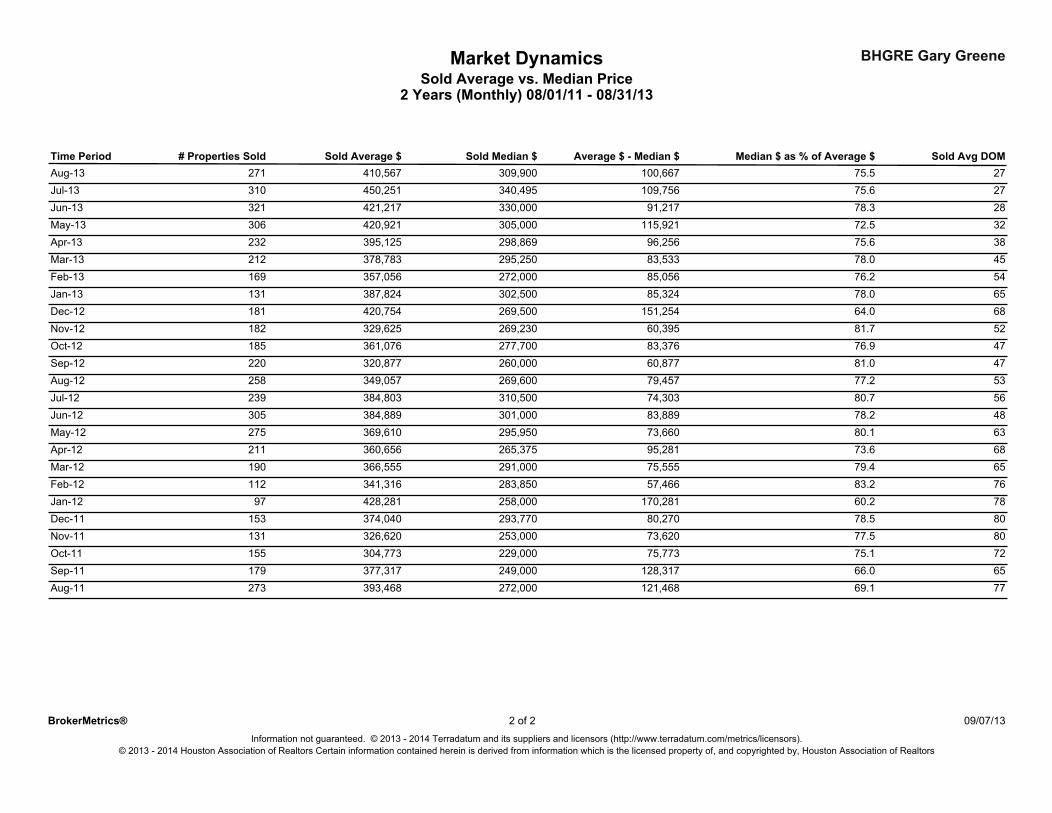
Market Dynamics BHGRE Gary GreeneSold Average vs. Median Price
Monthly % Total % Change
22.110.67
Monthly Change
2,356.65Median
Total ChangeAverage 2,344.39 56,265.25 16.15
56,559.570.92
Sublocations:All
Bathrooms:Single-Family: (Free Standing, Patio Home) Sq Ft:
HAR AllAll AllAllAll Lot Size:Bedrooms:Property Types:
107
2 Years (Monthly) Construction Type:Price:Period:MLS:
09/07/13BrokerMetrics®Information not guaranteed. © 2013 - 2014 Terradatum and its suppliers and licensors (http://www.terradatum.com/metrics/licensors).
© 2013 - 2014 Houston Association of Realtors Certain information contained herein is derived from information which is the licensed property of, and copyrighted by, Houston Association of Realtors
1 of 2
Average Price Median Price
Aug-11 Oct-11 Dec-11 Feb-12 Apr-12 Jun-12 Aug-12 Oct-12 Dec-12 Feb-13 Apr-13 Jun-13 Aug-130
50
100
150
200
250
300
350
400
450
500
$ in
Tho
usan
ds
BHGRE Gary Greene
2 Years (Monthly) 08/01/11 - 08/31/13
Market DynamicsSold Average vs. Median Price
Time Period # Properties Sold Sold Average $ Sold Median $ Sold Avg DOMAverage $ - Median $ Median $ as % of Average $271Aug-13 410,567 75.5309,900 100,667 27310Jul-13 450,251 75.6340,495 109,756 27321Jun-13 421,217 78.3330,000 91,217 28306May-13 420,921 72.5305,000 115,921 32232Apr-13 395,125 75.6298,869 96,256 38212Mar-13 378,783 78.0295,250 83,533 45169Feb-13 357,056 76.2272,000 85,056 54131Jan-13 387,824 78.0302,500 85,324 65181Dec-12 420,754 64.0269,500 151,254 68182Nov-12 329,625 81.7269,230 60,395 52185Oct-12 361,076 76.9277,700 83,376 47220Sep-12 320,877 81.0260,000 60,877 47258Aug-12 349,057 77.2269,600 79,457 53239Jul-12 384,803 80.7310,500 74,303 56305Jun-12 384,889 78.2301,000 83,889 48275May-12 369,610 80.1295,950 73,660 63211Apr-12 360,656 73.6265,375 95,281 68190Mar-12 366,555 79.4291,000 75,555 65112Feb-12 341,316 83.2283,850 57,466 76
97Jan-12 428,281 60.2258,000 170,281 78153Dec-11 374,040 78.5293,770 80,270 80131Nov-11 326,620 77.5253,000 73,620 80155Oct-11 304,773 75.1229,000 75,773 72179Sep-11 377,317 66.0249,000 128,317 65273Aug-11 393,468 69.1272,000 121,468 77
© 2013 - 2014 Houston Association of Realtors Certain information contained herein is derived from information which is the licensed property of, and copyrighted by, Houston Association of Realtors
2 09/07/132 ofBrokerMetrics®Information not guaranteed. © 2013 - 2014 Terradatum and its suppliers and licensors (http://www.terradatum.com/metrics/licensors).
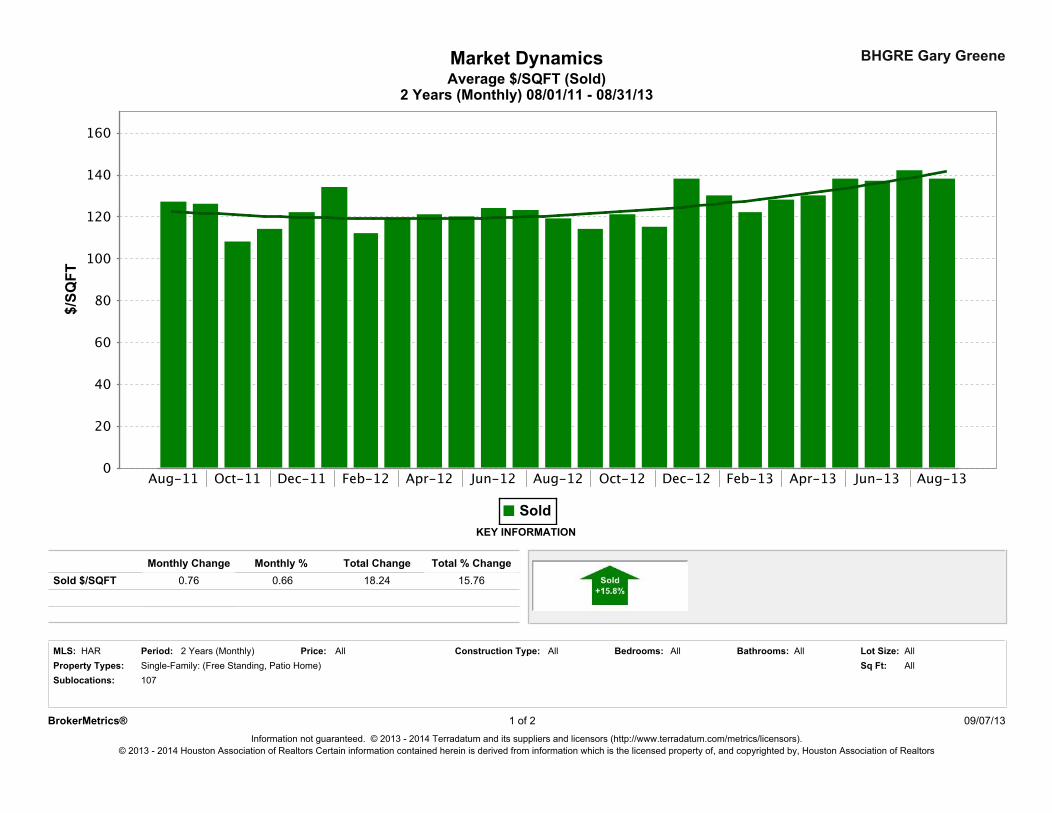
Market DynamicsAverage $/SQFT (Sold)
2 Years (Monthly) 08/01/11 - 08/31/13
BHGRE Gary Greene
Price:
0.66
AllAll All
18.24
Property Types:HAR
Sold $/SQFT
MLS: AllBathrooms:
0.76
All Construction Type:
Total Change
Sq Ft:
Monthly Change
2 Years (Monthly)
Sublocations:
All
15.76
Lot Size:Period:
Monthly %
Bedrooms:
KEY INFORMATION
Total % Change
Single-Family: (Free Standing, Patio Home)107
09/07/13BrokerMetrics®Information not guaranteed. © 2013 - 2014 Terradatum and its suppliers and licensors (http://www.terradatum.com/metrics/licensors).
© 2013 - 2014 Houston Association of Realtors Certain information contained herein is derived from information which is the licensed property of, and copyrighted by, Houston Association of Realtors
1 of 2
Sold
Aug-11 Oct-11 Dec-11 Feb-12 Apr-12 Jun-12 Aug-12 Oct-12 Dec-12 Feb-13 Apr-13 Jun-13 Aug-130
20
40
60
80
100
120
140
160
$/SQ
FT
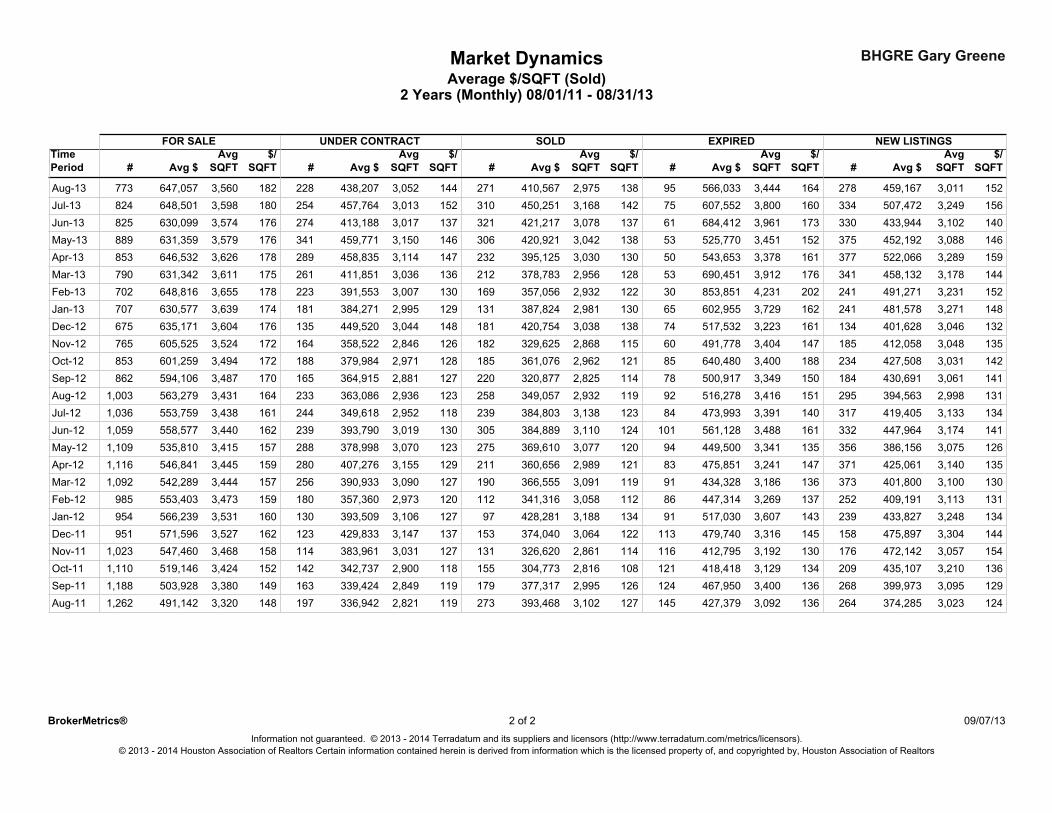
Average $/SQFT (Sold)2 Years (Monthly) 08/01/11 - 08/31/13
Market Dynamics BHGRE Gary Greene
#
FOR SALE
SQFTPeriod$/Avg
SQFTTime
Avg $
UNDER CONTRACT
# Avg $Avg
SQFT$/
SQFT
SOLD EXPIRED NEW LISTINGS
# # #Avg $ Avg $ Avg $Avg
SQFT$/
SQFTAvg
SQFT$/
SQFTAvg
SQFT$/
SQFT
182Aug-13 773 3,560647,057 228 438,207 3,052 144 271 95 278410,567 566,033 459,1672,975 138 3,444 164 3,011 152180Jul-13 824 3,598648,501 254 457,764 3,013 152 310 75 334450,251 607,552 507,4723,168 142 3,800 160 3,249 156176Jun-13 825 3,574630,099 274 413,188 3,017 137 321 61 330421,217 684,412 433,9443,078 137 3,961 173 3,102 140176May-13 889 3,579631,359 341 459,771 3,150 146 306 53 375420,921 525,770 452,1923,042 138 3,451 152 3,088 146178Apr-13 853 3,626646,532 289 458,835 3,114 147 232 50 377395,125 543,653 522,0663,030 130 3,378 161 3,289 159175Mar-13 790 3,611631,342 261 411,851 3,036 136 212 53 341378,783 690,451 458,1322,956 128 3,912 176 3,178 144178Feb-13 702 3,655648,816 223 391,553 3,007 130 169 30 241357,056 853,851 491,2712,932 122 4,231 202 3,231 152174Jan-13 707 3,639630,577 181 384,271 2,995 129 131 65 241387,824 602,955 481,5782,981 130 3,729 162 3,271 148176Dec-12 675 3,604635,171 135 449,520 3,044 148 181 74 134420,754 517,532 401,6283,038 138 3,223 161 3,046 132172Nov-12 765 3,524605,525 164 358,522 2,846 126 182 60 185329,625 491,778 412,0582,868 115 3,404 147 3,048 135172Oct-12 853 3,494601,259 188 379,984 2,971 128 185 85 234361,076 640,480 427,5082,962 121 3,400 188 3,031 142170Sep-12 862 3,487594,106 165 364,915 2,881 127 220 78 184320,877 500,917 430,6912,825 114 3,349 150 3,061 141164Aug-12 1,003 3,431563,279 233 363,086 2,936 123 258 92 295349,057 516,278 394,5632,932 119 3,416 151 2,998 131161Jul-12 1,036 3,438553,759 244 349,618 2,952 118 239 84 317384,803 473,993 419,4053,138 123 3,391 140 3,133 134162Jun-12 1,059 3,440558,577 239 393,790 3,019 130 305 101 332384,889 561,128 447,9643,110 124 3,488 161 3,174 141157May-12 1,109 3,415535,810 288 378,998 3,070 123 275 94 356369,610 449,500 386,1563,077 120 3,341 135 3,075 126159Apr-12 1,116 3,445546,841 280 407,276 3,155 129 211 83 371360,656 475,851 425,0612,989 121 3,241 147 3,140 135157Mar-12 1,092 3,444542,289 256 390,933 3,090 127 190 91 373366,555 434,328 401,8003,091 119 3,186 136 3,100 130159Feb-12 985 3,473553,403 180 357,360 2,973 120 112 86 252341,316 447,314 409,1913,058 112 3,269 137 3,113 131160Jan-12 954 3,531566,239 130 393,509 3,106 127 97 91 239428,281 517,030 433,8273,188 134 3,607 143 3,248 134162Dec-11 951 3,527571,596 123 429,833 3,147 137 153 113 158374,040 479,740 475,8973,064 122 3,316 145 3,304 144158Nov-11 1,023 3,468547,460 114 383,961 3,031 127 131 116 176326,620 412,795 472,1422,861 114 3,192 130 3,057 154152Oct-11 1,110 3,424519,146 142 342,737 2,900 118 155 121 209304,773 418,418 435,1072,816 108 3,129 134 3,210 136149Sep-11 1,188 3,380503,928 163 339,424 2,849 119 179 124 268377,317 467,950 399,9732,995 126 3,400 136 3,095 129148Aug-11 1,262 3,320491,142 197 336,942 2,821 119 273 145 264393,468 427,379 374,2853,102 127 3,092 136 3,023 124
© 2013 - 2014 Houston Association of Realtors Certain information contained herein is derived from information which is the licensed property of, and copyrighted by, Houston Association of Realtors
2 09/07/132 ofBrokerMetrics®Information not guaranteed. © 2013 - 2014 Terradatum and its suppliers and licensors (http://www.terradatum.com/metrics/licensors).
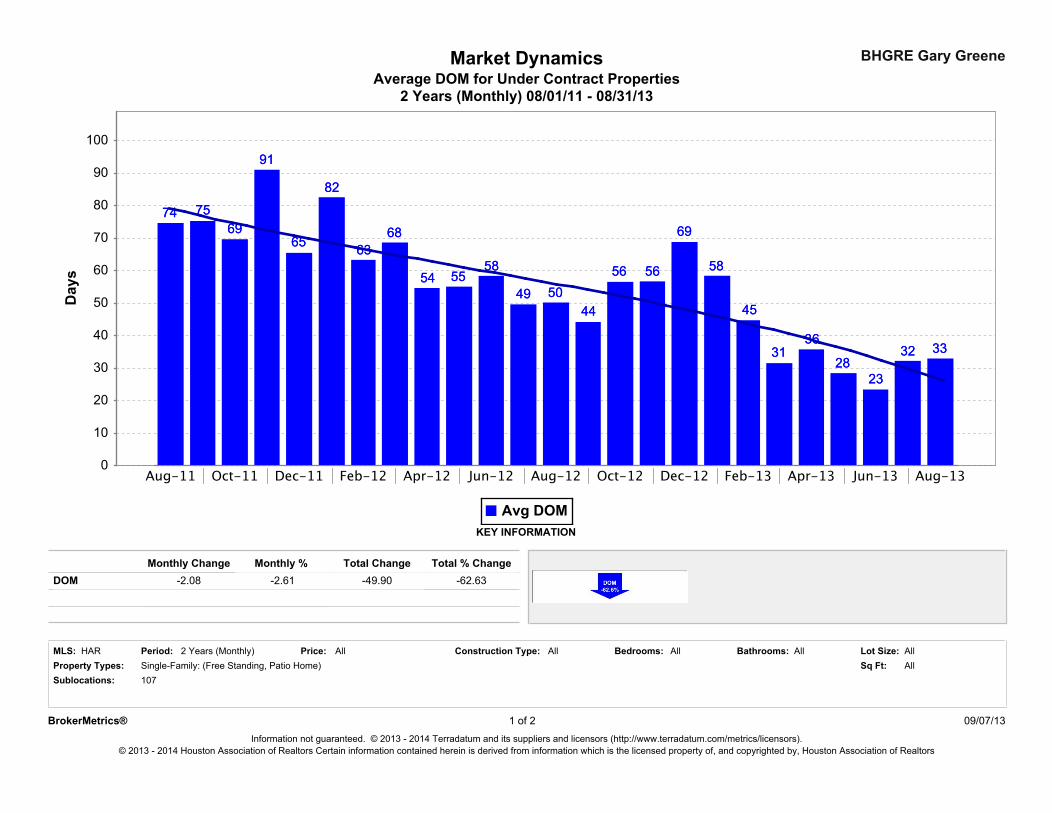
BHGRE Gary GreeneMarket Dynamics
2 Years (Monthly) 08/01/11 - 08/31/13Average DOM for Under Contract Properties
Monthly % -2.08
107
Total % Change
Sq Ft:Bathrooms:All All
DOM
Construction Type:
Sublocations:
Period:Property Types:
-49.90 -62.63Monthly Change
-2.61
Lot Size:All
KEY INFORMATION
Single-Family: (Free Standing, Patio Home) AllHAR AllBedrooms:
Total Change
AllMLS: Price:2 Years (Monthly)
Information not guaranteed. © 2013 - 2014 Terradatum and its suppliers and licensors (http://www.terradatum.com/metrics/licensors).
BrokerMetrics® 1 of 2
© 2013 - 2014 Houston Association of Realtors Certain information contained herein is derived from information which is the licensed property of, and copyrighted by, Houston Association of Realtors
09/07/13
Avg DOM
Aug-11 Oct-11 Dec-11 Feb-12 Apr-12 Jun-12 Aug-12 Oct-12 Dec-12 Feb-13 Apr-13 Jun-13 Aug-130
10
20
30
40
50
60
70
80
90
100
Day
s
74 7569
91
65
82
6368
54 5558
49 5044
56 56
69
58
45
3136
2823
32 33
74 7569
91
65
82
6368
54 5558
49 5044
56 56
69
58
45
3136
2823
32 33
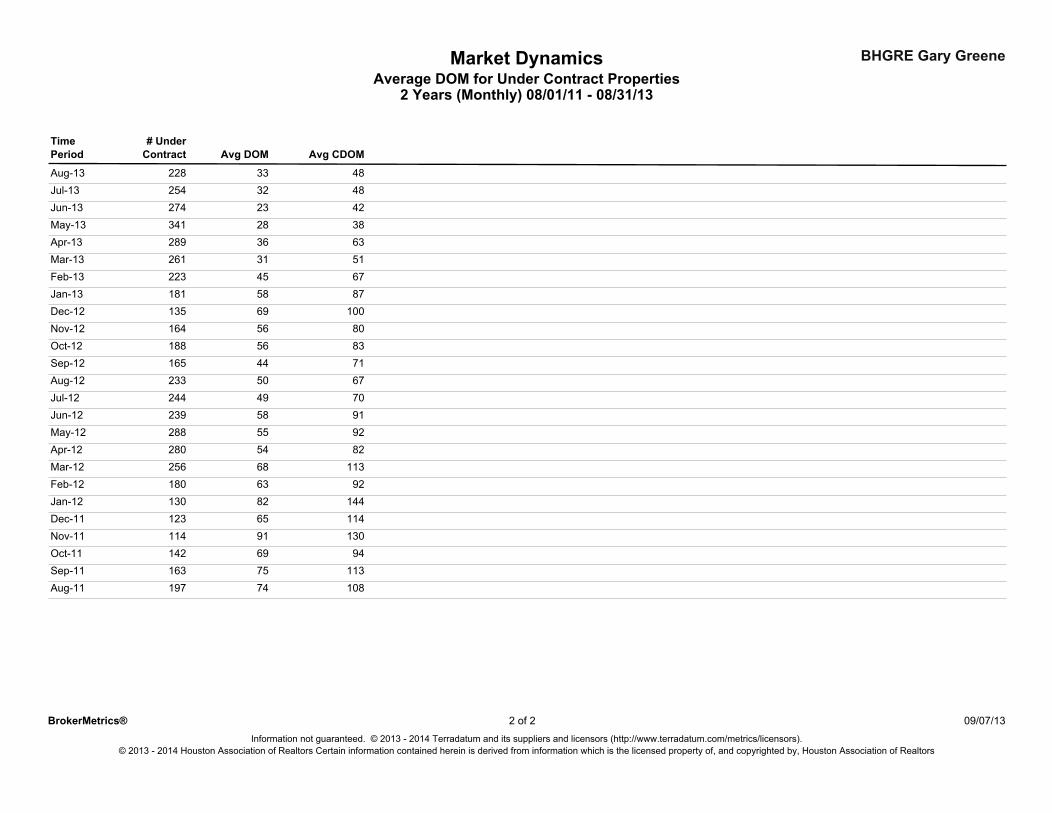
Average DOM for Under Contract PropertiesMarket Dynamics BHGRE Gary Greene
2 Years (Monthly) 08/01/11 - 08/31/13
Period Avg DOM Avg CDOMContract# UnderTime
33Aug-13 4822832Jul-13 4825423Jun-13 4227428May-13 3834136Apr-13 6328931Mar-13 5126145Feb-13 6722358Jan-13 8718169Dec-12 10013556Nov-12 8016456Oct-12 8318844Sep-12 7116550Aug-12 6723349Jul-12 7024458Jun-12 9123955May-12 9228854Apr-12 8228068Mar-12 11325663Feb-12 9218082Jan-12 14413065Dec-11 11412391Nov-11 13011469Oct-11 9414275Sep-11 11316374Aug-11 108197
2
© 2013 - 2014 Houston Association of Realtors Certain information contained herein is derived from information which is the licensed property of, and copyrighted by, Houston Association of Realtors
09/07/13Information not guaranteed. © 2013 - 2014 Terradatum and its suppliers and licensors (http://www.terradatum.com/metrics/licensors).
BrokerMetrics® 2 of
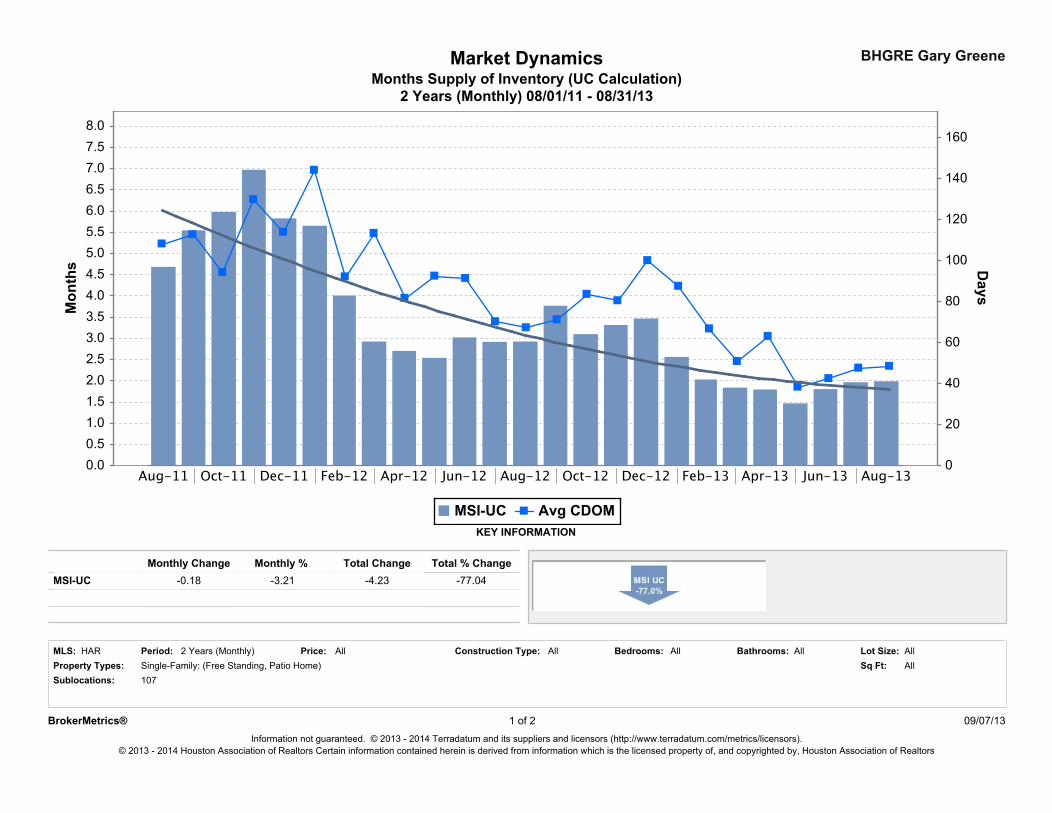
Months Supply of Inventory (UC Calculation)Market Dynamics
2 Years (Monthly) 08/01/11 - 08/31/13
BHGRE Gary Greene
Sublocations:
-77.04
Price:HAR Bedrooms:Period:
Monthly % MSI-UC
2 Years (Monthly)
107
-3.21
Single-Family: (Free Standing, Patio Home)
Total % Change
Property Types:
KEY INFORMATION
AllAll Lot Size:All
-4.23Monthly Change
-0.18Total Change
Sq Ft:AllAll Bathrooms:MLS: AllConstruction Type:
Information not guaranteed. © 2013 - 2014 Terradatum and its suppliers and licensors (http://www.terradatum.com/metrics/licensors).
BrokerMetrics® 1 of 2
© 2013 - 2014 Houston Association of Realtors Certain information contained herein is derived from information which is the licensed property of, and copyrighted by, Houston Association of Realtors
09/07/13
MSI-UC Avg CDOM
Aug-11 Oct-11 Dec-11 Feb-12 Apr-12 Jun-12 Aug-12 Oct-12 Dec-12 Feb-13 Apr-13 Jun-13 Aug-130.00.51.01.52.02.53.03.54.04.55.05.56.06.57.07.58.0
Mon
ths
0
20
40
60
80
100
120
140
160
Days
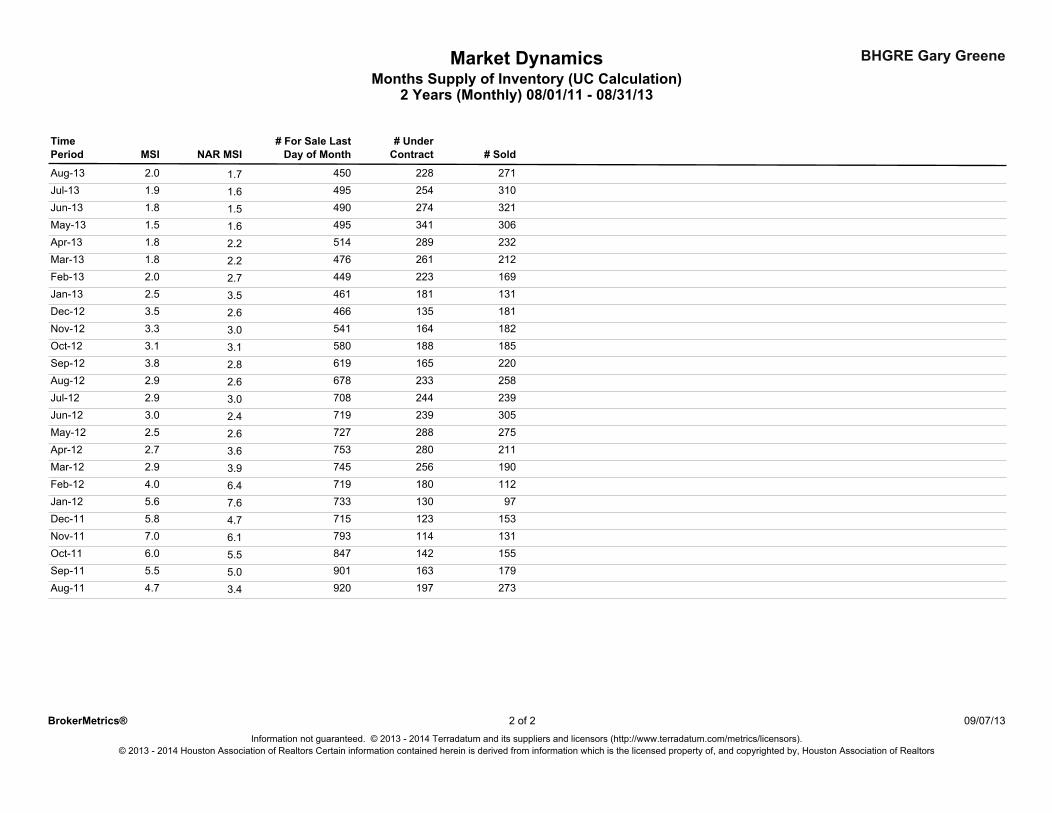
BHGRE Gary GreeneMarket DynamicsMonths Supply of Inventory (UC Calculation)
2 Years (Monthly) 08/01/11 - 08/31/13
Period NAR MSI # SoldMSI# For Sale Last
Day of Month# Under
ContractTime
1.7Aug-13 228 2714502.0
1.6Jul-13 254 3104951.9
1.5Jun-13 274 3214901.8
1.6May-13 341 3064951.5
2.2Apr-13 289 2325141.8
2.2Mar-13 261 2124761.8
2.7Feb-13 223 1694492.0
3.5Jan-13 181 1314612.5
2.6Dec-12 135 1814663.5
3.0Nov-12 164 1825413.3
3.1Oct-12 188 1855803.1
2.8Sep-12 165 2206193.8
2.6Aug-12 233 2586782.9
3.0Jul-12 244 2397082.9
2.4Jun-12 239 3057193.0
2.6May-12 288 2757272.5
3.6Apr-12 280 2117532.7
3.9Mar-12 256 1907452.9
6.4Feb-12 180 1127194.0
7.6Jan-12 130 977335.6
4.7Dec-11 123 1537155.8
6.1Nov-11 114 1317937.0
5.5Oct-11 142 1558476.0
5.0Sep-11 163 1799015.5
3.4Aug-11 197 2739204.7
2
© 2013 - 2014 Houston Association of Realtors Certain information contained herein is derived from information which is the licensed property of, and copyrighted by, Houston Association of Realtors
09/07/13Information not guaranteed. © 2013 - 2014 Terradatum and its suppliers and licensors (http://www.terradatum.com/metrics/licensors).
BrokerMetrics® 2 of
! Page 1 9000 Forest Crossing The Woodlands, Texas 77381 Office: 281.367.3531 or 800.932.7253
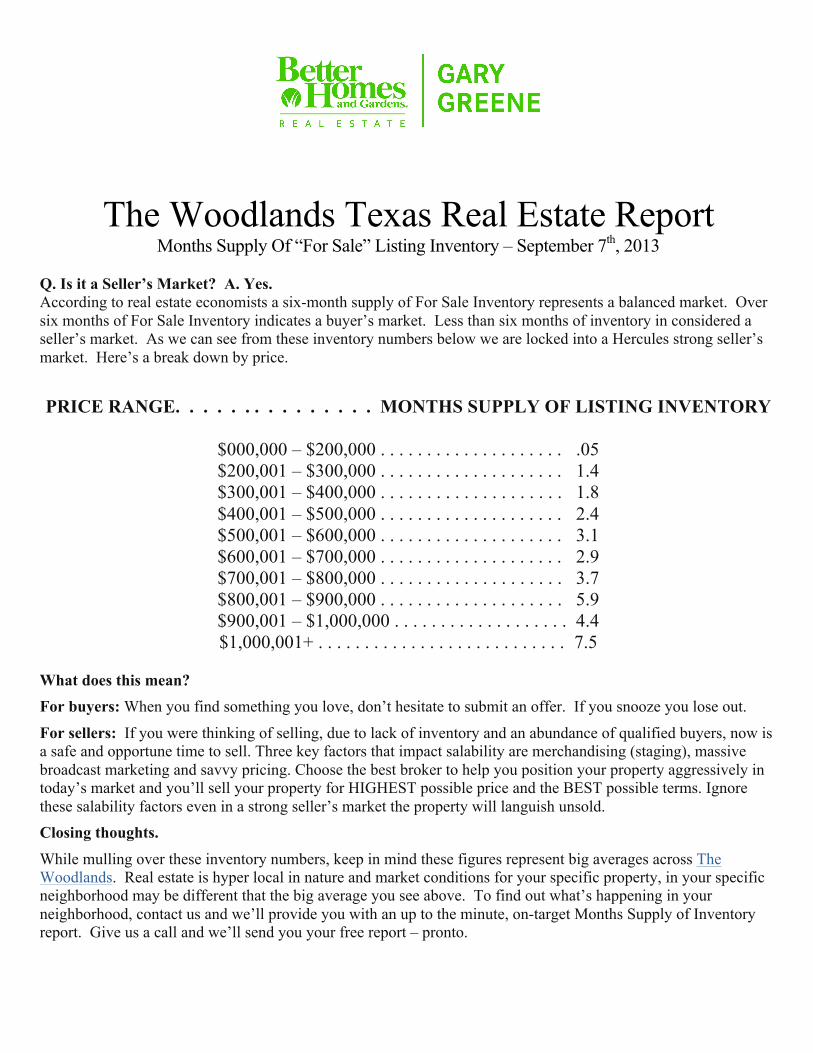
The Woodlands Texas Real Estate Report Months Supply Of “For Sale” Listing Inventory – September 7th, 2013
Q. Is it a Seller’s Market? A. Yes. According to real estate economists a six-month supply of For Sale Inventory represents a balanced market. Over six months of For Sale Inventory indicates a buyer’s market. Less than six months of inventory in considered a seller’s market. As we can see from these inventory numbers below we are locked into a Hercules strong seller’s market. Here’s a break down by price.
PRICE RANGE. . . . . . . . . . . . . . . MONTHS SUPPLY OF LISTING INVENTORY
$000,000 – $200,000 . . . . . . . . . . . . . . . . . . . . .05 $200,001 – $300,000 . . . . . . . . . . . . . . . . . . . . 1.4 $300,001 – $400,000 . . . . . . . . . . . . . . . . . . . . 1.8 $400,001 – $500,000 . . . . . . . . . . . . . . . . . . . . 2.4 $500,001 – $600,000 . . . . . . . . . . . . . . . . . . . . 3.1 $600,001 – $700,000 . . . . . . . . . . . . . . . . . . . . 2.9 $700,001 – $800,000 . . . . . . . . . . . . . . . . . . . . 3.7 $800,001 – $900,000 . . . . . . . . . . . . . . . . . . . . 5.9 $900,001 – $1,000,000 . . . . . . . . . . . . . . . . . . . 4.4 $1,000,001+ . . . . . . . . . . . . . . . . . . . . . . . . . . . 7.5
What does this mean? For buyers: When you find something you love, don’t hesitate to submit an offer. If you snooze you lose out. For sellers: If you were thinking of selling, due to lack of inventory and an abundance of qualified buyers, now is a safe and opportune time to sell. Three key factors that impact salability are merchandising (staging), massive broadcast marketing and savvy pricing. Choose the best broker to help you position your property aggressively in today’s market and you’ll sell your property for HIGHEST possible price and the BEST possible terms. Ignore these salability factors even in a strong seller’s market the property will languish unsold. Closing thoughts. While mulling over these inventory numbers, keep in mind these figures represent big averages across The Woodlands. Real estate is hyper local in nature and market conditions for your specific property, in your specific neighborhood may be different that the big average you see above. To find out what’s happening in your neighborhood, contact us and we’ll provide you with an up to the minute, on-target Months Supply of Inventory report. Give us a call and we’ll send you your free report – pronto.