Real Cost Escalation Forecasts to 2017 – Australia and ... cost escalation forecasts...4. GAS...
91
ECONOMICS Real Cost Escalation Forecasts to 2017 – Australia and Victoria Prepared by BIS Shrapnel for APA Group FINAL REPORT MARCH • 2012
-
Upload
phungkhanh -
Category
Documents
-
view
222 -
download
2
Transcript of Real Cost Escalation Forecasts to 2017 – Australia and ... cost escalation forecasts...4. GAS...

ECONOMICS
Real Cost Escalation Forecasts to 2017 – Australia and Victoria
Prepared by BIS Shrapnel for APA Group FINAL REPORT
MARCH • 2012
© BIS Shrapnel Pty Limited March 2012
Note: Although great care has been taken to ensure accuracy and completeness in this project, no legal responsibility can be accepted by BIS Shrapnel Pty Limited for the information and opinions expressed in this report.
All rights reserved.
Job no: E5681
BIS Shrapnel contact: Richard Robinson Associate Director – Economics Kishti Sen Economist BIS Shrapnel Pty Limited Level 8, 99 Walker Street North Sydney, NSW 2060 Australia Tel. +61 (02) 8458 4200 Fax +61 (02) 9959 5795 [email protected] [email protected]
BIS Shrapnel welcomes any feedback concerning the forecasts or methodology used in this report as well as any suggestions
for future improvement.
APA Group Real Cost Escalation Forecasts to 2017, March 2012
© BIS Shrapnel Pty Limited 2012
Contents
SUMMARY ........................................................................................................................ I
1. INTRODUCTION, OUTLINE OF REPORT & DATA SOURCES ..................................... 1
2. MACROECONOMIC OVERVIEW — AUSTRALIA AND VICTORIA ............................... 3
2.1 The Australian economy ........................................................................................................ 3
2.1.1 Current State of Play ................................................................................................... 3
2.1.2 Outlook for the Australian economy ............................................................................ 5
2.2 The Victorian Economy ........................................................................................................ 10
2.2.1 Outlook for the Victorian Economy ............................................................................ 11
3. OUTLOOK FOR AUSTRALIAN INFLATION AND ALL INDUSTRIES WAGES ........... 13
3.1 Outlook for Australian All Industries Wages ........................................................................ 16
3.2 Outlook for Consumer Price Inflation ................................................................................... 17
3.2.1 Reserve Bank of Australia CPI forecasts .................................................................. 23
4. GAS PIPELINE-RELATED LABOUR COST ESCALATION ......................................... 25
4.1 Key points ............................................................................................................................ 25
4.2 Key Drivers of Sustained Strong Growth in Underlying Wages Growth (Labour Price Index) in the National Utilities Sector .............................................................................................. 27
4.3 Overall Growth in Labour Costs (AWOTE Growth) ............................................................. 39
4.4 Outlook for utilities wages growth in Victoria ....................................................................... 41
4.5 Productivity Adjustments ...................................................................................................... 44
4.5.1 Deloitte Access Economics’ productivity growth forecasts are too optimistic ........... 45
4.5.2 Deloitte Access Economics application of long-term averages to generate productivity forecasts has previously been rejected by the AER ............................... 47
4.5.3 BIS Shrapnel’s View of Productivity .......................................................................... 48
4.6 Competitor Industry Wages Growth ..................................................................................... 51
4.6.1 Construction Wages .................................................................................................. 51
4.6.2 Mining Wages ............................................................................................................ 51
4.6.3 Manufacturing Wages ................................................................................................ 51
5. GENERAL LABOUR COST ESCALATION ................................................................... 55
5.1 Victoria Wage forecasts for General Labour ........................................................................ 56
5.2 Productivity-Adjusted Wage Forecasts for General Labour ................................................ 57
6. CONTRACTOR ESCALATION ...................................................................................... 59
6.1 Construction Sector Wages Growth in Victoria .................................................................... 59
6.2 Productivity-Adjusted Wage Forecasts for Construction ..................................................... 61

Real Cost Escalation Forecasts to 2017, March 2012 APA Group
© BIS Shrapnel Pty Limited 2012
APPENDIX A: A NOTE ON DIFFERENT WAGE MEASURES AND BIS SHRAPNEL’S WAGE MODEL ............................................................................................................ A–1
Description of BIS Shrapnel’s wage model ........................................................................ A–2
Some Deficiencies in Econometric Models of Wage Determination for the EGW Sector .... A–3
APPENDIX B: ELECTRICITY, GAS AND WATER SUPPLY (EGW) VERSUS ELECTRICITY, GAS, WATER AND WASTE SERVICES (EGWWS) ......................... A–4
Potential Impact of the Recent Change to ABS Industry Classification ie Adding Waste Services to EGW ................................................................................................................ A–4
APPENDIX C: TERMS OF REFERENCE .................................................................... A–5
APPENDIX D: STATEMENT OF COMPLIANCE WITH EXPERT WITNESS GUIDELINES.............................................................................................................. A–13
APPENDIX E: CURRICULUM VITAES OF KEY PERSONNEL ............................... A–14
APPENDIX F: LIST OF ABS & OTHER DATA SOURCES ...................................... A–15

Real Cost Escalation Forecasts to 2017, March 2012 APA Group
© BIS Shrapnel Pty Limited 2012
Tables
Table 1a: Summary – Labour Cost Escalation Forecasts ..................................................................... v
Table 1b: Summary – Labour Cost Escalation Forecasts Adjusted for Productivity ............................ vi
Table 2.1: Australia – Key Economic Indicators, Financial Years .......................................................... 7
Table 3.1: Wages Growth, All Industries, Australia, (by Workforce Segmented by Pay Setting Method) ................................................................................................................................ 13
Table 3.2: Methods of Setting Pay, Industry, May 2010 Proportion of Employees (%) ........................ 14
Table 3.3: Wages and Prices – Australia Year Average Growth .......................................................... 20
Table 4.1: Labour Price Index Growth by Industry Sector and by State ............................................... 26
Table 4.2: Australia AWOTE Growth by Industry Sector ...................................................................... 26
Table 4.3: Federal Wage Agreements – Collective Agreements by Industry (Average Annualised Wage Increase) .................................................................................................................... 28
Table 4.4: Electricity, Gas & Water Supply Wage Forecasts – Australia ............................................. 30
Table 4.5: Average Weekly Ordinary Time Earnings and Labour Price Index Total Australia and Electricity, Gas & Water (Year Average Growth) ................................................................. 34
Table 4.6: AWOTE Persons by State - Electricity, Gas and Water Supply (Year Average Growth) .... 36
Table 4.7: Electricity, Gas and Water – Australia Real and Productivity Adjusted Wages Growth ...... 40
Table 4.8: Electricity, Gas and Water – Victoria Nominal, Real & Productivity Adjusted Wages ......... 42
Table 4.9: Electricity, Gas, Water and Waste Services Output, Employment and Productivity: Australia ............................................................................................................................... 49
Table 4.10: Electricity, Gas, Water and Waste Services Output, Employment and Productivity: Victoria ............................................................................................................ 50
Table 4.11: Wages Growth in Competitor Industries – Australia All Industries, EGW, Mining, Manufacturing and Construction (Year Average Growth) .................................................... 52
Table 5.1: PSTS, ASS and Total All Industries Wages Growth - Australia .......................................... 56
Table 5.2: PSTS and ASS (Weighted) Wages Growth – Victoria ......................................................... 57
Table 5.3: PSTS, Nominal, Real & Productivity Adjusted Wages – Victoria ........................................ 58
Table 5.4: ASS, Nominal, Real & Productivity Adjusted Wages – Victoria ........................................... 58
Table 6.1: Construction Wages Growth – Australia Nominal, Real & Productivity Adjusted Wages .... 60
Table 6.2: Construction Wages Growth – Victoria Nominal, Real & Productivity Adjusted Wages ...... 61
Table 6.3: Construction Output, Employment and Productivity: Australia ............................................ 63
Table 6.4: Construction Output, Employment and Productivity: Victoria .............................................. 64
Table B–1: EGW V. EGWWS ............................................................................................................... A–4

APA Group Real Cost Escalation Forecasts to 2017, March 2012
© BIS Shrapnel Pty Limited 2012
Charts
Chart 3.1: Australia – Wages and Prices .............................................................................................. 15
Chart 3.2: Employment and Unemployment ......................................................................................... 15
Chart 4.1: AWOTE & LPI Total Australia (All Industries) and Electricity, Gas and Water ................... 28
Chart 4.2: Australia – Utilities Employment, Output and Investment .................................................... 31
Chart 4.3: Total Engineering Construction Australia and Victoria ........................................................ 37
Chart 4.4: Utilities Engineering Construction Australia and Victoria .................................................... 37
Chart 4.5: Victoria – Utilities Employment, Output and Investment ...................................................... 38
Chart 4.6: Mining and Heavy Industry Engineering Construction Australia and Victoria ..................... 44
APA Group Real Cost Escalation Forecasts to 2017, March 2012
© BIS Shrapnel Pty Limited 2012 i
SUMMARY
BIS Shrapnel was engaged by APA Group to provide an expert opinion regarding the outlook for a range of labour cost escalation relevant to gas pipelines in Victoria over the six year period from 2012 to 2017. Table 1 presents a summary of the annual escalation (in year average terms) for the relevant escalators in both nominal and real terms. The latter is adjusted for the RBA’s/Commonwealth Treasury forecasts of CPI inflation which is projected to average 2.6 per cent over APA Group’s next regulatory period ie from 2013 to 2017 inclusive.
The report provides both AWOTE and LPI escalators for pipeline-related labour (electricity, gas and water (EGW)) – who include a range of skilled labour involved in construction, maintenance, design and operation of the gas pipeline. As around 80 per cent of employees in the EGW sector receive their pay increases via collective agreements, which run for around three years, the industrial relations strength of unions in the sector and recent inflation outcomes and inflationary expectations are key influences for wages. EGW wages are forecast to strengthen over the three years to 2014 as the demand for labour in the EGW sector, construction, mining and manufacturing sectors (the latter three sectors compete with EGW for similarly skilled labour) all pick-up as the economy and investment recover solidly.
BIS Shrapnel considers the labour price index (LPI) to be a measure of underlying wage inflation in the economy or in a specific industry, as the LPI only measures changes in the price of labour, or wage rates, for specific occupations or job classifications, which are then aggregated into a measure of the collective variations in wage rates made to the current occupants of the same set of specific jobs. The LPI, therefore, reflects pure price changes, but does not measure variations in the quality or quantity of work performed ie it holds labour composition effects as fixed. The LPI also does not reliably measure the changes in total labour costs which a particular enterprise or organisation incurs, because the LPI does not reflect the changes in the skill levels of employees within an enterprise or industry. As skills are acquired, employees will be promoted to a higher grade or job classification, and with this promotion will move onto a higher base pay. So the change in the cost of labour over, say a year, includes increases in the base pay rates (which the LPI measures) and the higher average base pay level. The AWOTE captures both these elements, while the LPI only captures the first element. Basically, promoting employees to a higher occupation does not necessarily show up in the LPI, but the employer’s total wages bill (and average unit labour costs) is higher, is AWOTE.
AWOTE is a better measure of the change in overall costs per employee, because it takes into account movements of employees to higher grades, changes in compositional effects from entry/exits of higher skilled/lower skilled (ie higher paid/lower paid) workers in an enterprise or industry, and also the payments above base rates of pay, such as bonuses, incentives, penalty rates and other allowances that are a normal part of an employees earnings over the quarter or year. With regard to the latter, many enterprises in the utilities (and other industry) sectors(s) regularly include bonuses or incentive payments which are linked to a range of objectives, such as up skilling, additional training, productivity targets, safety targets, etc. These ‘extra’ payments — or changes in the quantum of payments — are not included in changes in the LPI, but can make a material difference to an enterprise’s overall labour costs.
Despite the limitations of the LPI, the Australian Energy Regulator in its recent revenue determinations for electricity and gas utilities has preferred the LPI, largely because of the

Real Cost Escalation Forecasts to 2017, March 2012 APA Group
ii © BIS Shrapnel Pty Limited 2012
volatility of AWOTE caused by ‘significant’ compositional problems with AWOTE. Although BIS Shrapnel believes AWOTE is a better measure of the change in overall costs per employee, in this report we provide (for comparison purposes) forecasts of both the LPI and AWOTE.
Overall, BIS Shrapnel expects total wage costs for the Australian utilities sector — expressed in Average Weekly Ordinary Time Earnings (AWOTE) — will average 5.7 per cent per annum over the six years from 2012 to 2017 inclusive, 0.7 per cent higher than the national ‘All Industries’ AWOTE average of 5.0 per cent per annum over the same six year period. In terms of underlying wages growth in the electricity, gas and water (‘utilities’) sector for total Australia — expressed in labour price index (LPI) terms — BIS Shrapnel is forecasting an average of 4.9 per cent per annum (0.8 percentage points higher than the national ‘All Industries’ LPI average of 4.1 per cent per annum) over the six years from 2012 to 2017 inclusive. The faster wages growth expected in the electricity, gas and water sector over the next six years is in line with historical movements in the LPI over the past six years.
Utilities wages growth in Victoria is forecast to average 5.4 per cent per annum (in AWOTE terms) over the six years from 2012 to 2017, 0.3 percentage points lower than the national utilities AWOTE average, while Victorian utilities LPI growth is forecast to average 4.5 per cent per annum (also 0.4 per cent lower than the national utilities average) over the six years from 2012 to 2017 inclusive. The weaker utilities wages growth in Victoria is due to Victoria’s lower exposure to the resources investment boom (compared to Queensland and Western Australia in particular), the comparative weakness of the state’s construction sector (compared to total Australia) and the comparative weaker growth in Victorian utilities-related engineering construction. This means a lower relative demand for similarly-skilled labour from the state’s construction and mining sectors and within the states utilities sector, compared to other states and therefore slower wages growth compared to the national utilities average.
APA Group’s non-contracted ‘general labour’ includes mainly clerical/ administration, professionals and managerial staff, who provide administration and corporate support services. The escalator BIS Shrapnel used for ‘General Labour’ was wage movements in Victoria for the Administration and Support Services (ASS) — which includes units mainly engaged in performing routine support activities for day-to-day operations of other businesses and organisations; and Professional, Scientific and Technical Services (PSTS) which, as the name suggests, includes units mainly engaged in providing professional, scientific and technical services including engineering, law, accountancy, management and other consultancy.
APA Group has indicated that 90 per cent of APA Group’s general labour belong to the PSTS sector with the remaining 10 per cent providing mainly administrative and support services. We applied these proportions to the Victoria PSTS and the ASS sectors to derive a weighted average escalator for ‘general labour’ for APA Group. The weighted ‘general labour’ escalator in Victoria is expected to be weaker than the national PSTS average over the next six years. We believe the Australian PSTS wages is expected to be boosted by robust growth in PSTS wages in strong mining states such as Queensland and Western Australia.
As most contractor labour is assumed to undertake construction or maintenance related projects, they would be classified to the construction sector. Accordingly, the escalator used for contractor labour is Construction sector wages growth. Our research has shown that

APA Group Real Cost Escalation Forecasts to 2017, March 2012
© BIS Shrapnel Pty Limited 2012 iii
construction activity (ie work done in the sector) normally has a strong influence on construction wages. BIS Shrapnel’s forecasts of construction activity by state (which includes residential and non-residential building, plus engineering construction) were used to derive the wages forecasts.
Construction activity was extremely strong for most of the previous decade. The strength of the construction sector fuelled strong growth in Victorian construction wages in the second half of the last decade. However, in 2010, construction sector wages eased in line with a relatively weaker (and peak) in construction activity over 2010/11.
Looking ahead, we believe engineering construction will decline over 2011/12 and 2012/13, as work is progressively completed on the desalination plant, major sewerage infrastructure and the current round of pipelines, oil and gas investments. Non-residential building will continue to decline, with the end of stimulus spending causing steep declines in schools construction and, later, health and other social and institutional buildings and more than offsetting a recovery in commercial and industrial building. Dwelling building is also forecast to decline over 2012/13 to 2014/15 with the deficiency of stock predominately eliminated by June 2013. A recovery in overall construction is projected from 2015/16.
Construction wages growth, therefore is expected to be weaker over the next six years. We expect construction wages (in AWOTE terms) to average 5.3 per cent per annum over the 2012 to 2017 period compared to the 8.0 per cent per annum average achieved in the second half of the previous decade.
The AER in its recent revenue determinations has argued that labour price increases due to productivity growth do not increase labour costs and as a result an adjustment is required to wages to develop labour costs. In addition, the AER has stated that the LPI adjusted for productivity provides a more realistic expectation of labour cost changes than does AWOTE adjusted for productivity. The AER has subsequently applied — without amendment — the Utilities industry productivity forecasts (developed by its consultant Deloitte Access Economics) to its LPI forecasts to derive productivity adjusted real labour cost escalators for the utilities sector.
We disagree with the AER. BIS Shrapnel believes that the ‘unadjusted’ industry labour productivity cannot be applied to the LPI. The LPI is an underlying measure of wage inflation and does not incorporate effects of changes to skill levels and improved productivity (ie workforce compositional productivity effects), while the AWOTE measure does.
The upshot is that in deriving productivity adjusted measure of labour costs, we believe that the AWOTE is the only choice which is logical. However, the LPI can be adjusted for productivity as long as the productivity measure excludes workforce compositional and up- skilling effects which we believe is positive and significant for the Utilities sector. We believe workforce composition productivity to be between 0.5 to 1.0 per cent on average over the medium term, based on the observed difference between the rate of growth in AWOTE and the LPI. Assuming difference between AWOTE and LPI is largely due to workforce compositional effects, then one can assume workforce compositional effects is roughly equal to this difference. Over the decade to 2011, this difference averaged 0.9 per cent per annum at the national utilities level, suggesting the average workforce composition productivity was 0.9 per cent per annum for the national utilities sector. Over the next six years, our expectation is that workforce compositional productivity will remain positive and significant. Our forecast is for workforce composition productivity (proxied by the difference between growth in AWOTE and LPI) to average 0.8 per cent per annum at the national utilities industry and 0.9 per cent per annum for the Victorian utilities sector.

Real Cost Escalation Forecasts to 2017, March 2012 APA Group
iv © BIS Shrapnel Pty Limited 2012
The end result is that once nominal AWOTE is adjusted for CPI inflation and productivity movements, the real productivity adjusted AWOTE for EGW is forecast to average 2.8 per cent per annum over the five year from 2013 to 2017 inclusive (see table 1b).
Notwithstanding the above, we believe that DAE’s productivity forecasts provided to the AER in November 2011 which the AER adopted without amendment are too optimistic. We consider that productivity growth in the Utilities sector will remain weak over the next six years. Going forward, we believe demand and output growth will be constrained in this sector for three key reasons: (1) Higher utilities prices (including the imposition of a carbon tax) will keep demand muted, (2) population growth will be slower over the next five years and (3) with the government introducing a price of carbon, we do not expect a significant jump in energy intensive projects, such as aluminium smelters. This will further contain demand for energy in the future. In addition, we assume moderate and fairly stable growth in employment in the utilities sector in Australia and the states over the next six years. The combination of muted output and moderate employment growth means productivity growth will remain weak for the utilities sector at the national as well as the state level over most of the current decade.

APA Group Real Cost Escalation Forecasts to 2017, March 2012
© BIS Shrapnel Pty Limited 2012 v
Table 1a: Summary – Labour Cost Escalation Forecasts (per cent change, year average, year ended December)
2010 2011 2012 2013 2014 2015 2016 2017 2013-2017 (e)
NOMINAL PRICE CHANGES
1. Gas Pipeline related LabourEGW AWOTE - Victoria (a) 18.2 7.6 4.8 5.3 5.8 5.6 5.5 5.4 5.5EGW LPI - Victoria (a) 3.6 4.0 4.2 4.4 4.8 4.6 4.3 4.6 4.5EGW AWOTE - Australia (b) 9.8 6.5 5.4 5.4 5.9 5.8 5.8 5.8 5.7EGW LPI - Australia (b) 4.7 3.7 4.6 4.9 5.1 4.9 4.7 4.9 4.9
2. General LabourBusiness Services AWOTE- Victoria (c) -0.8 4.5 6.1 5.8 5.0 5.3 5.8 5.6Business Services LPI - Victoria (c) 3.1 4.9 4.4 5.0 4.8 4.9 4.8 5.2 4.9PSTS AWOTE - Australia (b) 6.3 2.9 4.7 6.4 6.2 5.3 5.3 6.0 5.8PSTS LPI - Australia (b) 3.6 4.4 4.8 5.4 5.2 5.0 4.8 5.3 5.1
ASS AWOTE - Australia (b) 4.8 -3.0 2.8 5.2 5.1 4.3 4.4 5.3 4.8ASS LPI - Australia (b) 3.0 3.4 3.5 4.4 4.0 3.8 3.6 4.3 4.0
3. Contractor EscalationConstruction AWOTE - Victoria (d) 5.4 -0.6 4.2 5.8 5.8 5.1 5.1 5.8 5.5Construction LPI - Victoria (d) 4.7 4.4 4.4 4.7 4.6 4.5 4.3 5.3 4.7Construction AWOTE - Australia (b) 6.5 5.0 5.0 6.5 6.8 5.2 5.1 6.0 5.9Construction LPI - Australia (b) 3.3 4.1 4.9 5.5 5.2 4.7 4.3 5.2 5.0
Consumer Price Index (headline) (f) 2.8 3.4 2.3 2.9 2.6 2.5 2.5 2.5 2.6
REAL PRICE CHANGES (g)
1. Gas Pipeline related LabourEGW AWOTE - Victoria (a) 15.4 4.2 2.5 2.4 3.2 3.1 3.0 2.9 2.9EGW LPI - Victoria(a) 0.8 0.6 1.9 1.5 2.2 2.1 1.8 2.1 1.9EGW AWOTE - Australia (b) 7.0 3.1 3.1 2.5 3.3 3.3 3.3 3.3 3.1EGW LPI - Australia (b) 1.9 0.3 2.3 2.0 2.5 2.4 2.2 2.4 2.3
2. General LabourBusiness Services AWOTE- Victoria (c) -2.8 -4.2 2.2 3.2 3.2 2.5 2.8 3.3 3.0Business Services LPI- Victoria (c) 0.3 1.5 2.1 2.1 2.2 2.4 2.3 2.7 2.3PSTS AWOTE - Australia (b) 3.5 -0.5 2.4 3.5 3.6 2.8 2.8 3.5 3.2PSTS LPI - Australia (b) 0.8 1.0 2.5 2.5 2.6 2.5 2.3 2.8 2.5
ASS AWOTE - Australia (b) 2.0 -6.4 0.5 2.3 2.5 1.8 1.9 2.8 2.2ASS LPI - Australia (b) 0.2 0.0 1.2 1.5 1.4 1.3 1.1 1.8 1.4
3. Contractor EscalationConstruction AWOTE - Victoria (d) 2.6 -4.0 1.9 2.9 3.2 2.6 2.6 3.3 2.9Construction LPI - Victoria (d) 1.9 1.0 2.1 1.8 2.0 2.0 1.8 2.8 2.1Construction AWOTE - Australia (b) 3.7 1.6 2.7 3.6 4.2 2.7 2.6 3.5 3.3Construction LPI - Australia (b) 0.5 0.7 2.6 2.6 2.6 2.2 1.8 2.7 2.4
(a) Electricity, Gas & Water (EGW) Average Weekly Ordinary Time Earnings (AWOTE) and Labour Price Index (LPI) for Victroia. (b) Australian sector wage forecasts provided for comparison.(c) Business Services AWOTE and LPI for Victoria. This is a weighted index of wages growth in Administrative and Support Services (ASS) and Professional, Scientific and Technical Services (PSTS) in Victoria.(d) Construction sector AWOTE and LPI for Victoria.(e) For next regulatory period ie represents average annual growth rate for 2013 to 2017 inclusive.(f) Headline CPI forecasts based on Reserve Bank of Australia forecasts to December 2013 and then Commonwealth Treasury medium term projections which is the mid-point of RBA's inflation target range of 2-3%. The average CPI inflation is the geometric mean of the inflation forecasts. (g) Real price changes are calculated by deducting the inflation rate from nominal price changes. The difference between some real price changes in the sumamry table and those in the report is due to rounding errors.
Actuals Forecasts

Real Cost Escalation Forecasts to 2017, March 2012 APA Group
vi © BIS Shrapnel Pty Limited 2012
Table 1b: Summary – Labour Cost Escalation Forecasts Adjusted for Productivity (per cent change, year average, year ended December)
2010 2011 2012 2013 2014 2015 2016 2017 2013-17 (e)
PRODUCTIVITY GROWTH (g)EGW - Victoria -0.1 -9.9 -1.8 2.6 -4.2 -2.3 1.8 2.7 0.1EGW - Australia -3.0 -7.0 -0.6 -0.3 -2.0 -0.7 -0.1 -1.8 -1.0Construction - Victoria -2.7 -4.1 -5.3 -1.6 1.2 1.5 2.4 1.2 0.9Construction - Australia 1.6 3.2 2.4 1.4 0.0 -1.2 -0.1 -0.1 0.0
WORKFORCE COMPOSITIONAL PRODUCTIVITY GROWTH (h)EGW - Victoria 14.5 3.6 0.5 0.9 1.0 1.0 1.3 0.8 1.0EGW - Australia 5.1 2.8 0.7 0.4 0.8 0.9 1.2 0.9 0.8Business Services - Victoria -3.1 -5.7 0.0 1.1 1.0 0.1 0.5 0.6 0.6PSTS - Australia 2.7 -1.5 0.0 1.1 1.0 0.2 0.5 0.7 0.7ASS - Australia 1.8 -6.5 -0.7 0.8 1.1 0.5 0.8 1.0 0.8Construction - Victoria 0.7 -5.0 -0.2 1.1 1.2 0.6 0.8 0.5 0.8Construction - Australia 3.2 1.0 0.2 1.0 1.6 0.6 0.8 0.8 1.0
PRODUCTIVITY GROWTH ADJUSTED FOR WORKFORCE PRODUCTIVITY GROWTH (i)EGW - Victoria -14.7 -13.5 -2.3 1.7 -5.1 -3.3 0.5 2.0 -0.8EGW - Australia -8.1 -9.8 -1.3 -0.7 -2.8 -1.6 -1.3 -2.7 -1.8Business Services - Victoria 3.0 -4.2 -1.8 1.5 -5.1 -2.4 1.3 2.1 -0.5PSTS - Australia -5.7 -5.5 -0.5 -1.4 -3.0 -1.0 -0.6 -2.5 -1.7ASS - Australia -4.8 -0.5 0.1 -1.1 -3.1 -1.2 -1.0 -2.7 -1.8Construction - Victoria -3.3 0.9 -5.0 -2.7 -0.1 0.9 1.6 0.7 0.1Cosntruction - Australia -1.6 2.2 2.2 0.4 -1.6 -1.7 -0.9 -0.9 -0.9
NOMINAL PRICE CHANGES ADJUSTED
FOR PRODUCTIVITY (j,k)
1. Gas Pipeline related Labour (m)EGW AWOTE - Victoria (a) 18.3 17.5 6.6 2.7 10.0 7.9 3.8 2.6 5.4EGW LPI - Victoria (a,l) 18.3 17.5 6.6 2.7 10.0 7.9 3.8 2.6 5.4EGW AWOTE - Australia (b) 12.8 13.5 5.9 5.6 7.9 6.5 6.0 7.6 6.7EGW LPI - Australia (b,l) 12.8 13.5 5.9 5.6 7.9 6.5 6.0 7.6 6.7
2. General Labour (m)Business Services AWOTE- Victoria (c) 0.1 9.1 6.3 3.5 9.9 7.3 3.5 3.1 5.5Business Services LPI- Victoria (c,l) 0.1 9.1 6.3 3.5 9.9 7.3 3.5 3.1 5.5PSTS AWOTE - Australia (b) 9.3 9.9 5.3 6.7 8.2 6.0 5.5 7.7 6.8PSTS LPI - Australia (b,l) 9.3 9.9 5.3 6.7 8.2 6.0 5.5 7.7 6.8
ASS AWOTE - Australia (b) 7.8 4.0 3.4 5.5 7.0 5.0 4.6 7.1 5.8ASS LPI - Australia (b,l) 7.8 4.0 3.4 5.5 7.0 5.0 4.6 7.1 5.8
3. Contractor Escalation (n) Construction AWOTE - Victoria (d) 8.1 3.5 9.4 7.4 4.7 3.6 2.7 4.6 4.6Construction LPI - Victoria (d,l) 8.1 3.5 9.4 7.4 4.7 3.6 2.7 4.6 4.6Construction AWOTE - Australia (b) 4.9 1.8 2.6 5.1 6.8 6.4 5.2 6.0 5.9Construction LPI - Australia (b,l) 4.9 1.8 2.6 5.1 6.8 6.4 5.2 6.0 5.9
Consumer Price Index (headline) (f) 2.8 3.4 2.3 2.9 2.6 2.5 2.5 2.5 2.6
REAL PRICE CHANGES
ADJUSTED FOR PRODUCTIVITY (o,k)
1. Gas Pipeline related Labour (m)EGW AWOTE - Victoria (a) 15.5 14.1 4.3 -0.2 7.4 5.4 1.3 0.1 2.8EGW LPI - Victoria (a,l) 15.5 14.1 4.3 -0.2 7.4 5.4 1.3 0.1 2.8EGW AWOTE - Australia (b) 10.0 10.1 3.6 2.7 5.3 4.0 3.5 5.1 4.1EGW LPI - Australia (b,l) 10.0 10.1 3.6 2.7 5.3 4.0 3.5 5.1 4.1
2. General Labour (m)Business Services AWOTE- Victoria (c) -2.7 5.7 4.0 0.6 7.3 4.8 1.0 0.6 2.9Business Services LPI- Victoria (c,l) -2.7 5.7 4.0 0.6 7.3 4.8 1.0 0.6 2.9PSTS AWOTE - Australia (b) 6.5 6.5 3.0 3.8 5.6 3.5 3.0 5.2 4.2PSTS LPI - Australia (b,l) 6.5 6.5 3.0 3.8 5.6 3.5 3.0 5.2 4.2
ASS AWOTE - Australia (b) 5.0 0.6 1.1 2.6 4.4 2.5 2.1 4.6 3.2ASS LPI - Australia (b,l) 5.0 0.6 1.1 2.6 4.4 2.5 2.1 4.6 3.2
3. Contractor Escalation (n)Construction AWOTE - Victoria (d) 5.3 0.1 7.1 4.5 2.1 1.1 0.2 2.1 2.0Construction LPI - Victoria (d,l) 5.3 0.1 7.1 4.5 2.1 1.1 0.2 2.1 2.0Construction AWOTE - Australia (b) 2.1 -1.6 0.3 2.2 4.2 3.9 2.7 3.5 3.3Construction LPI - Australia (b,l) 2.1 -1.6 0.3 2.2 4.2 3.9 2.7 3.5 3.3(a) Electricity, Gas & Water (EGW) Average Weekly Ordinary Time Earnings (AWOTE) and Labour Price Index (LPI) for Victroia. (b) Australian sector wage forecasts provided for comparison.(c) Business Services AWOTE and LPI for Victoria. This is a weighted index of wages growth in Administrative and Support Services (ASS) and Professional, Scientific and Technical Services (PSTS) in Victoria.(d) Construction sector AWOTE and LPI for Victoria.(e) For next regulatory period ie represents average annual growth rate for 2013 to 2017 inclusive.(f) Headline CPI forecasts based on Reserve Bank of Australia forecasts to December 2013 and then Commonwealth Treasury medium term projections, which is the mid-point of RBA's inflation target range of 2-3%, are used. The average CPI inflation is the geometric mean of the inflation forecasts. (g) Industry Productivity is measured by output ie real Gross Value Added divided by Total Employment.(h) Proxied by the difference between AWOTE and LPI. (i) Calculated by deducting workforce compositional productivity growth from from industry productivity growth. (j) Calculated by deducting relevant productivity growth from corresponding nominal wage escalators. (k) The difference between some price changes in the sumamry table and those in the report is due to rounding errors. (l) Excludes workforce compositional productivity growth. The series is calculated by deducting productivity growth adjusted for adjusted for workforce compositional productivity growth from corresponding wage escalators.(m) We have used the productivity growth in the Electricity, Gas, Water and Waste Services sector to derive productivity adjusted price changes for both gas pipeline related and general labour. Both sets of labour work in the EGWWS sector hence contribute to the productivity of the EGWWS sector.(n) Construction wage costs are adjusted for Construction productivity(o) Calculated by deducting relevant productivity growth from real wage escalators. These are identical to nominal price changes adjusted for productivity less the inflation rate.
Actuals Forecasts

APA Group Real Cost Escalation Forecasts to 2017, March 2012
© BIS Shrapnel Pty Limited 2012 1
1. INTRODUCTION, OUTLINE OF REPORT & DATA SOURCES
In August 2011, BIS Shrapnel was engaged by APA Group to provide an expert opinion regarding the outlook for a range of labour cost escalators relevant to operating and capital expenditure of the Victorian Transmission System over the six year period from 2012 to 2017 inclusive. The labour cost escalator forecasts and reports were used by the APA Group in the preparation of its cost estimates. This, in turn, were used as key inputs into APA Group’s operating and capital expenditure forecasts included in APA Group’s regulatory submission to the Australian Energy Regulator (AER) on 31st March, 2012.
In keeping with my instructions, I, Richard Robinson, confirm that I have undertaken this engagement having regard to the Guidelines for Expert Witnesses in Proceedings in the Federal Court of Australia and the requisite statement to this effect is included in Appendix D. I have been assisted in the preparation of this report by Kishti Sen, an Economist at BIS Shrapnel and Daniel Gradwell Economic Analyst at BIS Shrapnel. Curriculum vitas of all relevant personnel are attached in Appendix E. Notwithstanding the assistance from the other two economists, the opinions in this report are my own and I take full responsibility for them. A brief description of the material upon which I have relied for the preparation of this report follows. A full list of the ABS data and other information sources used in the preparation of this document and the forecasts contained within can be found in Appendix F.
The Australian Bureau of Statistics (ABS) is the primary data source for the consumer price index, wages, employment, real gross value added and investment (including engineering construction) data, and for a range of other economic variables shown in table 2.1. The December quarter, 2011 was the latest available data for wages, industry employment, real gross value added (at the Australian level only), investment and indeed most of the economic variables in table 2.1. The detailed engineering construction data (by state and by category) have data only up to September quarter 2011. The latest data for Gross State Product (GSP) and real gross value added for state industry sectors was 2010/11 (annual data only is available). Other inflation and interest rates data were sourced from the Reserve Bank of Australia. Other data and information concerning enterprise agreements and skills shortages was obtained from the Department of Education, Employment and Workplace Relations (DEEWR).
Forecasts of the economic variables in this report were mostly sourced from BIS Shrapnel reports, including Economic Outlook, Long Term Forecasts: 2011 – 2026 February 2012 Update Report, Engineering Construction: 2011/12 to 2025/26 and Long Term Building Work Done Forecasts, plus other unpublished forecasts and from BIS Shrapnel internal research.
The structure of this report is as follows:
The Summary section presents an overview of the outlook for the cost escalators and a summary table.
Section 2 provides an overview of the macroeconomic outlook for Australia, including a brief commentary of the logic and key drivers, plus forecasts of key economic variables.
Section 3 discusses BIS Shrapnel’s model of wage determination and provides forecasts of the outlook for national (‘all industries’) wages and CPI inflation, with the Reserve Bank of Australia and Treasury medium-term projections of CPI inflation. The latter is used to deflate the nominal escalators provided in this report.
Section 4 provides an outlook for ‘gas pipeline-related labour’ cost escalation, based on forecasts of wages growth for the Electricity, Gas and Water Supply sector for Australia and Victoria, including productivity adjusted wage escalators. This section also analyses and

Real Cost Escalation Forecasts to 2017, March 2012 APA Group
2 © BIS Shrapnel Pty Limited 2012
provides forecasts of wages in industries which compete with the utilities sector for similar types of skilled labour, namely Mining, Construction and Manufacturing.
Section 5 provides an outlook for ‘general labour’ cost escalation, based on forecasts of wages growth for the Professional, Scientific and Technical Services and Administration and Support Services sector for Australia and Victoria, including productivity adjusted wage escalators.
Section 6 provides forecasts of ‘contractor’ escalation, which is predominately related to labour costs in APA Group’s external construction contracts.
Appendices, including a note on different wage measures and a description of BIS Shrapnel’s wage model.

APA Group Real Cost Escalation Forecasts to 2017, March 2012
© BIS Shrapnel Pty Limited 2012 3
2. MACROECONOMIC OVERVIEW — AUSTRALIA AND VICTORIA
2.1 The Australian economy
2.1.1 Current State of Play
Despite slowing in the December quarter, the Australian economy performed well in 2011, with GDP increasing 2.2 per cent in year-on-year terms.1 This was particularly impressive considering the many headwinds, including severe flooding early in the year, the ongoing European sovereign debt crisis, the winding down of the Australian Government’s building stimulus package, and the Australian dollar spending much of the year above parity against the US dollar. However, growth was far from uniform across industries and states.2 A significant driver of the growth over the year was the increase in mining-related engineering construction, particularly in Western Australia.3 Household spending also accelerated.4 However, a lot of this increased activity was met by increased imports.5 At the same time, the high Australian dollar and negative confidence effects due to events in Europe weighed heavily on most other trade-exposed industries. Many non-trade-exposed industries were also held back by tight funding markets, low demand, high uncertainty, and a general lack of confidence.
But employment growth remains anaemic. Employment growth was very weak during 2011, with employment finishing the year where it started. Admittedly, a lot of the apparent weakness in employment over 2011 reflects the unwinding of the stronger-than-expected employment growth through 2010.
Markets spooked by overseas problems, delaying a pick-up in growth
Over the second half of 2011, local and overseas share markets experienced sharp falls as US and European debt and equity markets finally reacted to the combination of European sovereign debt difficulties, the politics of expanding the ability of the US to take on debt, the downgrade of US government securities, and weak US and European growth.
These problems are serious - for the countries in debt and the banks that financed them. But Australia has little direct exposure. A large part of the problem for Europe is the inflexibility of fixed exchange rates in the Euro zone.
For the US and much of Europe, this will be a long hard haul. Still absorbing excess capacity created during the boom, they won't have strong investment to drive growth. We think it will take a decade to claw back the unemployment rate.
But this is nothing like the situation which led to the GFC. This is just the next stage in the unwinding of the pre-GFC boom. And market gyrations will gradually settle down, learning to live with what we expect will remain largely unresolved problems.
Australia has been caught in the financial market contagion, with sharp falls in the share markets, declines in commodity prices and the threat of higher spreads on our overseas borrowings. Equity markets are experiencing enormous volatility. Many think that this will be GFC phase 2 and are again battening down for an anticipated recession. Confidence is again taking a hammering, delaying the next phase of recovery from the current soft patch in the economy as households and businesses (outside the resource sector) stay in pre-cautionary savings mode.6
1 ABS National Accounts 5206.0, December Quarter 2011. 2 ABS National Accounts 5206.0, December Quarter 2011. 3 ABS National Accounts 5206.0, December Quarter 2011. 4 ABS National Accounts 5206.0, December Quarter 2011. 5 ABS National Accounts 5206.0, December Quarter 2011. 6 ABS National Accounts 5206.0, December Quarter 2011.

Real Cost Escalation Forecasts to 2017, March 2012 APA Group
4 © BIS Shrapnel Pty Limited 2012
Don't confuse what’s happening overseas with what's happening in Australia
Australia doesn't have these problems. Australia didn't have a financial crisis. The major banks are strong. Australia didn't overinvest in the boom which preceded the GFC, but is under-investing now, which means we will run into capacity constraints within two years of reasonable growth.
Meanwhile, resource companies have just committed to a second major phase of investment projects, sufficient to underwrite solid growth over the next five years.7 As long as China remains strong, we’ll be supplying the resources to help them grow.
Nevertheless, the Australian economy remains soft but fundamentally sound
The economy has been soft since the beginning of 2011. Precautionary savings by households and businesses is constraining demand and hence growth. Confidence is weak.
Consumers are keeping their powder dry, and have significantly increased their savings over the past four years, back to levels last seen in the 1980s, as households tried to reduce their leverage in case the economy really turned down.8 Over the past year, the household saving rate has tracked sideways. The fact that household consumption growth has gradually increased, such that it is moving largely in line with income growth, suggests that households are now more comfortable with their financial position. Households are still delaying long-term commitments such as investment in housing. Nevertheless, private consumption expenditure remains solid. But much of that expenditure is leaking into imports, including overseas holidays.9 However, the growth in savings is a strength, not a weakness. But we will only gradually loosen the purse strings, with consumption likely to grow in line with income, rather than being financed by increased debt.
Residential property and housing construction have been a casualty of the combination of uncertainty and higher interest rates. All the talk of ‘overvalued housing markets’ compared with overseas has spooked owner-occupiers and housing investors alike. Without the prospect of capital gain, let alone facing the spectre of capital loss, they are waiting. In some states, particularly NSW, the shortage of housing has become critical.10 The next stage is an upswing in both property and construction markets, but currently they remain weak.
The strength of Asia, in particular China, continues to prop up the Australian economy, by providing strong demand for resource and mineral exports. This has prompted significant investment in resource related projects, particularly in Western Australia and Queensland, although this strength has been slow to flow through to the remainder of the economy.
Further, the positive impact of the resources sector on the Australian dollar is placing increasing pressure on trade exposed industries. On the back of relatively high interest rates and strong commodity prices, the Australian dollar has been trading mostly above the $US1 mark since late March 2011. This has hurt industries such as manufacturing and particularly tourism which have become less competitive as a result. Consequently business investment in these sectors has remained weak.11
Apart from Resources, private investment remains flat, below the level required to underwrite even moderate growth, setting the scene for future capacity constraints. Business remains in cost containment mode rather than going for growth.
7 BIS Shrapnel, Engineering Construction in Australia 2011/12-2025/26 Report. 8 Household savings rate has increased. See ABS National Accounts, December Quarter, 2011. 9 ABS National Accounts, December Quarter, 2011 and ABS Balance of Payments and International Investment Position, December Quarter, 2011. 10 BIS Shrapnel, Building in Australia 2011-2026 Report. 11 ABS, Private New Capital Expenditure and Expected Expenditure, December Quarter, 2011.

APA Group Real Cost Escalation Forecasts to 2017, March 2012
© BIS Shrapnel Pty Limited 2012 5
The RBA recently cut interest rates twice in succession for the first time since the onset of the GFC in 2008/09. Fears of slowing economic growth in China and increasingly turbulent markets in Europe, coupled with weaker domestic results (particularly in employment), have led to a lower inflationary outlook, meaning there has been room to cut rates.12 The continuing perception of a ‘market crisis’ is delaying the improvement in confidence that will drive a pick-up in spending and growth.
There is no danger of recession here. The worst outcome would be that the Australian economy would stay soft for another 6 to 12 months, before subsequently strengthening.
2.1.2 Outlook for the Australian economy
Australia’s relative strength reflects our close ties to emerging Asia and the resulting minerals boom, the fact that Australia did not have a financial crisis, plus an effective and independent monetary policy, and a strong fiscal position going into the GFC. Although there are risks, particularly related to a European sovereign debt-induced meltdown, we are forecasting GDP growth around 3.5 per cent for calendar 2012. Furthermore, under almost all downside scenarios, we think there are sufficient mitigating factors to ensure that Australia will maintain growth in excess of 2 per cent.
Beyond the current external crisis, the medium term outlook is positive overall. Private investment will recover gradually and build momentum two to three years from now. Business investment in particular is expected to rise sharply over the next five years and be a key driver of growth, led initially by the minerals investment boom. Although consumers remain risk averse and budget conscious, due to uncertainty over a range of political and economic issues, they have built up a significant savings buffer which provides households with latent spending power. Eventually, confidence will return and households will lift spending and make a larger contribution to growth, including a moderate recovery in dwellings investment. These drivers will filter through to the rest of the economy to produce a more broadly-based upswing.
Meanwhile, based on the assumptions that Europe will ‘muddle through’ their sovereign debt problems (with only a minor recession there this year) and that Asian economic growth will remain solid, external demand and prices for Australia’s exports will remain firm. We forecast real GDP to grow by an average of 3.5 per cent per annum over the three years to 2013/14. We expect rising interest rates to cause a mild downturn in 2014/15 before the economy rebounds quickly and builds momentum thereafter.
Europe to ‘muddle through’, US to recover slowly, China and Asia remain strong
Europe is in for a tough long haul as it is addresses both the immediate sovereign debt crises and long-standing competitive disparities in the currency union. On the other hand, though fragile, the United States is finding traction that is expected to broaden throughout the economy and gain strength over the medium term. The BRIC countries (Brazil, Russia, India and China) will assume a greater leadership role in world growth. China in particular will experience robust growth from rising domestic demand and continue to drive the minerals boom in Australia through high commodity prices.
In Europe, we are assuming policy makers will muddle through the sovereign debt crisis without an outright collapse in the Euro, but also not achieve a long lasting solution. This is likely to manifest in a series of ‘mini-crises’ with markets in the driver’s seat while policy makers repeatedly respond in a reactionary way until a market-satisfying solution for the immediate crisis is achieved at the 11th hour. We expect more peripheral countries to enter or go more deeply into recession in 2012 while also dragging more competitive nations and trading partners, including France and Germany, either close to or into recession. Although recession will help restore
12 RBA, Statement on Monetary Policy, February 2012.

Real Cost Escalation Forecasts to 2017, March 2012 APA Group
6 © BIS Shrapnel Pty Limited 2012
competitiveness to peripheral economies, it will not be a defining moment. Our view is that regional differences in competitiveness are more deeply ingrained than a single recession can fix. Over the next five years, we expect the euro zone to experience low growth, with less-competitive nations continuing to drag on more competitive nations.
The United States, on the other hand, remains a sign of hope on the international stage. There continues to be upbeat, if not strong, data from the United States that indicate they are finding their footing. Indicators of spending, production and business investment and the job market have shown signs of improvement. All things considered, we expect the US economy to continue with tentative, mild growth in 2012, before gaining momentum over the remainder of the forecast period.
Ironically, weak international conditions could not have come at a better time for China. Falling demand overseas is easing inflation pressures, providing increased space for policy stimulus. This in turn will allow China to manage more sustainable growth over the coming years. Yes, exports to Europe and the United States have been one of the key drivers of the Chinese economy, but household demand has been quietly building in the background. If lower activity in Europe spills over to China in the form of falling exports as we have forecast, conventional methods such as cutting bank reserve requirements and interest rates may be all that is required. If conditions were to deteriorate more, as a creditor nation, China’s central government has plenty of fire power to paper over any cracks that could appear.
This is not to say that China is bullet proof. There are potential weaknesses in the property markets, state government debts and the state banks, with inflation being a persistent thorn. Certainly, a collapse of the euro and subsequent recession in the United States remain as downside risks. However, our forecast is for China to achieve a sustainable growth path, averaging just below 8 per cent over the next five years.
Overall, BIS Shrapnel expects world growth over the next five years to outpace the previous five year period. The driver of this growth is the ever larger share of world GDP that China, India and Asia now are expected to represent through the forecast period. BIS Shrapnel estimates that China presently represents 17 per cent of world GDP, just slightly higher than the entire euro zone. That is more than double its share from the year 2000, and is forecast to increase to more than 20 per cent by 2016 while the euro-zone and the United States continue to lose world GDP share. In short, China and Asia, and hence the world, is in transition. China is shifting from an export-dependent country to an economy motivated by increasingly robust household demand, rising urbanisation and continuing expenditure on infrastructure underwriting development, with a long-term requirement for commodities, the purchasing power to acquire them and, in doing so, emerging as the dominant driver of world growth.
Diminished demand for commodities in Europe will be more than offset by the US and the developing world’s (China and later India) continued demand for commodities, maintaining historically high commodities prices over most of the forecast horizon. As the majority of Australia’s exports now go to Asian markets,13 the strong performance of the Chinese and Indian economies as well as Japan’s reconstruction following the earthquake will support Australia’s external demand well into the medium term. This factor, plus Australia’s healthy fundamentals (including the top AAA credit rating from international credit agencies), and the continuation of relatively higher interest rates compared to overseas, means that the Australian dollar is forecast to remain high over the next three years.
13 ABS, International Trade in Goods and Services, January 2012.

APA Group Real Cost Escalation Forecasts to 2017, March 2012
© BIS Shrapnel Pty Limited 2012 7
Minerals investment boom and housing upswing to be key domestic drivers
Investment in the resources sector has already picked up strongly.14 There is more to come. Meanwhile, commodity prices remain at historically high levels (despite weakening in the second half of 2011), supported by China’s strong demand for steel making raw materials (ie iron-ore and coking coal), and high oil prices.15 This has locked in another round of mining-related projects over the next five years.16 The current round of mining investment is expected to peak in 2014/15, with the main impetus to growth seen over 2011/12 to 2013/14. We are not expecting a major setback to commodity prices (such as occurred in the GFC of 2008/09) – demand is expected to remain solid with a recovery in developed world demand over the long term taking up the baton from a moderation in the super hot growth experienced by the developing world, particularly China. However, we are seeing a significant world supply response to current prices and this will see prices begin to weaken significantly at some stage, probably around mid-decade.
Driven largely by investment in the mining industry, annual non-dwelling construction investment is forecast to increase by just over 50 per cent between June 2011 and June 2014, with the bulk of the increase occurring in engineering construction. Although a rising proportion of mining investment inputs are being imported, this investment has, and will continue to, provided a significant boost to activity in the engineering construction sector. The construction boom has generated a significant volume of downstream activity for many manufacturing and services firms. As a result, activity and incomes for firms and individuals assisting with this investment will benefit hugely. This, combined with the distribution of taxes and royalties paid by the mining companies, helps spread the benefits of the minerals boom more widely.
Table 2.1: Australia – Key Economic Indicators, Financial Years
14 ABS, Private New Capital Expenditure and Expected Expenditure, December Quarter, 2011. 15 Australian Financial Review, Daily ‘Commodity Markets’ and ABARES Daily Market Monitor. 16 BIS Shrapnel, Engineering Construction in Australia, 2011/12-2025/26 Report.
2011 2012 2013 2014 2015 2016 2017 2018
Selected Expenditure Categories
Private Investment– Dwellings -0.2 1.9 -1.5 1.2 3.0 -2.8 3.9 8.4 -4.3 2.4 10.4 1.9– New Non-Dwelling Construction (+) 13.0 6.3 12.5 -9.5 8.8 26.8 8.7 12.0 2.1 -5.0 3.5 4.7– New Non-Dwelling Building (+) 10.5 11.6 -4.4 -14.3 -4.2 6.0 3.0 13.0 6.5 -2.6 10.1 7.2– New Engineering Construction (+) 15.5 1.3 30.3 -5.9 17.5 38.2 11.1 11.6 0.4 -6.0 0.7 3.5
Total New Private Investment (+) 5.2 9.0 1.2 -3.0 3.6 12.4 9.1 10.8 -0.2 3.3 10.3 4.5
New Public Investment (+) 4.7 10.4 2.8 29.0 5.8 -6.8 -3.6 -2.7 2.8 7.3 9.1 2.0
Gross National Expenditure (GNE) 4.9 6.0 0.3 2.4 3.8 4.7 4.3 4.8 1.5 4.1 6.0 3.5
GDP 3.8 3.8 1.4 2.3 2.0 3.1 3.5 3.8 2.6 3.7 4.3 3.4
Inflation and WagesCPI (Yr Avg)- RBA/Treasury forecasts (*) 2.9 3.4 3.1 2.3 3.1 2.6 2.9 2.6 2.5 2.5 2.5 2.5Labour Price Index (Jun on Jun) 4.0 4.2 3.8 3.1 3.8 3.9 4.3 4.5 3.9 4.0 4.4 4.6Labour Price Index (Yr Avg) 3.9 4.1 4.1 3.1 3.8 3.7 4.1 4.4 4.3 3.7 4.2 4.6Average Weekly Earnings (Yr Avg) 3.6 4.9 5.5 5.6 4.2 4.6 4.7 5.4 5.5 4.3 5.1 5.6
Employment – Employment Growth (Yr Avg) 3.1 3.0 1.6 1.4 2.9 0.6 1.9 2.9 1.0 1.5 2.8 2.8– Employment Growth (May on May) (%) 3.3 2.7 0.9 2.2 2.3 0.6 2.6 2.6 0.3 2.5 2.9 2.1– Unemployment Rate (May) (%) 4.3 4.3 5.8 5.2 5.0 5.3 4.7 4.3 5.5 5.0 4.3 4.3
Labour Productivity Growth– Total 0.7 0.7 -0.3 1.0 -0.9 2.5 1.6 0.9 1.6 2.2 1.4 0.6– Non-farm 1.2 0.6 -0.6 1.0 -1.0 2.6 1.7 0.9 1.8 2.1 1.5 0.8
Exchange Rates – US$ per A$ (Yr Avg) 0.79 0.90 0.75 0.88 0.99 1.04 1.04 1.07 0.95 0.88 0.97 0.99
Source: BIS Shrapnel, ABS and RBA
+Expenditure on new assets (or construction work done). Excludes sales (or purchases) of second hand assets.
*Forecasts to 2014 from RBA, followed by Treasury long-term forecasts
Year Ended June Forecasts
2007 2008 2009 2010

Real Cost Escalation Forecasts to 2017, March 2012 APA Group
8 © BIS Shrapnel Pty Limited 2012
But it won’t all be plain sailing. The high dollar is eroding the competitiveness of the export and import-competing sectors, with imports taking a larger share of the domestic market at the expense of local manufacturers and tradeable services (such as tourism and education) while non-commodity exporters continue to suffer lower revenues and profits. Ultimately, investment will be affected in trade-exposed sectors, while some operations will close down and/or relocate overseas, in many cases meaning a permanent loss of industry. This process has already begun.17
Over 2012, the positive spill over from mining-related activity, increased household spending, and a recovery in dwelling investment, will steadily erode the current spare capacity in much of the economy. We forecast this to lead to a gradual but broad increase in business investment through 2012/13 and beyond, provided firms are able to get the funding to do so.
An extended period of low dwelling investment and continued population growth means that there is now a nationwide dwelling shortage approaching 140,000 dwellings – close to the current annual levels of dwelling building - with around two-thirds of that shortage being in New South Wales. This pent-up excess demand, combined with the recent lowering in housing interest rates, means that we are forecasting residential investment to increase from the middle of this year. However, the recovery in dwelling investment will not be sufficient to reduce the dwelling shortage before interest rate increases stifle the recovery around the middle of the decade.
Partly offsetting growth in private demand will be declining public investment — as the post-GFC schools, housing and hospitals building programs wind down — and slower growth in government recurrent spending and employment. The desire to return the budget to surplus also means that broadly-based income tax cuts are off the agenda until mid-decade (apart from tax cuts in mid-2012 to compensate households for the Carbon Tax). The lack of tax cuts will help restrain consumer spending.
We expect the strong outlook for activity to gradually translate through to a pick up in employment through 2012, with the unemployment rate forecast to dip below 5 per cent by the end of the 2012. We expect to see the recovery in labour demand first in increased average hours, before employment really picks up. The strengthening in overall investment and exports as new capacity comes on line, together with the rise in residential building, is expected to lead to a marked strengthening in employment over 2012/13 and 2013/14, in turn leading to stronger consumer spending. As stronger employment growth flows through in 2012/13, confidence and expenditure will rise. This will lead to a broadening of spending and investment beyond the Mining-related parts of the economy. While the annual average of jobs growth through 2011/12 is expected to be only 0.6 per cent, this is forecast to rise to 1.9 per cent in 2012/13 and 2.9 per cent in 2013/14, while at the same time unemployment levels decrease even further below 5 per cent and toward 4 per cent.
The extent to which consumers choose to loosen their purse strings will determine the speed at which wage and price pressures build over the next 18 months. Consumers have built up a considerable savings buffer, but they will be constrained in their ability to run up debt levels by the watchfulness of the RBA to any signs of excessive demand on the part of households. The RBA knows there is a major phase of mining investment gathering momentum, which is insensitive to interest rates, and will be accompanied both by strong growth in mining incomes and strong resources investment underpinned by profitable commodity prices. With the unemployment rate already hovering around 5 per cent, the economy does not have sufficient capacity to accommodate a strong pick-up in demand from households and the additional demand on labour, materials and capital that would generate. The RBA position is to use interest rates to make room for the minerals boom. Housing activity and non-mining domestically produced tradeables, both export and import-competing, will be the collateral damage.
17 Example, closure of Clyde Refinery by mid-2013.

APA Group Real Cost Escalation Forecasts to 2017, March 2012
© BIS Shrapnel Pty Limited 2012 9
With underlying inflation now appearing to have troughed we expect the RBA to start lifting the cash rate once we’re through the current soft patch. However, with the current market turmoil, debt and other problems overseas, and budget conscious households adopting a cautious approach to spending, the next rate rise is not expected until the fourth quarter of 2012. Nonetheless, as the economic upswing gains momentum and moves towards full employment over the next two years, we expect the RBA will get on the front-foot and move official rates to more restrictive settings.
An aggressive series of interest rate rises through 2013/14 will dampen consumer spending and send housing activity into a controlled downturn through 2014/15. Generalised business investment will also moderate at the same time, with the overall slowdown in domestic spending and easing of inflationary pressures expected to see interest rates fall back. However, the impact on employment and demand will be modest, with the unemployment rate expected to peak at around 5 per cent in 2015.
The economy is expected to regain momentum from 2015/16, with a strong growth phase in both residential and non-residential building expected to drive growth. By mid-decade, these two markets will typically be characterized by tight supply and a considerable degree of pent-up demand, given building in both sectors will be constrained over the next few years by high interest rates and lingering finance constraints as the economy makes room for the mining investment boom. With growth in overall mining investment expected to ease over the second half of this decade (from its mid-decade highs), investment will switch to residential and non-residential building. Another major round of private infrastructure and public investment is also expected, given restrained investment in these areas over the next few years will lead to a worsening of capacity constraints and bottlenecks in essential infrastructure.
Main Risk to Economy is Another Credit Crisis
The main risk to the Australian economy is that of a major credit crisis resulting from a worsening of the current European sovereign debt situation. As in 2008, the banks are again displaying reluctance to lend to each other, limiting the availability of credit and forcing up the price of borrowing.18 Further rescheduling of debt or defaults could escalate the problem for the financial system. Apart from debt, there remain unresolved issues relating to the competitiveness of countries in the Euro zone. The size of the European recession, and hence the extent of weakening of growth in the Western world, is still unknown.
Should these issues come to a head, Australia will be sheltered from the main impact:
While Australia has an ongoing overseas borrowing requirement relating to rollover of debt and financing the Current Account deficit, Australia's banks are relatively unexposed to European debt. Given the perceived strength of the Australian economy, Australia is a favoured investment destination both for debt and equity funds.
China’s strong financial position will cushion the Asian economy and minerals demand.
Australia’s strong fiscal and monetary policy position would allow policy actions to mitigate any impacts on the economy.
Australia would come through a serious deterioration in Europe and the world economy relatively unscathed, perhaps with a delay in the strengthening of the economy but with minimal risk of any serious weakening.
18 ‘European Financial Developments’, Address to the 24th Australasian Finance and Banking Conference by Ric Battellino Deputy Governor RBA, Sydney 14 December, 2011.

Real Cost Escalation Forecasts to 2017, March 2012 APA Group
10 © BIS Shrapnel Pty Limited 2012
2.2 The Victorian Economy
The Victorian economy experienced only a modest weakening relative to other states19 since the onset of global financial crisis in 2008/09, despite a sharp deceleration in Australian domestic demand. Domestic demand, both in Victoria and interstate, are key drivers of the state economy because of the importance of the wholesale trade, distribution and transport sectors facilitated by the Port of Melbourne — the largest container port by volume.20 Product from these imported cargoes and from Victoria’s manufacturing and mining sectors (gas mainly) are distributed locally and interstate, with Victoria’s finance, insurance and business services sectors also providing services interstate. The state’s ‘events-based’ tourism also lures visitors from around Australia. The upshot is that Victoria normally runs a positive net interstate trade in goods and services, which contributes to growth and helps to offset a net external (international) contribution. The key factor underpinning Victoria’s strong performance over the past three years was the overall strength of its construction sector.21 New dwelling building activity picked up quickly between 2008/09 and 2010/11 after interest rates tumbled and the first home owner grants (FHOG) scheme boosted demand. In addition, stronger population growth and the ready availability of reasonably priced residential land facilitated a much faster upswing compared to other states which had a greater undersupply of dwellings, but more expensive (and less available) land.
Public investment ramped up significantly over 2008/09 to 2010/11 (growing by 65 per cent),22 partly because the Victorian government was able to get the Federal stimulus spending underway quickly and partly because the state government was already proceeding with its own major health, rail, harbour and sewerage projects.23
Private sector engineering construction also made a healthy contribution, thanks to substantial electricity, pipelines, oil and gas activity, and work on the $1.6 billion Wonthaggi desalination plant. Strong growth in dwelling and public investment continued in 2010, although private engineering construction is now peaking and plant and equipment investment has declined. Partially offsetting these positives was a 32 per cent decline in private non-residential building over the two years to June 2011.24
The strength of the construction sector has fuelled strong growth in employment, household incomes and spending. Employment growth averaged 2.8 per cent in 2009/10 and accelerated to 3.6 per cent for 2010/11, compared to 1.4 per cent and 2.9 per cent for Australia.
Overall, state final demand (SFD) grew by 3.2 per cent in 2010/11, slower than the 3.8 per cent in 2009/10 but well above 2008/09 when growth only reached 0.8 per cent.25 Australian domestic demand over the same periods recorded growth of 3.3 per cent, 2.3 per cent and 0.9 per cent respectively. Gross state product (GSP) increased by 2.5 per cent in 2010/11, compared to Australian GDP growth of 2.0 per cent.26
19 ABS National Accounts 5206.0, December Quarter 2011. 20 Bureau of Transport and Regional Economics, Australian Sea Freight, 2009-10. 21 ABS National Accounts 5206.0, December Quarter 2011. 22 ABS National Accounts 5206.0, December Quarter 2011. 23 BIS Shrapnel, Engineering Construction in Australia 2010/11 Report. 24 ABS National Accounts 5206.0, December Quarter 2011. 25 ABS National Accounts 5206.0, December Quarter 2011. 26 ABS National Accounts 5206.0, December Quarter 2011.

APA Group Real Cost Escalation Forecasts to 2017, March 2012
© BIS Shrapnel Pty Limited 2012 11
2.2.1 Outlook for the Victorian Economy
While Victoria will not directly benefit from the major mining investment boom now underway (and set to drive the Australian economy over the medium term) the state will nevertheless benefit indirectly from strengthening domestic demand and private investment over the next three to four years. A stronger phase of growth is predicted in the second half of this decade. Overall, on average, the Victorian economy is forecast to maintain strong growth over the next seven years (i.e. from 2011/12 to 2017/18 inclusive), with SFD averaging 3.2 per cent and GSP averaging 2.7 per cent, essentially identical to the previous seven year average. Nevertheless, whilst the Victorian economy is set to experience solid growth over the forecast period (particularly over the second half of this decade), weakness in the total dwelling and non-dwelling construction sectors over the short-to-medium term means the state is likely to underperform the national average.
Victoria has a number of ‘structural positives’ which has seen the state economy often disproportionately benefit despite not having obvious internal economic drivers. The ready availability of reasonably priced residential land has prevented a collapse in dwelling investment, which has helped underpin the overall construction sector over the past decade. Office and white collar employment growth has also remained firm, helped by competitive office rents, a strong finance and business services sector, and possibly because the major mining companies such as BHP Billiton and Rio Tinto are headquartered in Melbourne, thereby indirectly benefitting from the resources boom.
The end result has been relatively strong population and employment growth. With these positive structural factors to continue to underpin relatively strong population growth—via an increased share of high net international migration and an only small interstate outflow—healthy demand for housing, infrastructure and household services will, in turn, support further business investment and employment.
However, there will be some negative factors which will constrain state economic growth over the next few years. The A$ is expected to remain around current levels or higher. This means the competitive pressures on the tradeables sectors will continue, with the state’s manufacturing, education and tourism sectors negatively affected.
The downturn in construction over the next three to four years will drag down overall state growth. Engineering construction will decline over 2011/12 and 2012/13, as work is progressively completed on the desalination plant, major sewerage infrastructure and the current round of pipelines, oil and gas investments.27 Non-residential building will continue to decline, with the end of stimulus spending causing steep declines in schools construction and, later, health and other social and institutional buildings and more than offsetting a recovery in commercial and industrial building. Dwelling building is also forecast to decline over 2012/13 to 2014/15 with the deficiency of stock predominately fulfilled by June 2013. Despite healthy growth in the underlying demand for dwellings, rising interest rates over 2012/13 and into 2013/14 will help trigger the downturn.
Growth in employment will slow over the next two years on signs of an imminent slowdown in dwelling and engineering construction. Growth in SFD and GSP is also forecast to slow over 2011/12 and 2012/13, mainly due initially to the decline in overall construction and relatively higher interest rates impacting on consumer demand, with the sharp slowing in Australian domestic demand in 2014/15 further impacting on Victoria’s economy.
27 BIS Shrapnel, Engineering Construction in Australia 2011/12 Report.

Real Cost Escalation Forecasts to 2017, March 2012 APA Group
12 © BIS Shrapnel Pty Limited 2012
Table 2.2: Victoria – Key Economic Indicators, Financial Years
Growth is expected to rebound in 2015/16 and strengthen thereafter as dwelling building, non-residential building and engineering construction pick up in tandem. The expected fall in interest rates will be the initial catalyst, but by mid-decade there will be pent-up demand for a new round of building and infrastructure due to reasonably strong population growth. The strong rebound in Australian domestic demand will also be a key driver, and Victoria’s economy is expected to perform well over the second half of the decade.
Average
Year Ended June 2007 2008 2009 2010 2011 2012 2013 2014 2015 2016 2017 2018 2012-18
VIC
Total Construction Activity(a) -2.1 4.5 7.3 8.3 6.5 -2.6 -10.3 -1.2 3.1 4.7 3.6 6.0 0.5State Final Demand 2.2 4.7 0.8 3.8 3.2 2.1 2.1 2.6 1.9 4.6 5.2 3.8 3.2Gross State Product (GSP) 3.8 3.4 0.9 2.3 2.5 1.5 1.6 2.4 1.9 4.1 4.2 3.2 2.7Employment Growth 3.1 3.3 0.9 2.8 3.6 0.1 0.7 1.8 0.6 2.0 2.8 3.2 1.6
AUST
Total Construction Activity(a) 5.7 6.5 9.0 3.2 5.8 10.2 5.3 8.1 0.1 -1.4 6.4 2.9 4.5Australian Domestic Demand 4.5 5.8 0.9 2.3 3.3 4.5 4.3 4.9 1.7 3.8 6.0 3.7 4.1Gross Domestic Product (GDP) 3.8 3.8 1.4 2.3 2.0 3.1 3.5 3.8 2.6 3.7 4.3 3.4 3.5Employment Growth 3.1 3.0 1.6 1.4 2.9 0.6 1.9 2.9 1.0 1.5 2.8 2.8 1.9
Source: BIS Shrapnel, ABS Data(a) Total construction work done (constant prices), equals the sum of new dwelling building, alterations and additions
activity over $10,000, non-residential building and engineering construction by the private and public sectors.
Annual Percentage Change

APA Group Real Cost Escalation Forecasts to 2017, March 2012
© BIS Shrapnel Pty Limited 2012 13
3. OUTLOOK FOR AUSTRALIAN INFLATION AND ALL INDUSTRIES WAGES
The key determinants of nominal wages growth are consumer price inflation, productivity and the relative tightness of the labour market (ie the demand for labour compared to the supply of labour). Price inflation, in turn, is primarily determined by unit labour costs. Other factors which also influence price inflation include the exchange rate, the stage of the business cycle and the level of competition in markets generally.
BIS Shrapnel’s model of wage determination is based on the analysis of past and future (expected) wage movements in three discrete segments of the workforce, based on the three main methods of setting pay and working conditions (see Tables 3.1 and 3.2):
Those dependent on awards rely on pay increases given in the annual National Wage case by Fair Work Australia (formerly by the Fair Pay Commission and Australian Industrial Relations Commission). Most of the wage increases in the National wage case over the past decade have been given as flat, fixed amount (ie dollar value) increases, rather than as a proportional increase although the most recent increase was given as a percentage increase. At the all industries level, 15.2 per cent of all employees (data excludes those in agriculture, forestry and fishing) have their pay rises determined by this method. In the electricity, gas and water sector, only 0.9 per cent of workers have their pay set by this method.
Collective agreements negotiated under enterprise bargaining account for 43.4 per cent of all employees, but over 80 per cent of electricity, gas and water employees’ wage increases are determined by this method (note the new ANZSIC2006 classification added ‘waste services’ to the previous ANZSIC1993 electricity, gas and water supply classification. We have excluded the waste services component from our analysis in section 4).
The remaining 41.4 per cent of all industries employees have their pay set by individual arrangements, such as individual contracts or other salary arrangements (including incentive-based schemes), while the proportion for electricity, gas and water is currently estimated to be around 19 per cent.
Table 3.1: Wages Growth, All Industries, Australia, (by Workforce Segmented by Pay Setting Method)
Forecast AveragesYear Ended June 2001 2002 2003 2004 2005 2006 2007 2008 2009 2010 2011 2012 2013 2014 2015 2016 2017 2018 2001-11 2012-18Proportion of Workforce by Pay setting MethodAwards Only 21.9% 20.5% 20.3% 20.0% 19.5% 19.0% 17.8% 16.5% 15.8% 15.2% 15.2% 15.2% 15.2% 15.2% 15.2% 15.2% 15.2% 15.2% 18.3% 15.2%Collective Agreements 37.5% 38.2% 39.6% 40.9% 41.0% 41.1% 40.5% 39.8% 41.6% 43.4% 43.4% 43.4% 43.4% 43.4% 43.4% 43.4% 43.4% 43.4% 40.6% 43.4%Individual Arrangements 40.7% 41.3% 40.2% 39.1% 39.5% 39.9% 41.8% 43.7% 42.6% 41.4% 41.4% 41.4% 41.4% 41.4% 41.4% 41.4% 41.4% 41.4% 41.1% 41.4%
Total 100% 100% 100% 100% 100% 100% 100% 100% 100% 100% 100% 100% 100% 100% 100% 100% 100% 100% 100.0% 100.0%
AWOTEAwards Only 2.3 1.9 2.6 2.4 2.7 2.3 2.7 1.9 2.4 0.7 3.2 2.3 2.3 2.9 2.9 2.5 2.6 2.6 2.3 2.6Collective Agreements 3.7 3.8 3.8 3.9 4.0 4.1 4.1 4.0 4.2 4.1 4.0 4.0 4.1 4.3 4.3 4.1 4.1 4.3 4.0 4.2Individual Arrangements (a) 7.8 8.5 7.4 6.7 5.7 6.2 3.5 6.9 7.8 8.9 4.7 5.8 5.9 7.2 7.2 4.9 6.6 7.3 6.7 6.4
AWOTE (Persons)(b) 5.1 5.4 5.0 4.7 4.4 4.6 3.6 4.9 5.5 5.6 4.2 4.6 4.7 5.4 5.5 4.3 5.1 5.6 4.8 5.0
Labour Price IndexAwards Only 2.3 1.9 2.6 2.4 2.7 2.3 2.7 1.9 2.4 0.7 3.2 2.3 2.3 2.9 2.9 2.5 2.6 2.6 2.3 2.6Collective Agreements 3.7 3.8 3.8 3.9 4.0 4.1 4.1 4.0 4.2 4.1 4.0 4.0 4.1 4.3 4.3 4.1 4.1 4.3 4.0 4.2Individual Arrangements (a) 3.8 3.6 3.5 3.9 4.0 4.9 4.3 5.1 4.7 2.9 3.8 3.9 4.7 5.3 4.7 3.8 4.7 5.4 4.1 4.6
Labour Price Index (Ord. Time) 3.5 3.3 3.5 3.6 3.7 4.1 3.9 4.1 4.1 3.1 3.8 3.7 4.1 4.4 4.3 3.7 4.2 4.6 3.7 4.1
Compositional Effects + Bonuses,etc 1.6 2.0 1.6 1.1 0.7 0.5 -0.3 0.8 1.3 2.5 0.4 0.9 0.6 1.0 1.2 0.6 1.0 1.0 1.1 0.9
(a) Indiv Agreements picks up all the compositional effects and bonuses, incentives,etc plus all the standard errors of LPI and AWOTE estimates by ABS Source:BIS Shrapnel,ABS,DEEWR(b) Full-time Adult Persons, excluding overtime
Year Average Percent Change

Real Cost Escalation Forecasts to 2017, March 2012 APA Group
14 © BIS Shrapnel Pty Limited 2012
Table 3.2: Methods of Setting Pay, Industry, May 2010 Proportion of Employees (%)
In terms of the key influences on the different wage determination mechanisms of each discrete segment:
Increases in the Federal Minimum Wage (on which a range of mostly lower paid awards are also based) granted by the Fair Work Australia (and by the Fair Pay Commission and the AIRC previously) each year are usually set in relation to recent increases in the CPI and with regard to the Fair Work Australia’s view of both current and short-term future economic conditions. Fair Work Australia granted a 3.4 per cent ($19.40) increase in minimum wages, effective July 2011. The $19.40 per week increase lifted the Federal Minimum Wage to $589.30 per week.
Increases in collective agreements under enterprise bargaining are influenced by a combination of recent CPI increases, inflationary expectations, the recent profitability of relevant enterprises, current business conditions and the short-term economic outlook, and by the industrial relations ‘strength’ of relevant unions. Because the average duration of agreements now runs for two-to-three years, BIS Shrapnel bases its near-term forecasts on the strength of recent agreements, which have been ‘formalised’ over recent quarters. Thereafter, collective agreements are based on BIS Shrapnel’s macroeconomic forecasts.
Increases in individual agreements are primarily influenced by the strength of the labour market (especially the demand-supply balance of skilled labour), inflationary expectations, the recent profitability of relevant enterprises, current business conditions and the short-term economic outlook.
Industry (ANZSIC 2006) Award Collective Individual All MethodsOnly Agreements Arrangements of Pay Setting
Mining 1.9% 41.4% 56.7% 100.0%Manufacturing 14.6% 26.4% 59.1% 100.0%Electricity, Gas, Water & Waste Water Services 3.1% 66.9% 30.0% 100.0%Construction 10.0% 23.1% 66.9% 100.0%Wholesale trade 10.9% 12.3% 76.8% 100.0%Retail trade 22.3% 41.0% 36.7% 100.0%Accommodation and Food Services 45.2% 30.1% 24.7% 100.0%Transport, Postal and Warehousing 8.0% 52.2% 39.8% 100.0%Information Media and Telecommunications 5.7% 31.3% 63.0% 100.0%Finance and Insurance Services 2.1% 42.6% 55.4% 100.0%Rental, Hiring and Real Estate Services 22.8% 9.5% 67.7% 100.0%Professional, Scientific ans Technical Services 4.2% 11.9% 83.9% 100.0%Administrative and Support Services 31.4% 27.2% 41.5% 100.0%Public Administration and Safety 1.9% 92.3% 5.8% 100.0%Education and Training 5.1% 84.1% 10.8% 100.0%Health Care and Social Assistance 17.1% 64.1% 18.8% 100.0%Arts and Recreation Services 15.1% 46.0% 38.9% 100.0%Other Services 27.2% 9.8% 63.1% 100.0%All Industries 2010 Survey 15.2% 43.4% 41.4% 100.0%
Electricity, Gas and Water (2006)10.9% 84.4% 14.7% 100.0%
Electricity, Gas and Water (2010)20.9% 80.0% 19.1% 100.0%
Source: Australian Bureau of Statistics, Employees Earnings and Hours, cat. No. 6306, Table 15
(2) EGW proportions for 2010 are estimated from the new ANZSIC 2006 data.
(1) Previous ANZSIC 1993 industry classification, which was used for May 2006 survey (and all previous surveys). August 2008 was the first survey using new ANZSIC 2006 categories. Updated survey May 2010.

APA Group Real Cost Escalation Forecasts to 2017, March 2012
© BIS Shrapnel Pty Limited 2012 15
Chart 3.1: Australia – Wages and Prices
Chart 3.2: Employment and Unemployment
88 90 92 94 96 98 00 02 04 06 08 10 12 14 16 18
Annual Per Cent Change
-1
1
2
3
4
6
7
8
9
0
5
Average WeeklyWage Earnings
(Persons)Labour Price
Index
BIS ShrapnelBaseline Inflation
Forecast
Year ended June Source: BIS Shrapnel, ABS data
88 90 92 94 96 98 00 02 04 06 08 10 12 14 16 18 -4
-2
0
2
4
6
8
10
12
0
50
100
150
200
250
Employment Growth(LHS)
Number of Job Vacancies (RHS)
June Source: BIS Shrapnel, ABS data
Forecast
ANZ Internet Job Ads / 5000(RHS)
Unemployment Rate(LHS)
Annual Per Cent Change '000's

Real Cost Escalation Forecasts to 2017, March 2012 APA Group
16 © BIS Shrapnel Pty Limited 2012
3.1 Outlook for Australian All Industries Wages
Wage pressures normalised in 2010/11 – slow build in 2011/12 to precede strong growth
BIS Shrapnel believes that wage inflation over the next 18 months will be shaped by a moderation in wages growth for award-reliant workers, moderate growth in wages for those on enterprise bargaining and solid growth in wages for those on individual agreements, particularly skilled workers.
After receiving no increase in entitlement in 2009 — with the Fair Pay Commission citing as its reasons, the deterioration of economic conditions and the spurious link between minimum wage increases and higher unemployment — the ‘normalisation’ of trading conditions and the strength of competition for skilled workers saw Fair Work Australia grant a $26 increase in all modern award minimum weekly wages in 2010. Following the catch-up in 2010 and the 2010/11 Annual Wage Review, Fair Work Australia granted a 3.4 per cent ($19.40) increase in minimum wages, effective July 2011. The $19.40 per week increase is expected to lift award wages by 2.3 per cent in 2011/12.
Recent collective agreements data from the Department of Education, Employment and Workplace Relations (DEEWR) shows that average annualised wage increases (AAWIs) for All Industries lodged during 2010/11 were marginally higher (averaging 4.0 per cent) than the average in 2009/10, which in turn was the lowest since 2001/02.28 Given the easing in headline inflation and employment growth through 2011, we expect collective agreements to remain around the 2010/11 levels in 2011/12 before picking up later in 2012.
With respect to those on individual agreements, our expectation is that this segment will see overall growth weaken slightly through 2011/12, but that there will be marked divergences between industries. Skilled labour shortages are re-emerging in the sectors which drove strong increases in individual agreements prior to the global financial crisis and this will hold up overall wages growth in this segment. However, trading conditions are currently sluggish for many businesses and we don’t expect to see much of an improvement until the second half of 2012.
The upshot is that after easing through 2011, wages growth is forecast to pick up gradually through 2012 as economic and employment growth strengthen, and the unemployment rate gradually declines back below 5 per cent by late 2012. The LPI is expected to ease to 3.7 per cent in 2011/12, before rising to 4.1 percent in 2012/13. Meanwhile, AWOTE is expected to rise from 4.2 per cent in 2010/11 to average 4.6 per cent in 2011/12, and 4.7 per cent in 2012/13.
Medium to longer term outlook – wages growth higher as pressures persist
A broadening in employment, profits and investment is expected from mid-to-late 2012 as increased mining investment and incomes and lower interest rates stimulate wider economic activity, lifting confidence and spending and encouraging businesses to switch out of cost-containment mode. The acceleration in profits, rising price inflation through 2012/13 and widening skills shortages – with the unemployment rate pushing below 4.5 per cent by mid 2013 – will drive up wages growth during 2012/13 and particularly 2013/14. Wages growth (in year average terms) is expected to rise further and peak at 5.4 per cent for AWOTE and 4.4 per cent for LPI in 2013/14.
This will see the RBA act to constrain economic growth and inflationary pressures during 2013 and 2014 by raising interest rates. As wage and price pressures build, the approach by the RBA will become increasingly aggressive and this will eventually undermine domestic demand. The mining investment boom will be largely unaffected and strong competition for workers will
28 DEEWR, Trends in Federal Enterprise Bargaining, June Quarter, 2011.

APA Group Real Cost Escalation Forecasts to 2017, March 2012
© BIS Shrapnel Pty Limited 2012 17
continue to underpin strong employment and wages growth in investment related sectors, but this will be offset by weakening profits and demand for labour elsewhere in the economy over 2014.
The higher interest rates are expected to cause a slowdown in economic and employment growth during 2014, and this will eventually feed through to wages growth in 2015, with wages growth in the individual arrangements and award segments slowing first. Wages growth is forecast to ease to 3.7 per cent in LPI terms in 2015/16, while AWOTE growth eases to 4.3 per cent at the same time. But with only a small rise expected in the unemployment rate to around 5.5 per cent in 2015 because of the deceleration in ‘working population’ and slower labour force growth, the ongoing tight labour market is expected to see wage pressures rise again in the second half of the decade, once the subsequent recovery resumes.
Indeed, by the middle of this decade, both skilled and general labour shortages will begin to emerge due to demographic factors, i.e. retirements and less hours worked per person (especially for older workers). Australia will continue to experience sustained labour shortages in the decade to 2022 (and beyond), and these shortages will become more significant as the workforce ages. As Australia’s ‘baby boomers’ generation move into the 65+ age group, the growth of the 15-64 year old component of Australia’s working age population (the overwhelming majority of Australia’s workforce) will begin to slow.
With more people retiring, the supply of labour is expected to increase at a slower rate through the coming decade. This will lead not only to skilled labour shortages, but total labour shortages. Meanwhile, the demand for labour will continue to rise — particularly in periods of strong investment and economic growth. These sustained labour shortages will result in a long term upward bias in wage inflationary pressures.
In summary, for the seven years from 2011/12 to 2017/18 inclusive, the annual growth in the ’All Industries’ LPI is forecast to average 4.1 per cent per annum, while AWOTE growth will average 5.0 per cent per annum.
3.2 Outlook for Consumer Price Inflation
Extreme weather events in Australia and high oil prices saw consumer prices shift higher in the first half of 2011. The CPI inflation rose 0.9 per cent in the June 2011 quarter to be 3.6 per cent higher through the year. Meanwhile, annual underlying inflation, which has been on a slow downward drift since the global financial crisis, increased only marginally to 2.3 per cent in the March 2011 quarter before rising to 2.9 per cent in June 2011.
However, the main measures of CPI inflation all eased in the September and December quarters, with the easing in inflationary pressures reflecting both the lagged effects of the weakening in the economy — particularly consumer spending — and the strength of the dollar over the past year (notwithstanding the falls in the dollar in August and September). The underlying inflation rate was only 0.4 per cent for the September 2011 quarter rising to 0.6 per cent for the December quarter, with the through-the-year rate easing back to 2.6 per cent for both the September and December quarters, 2011.
Headline inflation to ease further over next six months, but underlying CPI to remain around 2.5 per cent
Headline CPI was lifted over 3 per cent over 2011 by the high outcomes in the March and June quarters of 2011, when the extreme weather events and high oil prices pushed up fruit and vegetable prices and fuel prices. However, as these large one-off spikes drop out, the headline CPI is forecast to ease back to 2.0 per cent by the June quarter 2012. Meanwhile, we expect the underlying CPI inflation measure to stabilize at around current levels, before rising from the

Real Cost Escalation Forecasts to 2017, March 2012 APA Group
18 © BIS Shrapnel Pty Limited 2012
second half of 2012. At that time, the headline CPI rate will again jump back above 3 per cent as the carbon tax kicks in from July 2012 and pushes up energy and some other prices.
Soft economic conditions and upstream price and cost price pressures will mute prices
Overall, the year-average increase in the headline CPI in 2011/12 is expected to be 2.7 per cent, while underlying inflation will average 2.4 per cent. The relative stability of the underlying CPI measures over 2011/12 is expected to be the outcome of several opposing forces. Factors acting to mute prices in the near-term include:
Upstream costs such as input costs, producer prices and wages growth have softened recently and are likely to remain fairly benign into 2012.
Modest growth in the domestic economy (ie domestic demand) is likely to persist through the remainder of 2011/12, with households and businesses only gradually loosening the purse strings. The economy is unlikely to jump back into a boom, even with the stimulus provided by the November and December interest rate cuts by the Reserve Bank. The relative weakness in large sections of the economy means less demand inflationary pressures. It also means employment growth will remain weak, and although we expect a pick-up in employment growth in the first half of 2012, the unemployment rate will remain above 5 per cent, with the relatively weak labour market muting wage pressures.
A cyclical rise in productivity (as GDP growth outpaces employment growth) will help reduce unit labour costs.
The strength of the Australian dollar will continue to mute import and tradeables prices.
Continuing weakness in consumer spending volumes and the strength of the dollar is also likely to elicit further discounting by retailers and some household service providers in the near term.
Food price growth is expected to remain constrained due to recent declines in some global agricultural prices and favourable rural conditions in Australia (boosting local supply).
But utilities, rents, housing costs, health, education and fuel will add to price pressures
There are, however, some areas of the economy where supply constraints or other institutional factors will conspire to keep certain prices elevated over 2011/12 and beyond:
Utilities prices jumped 7.2 per cent on average in the September quarter, and in the December quarter, 2011 were 10.1 per cent higher than the December quarter 2010. Recently, large increases in utilities charges (comprising electricity, gas & other household fuels and water & sewerage costs) have had a significant impact on overall inflation. A move towards cost-based pricing, the need to replace and expand infrastructure to meet demand (particularly peak demand loads), and rising input costs has seen utilities inflation move to a higher plane. We believe utilities prices will continue to grow strongly in the near-term as a significant ‘catch-up’ still exists for the below-average price increases and under-investment in infrastructure during much of the 1990s. In fact, regulators in most states have already approved significant price increases for electricity, which have been implemented from 1 July 2011. These include: Queensland 5.8 per cent, New South Wales 9.6 per cent to 13.1 per cent, Tasmania 8.5 per cent and South Australia over 12 per cent, while further double-digit increases are expected in Western Australia.

APA Group Real Cost Escalation Forecasts to 2017, March 2012
© BIS Shrapnel Pty Limited 2012 19
Further incremental rises through 2011/12 are expected to push overall electricity price growth to June 2012 closer to 11 per cent. The imposition of the carbon tax in July 2012/13 will then lift utilities growth over 17 per cent through 2012/13 (over 20 per cent for electricity).
Health, education and insurance are expected to maintain their high price growth.
Fuel prices jumped 13 per cent in the first half of 2011 as tensions in Libya pushed oil prices over US$100/barrel. Prices subsequently eased over the second half of 2011, but oil prices are again around US$100 on the back of Middle East tensions. Assuming these tensions will ease, prices will fall back by mid 2012. However, we expect oil prices to rise back over US$100/barrel by the end of 2012 and then climb higher over 2013 and 2014 on the back of a stronger demand from China, Asia and the US, which will feed into higher fuel prices locally.
Rents and new dwelling purchase costs (the latter related to the cost of building and purchasing new dwellings by owner-occupiers, excluding land costs) are expected to rise through 2011/12 and especially 2012/13.
Rents have been increasing due to a significant deficiency of residential stock, with vacancy rates at near the lowest levels in over a decade across Australia. Dwelling construction in most major capital cities has now fallen to a level where not enough is being built to satisfy underlying demand for dwellings.29 We believe annual rental inflation will remain elevated over the next two years due to the persistent deficiency of residential stock.
Implementation of a price on carbon to provide one-off boost to electricity prices . . . but overall CPI impact likely to be muted
The Federal Government recently passed legislation to introduce a carbon price (tax) in an effort to reduce carbon pollution and contribute towards the global initiatives to mitigate climate change caused by greenhouse gas emissions. By imposing a carbon price the government also hopes to facilitate the transition to a low-(carbon) emissions economy, ie generate investment in low emission technologies such as renewable technologies. The initial price of $23 per tonne of CO2-e emissions will commence on 1 July 2012.
The imposition of the initial (fixed) carbon price will lead to a ‘one-off’ lift in some of the expenditure classes of the CPI. The Commonwealth Treasury projects that under a $23 carbon price, electricity prices will increase by an extra 10 per cent in 2012/13, gas prices by 9 per cent while food prices are expected to rise by less than 0.5 per cent. Overall, the CPI impact in 2012/13 is estimated at 0.7 per cent, significantly lower than the introduction of GST which increased CPI by around 2.5 per cent through-the-year to June quarter 2001.30
In dollar terms, the Treasury projects that household expenditure, on average, is expected to increase by $3.30 per week due to higher electricity prices and by $1.50 per week due to higher gas prices. Most items in consumer budgets will increase by less than 1 per cent such as food where households are expected on average to spend only an additional $0.80 per week.
Some second-round impacts of the carbon price could also occur, if these higher relative prices cause consumers and businesses to reassess their beliefs on underlying aggregate inflationary pressure, and therefore change their wage and price setting behaviours. This change in behaviour would have consequences for the medium-term trend of inflation. However, the CPI impact of the carbon tax is likely to be quarantined, and offset in wage formation.
29 BIS Shrapnel internal research. 30 Based on Commonwealth Treasury estimates and BIS Shrapnel research.

Real Cost Escalation Forecasts to 2017, March 2012 APA Group
20 © BIS Shrapnel Pty Limited 2012
Table 3.3: Wages and Prices – Australia Year Average Growth
$/week 2012=100 2012=100
2000 785.9 64.4 70.3 70.32001 825.1 5.0 66.7 3.6 73.4 4.4 73.4 4.4
2002 867.1 5.1 68.9 3.2 75.6 3.0 75.6 3.02003 913.7 5.4 71.4 3.7 77.7 2.8 77.7 2.82004 948.5 3.8 73.9 3.6 79.6 2.3 79.6 2.32005 998.9 5.3 76.9 4.0 81.7 2.7 81.7 2.72006 1 032.6 3.4 79.9 3.9 84.6 3.5 84.6 3.5
2007 1 081.8 4.8 83.2 4.1 86.5 2.3 86.5 2.32008 1 133.8 4.8 86.7 4.2 90.3 4.4 90.3 4.42009 1 198.6 5.7 89.8 3.6 91.9 1.8 91.9 1.82010 1 257.0 4.9 92.8 3.4 94.6 2.8 94.6 2.82011 1 312.8 4.4 96.3 3.7 97.8 3.4 97.8 3.4
Forecasts 2012 1 372.0 4.5 100.0 3.9 100.0 2.3 100.0 2.32013 1 440.5 5.0 104.3 4.3 102.9 2.9 102.9 2.92014 1 521.7 5.6 109.0 4.5 105.6 2.6 105.6 2.62015 1 595.6 4.9 113.1 3.8 108.1 2.3 108.2 2.52016 1 667.0 4.5 117.5 3.9 111.1 2.8 110.9 2.52017 1 758.5 5.5 122.7 4.4 114.8 3.3 113.7 2.5
1990-2000 3.8 2.2 2.22000-2010 4.8 3.7 3.0 3.02006-2011 4.9 3.8 2.9 2.92011-2017 5.0 4.1 2.7 2.5
Source: BIS Shrapnel, ABS data
(1) Earnings per person for full-time adults. Data is year ended November (available only mid month of quarter).(2) RBA Forecasts to June 2014. Beyond June 2014, Commonwealth Treasury's forecasts are used.
Compound Annual Growth Rates
Year Ended December
Average Weekly CPI Headline Inflation
Ordinary Time Earnings(1)
2012=100All Industries%CH %CH %CH
Labour Price
Index
Official
Headline CPI (2)(BIS Shrapnel forecasts)

APA Group Real Cost Escalation Forecasts to 2017, March 2012
© BIS Shrapnel Pty Limited 2012 21
Stable exchange rate over next 2-3 years means less deflationary impact
Over most of the past decade, the steady rise in the Australian dollar – from an average of US$0.52 in 2001/02 to US$0.99 in 2011/12 - has been a key factor in keeping overall inflation mostly within the Reserve Bank’s target band of 2-3 per cent (except over 2008/09, when the exchange rate fell from an average of US$0.94 in June quarter 2008 to US$0.66 in the March quarter 2009, before again resuming its upward path). The dollar rose from an average of US$0.52 in 2001/02. An appreciating currency limits the rise in import prices, which is then partially passed on by retailers to help hold down ‘tradeables’ inflation. Tradeables inflation constitutes around 42 per cent of the CPI, but includes the volatile automotive fuel and fruit and vegetable sub-categories.31
The Australian dollar is influenced by two key factors: interest rates in Australia compared to overseas (particularly US interest rates) and commodity prices. Rising commodity prices and relatively high domestic interest rates will continue to support the A$ over the next two to three years. However, we don’t expect to see a further significant appreciation. Declines in commodity prices and cuts to local interest rates over the second half of 2011 saw the Australian dollar fall from an average US$1.06 (77.5 on the Trade Weighted Index [TWI]) in the June quarter, 2011 to US$1.01 (74.8 TWI) in the December quarter 2011. Commodity prices are expected to remain around current levels over the first half of 2012 (assuming no significant deterioration in Europe), before increasing through 2012/13 and 2013/14 as overseas demand recovers (particularly China, Asia and, eventually, the US). Prices are expected to peak around mid-decade, before declining in response to increased supply coming on-stream from the current mining investment boom (both in Australia and overseas). However, some agricultural prices are likely to rise further over the medium term in response to ongoing supply fluctuations and particularly as increasing global populations and rising average incomes through Asia drive up demand for food.
Meanwhile, local interest rates are predicted to rise in 2013 and 2014. A considerable overhang in capacity is keeping inflationary pressures at bay in the US, but firming demand should see the US Federal Reserve start to lift interest rates by late 2013. Rising US interest rates will narrow the interest rates differential between Australia and the US which will also weigh down on the attractiveness of the A$ from 2014. Overall, BIS Shrapnel is forecasting the exchange rate to average US$1.03 in 2011/12, before rising to US$1.04 in 2012/13 and US$1.06 in 2013/14. We then expect the exchange rate to depreciate to below US$1.00 by the end of 2014 (and average US$0.94 in 2014/15) – although the currency will continue to be volatile in a US$0.95 to US$1.10 band over the next two-to-three years.
These modest rises forecast for the currency will only partially offset rising inflation overseas over 2012/13 and 2013/14. Then, in 2014/15, BIS Shrapnel is forecasting a 12 per cent depreciation in the exchange rate, falling from an average of US$1.06 in 2013/14 to US$0.94. This will push up tradeables inflation. The decline in the exchange rate is expected to be the result of a number of factors – Australian interest rates are expected to decline as the economy softens, while at the same time better economic conditions overseas will see US and European interest rates finally begin to rise, lessening the relative attractiveness of Australian rates. Adding the weakness of the A$ will be the projected weakening in commodity prices. Overall, the end result will see underlying tradeables inflation (ie excluding fuel, fruit and vegetables) increase over the three years to 2014/15 at a faster rate than the six years to June 2008 and over 2009/10 and 2010/11, although still mostly below an annual rate of 2 per cent per annum.
31 ABS, CPI 6401.0

Real Cost Escalation Forecasts to 2017, March 2012 APA Group
22 © BIS Shrapnel Pty Limited 2012
Lower fuel, fruit and vegetable prices will help keep overall tradeables inflation muted over 2011/12, as the flood and cyclone inspired price spikes reverse and as global oil prices decline back below US$100/barrel – assuming the unrest in the Middle East subsides. However, fruit and vegetable prices are likely to return to their year-to-year volatility over subsequent years, while global oil prices are expected to increase over the medium term as global demand increases in line with economic recovery overseas, but new supply is constrained – pushing up local petrol prices. Higher fruit and vegetable and fuel prices will add to the headline inflation rate over the medium term.
Inflation to rise toward 3.5 per cent over 2012/13 and 2013/14, before easing in 2014/15
Aggregate CPI inflation will also be pushed up by rising non-tradeables inflation, largely as a result of faster growth in wages and the persistence of high rates of inflation in rents, utilities, health, education, child care services and other housing costs. From the second half of this year, employment growth will follow the recovery (albeit sluggish) in demand and output, with accelerating growth in employment over 2012 producing a decline in the unemployment rate, falling below 5 per cent by the end of 2012. The strengthening in employment growth and the economy generally will result in rising incomes and demand, which, combined with the shrinking of spare capacity, will add to demand inflationary pressures during 2013 and 2014. Wages growth is also expected to pick up over these two years, with continuing weak productivity growth also adding to the rise in unit labour costs and non-tradeables inflation.
By late 2013/early 2014, the economy is expected to approach full capacity constraints, with the unemployment rate predicted to fall below 4,5 per cent and towards 4.0 per cent. Inflationary pressures, therefore, will be broad-based, but labour shortages will be the key constraint on the economy and the RBA will take an increasingly aggressive approach to reducing demand pressures through 2013. The efforts of the RBA are expected to successfully rein in growth in domestic demand from the first half of 2014, but wage and price pressure will be sticky downward, because both wages and, to a lesser extent, price inflation tend to lag the strength of growth in demand and output. In 2014/15, we expect non-tradeables inflation to ease through the year as the domestic economy and employment soften, but weaker non-tradeables inflation will be partially offset by higher tradeables inflation caused mainly by the depreciation of the A$.
We believe inflation containment will remain a policy challenge well into the medium term. Tight labour markets will emerge once again in the medium term to become a chronic problem for inflation. The large pool of unemployed that was a feature of the 1990s has gone. Moreover, skilled labour shortages will remain a problem for the foreseeable future, particularly given anecdotal evidence of a re-emergence of skilled labour shortages so early into the post-GFC recovery. Inflation will act as the main ‘safety valve’ on Australia’s constrained economy.
Whenever the unemployment rate starts to track below 5 per cent there will be the potential for a demand-driven rise in wages growth and inflation. Pressures may moderate from time to time, but it would take another full-blown recession and a sharp fall in employment to really see inflationary pressures be significantly subdued.
In summary, BIS Shrapnel is forecasting year-average headline CPI inflation to average 2.5 per cent in calendar 2012, 3.4 per cent in 2013 – including the effects of the carbon tax (or 2.7 per cent excluding the carbon tax effects) – 3.4 per cent in 2014 and 3 per cent in 2015. Over the six years from 2012 to June 2017 inclusive, the annual rate of inflation is forecast to average 3.1 per cent per annum.

APA Group Real Cost Escalation Forecasts to 2017, March 2012
© BIS Shrapnel Pty Limited 2012 23
3.2.1 Reserve Bank of Australia CPI forecasts
The Reserve Bank and the Federal Treasury provide the ‘official’ view of CPI forecasts. The RBA’s February ‘Statement on Monetary Policy’ projects the headline CPI rate at 1.75 per cent in the June quarter 2012, before rising to 3 per cent in the December quarter 2013.32 According to the RBA, headline CPI inflation (including the carbon price) is then expected to rise to 3.25 per cent by June 2013 before falling to 2.5 per cent by December 2013. Inflation is expected to remain within 2.5 to 3 per cent band through the year to June 2014 (RBA current forecasts only extend to June 2014).
The Federal Treasury in the 2011/12 Budget Papers (released in May 2011) projected CPI inflation at 2.75 per cent in 2011/12 and 3 per cent in 2012/13. For the budget forward estimate period ie 2013/14 and 2014/15 financial years, the Federal Treasury forecast CPI inflation at 2.5 per cent. Over the longer term, we have used this same mid-point of the RBA’s inflation target range of 2-3 per cent over the cycle.
32 Reserve Bank of Australia, Statement on Monetary Policy, February 2012.


APA Group Real Cost Escalation Forecasts to 2017, March 2012
© BIS Shrapnel Pty Limited 2012 25
4. GAS PIPELINE-RELATED LABOUR COST ESCALATION
4.1 Key points
Gas pipeline-related labour includes a range of skilled labour who works directly and indirectly on the construction, maintenance, design and operation of the gas pipeline, in both the operational (opex) and capital enhancement (capex) aspects. The workers work both in the field and in the offices. The escalator which BIS Shrapnel proposes to use for the gas-pipeline related labour is wages growth in the Electricity, Gas and Water Supply (EGW or ‘Utilities’) sector for Victoria.
Overall, BIS Shrapnel expects total wage costs for the Australian utilities sector — expressed in Average Weekly Ordinary Time Earnings (AWOTE) — will average 5.7 per cent per annum over the six years from 2012 to 2017 inclusive, 0.7 per cent higher than the national ‘All Industries’ AWOTE average of 5.0 per cent per annum over the same six year period (see table 4.5). In terms of underlying wages growth in the electricity, gas and water (‘utilities’) sector for total Australia — expressed in labour price index (LPI) terms — BIS Shrapnel is forecasting an average of 4.9 per cent per annum (0.8 percentage points higher than the national ‘All Industries’ LPI average of 4.1 per cent per annum) over the six years from 2012 to 2017 inclusive (see table 4.5). The faster wages growth expected in the electricity, gas and water sector over the next six years is in line with historical movements in the LPI over the past six years (see Table 4.5).
The continued stronger wages growth in the Australian utilities’ sectors is due to:
– Sustained strong demand for skilled labour in the utilities sector, due to continued high levels of capital and maintenance expenditure in the utilities sector, related to major network upgrades and refurbishment and the need for new capacity in the electricity, gas and water sectors to cater for population and economic growth over the long term.
– Heightened competition from the Mining, Construction and (to a lesser extent) Manufacturing sectors for similar skilled labour as those sought in the utilities sector, driven in particular by the resources investment boom, which is expected to ramp up substantially over the next four years and remain at high levels over the following five to ten years.
– Relatively stronger unions continuing to win above average enterprise bargaining agreements in what is an essential services sector. Collective agreements dominate the pay setting in the utilities sector (covering around 80 per cent of employees in the Electricity, Gas and Water sector).
Utilities wages growth in Victoria is forecast to average 5.4 per cent per annum (in AWOTE terms) over the six years from 2012 to 2017, 0.3 percentage points lower than the national utilities AWOTE average of 5.7 per cent per annum, while Victorian utilities LPI growth is forecast to average 4.5 per cent per annum (also 0.4 per cent lower than the national utilities average of 4.9 per cent per annum) over the six years from 2012 to 2017 inclusive (see table 4.8). The weaker utilities wages growth in Victoria is due to Victoria’s lower exposure to the resources investment boom (compared to Queensland and Western Australia in particular), the comparative weakness of the state’s construction sector (compared to total Australia) and the comparative weaker growth in Victorian utilities-related engineering construction. This means a lower relative demand for similarly-skilled labour from the state’s construction and mining sectors and within the states utilities sector, compared to other states and therefore slower wages growth compared to the national utilities average.

Real Cost Escalation Forecasts to 2017, March 2012 APA Group
26 © BIS Shrapnel Pty Limited 2012
Table 4.1: Labour Price Index Growth by Industry Sector and by State
Table 4.2: Australia AWOTE Growth by Industry Sector
Jun'10
Private 4.0 3.9 4.4 3.6 2.7 4.0 3.9 3.7 3.8 3.8Public 4.3 4.2 3.9 4.4 4.0 3.6 3.7 3.3 3.2 3.9
Industry
Mining 2.1% 5.9 5.5 6.7 4.2 3.8 4.6 4.1 4.1 3.6 4.6Manufacturing 8.3% 3.9 4.1 4.6 2.5 2.6 3.9 4.1 3.6 3.8 3.6Electricity, Gas, Water and Waste Services 1.4% 6.4 4.0 3.5 4.7 4.7 3.7 3.7 3.6 3.2 4.2Construction 9.1% 5.9 4.2 4.7 4.5 2.9 4.4 4.0 3.9 4.0 4.2Wholesale Trade 3.9% 3.7 3.7 4.6 3.3 1.7 4.4 4.8 4.4 4.4 3.6Retail Trade 10.6% 3.4 3.1 4.5 3.5 2.8 3.3 3.3 3.0 3.0 3.6Accommodation and Food Services 6.8% 3.3 3.0 2.3 3.4 2.0 3.3 3.0 3.1 3.8 3.1Transport, Postal and Warehousing 5.1% 4.2 4.1 3.9 4.4 3.2 3.6 4.0 3.7 3.4 3.8Information Media and Telecommunications 1.8% 2.8 3.6 3.9 3.0 2.0 3.5 3.2 3.8 4.2 3.2Finance and Insurance Services 3.7% 4.0 4.3 3.6 3.2 3.1 4.3 4.5 3.8 4.0 3.8Rental, Hiring and Real Estate services 1.7% 3.9 3.0 4.1 3.6 2.5 3.0 3.6 3.6 4.0 3.5Professional, Scientific and Technical Services 7.6% 4.3 4.3 5.1 5.1 2.9 4.7 4.0 4.2 4.7 4.3Administration and Support Services 3.5% 3.3 3.6 4.9 2.9 2.5 3.8 3.7 3.2 3.0 3.7Public Administration and Safety 6.5% 4.2 4.3 3.9 4.5 3.7 3.6 3.4 2.8 2.9 3.9Education 7.5% 4.4 4.1 4.0 4.5 3.9 3.9 3.8 3.9 3.6 4.1Health Care and Social Assistance 11.8% 4.5 4.3 3.6 3.9 4.0 3.3 3.6 3.2 3.0 3.6Arts and Recreation Services 1.8% 3.0 4.4 3.4 3.9 2.8 3.1 3.4 3.3 4.2 3.8Other Services 3.9% 3.2 4.0 3.3 3.3 2.3 3.0 3.6 4.6 4.4 3.5
State/Territory
New South Wales 31.5 3.9 3.8 4.0 3.6 3.1 3.8 3.7 3.6 3.8 3.7Victoria 25.0 3.7 3.6 4.2 3.4 2.7 3.9 4.1 3.5 3.5 3.6Queensland 20.5 4.7 4.6 3.9 4.1 3.3 3.9 3.9 3.8 3.6 3.9South Australia 7.2 3.7 4.3 4.6 3.7 2.9 3.6 3.3 3.4 3.3 3.7Western Australia 10.9 4.6 5.2 5.6 4.6 3.4 4.1 3.8 4.0 4.0 4.5Tasmania 2.1 4.1 4.5 3.6 4.2 3.6 3.5 3.5 3.9 3.6 3.8Northern Territory 1.1 3.9 4.3 4.2 3.8 3.4 4.1 3.9 3.9 4.3 4.0Australian Capital Territory (ACT) 1.8 3.8 4.3 4.0 4.1 3.0 3.7 3.5 3.0 3.0 3.7
Total All(2) 100 4.2 4.0 4.2 3.8 3.1 3.9 3.8 3.6 3.7 3.8Source: BIS Shrapnel, ABS data
(1) Measures changes in the price of labour. Ordinary hourly rates of pay (excludes overtime and bonuses) (2) Excludes Agriculture, Forestry and Fishing sector
Jun'08 Jun'09 Dec'11Mar'11 Jun'11 Sep'11
Annual Per Cent ChangeLabour Price Index(1)
Jun '06 Jun'07
Sector% of Total
Employment Nov' 2011
Five-Year Average
May '07 May '08 May'09 May'10 Feb'11 May'11 Aug'11 Nov'11
Mining 2.1% 2 185 5.8 9.5 6.4 6.4 5.9 5.2 4.5 5.2 6.8Manufacturing 8.3% 1 192 4.5 4.1 4.5 1.5 3.2 4.1 2.8 4.2 3.5Electricity, gas, water and waste services 1.4% 1 508 4.2 2.2 7.0 9.5 9.5 7.2 3.8 3.2 5.7Construction 9.1% 1 368 8.0 7.1 9.0 6.8 5.6 3.8 5.4 5.3 7.3Wholesale trade 3.9% 1 339 5.9 3.9 4.8 0.8 0.9 9.3 11.9 11.7 5.1Retail trade 10.6% 979 4.0 2.5 4.8 6.3 0.7 -1.2 3.1 3.6 3.9Accommodation and food services 6.8% 957 8.9 0.1 3.5 4.5 3.5 3.3 5.0 3.5 4.1Transport, postal and warehousing 5.1% 1 289 -0.5 1.8 3.4 7.5 7.3 6.6 6.1 4.9 4.8Information media and telecommunications 1.8% 1 543 10.8 4.2 5.2 5.6 4.2 4.5 4.9 2.2 5.2Finance and insurance 3.7% 1 548 3.7 4.9 1.4 7.5 5.3 2.9 2.3 -0.1 3.7Rental hiring and real estate services 1.7% 1 217 3.9 7.7 6.4 1.8 -0.1 -1.9 -0.1 0.9 3.5Professional, scientific and technical services 7.6% 1 581 5.0 6.5 5.6 7.1 2.9 3.0 2.8 2.8 5.5Administration and support services 3.5% 1 152 4.5 7.7 6.4 7.3 -0.9 -3.5 -2.8 -4.8 3.9Public administration and defence 6.5% 1 403 3.5 3.8 6.0 7.2 4.6 3.9 2.5 2.4 4.9Education and training 7.5% 1 407 4.4 2.3 5.3 5.6 4.2 4.4 4.3 4.2 4.3Health and social assistance 11.8% 1 269 6.5 2.5 7.0 2.9 2.2 5.8 6.9 4.6 4.8Arts and recreational services 1.8% 1 202 6.9 2.3 5.3 2.2 5.7 5.9 5.5 5.0 5.7Other services 3.9% 1 051 1.9 2.5 7.0 0.5 6.4 1.3 1.9 1.1 3.9
Total All Industries(2) 100% 1 330 5.0 3.7 10.5 5.2 3.8 4.4 5.3 4.3 5.0
(1) Full Time Adult Ordinary Time earnings for persons Source: BIS Shrapnel, ABS data(2) Excludes Agriculture, Forestry and Fishing sector
Five-Year Average
Industry Sector% of Total
Employment Nov' 2011
Average Weekly Earnings(1)
$ / Week Nov '11
Annual Per Cent Change

APA Group Real Cost Escalation Forecasts to 2017, March 2012
© BIS Shrapnel Pty Limited 2012 27
4.2 Key Drivers of Sustained Strong Growth in Underlying Wages Growth (Labour Price Index) in the National Utilities Sector
Wages growth in the electricity, gas and water sector is invariably higher than the total Australian national (all industry) average. The labour price index growth has consistently been above the national average since the index’s inception in 1997 (although it was the same as the national average in 2007/08) and averaged 0.8 per cent higher over the decade to 2010 (see table 4.5). While growth in average weekly ordinary time earnings (AWOTE) of the electricity, gas and water sector has displayed considerably more volatility (mainly related to compositional effects) over the past two decades, AWOTE growth in the sector has also usually been higher than the national average over the past two decades (see tables 4.2 and 4.5).
LPI is an underlying wage inflation measure, while AWOTE measures changes in average labour costs
We begin our analysis of labour cost escalation in the utilities sector by first considering the two main wage inflation measures – the labour price index (LPI) and Average Weekly Ordinary Time Earnings (AWOTE). BIS Shrapnel considers the labour price index (LPI) to be a measure of underlying wage inflation in the economy or in a specific industry, as the LPI only measures changes in the price of labour, or wage rates, for specific occupations or job classifications, which are then aggregated into a measure of the collective variations in wage rates made to the current occupants of the same set of specific jobs.
The LPI, therefore, reflects pure price changes, but does not measure variations in the quality or quantity of work performed. The LPI also does not reliably measure the changes in total labour costs which a particular enterprise or organisation incurs, because the LPI does not reflect the changes in the skill levels of employees within an enterprise or industry. As skills are acquired, employees will be promoted to a higher grade or job classification, and with this promotion will move onto a higher base pay. So the change in the cost of labour over, say a year, includes increases in the base pay rates (which the LPI measures) and the higher average base pay level. The AWOTE captures both these elements, while the LPI only captures the first element. Basically, promoting employees to a higher occupation does not necessarily show up in the LPI, but the employer’s total wages bill (and average unit labour costs) is higher, as is AWOTE. The AWOTE measure also includes bonuses, incentives, penalty rates and other allowances, which are also part of an enterprises total wage bill (a more detailed description of the wage measures can be found in Appendix A).
Another problem with the use of the LPI is that it is only available from the ABS for two states — NSW and Victoria — which is a problem in using it as a labour cost escalator for other states not covered. Despite the limitations of the LPI, the AER has preferentially used the LPI as the escalator for labour costs in recent decisions,33 largely because of the volatility of AWOTE caused by perceived ‘significant’ compositional problems with AWOTE, although we would argue the bonuses, incentives etc. also add markedly to volatility through the cycle.
While BIS Shrapnel considers that AWOTE is a superior measure for labour costs in the circumstances, LPI forecasts are also provided for gas pipeline related-labour and labour costs in external construction contracts.
33 For example, see AER Draft Decision, Powerlink’s Revenue Proposal 2012/13 to 2016/17 p.57.

Real Cost Escalation Forecasts to 2017, March 2012 APA Group
28 © BIS Shrapnel Pty Limited 2012
Chart 4.1: AWOTE & LPI Total Australia (All Industries) and Electricity, Gas and Water
Table 4.3: Federal Wage Agreements – Collective Agreements by Industry (Average Annualised Wage Increase)
86 88 90 92 94 96 98 00 02 04 06 08 10 12 14 16 18
1
3
5
7
9
11
0
2
4
6
8
10
Year Ended June Source: BIS Shrapnel, ABS data
AWOTE - All Industries
Forecast
AWOTE - Electricity, Gas and Water
LPI - All Industries
LPI - Electricity, Gas and Water
Annual Per Cent Change
Selected Industry (ANZSIC 2006)
Electricity, Gas, Water and Waste Services 4.2 4.3 4.2 4.4 4.5 4.7 4.8 4.8 4.4 4.5Agriculture, Forestry and Fishing 3.4 3.3 3.0 3.0 2.9 3.0 3.7 3.7 3.7 3.3
Mining 3.2 3.3 3.6 3.7 4.0 4.3 4.4 4.3 4.2 3.9Manufacturing 4.1 4.1 4.1 4.2 4.3 4.2 4.1 3.9 3.8 4.1Construction 4.1 4.3 4.4 4.9 4.9 4.6 5.3 5.4 4.8 4.7Wholesale Trade 3.8 3.9 4.0 3.7 3.6 3.8 4.1 4.0 3.7 3.8Retail trade 3.2 3.2 3.4 3.5 3.5 3.5 3.6 3.5 3.4 3.4Accommodation and Food Services 2.8 2.8 3.2 3.3 3.4 3.2 3.6 3.9 3.9 3.3Transport , Postal and Warehousing 3.6 3.6 3.7 3.7 3.9 4.0 4.2 4.2 4.0 3.9Information Media and Telecommunications 4.0 4.2 4.1 3.6 3.2 3.3 3.7 3.8 3.4 3.7Financial and Insurance Services 4.1 4.2 4.1 4.1 4.1 3.8 4.0 3.6 3.7 4.0Rental, Hiring and Real Estate Services 3.8 4.1 4.1 3.8 4.8 4.5 3.4 3.7 3.9 4.0Administrative and Support Services 3.8 4.1 4.1 3.8 4.0 4.0 4.5 4.3 4.0 4.1Professional, Scientific and Technical Services 3.8 4.1 4.1 3.8 3.6 3.6 3.8 3.7 3.6 3.8Public Administration and Safety 4.4 4.4 4.3 4.0 4.1 4.2 4.3 3.9 3.7 4.1Health Care and Social Assistance 3.9 4.0 4.1 4.0 4.0 4.0 4.1 4.0 4.0 4.0Education and Training 3.9 4.5 4.7 4.9 4.8 4.9 4.4 4.6 4.6 4.6Arts and Recreation Services 3.7 3.5 3.8 3.5 3.8 4.0 4.1 3.5 3.5 3.7Other Services 4.5 4.4 4.0 4.0 4.1 4.0 3.9 3.7 3.6 4.0
ALL INDUSTRIES 3.8 3.9 4.0 4.1 4.1 4.0 4.2 4.1 4.0 4.0
(1)Current agreements in June of each year. Source: Department of Education, Employment & Workplace Relations (DEEWR)
2011
Collective Agreements
Average 2003-2011
Average Annualised Wage Increase(1)
2003 2004 2005 2006 2007 2008 2009 2010

APA Group Real Cost Escalation Forecasts to 2017, March 2012
© BIS Shrapnel Pty Limited 2012 29
In the next part of this section, we will consider the key drivers of the sustained strong growth in underlying wages growth (i.e. the LPI measure) in the national utilities sector, and draw comparisons with the all industries average and (in section 4.6) with competitor industries competing with the utilities sector for labour with similar skills (i.e. Mining, Construction and Manufacturing sectors). The key drivers will essentially boost utilities wages growth measured in both LPI and AWOTE terms, but we will consider the quantum of the combined up skilling effects, compositional effects, bonuses, incentives, etc over the cycle separately in section 4.3.
Utilities wages growth will remain well above ‘all industries’ average
The electricity, gas and water sector is a largely capital intensive industry whose employees have higher skill, productivity and commensurately higher wage levels than most other sectors. With many of the particular skills relevant to the electricity, gas and water sector expected to remain in relatively high demand, wage increases are expected to remain higher in this industry than the national average over the next six years.
In addition, the overall national average tends to be dragged down by the lower wage and lower skilled sectors such as the Retail Trade, Wholesale Trade, Accommodation, Cafés and Restaurants, and, in some periods, also Manufacturing and Construction (see tables 4.1 and 4.2). These sectors tend to be highly cyclical, with weaker employment suffered during downturns impacting on wages growth in particular. The EGW sector is not impacted in the same way due to its obligation to provide essential services and thus retain skilled labour.
Demand for skilled labour — and therefore wages growth — to remain strong within the utilities sector, due to sustained high levels of utilities investment
Employment growth in the utilities sector over the past decade (2001/02 to 2010/11 inclusive) averaged 6.5 per cent per annum, the second fastest growth among the 18 main industry sectors behind the Mining sector (10.1 per cent per annum), with Construction employment growth third at 4.4 per cent per annum.
This strong growth in utilities employment since 2002 has been associated with a pick-up in infrastructure and maintenance work as well as an ongoing reversal in the sharp losses in employment seen through the 1990s. Privatisation and rationalisation were the drivers of the job cuts in the 1990s, but in some cases the desire to be streamlined left only a ‘skeleton’ crew in-house for routine operations and emergency disruptions, while capital and maintenance works (both minor and major) tended to be contracted out. Capital expenditure in the utilities sector during the 1990s was also relatively low, and this may also have contributed to weaker employment.
The emergence of skilled labour shortages across many industry sectors over the 2000s encouraged utilities businesses to boost their in-house response capabilities, while increasing competition has shifted the business focus towards customer service in order to enhance product differentiation with an accompanying increase in employment not directly related to the provision of electricity, gas and water services. The entrance of new players in the sector (such as new businesses related to renewable energy provision, new private electricity and gas businesses, etc.) has also exacerbated this situation as it has increased demand for all occupations within this sector.
The strong growth in employment growth in the Utilities, Mining and Construction sectors, and the associated sustained strong demand for skilled labour, contributed to above average wages growth in all three sectors. At the same time, the overall labour market tightened considerably

Real Cost Escalation Forecasts to 2017, March 2012 APA Group
30 © BIS Shrapnel Pty Limited 2012
Tab
le 4
.4:
Ele
ctri
city
, Gas
& W
ater
Su
pp
ly W
age
Fo
reca
sts
– A
ust
ralia
Yea
r E
nded
Jun
e20
0120
0220
0320
0420
0520
0620
0720
0820
0920
1020
1120
1220
1320
1420
1520
1620
1720
1820
01-1
120
12-1
8P
rop
ort
ion
of
Wo
rkfo
rce
by
Pay
se
ttin
g M
eth
od
Aw
ards
Onl
y1.
2%1.
1%1.
4%1.
7%1.
3%0.
9%0.
9%0.
9%0.
9%0.
9%0.
9%0.
9%0.
9%0.
9%0.
9%0.
9%0.
9%0.
9%1.
1%0.
9%C
olle
ctiv
e A
gree
men
ts
77.3
%78
.1%
79.0
%79
.9%
82.2
%84
.4%
82.2
%80
.0%
80.0
%80
.0%
80.0
%80
.0%
80.0
%80
.0%
80.0
%80
.0%
80.0
%80
.0%
80.3
%80
.0%
Indi
vidu
al A
rran
gem
ents
21.5
%20
.9%
19.6
%18
.4%
16.6
%14
.7%
16.9
%19
.1%
19.1
%19
.1%
19.1
%19
.1%
19.1
%19
.1%
19.1
%19
.1%
19.1
%19
.1%
18.6
%19
.1%
Tot
al10
0%10
0%10
0%10
0%10
0%10
0%10
0%10
0%10
0%10
0%10
0%10
0%10
0%10
0%10
0%10
0%10
0%10
0%10
0%10
0%
AW
OT
EA
war
ds O
nly
2.0
1.7
2.4
2.2
2.4
2.1
2.5
1.7
2.2
0.6
2.9
2.1
2.1
2.6
2.6
2.3
2.4
2.7
2.1
2.4
Col
lect
ive
Agr
eem
ents
3.
83.
94.
24.
34.
24.
64.
54.
74.
84.
94.
54.
54.
65.
04.
94.
74.
74.
94.
44.
8In
divi
dual
Arr
ange
men
ts (
a)16
.221
.0-2
.616
.5-0
.7-1
5.3
1.6
-2.4
13.7
18.0
31.9
5.3
9.4
8.5
10.1
8.5
10.0
9.2
8.9
8.7
AW
OT
E (
Pe
rso
ns)
(b)
6.4
7.4
2.8
6.5
3.4
1.6
4.0
3.3
6.5
7.4
9.7
4.6
5.5
5.6
5.9
5.4
5.7
5.7
5.4
5.5
Lab
ou
r P
rice
Ind
ex
Aw
ards
Onl
y 2.
01.
72.
42.
22.
42.
12.
51.
72.
20.
62.
92.
12.
12.
62.
62.
32.
42.
72.
12.
4C
olle
ctiv
e A
gree
men
ts
3.8
3.9
4.2
4.3
4.2
4.6
4.5
4.7
4.8
4.9
4.5
4.5
4.6
5.0
4.9
4.7
4.7
4.9
4.4
4.8
Indi
vidu
al A
rran
gem
ents
(a)
4.6
5.6
4.7
4.7
5.3
10.7
7.3
1.6
3.2
2.3
3.5
2.7
5.8
5.8
5.0
4.5
5.4
6.0
4.9
5.0
Lab
ou
r P
rice
Ind
ex
(Ord
. Tim
e)
3.9
4.2
4.3
4.3
4.4
5.5
5.0
4.1
4.5
4.4
4.3
4.1
4.8
5.1
4.9
4.6
4.8
5.1
4.4
4.8
Com
posi
tiona
l Effe
cts
+ B
onus
es,e
tc2.
53.
2-1
.42.
2-1
.0-3
.8-1
.0-0
.82.
03.
05.
40.
50.
70.
51.
00.
80.
90.
60.
90.
7
Sou
rce:
BIS
Shr
apne
l, A
BS
, DE
EW
R(a
) B
ecau
se o
f rel
ativ
ely
smal
l wor
kfor
ce (
and
ther
efor
e sm
all s
ampl
e si
ze)
in E
GW
, Ind
iv A
gree
men
ts p
icks
up
all t
he s
tand
ard
erro
rs o
f LP
I and
AW
OT
E e
stim
ates
by
AB
S(b
) F
ull-t
ime
Adu
lt P
erso
ns, e
xclu
ding
ove
rtim
e
Yea
r A
vera
ge P
erce
nt C
hang
eF
ore
cast
Av
era
ge
s

APA Group Real Cost Escalation Forecasts to 2017, March 2012
© BIS Shrapnel Pty Limited 2012 31
during the 2000s, with the unemployment rate falling from around 7 per cent in 2001 to 5 per cent by 2005, and to 4.0 per cent in early 2008. This saw skilled labour shortages worsen and employers in these sectors bid up wages (see table 4.11).
The GFC and associated slowing in the economy over 2008/09 subsequently reduced labour demand and wage pressures, but the unemployment rate only rose to a peak of 5.9 per cent in mid 2009 and has now fallen back to around 5 per cent. With the next phase of the resources investment boom now ramping up and utilities across Australia in the midst of a major investment phase itself, skilled labour shortages are already emerging. Job vacancies in the Utilities, Mining and Construction sectors have risen sharply since 2009 back toward (or above) the tight 2007/08 levels.
With the economy recovering, employment growth outpacing population and labour force growth and the unemployment rate now around 5 per cent and expected to fall below 4 per cent within two years, we expect to again witness the re-emergence of skilled labour shortages and competition for scarce labour from 2011/12, particularly from the construction and the mining sectors, which will push up wage demands in the utilities sector.
We expect wages growth in the electricity, gas and water sector to remain above the national average over the medium term, given the relatively high levels of job vacancies in the sector and the current levels of skills shortages being reported. Increased demand for labour will continue in the sector over the next six years at least.
We believe investment in the sector, particularly engineering construction, has been the key driver of employment growth in the sector over the past decade. Chart 4.2 illustrates this relationship, and shows employment has a stronger relationship with utilities engineering construction rather than utilities output. We expect employment growth to remain elevated for the utilities sector. Our forecast is for utilities investment to be higher (relative to history) over the next six years (see chart 4.2).
Chart 4.2: Australia – Utilities Employment, Output and Investment
90 92 94 96 98 00 02 04 06 08 10 12 14 16 18 50
70
150
200
300
100
Index 2000 = 100 Forecast
Utilities EngineeringConstruction
Employment
Output (GVA)
Productivity
Year Ended June Source: BIS Shrapnel, ABS data

Real Cost Escalation Forecasts to 2017, March 2012 APA Group
32 © BIS Shrapnel Pty Limited 2012
Electricity, gas and water utilities in virtually every state across Australia have embarked on major network refurbishment, extension and augmentation programs. This is due to the need to replace ageing infrastructure to maintain supply capability and to ensure reliability of the network, especially during peak periods. The latter is typically more maintenance type of work and is generally more labour intensive. Given the recent trend towards consolidating work in-house (rather than out-sourcing), we expect the need for regular maintenance work will continue to boost overall employment in the Utilities sector.
Added to this is our expectation that a number of peak, intermediate and base load power stations will be built over the next decade (with gas fuelled generation expected to dominate), along with new renewable generation facilities, while local reticulation construction will continue to be driven by new housing and industrial and commercial demand.
We expect further growth in electricity, gas and water employment over the next six to seven years, although the rate of growth is forecast to be slower than in recent years. Partly underpinning this outlook for further employment growth is the relatively higher levels of utilities-related infrastructure construction expected to occur over the next few years. Submissions to the Australian Energy Regulator (AER) and to other state based equivalents (such as the Victorian Essential Services Commission) from a number of utilities in each state have consistently reported that they expect to increase employment over the next five to six years.34
More importantly, electricity, gas and water supplies are essential services where reliability of supply is paramount. Accordingly, this requires adequate skilled labour to maintain reliability of supply, which points to the need to offer high wages to attract and retain skilled labour in this sector.
Powerful unions in utilities sector will also keep wages growth elevated
The key elements of the utilities wage forecast are set out in table 4.4. Table 4.4 shows that collective bargaining dominates the pay setting arrangements in the utilities sector, while the relative absence of workers relying on (often) low-increase awards (set in the National Wage Case) means the overall average for total utilities wages will invariably be higher than the all industries average. Table 4.3 shows that the utilities sector has consistently had higher wage increase under collective agreements than the all industries average. Over the past five years, the outcomes from collective agreements have been 0.5 per cent higher, on average, than the all industries average. We expect this trend to continue over the next six years, with the all industries average to also continue to be dragged down by the retail and hospitality industries.
The analysis in table 4.4 also shows that pay outcomes in the individual arrangements segment of the utilities sector is also usually higher than the all industries average, although – as explained in Appendix A – some incentives and compositional effects emanating from the collective agreements may be ending up in the individual arrangements segment calculated in the LPI in table 4.4.
With regard to the proportions of employees now under collective agreements, we now estimate that the proportion of employees under collective bargaining in the electricity, gas and water supply sector has fallen from 84.4 per cent in 2006 (the last survey conducted under the ANZSIC1993 industry classification) to around 80 per cent now. The August 2008 survey saw the industries classified under the new ANZSIC2006 classifications, with a further small drift to individual arrangements apparent in the most recent survey in May 2010. Under the new industry
34 See Powerlink Queensland Revenue Proposal 2013 – 2017 submitted to the AER, May 2010, p.90. Ergon Energy Regulatory Proposal 2011 – 2015 submitted to the AER, July 2009, p.49 and SP AusNet, Electricity Transmission Revised Revenue Proposal 2009 –2014 submitted to the AER, October 2007 p.138.

APA Group Real Cost Escalation Forecasts to 2017, March 2012
© BIS Shrapnel Pty Limited 2012 33
groupings, ‘Waste Services’ has been added to electricity, gas and water supply services, plus a miniscule part of the old construction sector. Our analysis of the new proportions and relevant employment numbers for these separate sectors suggests some movement from collective bargaining to individual arrangement in the ‘pure’ utilities sector ie electricity, gas and water sector (assuming no change in employees dependent on award increases).
A comparison of wage movements in the ‘old’ electricity, gas and water supply (EGW) sector compared to the ‘new’ electricity, gas and water supply and waste services (EGWWS) sector shows the addition of waste services drags down measured LPI wages growth by 0.1 per cent per annum on average in the combined EGWWS compared to EGW over 1998/99 to 2008/09, with AWOTE growth in EGWWS 0.6 per cent lower on average compared to EGW over the same 11 year period. This result is not surprising given lower skill level and lower demand for workers in the waste services sector.35 A comparison of EGW and EGWWS wages and employment growth is provided in Appendix B.
Increases in collective agreements under enterprise bargaining are influenced by a combination of recent CPI increases, inflationary expectations, the recent profitability of relevant enterprises, current business conditions and the short-term economic outlook, and by the industrial relations ‘strength’ of relevant unions. Because the average duration of agreements runs for two-to-three years, BIS Shrapnel bases its near-term forecasts of Enterprise Bargaining Agreement (EBA) wages on the strength of recent agreements, which have been ‘formalised’ or ‘lodged’ (i.e. an agreement has been ‘reached’ or ‘approved’) over recent quarters.
Data from the Department of Education, Employment and Workplace Relations quarterly report, Trends in Federal Enterprise Bargaining, shows that average outcomes of agreements accelerated increased through 2008/09, with the year average of the ‘formalised’ agreements rising to 5.0 per cent in 2008/09, compared to 4.8 per cent in 2007/08. Growth in formalised agreements slowed to an average of 4.3 per cent in calendar 2010, with the latest DEEWR report (June 2011) suggesting a pick up, albeit slight, in wages growth in the sector. We expect wages to pick up further during 2012 given the tightness in the labour market and the high enterprise agreement outcomes in the construction sector in 2010/11 which will influence negotiations in the EGW sector.
Furthermore, given the average duration of enterprise agreements in the utilities sector is close to 3 years, these high outcomes in 2008/09 will influence the overall EBA average over 2009/10 to 2011/12 (ie it will tend to push up the overall average), with the average for ‘current operating’ agreements to remain around current levels over the next two years.
With economic conditions continuing to improve, we expect some pick up in the pace of formalised agreements over the next three years toward and above 5 per cent per annum. Subsequently, wages growth in the collective agreements component will rise about 5 per cent over the 2012/13 and 2013/14 before easing over 2014/15 and 2015/16 following the slowing in economic growth.
Note that the latest collective agreements data for EGW from the DEEWR is now classified under the ANZSIC2006 category which includes Waste Services. The DEEWR has also back cast their data under the new classifications to the September quarter 2006. Although this is only a short time frame for comparison, it shows that AAWIs under the ‘old’ EGW classification were on average 0.1 per cent to 0.2 per cent higher per annum on average compared to the newly combined EGWWS sector.
35 Given the objective of this section of the report is to provide forecasts of the change in gas pipeline-related labour costs and that EGW is more representative of their skill levels and labour demand then EGWWS, we have deliberately excluded the waste services component from our forecasts and back data.

Real Cost Escalation Forecasts to 2017, March 2012 APA Group
34 © BIS Shrapnel Pty Limited 2012
Table 4.5: Average Weekly Ordinary Time Earnings and Labour Price Index Total Australia and Electricity, Gas & Water
(Year Average Growth)
$ $ Index Index
2000 785.9 955.2 64.4 59.42001 825.1 5.0 1,027.4 7.6 66.7 3.6 61.9 4.1
2002 867.1 5.1 1,063.2 3.5 68.9 3.2 64.5 4.32003 913.7 5.4 1,121.1 5.4 71.4 3.7 67.2 4.22004 948.5 3.8 1,180.2 5.3 73.9 3.6 70.3 4.52005 998.9 5.3 1,205.3 2.1 76.9 4.0 73.4 4.42006 1 032.6 3.4 1,234.5 2.4 79.9 3.9 77.9 6.1
2007 1 081.8 4.8 1,284.9 4.1 83.2 4.1 81.1 4.12008 1 133.8 4.8 1,342.8 4.5 86.7 4.2 84.3 4.12009 1 198.6 5.7 1,427.0 6.3 89.8 3.6 88.0 4.42010 1 257.0 4.9 1,566.8 9.8 92.8 3.4 92.2 4.72011 1 312.8 4.4 1,668.2 6.5 96.3 3.7 95.6 3.7
Forecasts 2012 1 372.0 4.5 1,757.5 5.4 100.0 3.9 100.0 4.62013 1 440.5 5.0 1,851.9 5.4 104.3 4.3 104.9 4.92014 1 521.7 5.6 1,961.7 5.9 109.0 4.5 110.3 5.12015 1 595.6 4.9 2,075.1 5.8 113.1 3.8 115.8 4.92016 1 667.0 4.5 2,196.4 5.8 117.5 3.9 121.2 4.72017 1 758.5 5.5 2,323.0 5.8 122.7 4.4 127.1 4.9
1990-2000 3.8 5.22000-2010 4.8 5.1 3.7 4.52006-2011 4.9 6.2 3.8 4.22011-2017 5.0 5.7 4.1 4.9
Source: BIS Shrapnel, ABS(1) Earnings per person for full-time adults. Data is year ended May (available only mid month of quarter).(2) Ordinary time hours excluding bonuses.
Year Ended
December
Average Weekly Ordinary Time Earnings (1) Labour Price Index (2)Electricity, Gas
%CH %CH %CH %CH
Compound Annual Growth Rates
Electricity, GasAll Industries and Water All Industries and Water

APA Group Real Cost Escalation Forecasts to 2017, March 2012
© BIS Shrapnel Pty Limited 2012 35
Despite the relative weakness of the economy over 2008/09 and 2009/10, wages remained elevated in the utilities sector due to the comparative strength of demand for skilled labour, and particularly because of the strength of unions in what is an essential service sector. The industrial relations reality is that there are powerful utilities unions such as the Communications, Electrical and Plumbing Union (CEPU) and Australian Services Union (ASU), which have a history of achieving high wage outcomes for the sector. Other unions active in the sector include the Australian Workers Union (AWU).
BIS Shrapnel analysis shows collective agreements in the EGW sector have been on average around 1.5 per cent higher than CPI inflation over the decade to 2010 (excluding the effects of GST introduction in 2000/01). In the five years to 2010 when the labour market was very tight, collective agreements were on average 1.7 per cent above the CPI. Given the strength of unions in the sector and a tighter labour market over the next six years than for most of the 2000s, collective agreements are forecast to remain around 1.6 per cent above the CPI in the forecast period.
Increases in individual agreements (or non-EBA wages) are primarily influenced by the strength of the labour market (especially the demand-supply balance of skilled labour), inflationary expectations, the recent profitability of relevant enterprises (which influences bonuses and incentives, etc.), current business conditions and the short-term economic outlook.
Although the recent downturn saw some easing in overall skilled labour shortages for some professions relevant to the utilities sector, the DEEWR “Skills in Demand Lists” and Clarius Index still revealed ongoing shortages of key professionals and tradespersons in the utilities sector (see section 4.4). These shortages are expected to continue over the next six years and probably longer given the large capital works and maintenance programs planned in most states’ utilities.
With economic conditions improving and skilled labour demand recovering, we expect higher wages growth in the segment to come through, as employers bid up wages for skilled labour in scarce supply. Businesses will find they must ‘meet the market’ on remuneration in order to attract and retain staff and we expect wages under individual arrangements to accelerate rapidly from 2012/13.
Two other factors which will act to push up wages growth attributable to the individual arrangements segment — that is the compositional effects — include the up skilling of the workforce and, later in the period, the ageing of the workforce. Apprentices, trainees and numbers of new staff have increased markedly over recent years, across the electricity, gas and water sector generally. Given slower growth in employment numbers over the next decade, it is likely that there will be overall up skilling of the existing workforce, which will see a commensurate movement by much of the workforce into higher grades (ie on higher pay), although the ‘base’ movement — the nominal increase in EBA’s — will not reflect this, so this upgrading will end up as compositional increases in the individual arrangements segment. A related aspect is ageing profile, which will particularly affect the ‘professionals’ on non-EBA’s, who tend to be older and more experienced.
Indeed, the strengthening of non-EBA wages from 2012/13 and the compositional effects from the overall up skilling is expected to result in much stronger growth in individual arrangements over this decade, compared to the last ten years. All the compositional effects from the up skilling of the workforce will fall into the individual arrangements wage setting residual. This is because the electricity, gas and water sector has a relatively small workforce and the individual arrangements segment picks up the standard errors of LPI and AWOTE estimates by the ABS.

Real Cost Escalation Forecasts to 2017, March 2012 APA Group
36 © BIS Shrapnel Pty Limited 2012
Tab
le 4
.6:
AW
OT
E P
erso
ns
by
Sta
te -
Ele
ctri
city
, Gas
an
d W
ater
Su
pp
ly
(Yea
r A
vera
ge
Gro
wth
)
$A
%C
h$
A%
Ch
$A
%C
h$
A%
Ch
$A
%C
h$
A%
Ch
$A
%C
h$
A%
Ch
$A
%C
h19
8542
942
543
539
441
340
846
342
042
319
8645
76.
345
57.
046
77.
242
78.
244
16.
743
25.
850
38.
643
43.
545
26.
919
8747
23.
347
95.
448
64.
144
44.
144
10.
144
73.
650
40.
343
4-0
.147
03.
819
8850
36.
750
45.
151
35.
647
36.
548
59.
948
17.
550
91.
046
87.
849
96.
319
8953
05.
355
610
.454
56.
250
05.
752
48.
049
83.
557
513
.052
111
.353
57.
219
9056
26.
061
09.
855
92.
653
97.
955
35.
653
26.
960
85.
757
19.
757
37.
019
9159
66.
064
04.
957
32.
456
75.
258
65.
955
44.
162
32.
557
30.
460
04.
819
9262
85.
467
45.
359
43.
758
43.
060
63.
559
16.
865
24.
659
13.
163
04.
919
9365
13.
771
25.
660
51.
959
92.
661
82.
062
96.
466
31.
761
23.
665
23.
519
9466
72.
572
11.
363
44.
763
45.
964
64.
668
48.
768
63.
562
52.
167
12.
919
9569
94.
872
20.
266
75.
264
61.
970
18.
570
32.
970
12.
167
78.
469
53.
519
9676
99.
978
68.
872
68.
868
56.
075
17.
171
01.
071
62.
272
26.
775
28.
319
9780
04.
083
25.
977
36.
576
812
.080
16.
675
25.
974
94.
678
99.
279
65.
819
9888
710
.989
47.
579
12.
380
04.
386
78.
383
911
.678
95.
385
58.
585
87.
719
9989
20.
692
13.
184
36.
682
73.
390
34.
188
14.
910
2229
.591
36.
888
43.
020
0097
39.
010
1710
.390
57.
489
07.
695
45.
794
87.
692
0-1
0.0
950
4.0
955
8.1
2001
1052
8.2
1087
7.0
972
7.4
932
4.7
1034
8.3
1008
6.3
978
6.3
1039
9.4
1027
7.6
2002
1098
4.3
1132
4.1
968
-0.4
981
5.2
1101
6.5
1047
3.9
1006
2.9
1046
0.7
1063
3.5
2003
1137
3.6
1150
1.5
1090
12.5
1072
9.2
1138
3.3
1122
7.2
1005
-0.1
1134
8.3
1121
5.4
2004
1213
6.6
1142
-0.6
1229
12.8
1069
-0.3
1188
4.4
1155
2.9
1025
2.0
1203
6.2
1180
5.3
2005
1203
-0.8
1210
5.9
1244
1.2
1073
0.4
1245
4.8
1222
5.8
1117
9.0
1165
-3.2
1205
2.1
2006
1258
4.6
1208
-0.2
1213
-2.5
1120
4.3
1346
8.1
1284
5.1
1234
10.5
1212
4.0
1234
2.4
2007
1320
4.9
1245
3.1
1240
2.2
1185
5.8
1435
6.6
1285
0.1
1326
7.5
1317
8.7
1285
4.1
2008
1366
3.5
1272
2.1
1304
5.2
1230
3.8
1541
7.4
1311
2.0
1361
2.6
1394
5.8
1343
4.5
2009
1291
-5.5
1414
11.2
1367
4.9
1251
1.8
1651
7.1
1427
6.3
2010
1402
8.5
1671
18.2
1458
6.7
1322
5.6
1812
9.7
1567
9.8
2011
1469
4.8
1798
7.6
1614
10.7
1452
9.8
1904
5.0
1668
6.5
For
ecas
t20
1215
435.
118
844.
817
585.
420
1316
335.
819
845.
318
525.
420
1417
245.
620
995.
819
625.
920
1518
215.
622
175.
620
755.
820
1619
255.
723
395.
521
965.
820
1720
325.
624
655.
423
235.
8
1985
-201
014.
85.
65.
05.
06.
15.
24.
85.
45.
419
90-2
000
5.6
5.2
4.9
5.1
5.6
5.9
4.2
5.2
5.2
2000
-201
023.
75.
14.
94.
06.
64.
15.
04.
95.
1
2006
-201
13,4
3.1
8.3
5.9
5.3
7.2
3.2
6.3
4.2
6.2
2011
-201
75.
65.
45.
7S
ourc
e: B
IS S
hrap
nel,
AB
S D
ata
1, 2
and
3:
Ave
rage
gro
wth
rat
es fo
r TA
S,
NT
and
AC
T ar
e 19
85-2
008,
200
0 to
200
8 an
d 20
03-2
008
resp
ectiv
ely
4: A
vera
ge g
row
th r
ates
for
QLD
, S
A,
WA
and
Aus
tral
ia a
re 2
006-
2011
Co
mp
ou
nd
An
nu
al
Ave
rag
e G
row
th R
ate
s
TA
SN
TA
CT
AU
ST
RA
LIA
Yea
r A
vgY
ear
Avg
Yea
r A
vgY
ear
Avg
Yea
r A
vgY
ear
Avg
Yea
r E
nded
N
ovem
ber
NS
WV
ICQ
LD
SA
WA
Yea
r A
vgY
ear
Avg
Yea
r A
vg

APA Group Real Cost Escalation Forecasts to 2017, March 2012
© BIS Shrapnel Pty Limited 2012 37
Chart 4.3: Total Engineering Construction Australia and Victoria
Chart 4.4: Utilities Engineering Construction Australia and Victoria
90 92 94 96 98 00 02 04 06 08 10 12 14 16 18 40
50
70
150
200
300
400
100
Index 2000 = 100 Forecast
AUS EngineeringConstruction
Year Ended June Source: BIS Shrapnel, ABS data
VIC EngineeringConstruction
90 92 94 96 98 00 02 04 06 08 10 12 14 16 18 40
50
70
150
200
300
100
Index 2000 = 100 Forecast
AUS UtilitiesEngineering Construction
Year Ended June Source: BIS Shrapnel, ABS data
VIC UtilitiesEngineeringConstruction

Real Cost Escalation Forecasts to 2017, March 2012 APA Group
38 © BIS Shrapnel Pty Limited 2012
Chart 4.5: Victoria – Utilities Employment, Output and Investment
90 92 94 96 98 00 02 04 06 08 10 12 14 16 18 40
50
70
150
200
300
100
Index 2000 = 100 Forecast
Utilities EngineeringConstruction
Employment
Output (GVA)
Productivity
Year Ended June Source: BIS Shrapnel, ABS data

APA Group Real Cost Escalation Forecasts to 2017, March 2012
© BIS Shrapnel Pty Limited 2012 39
Increased competition from Mining and Construction for similarly skilled workers to push up utilities wages
After pausing briefly in 2009/10 due to the GFC, mining-related investment increased significantly in 2010/11 and this next phase is now ramping up and will see a substantial increase over the next four years before easing over the second half of this decade, but remaining at very high levels. Mining sector investment is dominated by investment in ‘buildings and structures’, with new capital expenditure in this category (for total Australia) measuring $37.2 billion in 2010/11 compared to almost $10 billion for ‘equipment, plant and machinery.’ Mining investment in buildings and structures is, in turn, dominated by engineering construction and BIS Shrapnel’s forecasts of ‘Mining and Heavy Industry’ engineering construction for total Australia are predicting a near doubling of M&HI engineering construction by 2014/15 from 2009/10 levels (see chart 4.6). Similar increases are also predicted for associated infrastructure, including railways, harbours, other transport infrastructure, energy (electricity and gas, including pipelines) and water. And these forecasts may prove to be conservative!
This huge increase in engineering construction activity will be undertaken by both internal Mining sector labour and by outsourced contracts to the construction sector. Employment of skilled labour in these two sectors will need to increase significantly, with the increased demand for skilled labour — where there are already shortages emerging — expected to push up wages in these sectors as they compete for a limited supply of skilled workers.
The Utilities sector will need to also push up utilities wages growth in order to retain (and increase) workers, whose skills will be in strong demand from the Mining and Construction sectors. This is particularly pertinent to the gas sub-sector, with a number of large LNG production ‘trains’ to be constructed over the next 4 to 5 years in particular (already committed or under construction) and more proposed for the following 5 to 10 years. The development and construction of associated gas fields and pipelines to feed these huge LNG plants will also add markedly to demand for labour with specialist gas-related skills.
4.3 Overall Growth in Labour Costs (AWOTE Growth)
While BIS Shrapnel believes the labour price index reflects movements in the underlying price of labour, the LPI does not fully capture movements in total labour costs per employee. As we pointed out in section 4.2, average weekly ordinary time earnings (AWOTE) is a better measure of the change in overall costs per employee, because it takes into account movements of employees to higher grades, changes in compositional effects from entry/exits of higher skilled/lower skilled (ie higher paid/lower paid) workers in an enterprise or industry, and also the payments above base rates of pay, such as bonuses, incentives, penalty rates and other allowances that are a normal part of an employees earnings over the quarter or year.
With regard to the latter, many enterprises in the utilities (and other industry) sectors(s) regularly include bonuses or incentive payments which are linked to a range of objectives, such as up skilling, additional training, productivity targets, safety targets, etc. These ‘extra’ payments — or changes in the quantum of payments — are not included in changes in the LPI, but can make a material difference to an enterprise’s overall labour costs.
In table 4.4, the bottom line shows the calculation for the collective up skilling effects, compositional effects, bonuses, incentives, other allowances, etc. – which is simply growth in AWOTE minus the growth in the LPI. Given its volatility over the past decade, it makes more sense to take a longer term view of changes and use a period average to assess the overall up skilling effects, compositional effects, bonuses, incentives and other allowances. Over the past decade, these effects have added 0.9 per cent on average in total labour costs growth (AWOTE) compared to LPI growth over the period.

Real Cost Escalation Forecasts to 2017, March 2012 APA Group
40 © BIS Shrapnel Pty Limited 2012
Tab
le 4
.7:
Ele
ctri
city
, Gas
an
d W
ater
– A
ust
ralia
R
eal a
nd
Pro
du
ctiv
ity
Ad
just
ed W
ages
Gro
wth
AW
OT
E (
1)LP
I (2,
5)A
WO
TE
(1)
LPI (
2,5)
$A
% C
HIn
dex
A%
CH
$A
% C
HIn
dex
A%
CH
A%
CH
A%
CH
A%
CH
A%
CH
2000
955.
259
.41,
360.
684
.720
011,
027.
47.
661
.94.
11,
403.
93.
284
.4-0
.38.
38.
33.
93.
9
2002
1,06
3.2
3.5
64.5
4.3
1,41
0.6
0.5
85.5
1.3
7.6
7.6
4.6
4.6
2003
1,12
1.1
5.4
67.2
4.2
1,44
8.4
2.7
86.7
1.4
9.4
9.4
6.6
6.6
2004
1,18
0.2
5.3
70.3
4.5
1,49
0.7
2.9
88.6
2.2
7.9
7.9
5.5
5.5
2005
1,20
5.3
2.1
73.4
4.4
1,48
2.6
-0.5
90.1
1.7
8.1
8.1
5.5
5.5
2006
1,23
4.5
2.4
77.9
6.1
1,46
6.1
-1.1
92.5
2.6
6.2
6.2
2.6
2.6
2007
1,28
4.9
4.1
81.1
4.1
1,49
1.8
1.8
94.1
1.8
6.9
6.9
4.6
4.6
2008
1,34
2.8
4.5
84.3
4.1
1,49
4.1
0.2
93.8
-0.3
14.6
14.6
10.2
10.2
2009
1,42
7.0
6.3
88.0
4.4
1,56
0.6
4.4
96.2
2.6
10.0
10.0
8.2
8.2
2010
1,56
6.8
9.8
92.2
4.7
1,66
9.1
7.0
98.1
1.9
12.8
12.8
9.9
9.9
2011
1,66
8.2
6.5
95.6
3.7
1,72
0.6
3.1
98.3
0.3
13.5
13.5
10.1
10.1
For
ecas
ts2
012
1,75
7.5
5.4
100.
04.
61,
773.
13.
110
0.6
2.3
5.9
5.9
3.6
3.6
2013
1,85
1.9
5.4
104.
94.
91,
816.
82.
510
2.7
2.0
5.6
5.6
2.7
2.7
2014
1,96
1.7
5.9
110.
35.
11,
877.
33.
310
5.3
2.5
7.9
7.9
5.3
5.3
2015
2,07
5.1
5.8
115.
84.
91,
939.
03.
310
7.8
2.4
6.5
6.5
4.0
4.0
2016
2,19
6.4
5.8
121.
24.
72,
003.
83.
311
0.1
2.2
6.0
6.0
3.5
3.5
2017
2,32
3.0
5.8
127.
14.
92,
069.
23.
311
2.8
2.4
7.6
7.6
5.1
5.1
1990
-200
020
00-2
010
5.1
4.5
2.1
1.5
9.2
9.2
6.2
6.2
2006
-201
16.
24.
23.
31.
211
.611
.68.
68.
620
11-2
017
5.7
4.9
3.1
2.3
6.6
6.6
4.0
4.0
Sou
rce:
BIS
Shr
apne
l, A
BS
(1)
Ear
ning
s of
per
sons
. Dat
a is
yea
r en
ded
May
.(2
) O
rdin
ary
time
hour
s ex
clud
ing
bonu
ses.
(3)
Def
late
d by
RB
A/T
reas
ury
CP
I pro
ject
ions
(4)
Pro
duct
ivity
is o
utpu
t (re
al G
VA
) di
vide
d by
em
ploy
men
t in
the
Ele
ctric
ity, G
as, W
ater
and
Was
te S
ervi
ces
sect
or.
(5)
Exc
lude
s w
orkf
orce
com
posi
tiona
l pro
duct
ivity
.
LPI (
2)
Nom
inal
Rea
l (3)
Nom
inal
Adj
uste
d P
rodu
ctiv
ity (
4)R
eal A
djus
ted
Pro
duct
ivity
(3,
4)
Long
Ter
m A
vera
ges
Yea
r E
nded
D
ecem
ber
AW
OT
E (
1)LP
I (2)
AW
OT
E (
1)

APA Group Real Cost Escalation Forecasts to 2017, March 2012
© BIS Shrapnel Pty Limited 2012 41
Over the forecast period, we expect the collective up skilling effects, compositional effects, bonuses and incentives etc. to add 0.7 per cent on average to the AWOTE wage measure (compared to LPI growth) over the six years from 2012 to 2017 inclusive (see tables 4.4 and 4.5), with those effects appearing to boost wages growth numbers in the individual arrangements segment. The 0.7 per cent average is in line with the ‘all industries’ national average, where we have assumed the collective up skilling, incentives etc. to add 0.7 per cent per annum on average (see tables 3.3 and 4.5) to underlying wages inflation (i.e. the LPI).
We have included year-to-year movements for AWOTE in the electricity, gas and water sector over the six years to 2017, which are presented in table 4.4. We have made an indicative allowance in AWOTE movements for compositional changes of employment within the sector through the cycle. A detailed analysis of the future structure of occupations within the sector would be required to accurately model compositional effects each year, but detailed information on the employment plans of all the utilities in Australia would be required. Such an analysis is outside the scope of this study. However, given our forecasts of Australian employment in the utilities sector is for relatively stable employment growth over the period from 2012/13 to 2016/17, we do not expect any large positive or negative compositional effects in any one year.
For Victoria, the addition to the underlying wage inflation measure (LPI) for up skilling, incentives, etc. is assumed to be similar to the national utilities average of 0.9 per cent.
4.4 Outlook for utilities wages growth in Victoria
Stronger growth in overall employment in Victoria over the past two years (see table 2.2), combined with comparatively stronger growth in Victoria’s construction sector over the past three years, has seen the emergence of skilled labour shortages in Victoria. Indeed, across Australia, skilled labour shortages in certain professions and trades are being widely reported. The ‘Skills Shortage’ lists released in December 2011 by the Department of Education, Employment and Workplace Relations shows that all states are currently experiencing shortages of skilled labour for engineers, other professionals and tradespeople who are in high demand by the electricity, gas and water sector — and who are also keenly sought in the mining, construction and manufacturing sectors. In Victoria, the DEEWR shows shortages and recruitment difficulties are being reported for:
engineering managers
electrical engineers, electrical engineering draftspersons and technicians
civil engineers, civil engineering draftspersons and technicians
mechanical engineers
surveyors and construction estimators
fitters, welders and plumbers.
Other surveys also indicate that skills shortages are already beginning to emerge in a number of professions. The ‘Clarius Skills Index’ — a quarterly index compiled by the Clarius Group (an employment services provider) and KPMG Econtech — reported in its December quarter 2011 report that despite a soft labour market, there was an extreme shortage of engineers and construction managers over the last quarter.

Real Cost Escalation Forecasts to 2017, March 2012 APA Group
42 © BIS Shrapnel Pty Limited 2012
Tab
le 4
.8:
Ele
ctri
city
, Gas
an
d W
ater
– V
icto
ria
No
min
al, R
eal &
Pro
du
ctiv
ity
Ad
just
ed W
ages
AW
OT
E (
1)LP
I (2,
5)A
WO
TE
(1)
LPI (
2,5)
$A
% C
HIn
dex
A%
CH
$A
% C
HIn
dex
A%
CH
A%
CH
A%
CH
A%
CH
A%
CH
2000
1,01
6.5
62.8
1,44
7.9
89.4
2001
1,08
7.3
7.0
65.4
4.2
1,48
5.4
2.6
89.3
-0.2
10.3
10.3
5.9
5.9
2002
1,13
2.2
4.1
68.0
3.9
1,50
2.1
1.1
90.1
0.9
7.2
7.2
4.2
4.2
2003
1,14
9.7
1.5
70.4
3.6
1,48
3.6
-1.2
90.8
0.9
3.4
3.4
0.6
0.6
2004
1,14
2.4
-0.6
72.9
3.5
1,43
9.4
-3.0
91.9
1.2
7.7
7.7
5.3
5.3
2005
1,21
0.3
5.9
76.1
4.3
1,48
6.6
3.3
93.5
1.7
16.9
16.9
14.2
14.2
2006
1,20
7.7
-0.2
79.7
4.8
1,43
0.8
-3.8
94.6
1.2
5.4
5.4
1.9
1.9
2007
1,24
5.5
3.1
82.6
3.6
1,44
2.2
0.8
95.8
1.3
9.5
9.5
7.2
7.2
2008
1,27
1.6
2.1
86.2
4.3
1,40
9.7
-2.3
95.8
0.0
11.0
11.0
6.7
6.7
2009
1,41
4.2
11.2
89.0
3.3
1,54
2.1
9.4
97.2
1.5
12.1
12.1
10.2
10.2
2010
1,67
1.2
18.2
92.3
3.6
1,77
8.5
15.3
98.0
0.8
18.3
18.3
15.5
15.5
2011
1,79
8.1
7.6
95.9
4.0
1,85
3.3
4.2
98.6
0.6
17.5
17.5
14.1
14.1
For
ecas
ts2
012
1,88
3.9
4.8
100.
04.
21,
899.
12.
510
0.5
1.9
6.6
6.6
4.3
4.3
2013
1,98
3.7
5.3
104.
44.
41,
944.
62.
410
2.0
1.5
2.7
2.7
-0.2
-0.2
2014
2,09
9.3
5.8
109.
54.
82,
007.
43.
210
4.3
2.2
10.0
10.0
7.4
7.4
2015
2,21
6.5
5.6
114.
54.
62,
069.
33.
110
6.5
2.1
7.9
7.9
5.4
5.4
2016
2,33
9.5
5.5
119.
44.
32,
132.
33.
010
8.4
1.8
3.8
3.8
1.3
1.3
2017
2,46
4.9
5.4
124.
94.
62,
193.
32.
911
0.6
2.1
2.6
2.6
0.1
0.1
1990
-200
020
00-2
010
5.1
3.9
2.1
0.9
10.2
10.2
7.2
7.2
2006
-201
18.
33.
85.
30.
813
.713
.710
.710
.720
11-2
017
5.4
4.5
2.8
1.9
5.6
5.6
3.0
3.0
Sou
rce:
BIS
Shr
apne
l, A
BS
(1)
Ear
ning
s of
per
sons
. Dat
a is
yea
r en
ded
May
.(2
) O
rdin
ary
time
hour
s ex
clud
ing
bonu
ses.
(3)
Def
late
d by
RB
A/T
reas
ury
CP
I pro
ject
ions
(4)
Pro
duct
ivity
is o
utpu
t (re
al G
VA
) di
vide
d by
em
ploy
men
t in
the
Ele
ctric
ity, G
as, W
ater
and
Was
te S
ervi
ces
sect
or.
(5)
Exc
lude
s w
orkf
orce
com
posi
tiona
l pro
duct
ivity
.
Yea
r E
nded
D
ecem
ber
Nom
inal
Rea
l (3)
Nom
inal
Adj
uste
d P
rodu
ctiv
ity (
4)R
eal A
djus
ted
Pro
duct
ivity
(3,
4)
Long
Ter
m A
vera
ges
AW
OT
E (
1)LP
I (2)
AW
OT
E (
1)LP
I (2)
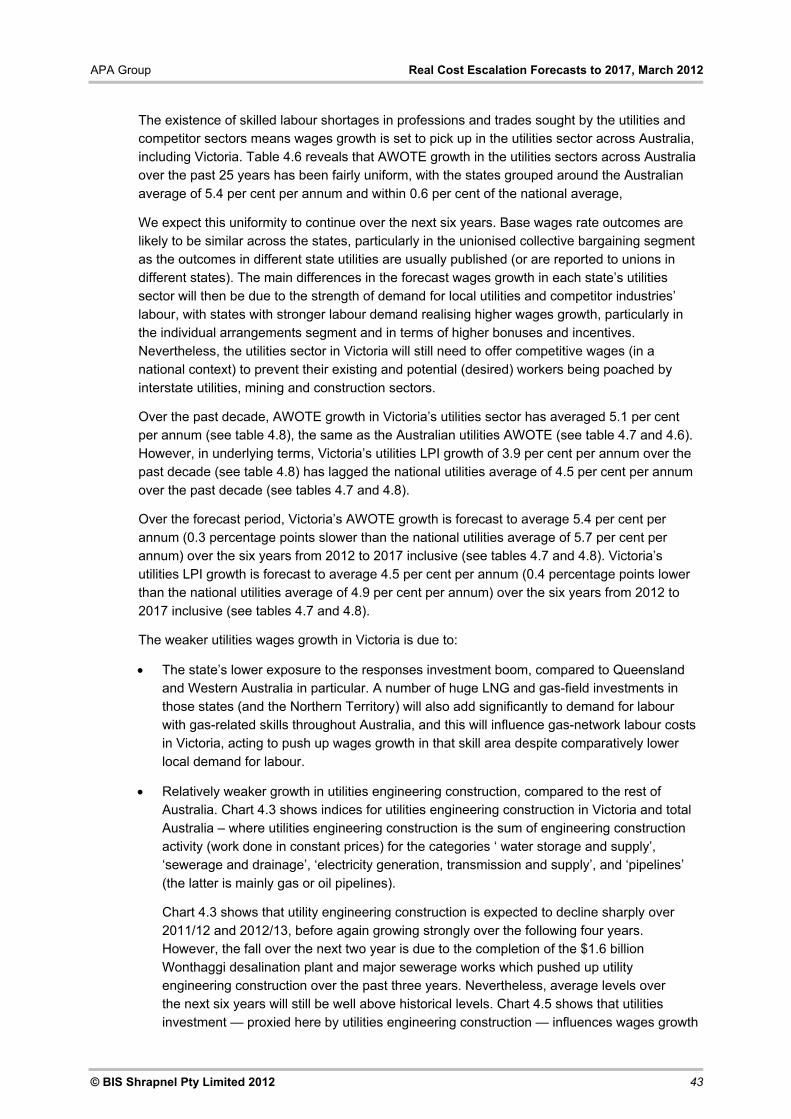
APA Group Real Cost Escalation Forecasts to 2017, March 2012
© BIS Shrapnel Pty Limited 2012 43
The existence of skilled labour shortages in professions and trades sought by the utilities and competitor sectors means wages growth is set to pick up in the utilities sector across Australia, including Victoria. Table 4.6 reveals that AWOTE growth in the utilities sectors across Australia over the past 25 years has been fairly uniform, with the states grouped around the Australian average of 5.4 per cent per annum and within 0.6 per cent of the national average,
We expect this uniformity to continue over the next six years. Base wages rate outcomes are likely to be similar across the states, particularly in the unionised collective bargaining segment as the outcomes in different state utilities are usually published (or are reported to unions in different states). The main differences in the forecast wages growth in each state’s utilities sector will then be due to the strength of demand for local utilities and competitor industries’ labour, with states with stronger labour demand realising higher wages growth, particularly in the individual arrangements segment and in terms of higher bonuses and incentives. Nevertheless, the utilities sector in Victoria will still need to offer competitive wages (in a national context) to prevent their existing and potential (desired) workers being poached by interstate utilities, mining and construction sectors.
Over the past decade, AWOTE growth in Victoria’s utilities sector has averaged 5.1 per cent per annum (see table 4.8), the same as the Australian utilities AWOTE (see table 4.7 and 4.6). However, in underlying terms, Victoria’s utilities LPI growth of 3.9 per cent per annum over the past decade (see table 4.8) has lagged the national utilities average of 4.5 per cent per annum over the past decade (see tables 4.7 and 4.8).
Over the forecast period, Victoria’s AWOTE growth is forecast to average 5.4 per cent per annum (0.3 percentage points slower than the national utilities average of 5.7 per cent per annum) over the six years from 2012 to 2017 inclusive (see tables 4.7 and 4.8). Victoria’s utilities LPI growth is forecast to average 4.5 per cent per annum (0.4 percentage points lower than the national utilities average of 4.9 per cent per annum) over the six years from 2012 to 2017 inclusive (see tables 4.7 and 4.8).
The weaker utilities wages growth in Victoria is due to:
The state’s lower exposure to the responses investment boom, compared to Queensland and Western Australia in particular. A number of huge LNG and gas-field investments in those states (and the Northern Territory) will also add significantly to demand for labour with gas-related skills throughout Australia, and this will influence gas-network labour costs in Victoria, acting to push up wages growth in that skill area despite comparatively lower local demand for labour.
Relatively weaker growth in utilities engineering construction, compared to the rest of Australia. Chart 4.3 shows indices for utilities engineering construction in Victoria and total Australia – where utilities engineering construction is the sum of engineering construction activity (work done in constant prices) for the categories ‘ water storage and supply’, ‘sewerage and drainage’, ‘electricity generation, transmission and supply’, and ‘pipelines’ (the latter is mainly gas or oil pipelines).
Chart 4.3 shows that utility engineering construction is expected to decline sharply over 2011/12 and 2012/13, before again growing strongly over the following four years. However, the fall over the next two year is due to the completion of the $1.6 billion Wonthaggi desalination plant and major sewerage works which pushed up utility engineering construction over the past three years. Nevertheless, average levels over the next six years will still be well above historical levels. Chart 4.5 shows that utilities investment — proxied here by utilities engineering construction — influences wages growth

Real Cost Escalation Forecasts to 2017, March 2012 APA Group
44 © BIS Shrapnel Pty Limited 2012
through stronger employment growth. While utilities investment is still expected to be strong over the outlook period, the lower growth compared to other states is expected to add to lower wages pressure in Victoria’s utilities sector.
The comparative weakness of Victoria’s overall construction sector over the next three years means there will be less pressure coming from the state’s construction sector, although the projected bounce back in overall construction in 2016 and 2017 will see the re-emergence of wage pressures from the construction sector at that time. Section 6 has a detailed discussion of prospects for Victoria’s construction sector and wages outlook.
Chart 4.6: Mining and Heavy Industry Engineering Construction Australia and Victoria
4.5 Productivity Adjustments
The AER in its recent revenue determinations has argued that labour price increases due to productivity growth do not increase labour costs and as a result an adjustment is required to wages to develop labour costs.36 In addition, the AER has stated that the LPI adjusted for productivity provides a more realistic expectation of labour cost changes than does AWOTE adjusted for productivity. The AER has subsequently applied — without amendment — the Utilities industry productivity forecasts (developed by its consultant Deloitte Access Economics) to its LPI forecasts to derive productivity adjusted real labour cost escalators for the utilities sector.
We disagree with the AER. BIS Shrapnel believes that the ‘unadjusted’ industry labour productivity cannot be applied to the LPI. The LPI is an underlying measure of wage inflation and does not incorporate effects of changes to skill levels and improved productivity (ie workforce compositional productivity effects), while the AWOTE measure does.
36 For example, see AER Draft Decision, Powerlink Revenue Proposal 2012/13 to 2016/17, p. 51.
90 92 94 96 98 00 02 04 06 08 10 12 14 16 18 50
70
150
200
300
400
500
700
1500
2000
100
1000
Index 2000 = 100 Forecast
AUS Mining and HIEngineering Construction
Year Ended June Source: BIS Shrapnel, ABS data
VIC Mining and HIEngineeringConstruction

APA Group Real Cost Escalation Forecasts to 2017, March 2012
© BIS Shrapnel Pty Limited 2012 45
Despite acknowledging that the LPI does not capture the workforce composition productivity effects and the need to find a ‘matching’ productivity measure (ie one that excludes the workforce composition productivity) to adjust the LPI, the AER chose not to make any adjustments for workforce composition productivity. In other words, the AER effectively assumed that workforce compositional productivity for the utilities sector is close to zero and is therefore insignificant.
We believe workforce composition productivity to be between 0.5 to 1.0 per cent on average over the medium term, based on the observed difference between the rate of growth in AWOTE and the LPI. Assuming difference between AWOTE and LPI is largely due to workforce compositional effects, then one can assume workforce compositional effects is roughly equal to this difference. Over the decade to 2011, this difference averaged 0.9 per cent per annum at the national utilities level (see table 4.4), suggesting the average workforce composition productivity was 0.9 per cent per annum for the national utilities sector.
Over the next six years, our expectation is that workforce compositional productivity will remain positive and significant. Our forecast is for workforce composition productivity (proxied by the difference between growth in AWOTE and LPI) to average 0.8 per cent per annum at the national utilities industry and 0.9 per cent per annum for the Victorian utilities sector (see table 4.7). As previously discussed in section 4.4, the upskilling and movements of workers into higher grades will drive this positive compositional effect on both wages (i.e. AWOTE less LPI) and productivity. Hence, by applying the DAE productivity forecasts, the AER is over-correcting for productivity because DAE has underestimated the workforce composition productivity component. On our forecasts of AWOTE less LPI, DAE is overcorrecting by 0.9 per cent per annum for Victorian utilities sector. This, in turn, is producing a downward biased measure of actual labour costs that gas pipeline operators in the state.
The upshot is that in deriving productivity adjusted measure of labour costs, we believe that the AWOTE is the only choice which is logical. However, the LPI can be adjusted for productivity as long as the productivity measure excludes workforce compositional and up skilling effects which we believe is positive and significant for the Utilities sector.
Notwithstanding the above, we believe that AER’s utilities sector labour productivity forecasts (proposed by DAE) are too optimistic, with the upward bias in DAE’s productivity forecasts provide a compelling case for the DAE’s productivity forecasts to be rejected by the AER.
4.5.1 Deloitte Access Economics’ productivity growth forecasts are too optimistic
Not only do we reject the application of a labour productivity adjustment to the utilities LPI (as discussed above), we also believe that the quantum of the Deloitte Access Economics (DAE) productivity growth over the forecast period is grossly exaggerated. DAE did not provide specific forecasts of output, employment or productivity in its August 2011 report for the AER, so we have calculated their productivity forecasts as the difference between the productivity-adjusted wages growth and unadjusted wages growth. We are surprised DAE does not provide their output and employment forecasts which underpin productivity forecasts and assumptions, which are key assumptions to their unit labour cost forecasts.
Deloitte Access Economics numerical forecasts of labour productivity growth, as presented to the AER in November 2011, show that future productivity growth will be strong in the utilities sector at the Australian level. This is in contrast to the observed productivity growth for the industry over the previous decade. Over the five years from 2012/13 to 2016/17 inclusive, Deloitte Access Economics expects the average productivity growth in the national utilities industry to be 1.6 per cent per annum. This compares with an average productivity growth of -3.6 per cent per cent per annum for Australia over the previous decade (see table 4.9).

Real Cost Escalation Forecasts to 2017, March 2012 APA Group
46 © BIS Shrapnel Pty Limited 2012
Even discounting for the observed volatility in the utilities labour productivity growth, we view Deloitte Access Economics’ forecasts of productivity growth as too optimistic.
According to DAE, the sanguine productivity outlook is based on easing of drought conditions on the east coast as well as an unwinding of factors which they believe weighed down the productivity performance of the utilities sector over the previous decade. Deloitte Access Economics lists the negative factors for the industry as follows:37 38
Capital investment – the downswing in employment in the sector had arguably gone too far, requiring a degree of catch up (meaning that, in effect, relative productivity in the period 1997 to 2002 may have been unsustainably high). Spending on maintenance has lifted, and so too has spending on some new infrastructure (albeit with the latter still falling short of future requirements). That increased spending has added to employment without adding to output, hence weighing on measured productivity.
A compositional switch in the sector away from water to electricity and gas has also worked to lower measured average productivity in the sector.
Within the water sector, a series of droughts in a number of States also ate into measured productivity levels.
Industry sources suggest that a reduction in outsourcing in recent years may also have raised employment without raising output.
The reform momentum of earlier years faltered.
However, DAE provides little discussion or evidence to support the claims that most of the negative factors from the last decade will actually reverse over the next six years. With reference to the first point above, DAE basically agrees with our assessment (and that of most of the utilities in their submissions to the AER over recent years) that spending on new infrastructure is still well short of future requirements, and that high levels of infrastructure spending will continue over the next few years. This suggests that these higher levels will continue to “add to employment without adding to output”…and hence continue to “weigh down on measured productivity”. It should also be noted that a significant portion of the recent and future infrastructure spending is related to network enhancement and maintenance for reliability, rather than for increasing capacity (ie future output). It should also be noted that some of the increase in employment in the sector was due to the need to perform a range of office functions such as the need to deliver services to meet the National Electricity Market Rules, codes and State Legislative obligations in relation to energy security, reliability and safety. This significant proportion of the workforce would not be directly contributing to the increase in output for the sector.
With reference to the second point above, there is no evidence or discussion provided that a compositional switch back to water will occur over the next few years, let alone act to raise measured productivity in the overall sector. The output of the water sector may increase over the medium term compared to the drought-affected 2000s (given the construction of desalination plants around Australia), but given sharp rises in water prices and slower population growth, growth in water (and sewerage-related) demand and output is unlikely to be rapid, and significantly outpace the electricity and gas sub-sectors.
37 Deloitte Access Economics, ‘Forecast Growth in Labour Costs: Queensland and South Australia, December 2010, p.48. 38 Deloitte Access Economics, ‘Forecast Growth in Labour Costs: Queensland and Tasmania, August 2011, p.52.

APA Group Real Cost Escalation Forecasts to 2017, March 2012
© BIS Shrapnel Pty Limited 2012 47
With respect to the fourth point above, no evidence or discussion has been provided to suggest there will be a reversal of the trend away from outsourcing, and therefore performing more work in-house.39 Indeed, our discussions with several utilities suggest that the major reason for the increase in employment in the sector over the past decade was to have less reliance on outsourced services, particularly maintenance and regular system enhancement capital programs. Having invested heavily in hiring and training these increased numbers of employees, the utilities are unlikely to shed labour and increase outsourcing over the next few years.
With reference to the last DAE point above, most of the easy reforms in terms of manning practices and enterprise bargained productivity enhancements occurred in the deregulation period of the 1990s – in effect, “all the low hanging fruit has been plucked”. There are few reforms left which will significantly lift productivity in the utilities sector, and so we are unlikely to see a pick up in “reform momentum” over the next few years.
Overall, there is not a compelling case to believe there will be strong growth in labour productivity in the utilities sector over the next few years.
4.5.2 Deloitte Access Economics application of long-term averages to generate productivity forecasts has previously been rejected by the AER
In their August 2011 report to the AER, Deloitte Access Economics argued that “because so many factors can influence productivity, it is often best measured over an entire economic cycle.”40 Given that no further information is provided by DAE on its underlying methodology, one can assume that DAE has applied an economic cycle methodology as opposed to an annual methodology to generate their productivity forecasts — a methodology that the AER rejected for application to AWOTE.
The AER in their Final decision on Envestra’s Access Arrangement for South Australian gas distribution network, stated that
Real cost escalation forecasts require detailed estimates of annual input cost changes. Averaging the forecasts necessarily deviates from the expected costs at any point in time, and therefore reduces the efficiency of the forecast.
For this reason, the AER considers the application of six year average rates produces forecasts that are neither made on a reasonable basis, nor the best forecasts possible in the circumstances.41
The AER should be consistent in the application of long-term averages to generate forecasts. Given the AER’s acceptance of DAE’s over-the-cycle methodology (which is tantamount to long-term average rates), we believe the AER should also allow the application of average ‘over-the-cycle’ rates to AWOTE.
We agree with use of over the cycle methodology, as highlighted in section 4.3. The utilities sector is a small sector and is therefore prone to sampling variability in labour force and wages samples by the ABS. To smooth the volatility in the utilities data, we support the consistent use of long term averages or over the cycle methodology.
39 In fact in recent years, some utilities such as ActewAGL Distribution have significantly increased their apprentice intake in response to the skills shortage to ensure that it can deliver on its proposed capital and operating expenditure. See ActewAGL Distribution’s 2009 – 2014 Determination submitted to the AER in June 2008, p.57. 40 Deloitte Access Economics, ‘Forecast growth in labour costs: Queensland and Tasmania, 15 August 2011. 41 AER, Final decision, June 2011, p. 230.

Real Cost Escalation Forecasts to 2017, March 2012 APA Group
48 © BIS Shrapnel Pty Limited 2012
4.5.3 BIS Shrapnel’s View of Productivity
BIS Shrapnel considers that labour productivity growth in the Utilities sector – as measured by output/employment - will remain weak over the next six years. Going forward, we believe demand and output growth will be constrained in this sector for three key reasons:
Higher utilities prices (including the imposition of a carbon tax from 1 July 2012) will keep demand muted.
Population growth will be slower over next five years, compared to the last five years Population and growth in households are key drivers of energy and water use in the utilities sector, so even if per capita growth remained at similar levels to the past five years, aggregate demand (ie including population) would be slower.
Moreover, with the government introducing a price of carbon, we do not expect a significant jump in energy intensive projects such as aluminium smelters. This will further contain demand for energy in the future.
We expect moderate and fairly stable growth in employment in the utilities sector in Australia and the states beyond 2011. This is based on continuing high levels of utilities capital expenditure and particularly engineering construction. The combination of muted output and moderate employment growth means productivity growth will remain weak for the utilities sector at the national as well as state level over most of this decade (see table 4.8). At the Australian level, productivity growth in the utilities sector is expected to decline by an average of -0.9 per cent per annum over the six years from 2011/12 to 2016/17 inclusive. A similar pattern occurs in Victoria, with the average growth over the six years to 2016/17 forecast at -1.7 per cent per annum (see table 4.10).
Notwithstanding the above, we don’t believe that the application of the ‘classic’ output/ employment productivity measure is the ‘correct’ productivity measure for a gas pipeline business such as APA Group, or even for many other electricity, gas or water businesses for that matter.
This classic productivity measure is more applicable to most of the ‘market’ sectors where to achieve high productivity, businesses aim to run their operations at maximum capacity where all inputs (such as labour and capital) are fully utilised and the highest production (output) of goods and services is achieved.
However, most of the ‘businesses’ in the utilities cannot run at maximum capacity all the time – ‘maximum’ (or high) utilisation is only achieved at peak times during the summer and winter peaks (ie only a few days per year) and then only for a few hours on those days. There are also large daily fluctuations in demand. Furthermore, the aim of utilities businesses is maximum reliability. Accordingly, a significant proportion of the work undertaken by the utilities’ workforces involve replacing and refurbishing old assets to maintain maximum reliability, rather than adding new capacity. This also means that the utilities sector does not conform to ‘normal market’ investment/output relationships.
We suggest that it would be wise for the AER and utilities to seek other productivity measures which are more appropriate for utilities businesses.

APA Group Real Cost Escalation Forecasts to 2017, March 2012
© BIS Shrapnel Pty Limited 2012 49
Table 4.9: Electricity, Gas, Water and Waste Services Output, Employment and Productivity: Australia
$m %CH '000 %CH ('000) %CH
1989 19723 7.2 92.6 7.31990 20678 120.4 171.71991 21009 1.6 115.1 -4.4 182.5 6.3
1992 21189 0.9 118.3 2.8 179.2 -1.91993 21560 1.8 109.9 -7.1 196.2 9.51994 22243 3.2 105.5 -4.1 210.9 7.51995 22808 2.5 99.0 -6.1 230.4 9.21996 23038 1.0 92.5 -6.5 249.0 8.1
1997 22954 -0.4 79.2 -14.4 289.6 16.31998 23817 3.8 78.2 -1.3 304.5 5.11999 24336 2.2 78.9 0.9 308.3 1.22000 24841 2.1 79.5 0.8 312.3 1.32001 25309 1.9 80.5 1.2 314.4 0.7
2002 25550 1.0 83.1 3.2 307.5 -2.22003 25871 1.3 89.6 7.8 288.9 -6.12004 25956 0.3 91.5 2.1 283.8 -1.82005 26096 0.5 95.2 4.1 274.0 -3.52006 26546 1.7 106.0 11.2 250.5 -8.6
2007 26798 0.9 105.8 -0.1 253.3 1.12008 26866 0.3 113.8 7.5 236.1 -6.82009 27894 3.8 136.3 19.8 204.7 -13.32010 28623 2.6 132.2 -3.0 216.5 5.82011 28893 0.9 151.3 14.4 191.0 -11.8
Forecasts 2012 28922 0.1 154.9 2.4 186.7 -2.22013 29529 2.1 156.4 1.0 188.8 1.12014 29943 1.4 161.3 3.1 185.7 -1.62015 30302 1.2 167.1 3.6 181.4 -2.32016 30757 1.5 168.1 0.6 183.0 0.92017 31218 1.5 172.6 2.7 180.8 -1.2
1990-2000 1.9 -4.1 6.22000-2010 1.4 5.2 -3.62006-2011 1.7 7.4 -5.32011-2017 1.3 2.2 -0.9
Source: BIS Shrapnel, ABS data
Australia
Compound Annual Growth Rates
$/employeeYear Ended
June
Gross Value Employment ProductivityAdded

Real Cost Escalation Forecasts to 2017, March 2012 APA Group
50 © BIS Shrapnel Pty Limited 2012
Table 4.10: Electricity, Gas, Water and Waste Services Output, Employment and Productivity: Victoria
$m %CH '000 %CH ('000) %CH
1989 4565 7.2 92.6 7.31990 4887 32.0 152.91991 4898 0.2 31.0 -3.1 158.1 3.4
1992 4903 0.1 28.3 -8.6 173.2 9.51993 4856 -1.0 24.1 -14.9 201.5 16.41994 5008 3.1 25.6 6.2 195.8 -2.91995 5179 3.4 22.9 -10.5 226.3 15.61996 5446 5.2 21.1 -7.7 257.9 14.0
1997 5317 -2.4 16.6 -21.3 320.0 24.11998 5802 9.1 17.4 4.5 334.1 4.41999 5705 -1.7 20.0 15.4 284.6 -14.82000 5831 2.2 18.7 -7.0 312.6 9.92001 5777 -0.9 18.7 0.1 309.5 -1.0
2002 5819 0.7 19.9 6.8 291.8 -5.72003 5900 1.4 20.3 1.9 290.3 -0.52004 5757 -2.4 20.5 0.7 281.2 -3.12005 5788 0.5 23.8 16.2 243.3 -13.52006 5632 -2.7 25.3 6.2 222.8 -8.4
2007 5660 0.5 26.1 3.5 216.5 -2.92008 5559 -1.8 28.5 9.0 195.0 -9.92009 5762 3.7 32.1 12.6 179.5 -7.92010 5821 1.0 30.5 -4.9 190.8 6.32011 5985 2.8 33.6 10.0 178.4 -6.5
Forecasts 2012 6007 0.4 38.8 15.7 154.7 -13.32013 6148 2.3 36.2 -6.7 169.7 9.72014 6232 1.4 38.4 6.1 162.1 -4.52015 6268 0.6 40.2 4.6 155.9 -3.82016 6319 0.8 40.9 1.6 154.7 -0.82017 6409 1.4 39.7 -2.8 161.4 4.3
1990-2000 1.8 -5.2 7.42000-2010 0.0 5.0 -4.82006-2011 1.2 5.8 -4.42011-2017 1.1 2.8 -1.7
Source: BIS Shrapnel, ABS data
Victoria
Year Ended June
Gross Value Employment ProductivityAdded
Compound Annual Growth Rates
$/employee

APA Group Real Cost Escalation Forecasts to 2017, March 2012
© BIS Shrapnel Pty Limited 2012 51
4.6 Competitor Industry Wages Growth
This section analyses and forecasts underlying wages (LPI) growth in the industries that compete with the utilities sector for similarly skilled labour.
4.6.1 Construction Wages
The forecasts and rationale for Australian and Victorian construction sector wages growth is set out in section 6. The forecasts are also shown in tables 6.1 and 6.2.
4.6.2 Mining Wages
The mining investment boom over the second half of the 2000s resulted in rapid employment growth in the mining sector, strong demand for labour — particularly skilled labour — and an escalation in wages growth. Rapidly rising commodity prices and high profits also fuelled the escalation in mining wages. Over the 2005/06 to 2010/11 period, mining sector wages growth in AWOTE terms averaged 7.1 per cent per annum and 5.1 per cent per annum in LPI terms, at the Australian level.
Wages growth in the mining sector in LPI terms slowed sharply in 2009/10 in a lagged response to the downturn in resource exports and output in 2008/09 and delays to the commencement of new investment projects, caused by the global financial crisis. Meanwhile, mining AWOTE growth in 2009/10 remained high (7.2 per cent) due to compositional effects — the cut backs in mining employment impacted disproportionately on lower paid workers, boosting the overall average wage. Employment growth has since bounced back and mining LPI growth picked-up to 4.3 per cent in 2010/11. AWOTE growth, meanwhile, eased to 6.5 per cent. Beyond 2010/11, both AWOTE and LPI growth is forecast to grow solidly over 2011/12 to 2013/14 before easing — but still exhibiting relatively high growth (compared to ‘all industries’ Australian average) in the second half of this decade.
Driving the high wages growth this decade will be strong demand for labour, and particularly skilled labour, as a result of the mining investment boom projected to occur over the forecast period. Projections for continued strong economic growth in China and India — with their long term programs of industrialisation and urbanisation, which are metals and energy intensive — plus ongoing growth throughout other parts of Asia and, by mid-decade, a sustained recovery in the US and European economies, will all combine to underpin healthy demand for minerals and energy. Commodity prices have already rebounded from the slump of 2008/09, and further price rises are forecast over the next few years. Prices over the next seven years are expected to be well above historical averages, both in real and nominal terms.
The strong outlook has locked-in another round of mining related projects over the next five years. The capital intensive nature of mining means not only that labour costs are usually a low proportion of total costs, but that the mining sector has a requirement for more highly skilled labour. Relatively high prices also mean that the mining sector can afford to offer higher wages.
Overall, mining sector wages in LPI terms are forecast to average 5.5 per cent per annum over the seven years from 2011/12 to 2017/18 at the Australian level (see table 4.11), higher than the electricity, gas and water sector, adding to pressure for higher wages in the utilities sector across Australia.
4.6.3 Manufacturing Wages
Growth in manufacturing has lagged the growth in all industries wages over the last decade, both in AWOTE and LPI terms, at the Australian level. Employment and output growth have been weak overall, with the manufacturing sector one of the sectors hardest hit by the global financial crisis.

Real Cost Escalation Forecasts to 2017, March 2012 APA Group
52 © BIS Shrapnel Pty Limited 2012
Table 4.11: Wages Growth in Competitor Industries – Australia All Industries, EGW, Mining, Manufacturing and Construction
(Year Average Growth)
Future prospects for the manufacturing sector will be shaped by three factors: the outlook for export markets which in turn is directly correlated with the prospects for the global economy; the strength of domestic demand for goods, in particular the performance of the construction sector; and the level of the A$.
The key drivers of growth are expected to be the resumption of the upswing in domestic dwelling construction, supplying inputs to the booming mining sector, a higher plane of privately funded engineering construction and the continued recovery in business investment at home and overseas. In turn, this will boost demand for construction materials, housing fit-out goods, machinery and equipment as well as releasing a considerable amount of pent-up demand for consumer and capital goods. However, higher interest rates over 2013/14 are expected to affect dwelling building and consumer demand, and cause manufacturing output growth to slow in 2013/14 and 2014/15, before picking up from 2015/16. The major negative for Manufacturing will be the very high A$ (averaging close to US$1 over the next five years) which will impact heavily on competitiveness and lead to a further ‘hollowing out’ of industry.
Overall, only modest growth in output is expected over the next two years, before growth eases over 2013/14 and 2014/15 due to the expected rise in interest rates in 2013/14. Growth in output and employment is subsequently expected to strengthen over 2015/16 to 2017/18, boosted by a rebound in dwelling and non-dwelling building activity and (initially) a lower dollar.
Overall, manufacturing sector wages growth in LPI terms is forecast to average 4.0 per cent per annum over the seven years from 2011/12 to 2017/18 inclusive at the Australian level (see table 4.11). The slower wage growth compared to the All Industries average is in line with historical trends over the past decade. Note that wages growth in the overall manufacturing
$ $ Index Index Index2000 64.6 59.7 61.1 60.4 65.72001 66.8 3.5 62.0 3.9 63.6 4.1 62.3 3.1 67.8 3.2
2002 69.1 3.3 64.6 4.2 65.7 3.3 64.5 3.5 70.0 3.32003 71.5 3.5 67.4 4.3 67.9 3.3 66.8 3.6 72.6 3.72004 74.1 3.6 70.3 4.3 70.4 3.7 68.7 2.9 75.0 3.22005 76.8 3.7 73.4 4.4 74.1 5.2 71.5 4.1 77.8 3.82006 80.0 4.1 77.4 5.5 77.7 4.9 75.1 5.0 80.9 4.0
2007 83.1 3.9 81.2 5.0 81.5 4.9 79.6 6.0 83.9 3.72008 86.6 4.1 84.5 4.1 85.3 4.7 84.2 5.8 87.6 4.52009 90.1 4.1 88.3 4.5 89.3 4.7 89.0 5.7 90.7 3.52010 92.9 3.1 92.2 4.4 92.2 3.3 92.2 3.6 92.9 2.32011 96.4 3.8 96.1 4.3 95.9 4.0 96.2 4.3 96.3 3.7
Forecasts 2012 100.0 3.7 100.0 4.1 100.0 4.3 100.0 4.0 100.0 3.82013 104.1 4.1 104.8 4.8 105.1 5.1 105.5 5.5 103.9 3.92014 108.7 4.4 110.1 5.1 111.0 5.6 112.2 6.3 108.3 4.22015 113.3 4.3 115.6 4.9 116.4 4.9 118.6 5.7 112.3 3.72016 117.5 3.7 120.9 4.6 121.5 4.3 124.8 5.2 116.4 3.72017 122.4 4.2 126.8 4.8 127.4 4.9 131.6 5.5 121.3 4.22018 128.0 4.6 133.2 5.1 134.3 5.4 139.5 6.0 126.9 4.6
2000-2010 3.7 4.4 4.2 4.3 3.52006-2011 3.8 4.4 4.3 5.1 3.52011-2018 4.1 4.8 4.9 5.5 4.0
(1) Ordinary time hours excluding bonuses. Source: BIS Shrapnel, ABS (Catalogue 6345)
Long Term Averages
All Industries and Water Construction Mining Manufacturing%CH %CH %CH %CH %CH
Year Ended June
Labour Price Index (1)Electricity, Gas

APA Group Real Cost Escalation Forecasts to 2017, March 2012
© BIS Shrapnel Pty Limited 2012 53
sector does not weaken significantly, despite further declines in manufacturing employment over the next few years, because most of the employment losses are expected to be in the lower wage segments of manufacturing such as Textiles, Leather, Clothing and Footwear Manufacturing; Furniture and Other Manufacturing; Wood Products Manufacturing; and Printing. Average wages per employee in the first two subdivisions are around two-thirds of the overall manufacturing average, while average wages in the latter two subdivisions are 85 per cent and 83 per cent of the overall manufacturing average respectively.42
42 Data sourced from ABS catalogue number 8155.0.


APA Group Real Cost Escalation Forecasts to 2017, March 2012
© BIS Shrapnel Pty Limited 2012 55
5. GENERAL LABOUR COST ESCALATION
APA Group’s internal ‘general labour’ includes mainly clerical/administration, professionals and managerial staff, who provide administration and corporate support services.
The escalator BIS Shrapnel used for ‘General Labour’ are wage movements in Victoria for the following two industry sectors:
Administration and Support Services (ASS) which includes units mainly engaged in performing routine support activities for day-to-day operations of other businesses and organisations; and
Professional, Scientific and Technical Services (PSTS) which, as the name suggests, includes units mainly engaged in providing professional, scientific and technical services including engineering, legal, accountancy, management and other consultancy services.
These two sectors combined cover the majority of the ‘general labour’ for the APA Group ie both internal and services contracted out (such as legal services, auditing, consulting, engineering design consultancies, etc.). As such, the wage movements in the above two sectors would be a better escalator for the APA Group than the ‘all industries’ AWOTE or LPI for the whole state. The all industries state (or Australian) average includes lower skilled occupations such as retail, hospitality etc. services, which have nothing to do with ‘general labour’ functions.
Based on our discussions with APA Group staff, we understand 90 per cent of the Group’s ‘general labour’ belong to the PSTS sector with the remaining 10 per cent providing mainly administrative and support services. We applied these proportions to the Victoria PSTS and the ASS sectors to derive a weighted average escalator for ‘general labour’ for the APA Group.
At the Australian level, PSTS wages are forecast to average 5.7 per cent per annum (in nominal AWOTE terms) over the six years from 2012 to 2017 inclusive, remaining above the national All Industries average of 5.0 per cent per annum over the same six year period (see table 5.1). ASS AWOTE growth is forecast to average 4.9 per cent per annum over the same six year period at the national level.
The PSTS sector experienced a sustained period of high demand for their services and labour between 2001 and 2008, boosted initially by residential property and construction and then from strong business investment and jobs growth. This fuelled above average growth in wages. However the credit crisis and GFC hit employment growth in late 2008 and 2009 and, in a lagged response, hit wages growth in 2010 and 2011.

Real Cost Escalation Forecasts to 2017, March 2012 APA Group
56 © BIS Shrapnel Pty Limited 2012
Table 5.1: PSTS, ASS and Total All Industries Wages Growth - Australia
Wages growth in the PSTS and ASS sectors picked up (in LPI terms) over 2010 and early 2011 following the ending of wage freezes in early 2010. With strong demand for labour in 2009/10 continuing into 2010/11 and 2011/12, wages growth is expected to strengthen further in 2012 (in both LPI and AWOTE terms).
Given 65 per cent of employees are on individual arrangements, domestic activity, the demand for labour, profits and any potential labour shortages in the sector will be key drivers of overall wages. Another key factor driving the demand for labour and wages growth in the PSTS sector is the strength of business and residential investment in the overall economy. With labour shortages expected to be apparent by late 2012 — when the national unemployment rate falls below 4.5 per cent — plus the prospect of healthier profits, wages growth is forecast to accelerate toward and above 6 per cent per annum (in AWOTE terms) over both 2013 and 2014, before easing (see table 5.1). We expect wage pressures to re-emerge in the second half of this decade as the economy rebounds from a mild downturn in 2015. Meanwhile, wages growth in the ASS sector will tend to track the cycle in PSTS wages growth, but wages growth in the ASS sector will still lag national wages growth (in AWOTE terms) for most of the period.
5.1 Victoria Wage forecasts for General Labour
The weighted average Victoria forecasts for PSTS and ASS wages are set out in table 5.2. The year-to-year forecasts tend to follow the investment cycle and relative strength of the state’s Gross State Product (GSP), State Final Demand (SFD) and overall employment this decade.
The weighted ‘general labour’ escalator (in AWOTE terms) for Victoria, on average, is expected to be weaker than the national (PSTS) average over the next six years. We believe the Australian PSTS wages is expected to be boosted by robust growth in PSTS wages in strong mining states such as Queensland and Western Australia.
$ $ $ Index Index Index
2000 785.9 726.6 908.5 64.4 66.3 61.92001 825.1 5.0 794.6 9.4 984.7 8.4 66.7 3.6 68.7 3.6 65.0 5.0
2002 867.1 5.1 836.0 5.2 1049.1 6.5 68.9 3.2 70.9 3.2 66.9 2.92003 913.7 5.4 845.2 1.1 1074.6 2.4 71.4 3.7 73.9 4.2 68.9 3.02004 948.5 3.8 865.7 2.4 1086.3 1.1 73.9 3.6 76.4 3.5 71.1 3.22005 998.9 5.3 928.6 7.3 1157.0 6.5 76.9 4.0 78.6 2.8 74.0 4.02006 1 032.6 3.4 956.1 3.0 1210.3 4.6 79.9 3.9 80.9 2.9 77.4 4.5
2007 1 081.8 4.8 1001.9 4.8 1270.6 5.0 83.2 4.1 84.1 4.0 80.6 4.22008 1 133.8 4.8 1072.9 7.1 1358.7 6.9 86.7 4.2 88.2 4.9 84.7 5.02009 1 198.6 5.7 1149.7 7.2 1428.7 5.2 89.8 3.6 90.7 2.8 88.2 4.22010 1 257.0 4.9 1204.8 4.8 1519.4 6.3 92.8 3.4 93.4 3.0 91.4 3.62011 1 312.8 4.4 1168.3 -3.0 1562.9 2.9 96.3 3.7 96.6 3.4 95.4 4.4
Forecasts 2012 1 372.0 4.5 1201.4 2.8 1,637.2 4.7 100.0 3.9 100.0 3.5 100.0 4.82013 1 440.5 5.0 1264.0 5.2 1,742.7 6.4 104.3 4.3 104.4 4.4 105.4 5.42014 1 521.7 5.6 1328.0 5.1 1,851.4 6.2 109.0 4.5 108.5 4.0 110.9 5.22015 1,595.6 4.9 1,384.5 4.3 1,948.9 5.3 113.1 3.8 112.6 3.8 116.5 5.02016 1,667.0 4.5 1,445.7 4.4 2,052.8 5.3 117.5 3.9 116.6 3.6 122.1 4.82017 1,758.5 5.5 1,521.9 5.3 2,174.9 6.0 122.7 4.4 121.6 4.3 128.5 5.3
2000-2010 4.8 5.2 5.3 3.7 3.5 4.02006-2011 4.9 4.1 5.2 3.8 3.6 4.32011-2017 5.0 4.5 5.7 4.1 3.9 5.1
(1) Earnings of persons. Data is year ended May. Source: BIS Shrapnel, ABS(2) Ordinary time hours excluding bonuses.
Professional, Scientific, Technical Services
Professional, Scientific, Technical ServicesAll Industries
Compound Annual Growth Rates
Average Weekly Ordinary Time Earnings (1) Labour Price Index (2)
%CH %CH
Admin and SupportServices
%CH
Admin and SupportServices
%CH
Year Ended December
All Industries%CH %CH

APA Group Real Cost Escalation Forecasts to 2017, March 2012
© BIS Shrapnel Pty Limited 2012 57
Table 5.2: PSTS and ASS (Weighted) Wages Growth – Victoria
5.2 Productivity-Adjusted Wage Forecasts for General Labour
Productivity adjusted wage forecasts for ‘general labour’ in Victoria were derived by subtracting the productivity growth forecast for the state’s utilities sector from the state’s ‘general labour’ wages growth over the forecast period. Note that we applied the productivity growth for the utilities sector as opposed to that observed for PSTS or the ASS sector. The general labour under investigation is employed in the utilities sector hence contribute to the overall improvement in productivity for that sector. As a result, we believe the productivity measure for the utilities sector is the most appropriate if one were to adjust ‘general labour’ wages for productivity improvements.
At the Australian and Victoria level, the combination of muted output and moderate employment growth means productivity growth will remain weak for the utilities sector over the six years to 2017. Productivity growth in the utilities sector, at the Australian level, is forecast to decline by an average of 0.9 per cent per annum over the six years from 2012 to 2017 inclusive.
Productivity growth in the Victorian utilities sector is expected to be slightly weaker than the national utilities average over the next six years, mainly because of stronger employment growth in that state.
The upshot is that once nominal AWOTE is adjusted for CPI inflation and (utilities) productivity movements, real productivity adjusted AWOTE for ‘general labour’ is forecast to average 3.0 per cent per annum for Victoria over the six years from 2012 to 2017 inclusive. The productivity adjusted wage forecasts for PSTS and ASS at the Victoria level are presented in tables 5.2 to 5.4.
AWOTE (1) LPI (2,5) AWOTE (1) LPI (2,5)
$ A% CH Index A% CH $ A% CH Index A% CH A% CH A% CH A% CH A% CH
2000 .. .. .. .. .. .. .. .. .. .. .. ..2001 .. .. .. .. .. .. .. .. .. .. .. ..
2002 .. .. .. .. .. .. .. .. .. .. .. ..2003 .. .. .. .. .. .. .. .. .. .. .. ..2004 .. .. .. .. .. .. .. .. .. .. .. ..2005 .. .. .. .. .. .. .. .. .. .. .. ..2006 .. .. .. .. .. .. .. .. .. .. .. ..
2007 .. .. .. .. .. .. .. .. .. .. .. ..2008 .. .. .. .. .. .. .. .. .. .. .. ..2009 .. 92.4 .. .. .. 100.7 .. .. .. .. ..2010 1432.6 .. 95.3 3.1 1,518 .. 101.0 0.3 .. .. .. ..2011 1421.5 -0.8 100.0 4.9 1,455 -4.2 102.6 1.6 9.1 9.1 5.7 5.7
Forecasts 2012 1485.1 4.5 104.4 4.4 1,487 2.2 104.7 2.1 6.3 6.3 4.0 4.02013 1575.4 6.1 109.6 5.0 1,534 3.2 106.9 2.1 3.5 3.5 0.6 0.62014 1666.2 5.8 114.9 4.8 1,582 3.2 109.3 2.2 9.9 9.9 7.3 7.32015 1749.6 5.0 120.5 4.9 1,622 2.5 111.9 2.4 7.3 7.3 4.8 4.82016 1841.8 5.3 126.3 4.8 1,667 2.8 114.5 2.3 3.5 3.5 1.0 1.02017 1949.0 5.8 132.9 5.2 1,722 3.3 117.6 2.7 3.1 3.1 0.6 0.6
2000-20102006-20112011-2017 5.4 4.9 2.9 2.3 5.6 5.6 3.0 3.0
Source: BIS Shrapnel, ABS(1) Earnings of persons. Data is year ended May.(2) Ordinary time hours excluding bonuses.(3) Deflated by RBA/Treasury CPI projections(4) Productivity is output (real GVA) divided by employment in the Electricity, Gas, Water and Waste Services sector.(5) Excludes workforce compositional productivity.
Nominal Real (3) Nominal Adjusted Productivity (4) Real Adjusted Productivity (3,4)
Long Term Averages
Year Ended December
AWOTE (1) LPI (2) AWOTE (1) LPI (2)

Real Cost Escalation Forecasts to 2017, March 2012 APA Group
58 © BIS Shrapnel Pty Limited 2012
Table 5.3: PSTS, Nominal, Real & Productivity Adjusted Wages – Victoria
Table 5.4: ASS, Nominal, Real & Productivity Adjusted Wages – Victoria
AWOTE(1) LPI(2,5) AWOTE(1) LPI(2,5)
$ A% CH Index A% CH $ A% CH Index A% CH A% CH A% CH A% CH A% CH
2000 .. .. .. .. .. .. .. .. .. .. .. ..2001 .. .. .. .. .. .. .. .. .. .. .. ..
2002 .. .. .. .. .. .. .. .. .. .. .. ..2003 .. .. .. .. .. .. .. .. .. .. .. ..2004 .. .. .. .. .. .. .. .. .. .. .. ..2005 .. .. .. .. .. .. .. .. .. .. .. ..2006 .. .. .. .. .. .. .. .. .. .. .. ..
2007 .. .. .. .. .. .. .. .. .. .. .. ..2008 .. .. .. .. .. .. .. .. .. .. .. ..2009 .. .. 88.2 .. .. .. 96.1 .. .. .. .. ..2010 1460.8 .. 91.0 3.2 1,548 .. 96.4 0.3 .. .. .. ..2011 1465.5 0.3 95.6 5.1 1,501 -3.1 98.0 1.7 10.2 10.2 6.8 6.8
Forecasts 2012 1532.2 4.5 100.0 4.6 1,534 2.2 100.3 2.3 6.3 6.3 4.0 4.02013 1626.4 6.1 105.1 5.1 1,584 3.2 102.5 2.2 3.5 3.5 0.6 0.62014 1721.3 5.8 110.2 4.9 1,635 3.2 104.9 2.3 10.0 10.0 7.7 7.72015 1808.5 5.1 115.8 5.0 1,677 2.6 107.5 2.5 7.4 7.4 6.4 6.42016 1904.9 5.3 121.5 4.9 1,725 2.8 110.1 2.4 3.5 3.5 1.0 1.02017 2016.4 5.9 127.9 5.3 1,783 3.4 113.2 2.8 3.1 3.1 0.6 0.6
2000-20102006-20112011-2017 5.5 5.0 2.9 2.4 5.7 5.7 3.4 3.4
Source: BIS Shrapnel, ABS(1) Earnings of persons. Data is year ended May.(2) Ordinary time hours excluding bonuses.(3) Deflated by RBA/Treasury CPI projections(4) Productivity is output (real GVA) divided by employment in the Electricity, Gas, Water and Waste Services sector.(5) Excludes workforce compositional productivity.
Nominal Real Nominal Adjusted Productivity(4) Real Adjusted Productivity(3,4)
Year Ended December
AWOTE(1) LPI(2) AWOTE(1) LPI(2)
Long Term Averages
AWOTE(1) LPI(2,5) AWOTE(1) LPI(2,5)
$ A% CH Index A% CH $ A% CH Index A% CH A% CH A% CH A% CH A% CH
2000 .. .. .. .. .. .. .. .. .. .. .. ..2001 .. .. .. .. .. .. .. .. .. .. .. ..
2002 .. .. .. .. .. .. .. .. .. .. .. ..2003 .. .. .. .. .. .. .. .. .. .. .. ..2004 .. .. .. .. .. .. .. .. .. .. .. ..2005 .. .. .. .. .. .. .. .. .. .. .. ..2006 .. .. .. .. .. .. .. .. .. .. .. ..
2007 .. .. .. .. .. .. .. .. .. .. .. ..2008 .. .. .. .. .. .. .. .. .. .. .. ..2009 .. .. 93.9 .. .. .. 102.3 .. .. .. .. ..2010 1178.7 .. 96.6 2.9 1,249 .. 102.3 0.0 .. .. .. ..2011 1025.5 -13.0 100.0 3.6 1,044 -16.4 102.5 0.2 -3.1 -3.1 -6.5 -6.5
Forecasts 2012 1061.7 3.5 102.9 2.9 1,057 1.2 103.1 0.6 5.3 5.3 3.0 3.02013 1116.0 5.1 107.2 4.2 1,081 2.2 104.4 1.3 2.5 2.5 -0.4 -0.42014 1170.2 4.9 111.2 3.8 1,105 2.3 105.6 1.2 9.0 9.0 6.4 6.42015 1218.9 4.2 115.3 3.7 1,123 1.7 106.8 1.2 6.5 6.5 4.0 4.02016 1273.9 4.5 119.5 3.7 1,146 2.0 108.1 1.2 2.7 2.7 0.2 0.22017 1342.4 5.4 124.8 4.4 1,179 2.9 110.2 1.9 2.6 2.6 0.1 0.1
2000-20102006-20112011-2017 4.6 3.8 2.0 1.2 4.8 4.8 2.2 2.2
Source: BIS Shrapnel, ABS(1) Earnings of persons. Data is year ended May.(2) Ordinary time hours excluding bonuses.(3) Deflated by RBA/Treasury CPI projections(4) Productivity is output (real GVA) divided by employment in the Electricity, Gas, Water and Waste Services sector.(5) Excludes workforce compositional productivity.
Nominal Real(3)
Year Ended December
Nominal Adjusted Productivity(4) Real Adjusted Productivity(3,4)
Long Term Averages
AWOTE(1) LPI(2) AWOTE(1) LPI(2)

APA Group Real Cost Escalation Forecasts to 2017, March 2012
© BIS Shrapnel Pty Limited 2012 59
6. CONTRACTOR ESCALATION
This section provides forecasts of APA Group’s ‘construction-related’ labour escalation, which is predominantly related to the labour costs in APA Group’s external construction contracts.
As contractor labour is assumed to undertake construction or maintenance related projects, they would be classified to the construction sector. Accordingly, the escalator used for contractor labour is Construction sector wages growth both in LPI and AWOTE terms.
Our research has shown that construction activity (i.e. work done in the sector) normally has a strong influence on construction wages. BIS Shrapnel’s forecasts of construction activity by state (which includes residential and non-residential building, plus engineering construction) were used to derive the wage forecasts.
6.1 Construction Sector Wages Growth in Victoria
Much like the other states and territories, wages growth in the Victorian construction sector tracks growth in total construction activity, although changes in wages tend to lag construction (in work done terms) by around one to two years.
Construction activity was extremely strong for most of the previous decade.43 In fact over the past three years, the overall strength of Victoria’s construction sector underpinned the strength of the state economy.44 New dwelling building activity picked up quickly between 2008/09 and 2010/11 after interest rates tumbled and the first home owner grants (FHOG) scheme boosted demand. In addition, stronger population growth and the ready availability of reasonably priced residential land facilitated a much faster upswing compared to other states, which incidentally has a greater undersupply of dwellings.45
In addition, public construction ramped up significantly over 2008/09 to 2010/11, partly because the Victorian government was able to get the Federal stimulus spending underway quickly and partly because the state government was already proceeding with its own major health, rail, harbour and sewerage projects. Private sector engineering construction also made a healthy contribution, thanks to substantial electricity, pipelines, oil and gas activity, and work on the $1.6 billion Wonthaggi desalination plant.46
The strength of the construction sector fuelled strong growth in Victorian construction wages in the second half of the last decade (see table 6.2). However, in 2010, construction sector wages eased in line with a relatively weaker (and peak) in construction activity over 2010/11.
Looking ahead, we believe engineering construction will decline over 2011/12 and 2012/13, as work is progressively completed on the desalination plant, major sewerage infrastructure and the current round of pipelines, oil and gas investments.47 Non-residential building will continue to decline, with the end of stimulus spending causing steep declines in schools construction and, later, health and other social and institutional buildings and more than offsetting a recovery in commercial and industrial building.48 Dwelling building is also forecast to decline over 2012/13
43 ABS, National Accounts 5206.0, December Quarter 2011. 44 ABS, National Accounts 5206.0, December Quarter 2011. 45 BIS Shrapnel, Residential Property Prospects, 2011-2014. 46 BIS Shrapnel, Engineering Construction in Australia, 2010/11-2024/25 Report. 47 BIS Shrapnel, Engineering Construction in Australia, 2011/12-2025/26 Report. 48 BIS Shrapnel, Building in Australia 2011-2026 Report.

Real Cost Escalation Forecasts to 2017, March 2012 APA Group
60 © BIS Shrapnel Pty Limited 2012
Chart 6.1: Total Construction – Victoria Value of Work Done, Constant 2008/09 Prices
Table 6.1: Construction Wages Growth – Australia Nominal, Real & Productivity Adjusted Wages
AWOTE (1) LPI (2,5) AWOTE (1) LPI (2,5)
$ A% CH Index A% CH $ A% CH Index A% CH A% CH A% CH A% CH A% CH
2000 735.3 60.9 1,047.4 86.72001 741.9 0.9 63.1 3.7 1,010.9 -3.5 86.1 -0.7 2.8 2.8 -1.6 -1.6
2002 790.3 6.5 65.2 3.3 1,046.4 3.5 86.4 0.3 -3.8 -3.8 -6.8 -6.82003 859.6 8.8 67.3 3.3 1,109.3 6.0 86.8 0.5 3.1 3.1 0.3 0.32004 894.7 4.1 70.5 4.7 1,128.5 1.7 88.8 2.3 6.0 6.0 3.6 3.62005 941.2 5.2 73.8 4.7 1,157.1 2.5 90.6 2.1 5.3 5.3 2.6 2.62006 957.2 1.7 77.8 5.5 1,135.9 -1.8 92.4 1.9 1.3 1.3 -2.2 -2.2
2007 1041.2 8.8 81.4 4.6 1,209.0 6.4 94.4 2.2 7.8 7.8 5.5 5.52008 1111.9 6.8 85.1 4.6 1,238.5 2.4 94.7 0.2 4.9 4.9 0.6 0.62009 1205.1 8.4 88.7 4.2 1,319.7 6.6 96.9 2.3 8.3 8.3 6.4 6.42010 1283.8 6.5 91.6 3.3 1,368.3 3.7 97.4 0.5 4.9 4.9 2.1 2.12011 1348.2 5.0 95.4 4.1 1,390.7 1.6 98.0 0.7 1.8 1.8 -1.6 -1.6
Forecasts 2012 1416.0 5.0 100.0 4.9 1,428.6 2.7 100.5 2.6 2.6 2.6 0.3 0.32013 1508.1 6.5 105.5 5.5 1,480.1 3.6 103.2 2.6 5.1 5.1 2.2 2.22014 1611.3 6.8 111.0 5.2 1,542.9 4.2 105.9 2.6 6.8 6.8 4.2 4.22015 1695.7 5.2 116.2 4.7 1,585.2 2.7 108.2 2.2 6.4 6.4 3.9 3.92016 1781.7 5.1 121.2 4.3 1,625.9 2.6 110.1 1.8 5.2 5.2 2.7 2.72017 1888.2 6.0 127.5 5.2 1,682.4 3.5 113.1 2.7 6.0 6.0 3.5 3.5
2000-2010 5.7 4.2 2.7 1.2 4.1 4.1 1.1 1.12006-2011 7.1 4.1 4.1 1.2 5.6 5.6 2.6 2.62011-2017 5.8 5.0 3.2 2.4 5.4 5.4 2.8 2.8
Source: BIS Shrapnel, ABS(1) Earnings of persons. Data is year ended May.(2) Ordinary time hours excluding bonuses.(3) Deflated by RBA/Treasury CPI projections(4) Productivity is output (real GVA) divided by employment in the Construction sector.(5) Excludes workforce compositional productivity.
Long Term Averages
Year Ended December
AWOTE (1) LPI (2) AWOTE (1) LPI (2)Nominal Real (3) Nominal Adjusted Productivity (4) Real Adjusted Productivity (3,4)
81 83 85 87 89 91 93 95 97 99 01 03 05 07 09 11 13 15 17
$ Billion
2
3
4
5
6
8
20
30
40
10
Forecast
Total Construction
Dwellings
Non-dwellingBuildings
EngineeringConstruction
Year Ended June Source: BIS Shrapnel, ABS data

APA Group Real Cost Escalation Forecasts to 2017, March 2012
© BIS Shrapnel Pty Limited 2012 61
to 2014/15 with the deficiency of stock predominately eliminated by June 2013.49 Despite healthy growth in the underlying demand for dwellings, rising interest rates over 2012/13 and into 2013/14 will help trigger the downturn. A recovery in overall construction is projected from 2015/16 (see chart 6.1).
Construction wages growth therefore is expected to be weaker over the next six years. We expect construction wages (in AWOTE terms) to average 5.3 per cent per annum over the 2012 to 2017 period compared to the 8.0 per cent per annum average achieved in the second half of the previous decade (see table 6.2).
6.2 Productivity-Adjusted Wage Forecasts for Construction
Historically, annual productivity changes in the construction industry (at the Australian level) have been quite volatile although, on average, it remained in the positive territory over the 1990s and in the previous decade.
Going forward, at the Australian level, productivity growth in the construction sector is forecast to increase by an average of 0.8 per cent per annum over the next six years from 2011/12 to 2016/17 inclusive (see table 6.3). Meanwhile, productivity growth in the Victorian construction sector is forecast to fall by an average of 0.6 per cent per annum over the next six years due to faster pace growth in employment relative to output. Our forecasts of growth in construction sector output, employment and productivity projections for Australia and Victoria are presented in tables 6.3 and 6.4.
Table 6.2: Construction Wages Growth – Victoria Nominal, Real & Productivity Adjusted Wages
49 BIS Shrapnel Residential Property Prospects, 2011-2014.
AWOTE (1) LPI (2,5) AWOTE (1) LPI (2,5)
$ A% CH Index A% CH $ A% CH Index A% CH A% CH A% CH A% CH A% CH
2000 659.4 58.9 939.2 84.02001 669.9 1.6 61.5 4.4 913.1 -2.8 84.0 0.0 8.5 8.5 4.1 4.1
2002 723.1 7.9 63.9 3.8 958.2 4.9 84.7 0.8 0.8 0.8 -2.2 -2.22003 796.2 10.1 66.1 3.4 1,028.4 7.3 85.3 0.7 1.6 1.6 -1.2 -1.22004 824.4 3.5 69.4 5.0 1,040.8 1.2 87.6 2.7 1.4 1.4 -1.0 -1.02005 880.1 6.8 72.6 4.6 1,083.3 4.1 89.3 1.9 9.0 9.0 6.4 6.42006 872.9 -0.8 76.5 5.4 1,036.1 -4.4 91.0 1.9 3.5 3.5 -0.1 -0.1
2007 969.4 11.1 79.5 3.9 1,126.6 8.7 92.4 1.6 9.1 9.1 6.7 6.72008 1 073.7 10.8 83.1 4.5 1,198.7 6.4 92.5 0.2 5.7 5.7 1.3 1.32009 1 208.9 12.6 87.6 5.4 1,327.9 10.8 95.9 3.6 12.8 12.8 11.0 11.02010 1 274.2 5.4 91.7 4.7 1,361.8 2.6 97.7 1.9 8.1 8.1 5.2 5.22011 1 266.6 -0.6 95.8 4.4 1,307.5 -4.0 98.7 1.0 3.5 3.5 0.2 0.2
Forecasts 2012 1 319.7 4.2 100.0 4.4 1,332.2 1.9 100.8 2.1 9.4 9.4 7.1 7.12013 1 396.0 5.8 104.7 4.7 1,370.7 2.9 102.5 1.8 7.4 7.4 4.5 4.52014 1,477.0 5.8 109.5 4.6 1,414.5 3.2 104.6 2.0 4.7 4.7 2.1 2.12015 1,552.3 5.1 114.4 4.5 1,451.3 2.6 106.7 2.0 3.6 3.6 1.1 1.12016 1,631.5 5.1 119.3 4.3 1,489.0 2.6 108.6 1.8 2.7 2.7 0.2 0.22017 1,726.1 5.8 125.6 5.3 1,538.2 3.3 111.6 2.8 4.6 4.6 2.1 2.1
2000-2010 6.8 4.5 3.8 1.5 6.0 6.0 3.0 3.02006-2011 7.7 4.6 4.8 1.6 7.8 7.8 4.9 4.92011-2017 5.3 4.6 2.7 2.1 5.4 5.4 2.8 2.8
Source: BIS Shrapnel, ABS(1) Earnings of persons. Data is year ended May.(2) Ordinary time hours excluding bonuses.(3) Deflated by RBA/Treasury CPI projections(4) Productivity is output (real GVA) divided by employment in the Construction sector.(5) Excludes workforce compositional productivity.
Long Term Averages
AWOTE (1) LPI (2) AWOTE (1) LPI (2)Year Ended December
Nominal Real (3) Nominal Adjusted Productivity (4) Real Adjusted Productivity (3,4)

Real Cost Escalation Forecasts to 2017, March 2012 APA Group
62 © BIS Shrapnel Pty Limited 2012
The weaker labour productivity performance predicted for Victoria over the next six years means that the actual or true construction labour costs to businesses operating in Victoria will be higher over the forecast period. The end result is that once nominal AWOTE is adjusted for CPI inflation and productivity movements, the real productivity adjusted AWOTE for construction is forecast to average 2.8 per cent per annum over the six years from 2011 to 2017 inclusive for the Victorian construction sector (see table 6.2).

APA Group Real Cost Escalation Forecasts to 2017, March 2012
© BIS Shrapnel Pty Limited 2012 63
Table 6.3: Construction Output, Employment and Productivity: Australia
$/employee$m %CH '000 %CH ('000) %CH
19891990 44884 603.3 74.41991 41960 -6.5 573.0 -5.0 73.2 -1.6
1992 38483 -8.3 517.6 -9.7 74.3 1.51993 40722 5.8 534.1 3.2 76.2 2.61994 43211 6.1 558.6 4.6 77.4 1.41995 45602 5.5 590.8 5.8 77.2 -0.21996 46422 1.8 601.0 1.7 77.2 0.1
1997 47695 2.7 586.4 -2.4 81.3 5.31998 52450 10.0 599.3 2.2 87.5 7.61999 57222 9.1 632.6 5.5 90.5 3.42000 60943 6.5 688.0 8.8 88.6 -2.12001 52166 -14.4 670.6 -2.5 77.8 -12.2
2002 58457 12.1 693.3 3.4 84.3 8.42003 67955 16.2 717.9 3.6 94.7 12.32004 72578 6.8 773.8 7.8 93.8 -0.92005 75849 4.5 832.9 7.6 91.1 -2.92006 82078 8.2 877.5 5.3 93.5 2.7
2007 86469 5.3 943.4 7.5 91.7 -2.02008 92517 7.0 971.7 3.0 95.2 3.92009 95291 3.0 1 001.8 3.1 95.1 -0.12010 95804 0.5 1 003.9 0.2 95.4 0.32011 101480 5.9 1 033.9 3.0 98.1 2.8
Forecasts 2012 106865 5.3 1 051.8 1.7 101.6 3.52013 112125 4.9 1 089.4 3.6 102.9 1.32014 120812 7.7 1 156.5 6.2 104.5 1.52015 119553 -1.0 1 161.8 0.5 102.9 -1.52016 118864 -0.6 1 164.4 0.2 102.1 -0.82017 126286 6.2 1 229.8 5.6 102.7 0.6
1990-2000 3.1 1.3 1.82000-2010 4.6 3.9 0.72006-2011 4.3 3.3 1.02011-2017 3.7 2.9 0.8
Source: BIS Shrapnel, ABS data
Australia
Year Ended June
Gross Value Employment Productivity
Compound Annual Growth Rates
Added

Real Cost Escalation Forecasts to 2017, March 2012 APA Group
64 © BIS Shrapnel Pty Limited 2012
Table 6.4: Construction Output, Employment and Productivity: Victoria
$m %CH '000 %CH ('000) %CH
19891990 9376 157.4 59.61991 8403 -10.4 138.9 -11.7 60.5 1.6
1992 7666 -8.8 118.0 -15.1 65.0 7.41993 7982 4.1 119.0 0.9 67.1 3.21994 8565 7.3 116.4 -2.2 73.6 9.71995 8973 4.8 127.6 9.7 70.3 -4.51996 8965 -0.1 131.3 2.9 68.3 -2.9
1997 9416 5.0 127.7 -2.7 73.7 8.01998 10562 12.2 135.4 6.0 78.0 5.81999 11568 9.5 145.2 7.2 79.7 2.12000 12331 6.6 153.4 5.7 80.4 0.92001 10697 -13.3 156.6 2.1 68.3 -15.0
2002 12099 13.1 175.0 11.8 69.2 1.22003 13900 14.9 177.7 1.6 78.2 13.12004 14956 7.6 183.9 3.5 81.3 4.02005 15538 3.9 190.3 3.5 81.6 0.42006 16363 5.3 211.0 10.8 77.6 -5.0
2007 16987 3.8 227.1 7.7 74.8 -3.62008 17937 5.6 222.9 -1.9 80.5 7.62009 18694 4.2 226.5 1.6 82.5 2.62010 19065 2.0 237.9 5.0 80.1 -2.92011 20021 5.0 256.2 7.7 78.2 -2.5
Forecasts 2012 19415 -3.0 263.8 3.0 73.6 -5.82013 17389 -10.4 247.9 -6.0 70.1 -4.72014 17483 0.5 245.6 -0.9 71.2 1.52015 17622 0.8 245.5 0.0 71.8 0.82016 18645 5.8 254.2 3.5 73.3 2.22017 20403 9.4 271.1 6.7 75.3 2.6
1990-2000 2.8 -0.3 3.02000-2010 4.5 4.5 0.02006-2011 4.1 4.0 0.22011-2017 0.3 0.9 -0.6
Source: BIS Shrapnel, ABS data
Victoria
Year Ended June
Gross Value Employment Productivity
Compound Annual Growth Rates
Added $/employee

Real Cost Escalation Forecasts to 2017, March 2012 APA Group
© BIS Shrapnel Pty Limited 2012 A–1
APPENDIX A: A NOTE ON DIFFERENT WAGE MEASURES AND BIS SHRAPNEL’S WAGE MODEL
Several different measures of wages growth are referred to in this report, each differing slightly both in terms of their construction and appropriateness for measuring different aspects of labour costs. The following provides a brief summary of the main measures, what they are used for and why.
The main wage measures are:
Average Weekly Ordinary Time Earnings (AWOTE) — earnings gained from working the standard number of hours per week. It includes agreed base rates of pay, over-award payments, penalty rates and other allowances, commissions and retainers; bonuses and incentive payments (including profit share schemes), leave pay and salary payments made to directors. AWOTE excludes overtime payments, termination payments and other payments not related to the reference period. The AWOTE measures used in this report refer to full-time adult AWOTE, and are sourced from the Australian Bureau of Statistics (ABS) catalogue number 6302.0, with BIS Shrapnel forecasts.
The Labour Price Index (LPI) — a CPI-style measure of changes in wage and salary costs based on a weighted combination of a surveyed ‘basket’ of jobs. The LPI used in this report excludes bonuses. The LPI also excludes the effect of changes in the quality or quantity of work performed and most importantly, the compositional effects of shifts within the labour market, such as shifts between sectors and within firms. The LPI figures quoted in this report are sourced from ABS catalogue number 6345.0, with BIS Shrapnel forecasts.
Each measure provides a slightly different gauge of labour costs. However, the main distinction between average earnings measures and the labour price index relate to the influence of compositional shifts in employment. The compositional effects include changes in the distribution of occupations within the same industry and across industries, and the distribution of employment between industries. For example, a large fall in the number of lower paid employees, or in employment in an industry with lower average wages, will increase average weekly earnings (all else being equal). While this is a true reflection of the average cost of labour to businesses, it is not necessarily the best measure of ongoing wage inflation (i.e. trends in wage-setting behaviour in the labour market). Another compositional problem with using the ‘all persons’ AWOTE is variations in the proportion of male and female employees (particularly as average female AWOTE is lower than average male AWOTE). However, in practice, the data shows only minor differences in the AWOTE growth rates between male and females (or males and all persons) — between -0.2 and +0.2 per cent — since the 1980s or basically since the equal pay legislation was enacted through the 1970s.
The labour price index was specifically designed to get around these compositional problems. It uses a weighted average of wage inflation across a range of closely specified jobs. As it measures the collective variations in wage rates made to the current occupants of the same set of specified jobs, the LPI reflects pure price changes, and does not measure variations in quality or quantity of work performed. However, like the CPI (Consumer Price Index), the weights are fixed in a base year, so that the further away from that base and the more the composition of the labour market changes over time, the more ‘out of date’ the measure becomes.
Importantly, the LPI does not reflect changes in the skill levels of employees within industries or for the overall workforce, and will therefore understate (or overstate) wage inflation if the overall skill levels increase (or decrease). The labour price index is also likely to understate true wage inflationary pressures as it does not capture situations where promotions are given in order to

Real Cost Escalation Forecasts to 2017, March 2012 APA Group
A–2 © BIS Shrapnel Pty Limited 2012
achieve a higher salary for a given individual, often to retain them in a tight labour market. Average weekly earnings would be boosted by employers promoting employees (with an associated wage increase), but promoting employees to a higher occupation category would not necessarily show up in the labour price index. However, the employer’s total wages bill (and unit labour costs) would be higher.
For this reason, BIS Shrapnel prefers using AWOTE as the measure that best reflects the increase in wage cost changes (or unit labour costs, net of productivity increases) for business and the public sector across the economy. On the other hand, labour price index can be used as a measure of underlying wage inflation in the economy.
Description of BIS Shrapnel’s wage model
BIS Shrapnel’s wage model (for both AWOTE and LPI) is based on the analysis of past and future (expected) wage movements in three discrete segments of the workforce, based on the three main methods of setting pay and working conditions (see Tables 3.1 and 3.2):
Those dependent on awards rely on pay increases given in the annual National Wage case by Fair Work Australia (formerly by the Fair Pay Commission and the Australian Industrial Relations Commission). Most of the wage increases in the National wage case over the past decade have been given as flat, fixed amount (i.e. dollar value) increases, rather than as a proportional increase. At the all industries level, 15.2% of all employees (data excludes those in agriculture, forestry and fishing) have their pay rises determined by this method. In the electricity, gas and water sector, only 0.9% of workers have their pay set by this method.
Collective agreements negotiated under enterprise bargaining account for 43.4% of all employees, but 84.4% of electricity, gas and water employees’ wage increases are determined by this method.
The remaining 41.4% of all industries employees have their pay set by individual arrangements, such as individual contracts or other salary arrangements (including incentive-based schemes), while the proportion for electricity, gas and water is 14.7%.
Future movements of forecasts of wage inflation are based on the key influences on the different wage determination mechanisms of each discrete segment ie:
increases in the Federal Minimum Wage (on which a range of mostly lower paid awards are also based) granted by Fair Work Australia (and by the Fair Pay Commission and the AIRC previously) each year are usually set in relation to recent increases in the CPI and with regard to the wage-setting body’s view of both current and short-term future economic conditions. For instance, the $21.66 increase granted by the Fair Pay Commission in its decision in mid-2008 (effective October 2008) amounted to a 4.1 per cent increase for those on the Federal Minimum Wage of $522/week. This reflected the marked acceleration in the CPI in the first half of 2008 (to 4.2 per cent in the March quarter and to 4.5 per cent in the June quarter). It also reflected the strong economic conditions apparent around mid-2008 (the unemployment rate was just over 4 per cent). Conversely, the Fair Pay Commission gave no increase in its July 2009 decision, citing as its reasons, the deterioration of economic conditions and what we believe is a spurious link between minimum wage increases and higher unemployment.
increases in collective agreements under enterprise bargaining are influenced by a combination of recent CPI increases, inflationary expectations, the recent profitability of relevant enterprises, current business conditions and the short-term economic outlook, and by the industrial relations ‘strength’ of relevant unions. Because the average duration of

APA Group Real Cost Escalation Forecasts to 2017, March 2012
© BIS Shrapnel Pty Limited 2012 A–3
agreements now runs for two-to-three years, BIS Shrapnel bases its near-term forecasts on the strength of recent agreements, which have been ‘formalised’ over recent quarters. Thereafter, collective agreements are based on BIS Shrapnel’s macroeconomic forecasts.
increases in individual agreements are primarily influenced by the strength of the labour market (especially the demand-supply balance of skilled labour), inflationary expectations, the recent profitability of relevant enterprises, current business conditions and the short-term economic outlook.
Note in table 3.1, wage increases under ‘individual arrangements’ are calculated by deduction. Data from DEEWR (Department of Education, Employment and Workforce Relations) are used for wage increases under collective agreements..
The limitation of this methodology is that because individual arrangements are calculated as a residual, all of the compositional effects in terms of AWOTE (ie from more or less lower-paid workers being employed in the relevant year) plus all (or most) of the bonuses and incentives from those under award or collective agreements end up in the individual arrangements residual, which distorts the pay increases in this segment. However, the methodology works well for the LPI, particularly at the all industries level, although some compositional problems occur at the sectoral level, particularly for sectors with a relatively small employment base (such as electricity, gas and water supply).
Some Deficiencies in Econometric Models of Wage Determination for the EGW Sector
We believe that BIS Shrapnel’s institution-based wage model for the EGW sector better approximates the underlying (actual) data generating process than a straight application of an econometric model. As a result, we strongly believe our model of wage determination for the EGW or utilities sector is superior to methodology utilising purely econometric regression techniques, in particular linear regression models to forecast wages. This opinion is based on a number of factors, some of which are described below:
the evolution of the wage determination system from the 1980s and particularly during the 1990s in the utilities sector means that econometric equations struggle with the changes in the relative importance of different factors influencing wages growth that have occurred over the past two-to-three decades. As such, we believe that an econometric equation would struggle to properly model the present complexity of the wage determination processes in this sector.
BIS Shrapnel’s model of wage determination does take account of the present complexity of the wage determination process, both at the national (all industries) level and at the industry sector level. Our methodology and explanation of the macroeconomic influences are, we believe, clear and transparent. We use small sector mathematical models to derive forecasts for discrete segments, rather than an over-riding, overall macroeconomic model.
BIS Shrapnel believes the use of univariate or multi-equation time series econometric modelling is not the best method for forecasting wages growth in the utilities sector. This is because many regression equations include lagged dependent variables, and econometric models that include lagged dependant variables tend to miss turning points in the cycle, often producing results we know to be spurious. Indeed, the models performed no better (or worse) than a combination of a large range of ‘mini’ sectoral models and our expertise and knowledge of key influences.

Real Cost Escalation Forecasts to 2017, March 2012 APA Group
A–4 © BIS Shrapnel Pty Limited 2012
APPENDIX B: ELECTRICITY, GAS AND WATER SUPPLY (EGW) VERSUS ELECTRICITY, GAS, WATER AND WASTE SERVICES (EGWWS)
Potential Impact of the Recent Change to ABS Industry Classification ie Adding Waste Services to EGW
The reclassification of the industry sectors by the ABS which has been underway for more than a year has seen ‘waste services’ added to the EGW sector. Wages data classified under the new ANZSIC 2006 industry classification first became available in November 2009 — providing August 2009 for AWOTE and September quarter 2009 for LPI. Up to the June quarter 2009, industry wages data was still classified under the previous ANZSIC 1993 industry classification. Industry employment data has been classified under the new ANZSIC 2006 code since February 2009, while output (Gross Value Added) was reclassified from the September quarter 2009 (released early December 2009). All historical data (for wages, GVA, etc) was also reclassified.
The inclusion of the waste services sub-sector has led to lower wage growth outcomes for the combined EGW and Waste Services sector. Hence, it is not an accurate indicator for the mostly higher skilled (and more highly demanded) occupations in the EGW sector. Using a comparison of the historical wages and employment data of EGW versus EGW and Waste Services at the national (Australian) level, annual growth in the combined EGWWS sector is 0.1% less on average than the EGW sector over the period from 1998/99 to 2008/09, and 0.6% less on average over the same period for AWOTE. The overall wages growth average has also been dragged down by the fact that employment growth in the lower paid waste services sub-sector has outstripped growth in the higher paid EGW sector over the eleven years to November 2008 — 4.8 per cent per annum for waste services compared to 3.8 per cent pr annum for EGW.
The problem for APA Group and indeed all the electricity and gas utilities dealing with the Australian Energy Regulator (AER), is that the inclusion of waste services understates the growth in labour costs, both historically and going forward. The AER is supposed to deliver a ruling on labour and other cost escalators pertinent to the electricity and gas utilities, hence should use the wages escalator for EGW services rather than the labour costs growth for the EGWWS industry.
Table B–1: EGW V. EGWWS
YearEndedJune $/week $/week 2004=100 2009=100 '000 '000
1998 832 7.5 796 6.3 1.2 79 64 64.5 -2.9 78.4 -2.5 -0.51999 867 4.2 827 3.9 0.3 82 3.2 66 3.0 0.2 64.8 0.6 78.9 0.6 -0.1
2000 923 6.4 867 4.8 1.6 85 3.8 68 3.8 0.0 64.2 -0.9 79.5 0.8 -1.72001 982 6.4 918 6.0 0.5 88 3.9 71 3.8 0.2 65.4 1.9 80.5 1.2 0.72002 1 055 7.4 981 6.8 0.6 92 4.2 74 4.2 0.0 67.5 3.1 83.1 3.2 -0.12003 1 085 2.8 1 001 2.1 0.8 96 4.3 77 4.1 0.1 72.8 7.9 89.6 7.8 0.12004 1 156 6.5 1 057 5.5 1.0 100 4.3 80 4.0 0.3 75.3 3.4 91.5 2.1 1.3
2005 1 195 3.4 1 091 3.2 0.2 104 4.4 83 4.3 0.1 76.7 1.9 95.2 4.1 -2.32006 1 214 1.6 1 111 1.9 -0.2 110 5.5 88 5.3 0.2 87.4 14.0 106.0 11.2 2.72007 1 262 4.0 1 152 3.7 0.3 115 5.0 92 4.8 0.1 85.1 -2.6 105.7 -0.3 -2.32008 1 304 3.3 1 183 2.7 0.6 120 4.1 96 4.1 -0.1 89.9 5.6 113.1 7.0 -1.42009 1 389 6.5 1 255 6.1 0.3 126 4.5 100 4.4 0.1 na na 134.8 19.2 na
1998-09 4.8 4.2 0.6 4.3 4.2 0.1 3.8 4.6 -0.3e: estimate Source: BIS Shrapnel, ABS data
EGWLPIEGWWS
AWOTEEGW EGWWS Difference Difference
%CH%CH
Average Growth Rates
%CH%CH %CH %CH %CH %CH %CH
EMPLOYMENTEGW EGWWS Difference

Real Cost Escalation Forecasts to 2017, March 2012 APA Group
© BIS Shrapnel Pty Limited 2012 A–5
APPENDIX C: TERMS OF REFERENCE

Real Cost Escalation Forecasts to 2017, March 2012 APA Group
A–6 © BIS Shrapnel Pty Limited 2012

APA Group Real Cost Escalation Forecasts to 2017, March 2012
© BIS Shrapnel Pty Limited 2012 A–7

Real Cost Escalation Forecasts to 2017, March 2012 APA Group
A–8 © BIS Shrapnel Pty Limited 2012

APA Group Real Cost Escalation Forecasts to 2017, March 2012
© BIS Shrapnel Pty Limited 2012 A–9
Real Cost Escalation Forecasts to 2017, March 2012 APA Group
A–10 © BIS Shrapnel Pty Limited 2012

APA Group Real Cost Escalation Forecasts to 2017, March 2012
© BIS Shrapnel Pty Limited 2012 A–11


APA Group Real Cost Escalation Forecasts to 2017, March 2012
© BIS Shrapnel Pty Limited 2012 A–13
APPENDIX D: STATEMENT OF COMPLIANCE WITH EXPERT WITNESS GUIDELINES
I have read the Guidelines for Expert Witnesses in Proceedings of the Federal Court of Australia and confirm that I have made all inquiries that I believe are desirable and appropriate and that no matters of significance that I regard as relevant have, to my knowledge, been withheld from the Court.

Real Cost Escalation Forecasts to 2017, March 2012 APA Group
A–14 © BIS Shrapnel Pty Limited 2012
APPENDIX E: CURRICULUM VITAES OF KEY PERSONNEL
Richard Robinson, B.Comm (Hons), Senior Economist Associate Director - Economics
Richard Robinson has been employed with BIS Shrapnel since 1986.
Richard is the company's principal economic forecaster, being largely responsible for the short term economic forecasts presented at BIS Shrapnel's half yearly conferences in March and September. He contributes forecasts and analysis to the regular subscription services, Economic Outlook and Long Term Forecasts.
Richard regularly analyses and forecasts resources investment and civil engineering construction activity, and production of manufactures, consumer goods and commodities. In this work, he has developed considerable industry expertise in the construction, manufacturing, agriculture, services, commodity and resources sectors of the Australian and state economies.
Richard has also been involved in a wide range of consultancy and private client projects including formulating end-use sector demand models for forecasting product demand, project evaluation studies, cost-benefit analysis, assessments of individual property markets and analysing the consistency of escalators in contracts. Some other projects have included analysing and forecasting freight tonnages; a study of the repair and maintenance market; the preparation of economic arguments for the National Wage Case for a private industry group; regular analysis and detailed short and long term forecasts of economic variables in a number of overseas countries; and contributing discussion papers to CEDA (Committee for Economic Development of Australia).
Kishti Sen, B.A., M.Ec. (Hons), Ph.D. Economist
Kishti joined BIS Shrapnel in 2007, where he works across both the Economics and Infrastructure and Mining units. Since joining the company, Kishti has worked on a number of projects, including contributing the analysis of inflation, wages, interest rates and the world economic outlook to BIS Shrapnel’s annual Long Term Forecasts publication and analysis and forecasts to Engineering Construction in Australia and Maintenance in Australia reports.
In terms of private client projects, Kishti has undertaken analysis of inflation and wage trends at the state level for reports required in state wage cases, and provided a discussion of state economic trends. Kishti has also been involved in the design and implementation of econometric methodologies for private economic research projects.
Kishti holds a PhD in Economics from the University of Sydney and Bachelors Degree in Economics and Mathematics from Massey University. Prior to joining BIS Shrapnel, Kishti was Senior Economist (Policy & Research) at the Reserve Bank of Fiji.
Daniel Gradwell, B.Com (Hons, Economics) Research Analyst
Daniel joined BIS Shrapnel in 2010, having recently obtained his degree, and works across both the Economics and Infrastructure and Mining units. Daniel focused on trade and the current account deficit in the Economic department's recent Long Term Forecasts report, and is a contributor to the monthly Economic Outlook publication. Within the Infrastructure and Mining unit, Daniel contributed to the Maintenance in Australia report, where he forecasted construction and maintenance expenditure for both the gas and electricity industries.
Daniel achieved First Class Honours in Economics at the University of Otago, New Zealand.

APA Group Real Cost Escalation Forecasts to 2017, March 2012
© BIS Shrapnel Pty Limited 2012 A–15
APPENDIX F: LIST OF ABS & OTHER DATA SOURCES
The ABS data and other information sources used in the preparation of this document and the forecasts contained within are listed below. Separate files containing this information will be attached.
ABS Data
Australian Industry 81550_2009-10.pdf AWE 63020_Nov 2011.pdf BOP 5302.0 Dec 2011.pdf BA 87520_Sep 2011.pdf CAPEX 56250_Dec 2011.pdf CPI 64010_Dec 2011.pdf ECA 87620_Sep 2011.pdf EEAH 63060_May 2010.pdf Labour Force 62020_Nov 2011.pdf LPI 63450_Dec 2011.pdf National Accounts 52060_Dec 2011.pdf State National Accounts 52200_2010-11.pdf Internation Trade in goods and Services 5368.0_Jan 2012.pdf AER/DAE Documents
Draft Decision – Powerlink Revenue Proposal.pdf ActewAGL’s Regulatory Proposal.pdf Envestra Draft Decision –Qld.pdf Ergon Energy’s Regulatory Proposal 2010-15.pdf Powerlink Revenue Proposal.pdf SP AusNet Revised Proposal (12 October).pdf Envestra Final Decision.pdf Forecast growth in labour costs QLD and SA.pdf Forecast growth in labour costs QLD and Tas.pdf BIS Shrapnel Documents – Strictly Confidential
BIA Report – 2011-2025.pdf RPP 2011-2014 Report.pdf ECA 2010/11–2024/25 Report.pdf ECA 2011/12-2025/26 Report.pdf EO Bulletin February 2012.pdf EO Buletin March 2012.pdf LTF 2011-2025 – February 2012 Update Report.pdf
Other Documents
Clarius Skills Index December 2011 Quarter.pdf DEEWR Skills Shortage List_Australia December 2011.pdf DEEWR Skills Shortage List_Victoria December 2011.pdf DEEWR TrendsJ11.pdf RBA February 2012 Statement on Monetary Policy.pdf BITRE – Sea Freight 2009-10.pdf Ric Battellino speech.pdf