REAL ASSET ALLOCATION: EVALUATING THE DIVERSIFICATION BENEFITS … · 2018-07-23 · REAL ASSET...
13
22 ND ANNUAL PACIFIC-RIM REAL ESTATE SOCIETY CONFERENCE SUNSHINE COAST, QUEENSLAND, AUSTRALIA 17-20 JANUARY 2016 REAL ASSET ALLOCATION: EVALUATING THE DIVERSIFICATION BENEFITS OF PROPERTY AND ALTERNATIVE ASSET CLASSES IN AUSTRALIAN SUPERANNUATION PORTFOLIOS Wejendra Reddy RMIT University ABSTRACT Problem/Purpose The collapse of the credit markets in 2007 was more profound than previous recessions for all investment markets, including property. In the post-GFC era, institutional investors have reduced their exposure to mainstream asset classes such as equities and bonds; they are investing more in real assets such as property and infrastructure. In fact, recent market reports anticipate that in the next decade, institutional real assets allocation will increase from current average of 5%-10% to 25%. This research tests this notion by examining the diversification benefits of property and infrastructure (alternative) asset classes within A$431 billion industry superannuation fund default balanced mixed-asset portfolio. Design/methodology/approach The research investigates the diversification benefits of property assets and alternative assets by constructing two asset and multi-asset portfolio models. The asset allocation is determined using the mean-variance portfolio optimisation technique utilising Australian 10-year bonds as the risk free rate. The analysis is based on ex-post data covering 20 years (1995 to 2015). The Sharpe ratio is used as the key risk-adjusted return performance measure. Findings The results illustrate that including alternative assets in the property portfolio provides the best risk-adjusted return performance (0.56), although portfolio weighting is dominated by direct property. Despite the higher asset allocation range assigned to alternative assets (0-25%) than to property assets (0-20%), the average allocation to alternatives was 12%, lower than the property allocation (22%). The strong allocation to property in both the two asset and multi-asset portfolios in this research further highlights that property will command significant allocation in institutional portfolios, despite the availability of similar real assets such as infrastructure. Takeaway for practice For an Australian superannuation balanced fund, the empirical results show that there is scope to increase the combined property and alternative asset allocation level from current 27% to 33%. This high allocation is backed by improved risk-adjusted return performance. This knowledge will be beneficial for funds currently reprofiling investment portfolios to achieve stable risk-adjusted returns. Originality/value The research contributes to both practical and academic fields as it offers a methodological approach on how allocation to property assets can be improved using a series of asset allocation strategies. Keywords: Property, Infrastructure, Superannuation, Asset Allocation, Diversification options. Paper Type: Research Paper Theme: Investment and Finance
Transcript of REAL ASSET ALLOCATION: EVALUATING THE DIVERSIFICATION BENEFITS … · 2018-07-23 · REAL ASSET...

22ND
ANNUAL PACIFIC-RIM REAL ESTATE SOCIETY CONFERENCE
SUNSHINE COAST, QUEENSLAND, AUSTRALIA 17-20 JANUARY 2016
REAL ASSET ALLOCATION: EVALUATING THE DIVERSIFICATION
BENEFITS OF PROPERTY AND ALTERNATIVE ASSET CLASSES IN
AUSTRALIAN SUPERANNUATION PORTFOLIOS
Wejendra Reddy
RMIT University
ABSTRACT
Problem/Purpose
The collapse of the credit markets in 2007 was more profound than previous recessions for all investment
markets, including property. In the post-GFC era, institutional investors have reduced their exposure to
mainstream asset classes such as equities and bonds; they are investing more in real assets such as property
and infrastructure. In fact, recent market reports anticipate that in the next decade, institutional real assets
allocation will increase from current average of 5%-10% to 25%. This research tests this notion by
examining the diversification benefits of property and infrastructure (alternative) asset classes within A$431
billion industry superannuation fund default balanced mixed-asset portfolio.
Design/methodology/approach
The research investigates the diversification benefits of property assets and alternative assets by constructing
two asset and multi-asset portfolio models. The asset allocation is determined using the mean-variance
portfolio optimisation technique utilising Australian 10-year bonds as the risk free rate. The analysis is based
on ex-post data covering 20 years (1995 to 2015). The Sharpe ratio is used as the key risk-adjusted return
performance measure.
Findings
The results illustrate that including alternative assets in the property portfolio provides the best risk-adjusted
return performance (0.56), although portfolio weighting is dominated by direct property. Despite the higher
asset allocation range assigned to alternative assets (0-25%) than to property assets (0-20%), the average
allocation to alternatives was 12%, lower than the property allocation (22%). The strong allocation to
property in both the two asset and multi-asset portfolios in this research further highlights that property will
command significant allocation in institutional portfolios, despite the availability of similar real assets such
as infrastructure.
Takeaway for practice
For an Australian superannuation balanced fund, the empirical results show that there is scope to increase the
combined property and alternative asset allocation level from current 27% to 33%. This high allocation is
backed by improved risk-adjusted return performance. This knowledge will be beneficial for funds currently
reprofiling investment portfolios to achieve stable risk-adjusted returns.
Originality/value
The research contributes to both practical and academic fields as it offers a methodological approach on how
allocation to property assets can be improved using a series of asset allocation strategies.
Keywords: Property, Infrastructure, Superannuation, Asset Allocation, Diversification options.
Paper Type: Research Paper
Theme: Investment and Finance

22nd
Annual PRRES Conference, Sunshine Coast, Queensland, Australia 17-20 January 2016 2
INTRODUCTION
Property as an asset class plays an important role in institutional investment portfolios in Australia. Property
assets provide strong diversification potential when included in a mixed-asset portfolio. Combined with its
comparatively good returns, property’s low volatility (even after adjusting for the effects of valuation
smoothing) emphasise its attractive risk and return characteristics to investors. Property assets generate
regular income and long-term capital growth prospects. Apart from diversification benefits, inflation hedging
has also been a good reason for investing in property (Bond et al. 2007a).
Despite the benefits, asset allocation studies by Brown and Schuck (1996), Craft (2001), Hoesli, Lekander
and Witkiewicz (2003) and Worzala and Bajtelsmit (1997) have concluded invariably that property is
significantly under-represented in the typical investment portfolio. Baum and Hartzell (2012, p. 11) stated
that property’s under-weighting in institutional portfolios can be attributed to several factors including:
i. The operational difficulties of holding properties, including illiquidity, lumpiness (specific risks) and
the difficulty in aligning the investment management process for property and equities.
ii. The introduction of new alternative asset classes, such as indexed-linked bonds, private equity,
infrastructure and hedge funds. Some of these alternatives, such as infrastructure funds, offer income
security and diversification benefits that are similar to those associated with real estate.
The research investigates the diversification benefits of property and alternative assets by constructing two
asset and multi-asset portfolio models. To do this, the research examines the performance of industry
superannuation balanced fund asset classes over a 20 year period (1995-2015); using quarterly benchmark
data for each asset class.
Generally, Australians have three superannuation investment options: not-for-profit funds, retail funds, and
self-managed super funds (SMSFs). The institutional sector, consisting of the not-for-profit funds (corporate
funds, industry funds, public sector funds) and retail funds, make up 62% of the superannuation industry’s
A$2 trillion of assets under management. The not-for-profit superannuation funds are popular options for
superannuants, given that the trustee company operating the fund does not seek to make any profit out of
running the fund, and therefore the funds often charge members quite low fees. With A$431 billion under
management, industry funds are the largest institutional superannuation investment options (APRA 2015).
Industry superannuation funds are designed for employees working in a common industry or group of
associated industries operated by parties to industrial awards (usually employer associations and/or unions).
Industry funds offer several investment options which aim to meet member investment objectives. The
default balanced fund is the most popular, accounting for 67% of the industry funds’ investments (APRA
2015). Balanced funds offer stable income returns and capital growth derived from a diversified range of
asset classes. Australian superannuation managers’ conventional strategic default balanced investment
portfolio generally consists of five major components, namely: equities (Australian and international), fixed
income (Australian and international), property, alternatives, and cash. Figure 1 illustrates the aggregated
balanced industry superannuation fund default option asset allocation, as at June 2015.
Figure 1: Industry Superannuation Balanced Fund Option Portfolio: June 1995-2015
Source: APRA 2015;
Rainmaker Group 2012.

22nd
Annual PRRES Conference, Sunshine Coast, Queensland, Australia 17-20 January 2016 3
Figure 1 shows that over the study period (20 years), equities (Australian and international) was the
dominant asset class, representing 52% of the industry superannuation balanced fund portfolio, followed by
fixed income securities (Australian and international) 18%, alternatives (12%), property (10%) and cash
(8%). Property component includes both allocation direct/unlisted property (5%) and listed REITs (5%).
These asset allocation components do change over time as fund managers regularly rebalance investment
portfolios to reflect prevailing market conditions. For example, allocation to property ranged from 9%-14%
in the 20 year period to June 2015. In the same period allocation to alternatives assets ranged from 4%-21%.
Alternatives now represent the third largest asset class in Australian institutional balanced investment
portfolios. Large institutional fund managers can offer investors both unlisted and listed alternatives
products, such as infrastructure funds, venture capital, and other forms of private equity. The alternatives
sector in Australia is dominated by the infrastructure funds which represent approximately 50% of the
industry’s assets under management (Austrade 2010). For the purpose of this research, alternative assets
include hedge funds, commodities, infrastructure funds, private equity, and venture capital funds.
Australian industry superannuation funds generally have extensive property portfolios invested in both
direct/unlisted and listed property. Typically, institutional superannuation funds favour unlisted property for
diversification and stability reasons. Industry superannuation funds unlisted wholesale property funds are
externally managed by several major fund managers in Australia, including AMP, Lend Lease, QIC, ISPT
and GPT. At 30 June 2015, industry superannuation fund combined allocation to property and alternatives
were 27%; being property 10% (direct property 8%; listed property 2%) and alternatives 17%. Table 1 lists
the leading APRA regulated Australian industry superannuation funds and the fund allocation to property
and alternatives, as at June 2015.
Table 1: Leading Industry Funds by Net Asset Value; Property, Alternatives Allocation: 30 June 2015
Superannuation Funds Net Assets
(A$ billion)
Property
Allocation
Alternatives
Allocation
(%) $ billion (%) $ billion
AustralianSuper 91.8 9.2% 8.5 13.8% 12.6
Unisuper 49.2 8.8% 4.3 8.4% 4.1
Retail Employees Superannuation Trust 37.4 7.0% 2.6 5.0% 1.9
Sunsuper Superannuation Fund 33.5 9.3% 3.1 19.3% 6.5
Health Employees Superannuation Trust 32.4 9.0% 2.9 9.0% 2.9
Construction & Building Unions Superannuation 30.7 11.0% 3.4 16.5% 5.1
Source: APRA 2015
AustralianSuper and Unisuper are the highest ranked industry funds with net assets of A$92 billion and
A$49 billion respectively, as at June 2015. Several industry superannuation funds had in excess of A$2
billion invested in both property and alternatives assets. The AustralianSuper fund holds the largest
proportion of property assets (A$8.5 billion) and alternatives assets (A$12.6 billion). Other funds with
significant investments in property assets include Unisuper (A$4.3 billion), Construction & Building Unions
Superannuation (A$3.4 billion) and Sunsuper Superannuation Fund (A$3.1 billion). Sunsuper
Superannuation Fund (A$6.5 billion) and Construction & Building Unions Superannuation (A$5.1 billion)
also had significant investments in alternatives assets.
The next section provides literature review on the challenges posed by alternative asset classes to property
asset allocation in institutional portfolios.

22nd
Annual PRRES Conference, Sunshine Coast, Queensland, Australia 17-20 January 2016 4
LITERATURE REVIEW
The shortage of good quality commercial real estate, along with yield compression, has resulted in
significant fund flow in the alternative sector, particularly in the infrastructure sector (Newell & Peng
2008a). The increasing level of institutional support means that alternatives are now the third largest asset
group in most Australian institutional portfolios. There is ongoing debate about whether alternative assets
such as infrastructure can be regarded as property assets, and whether alternative assets can replicate the
performance of property assets in the mixed-asset portfolio.
Finkenzeller, Dechant and Schäfers (2010) identified that institutional investors faced this classification
problem when allocating alternative assets in their portfolios. Some institutional investors tend to allocate
alternative assets in existing real estate or fixed income securities portfolio, although the risk-adjusted return
characteristics do not match. The analogy, particularly between direct property and infrastructure assets,
could potentially explain why institutional investors group them together. Direct property and infrastructure
have similar underlying asset characteristics, such as indivisibility, long lifecycles, site dependency, long-
term investment horizons, restricted liquidity, valuation-based performance, inflation hedging, capital gains,
high yield, and strong competition for quality assets. Both are real assets and offer relatively stable
investment returns when compared to more volatile assets such as equities.
However, there are also significant differences between property and infrastructure assets. While property
markets are described as relatively competitive, infrastructure markets often have oligopolistic or even
monopolistic structures. In addition, there is a greater degree of transparency in the real estate markets
compared to the infrastructure market. There is limited potential to obtain ownership of direct infrastructure
assets due to regulatory constraints which often only allow user rights (RREEF 2005; Newell, Chau & Wong
2009; Newell & Peng 2008a). Finkenzeller, Dechant and Schäfers (2010) explained that although
investments in direct property are inhibited by large investment scales, direct infrastructure investments are
lumpier. Real estate as an asset class provides various uses, whereas infrastructure assets are limited to very
specific and restricted uses. The acquisition and sale of direct infrastructure projects is time consuming, and
thus reduces the potential for investors to react immediately to changing market conditions.
Bond et al. (2007b) investigated whether the performance of real estate could be replicated by alternative
assets (hedge funds, private equity, commodities and infrastructure) in UK institutional portfolios, and found
that alternative assets could not deliver the same level of portfolio hedging benefits as real estate. Their study
found that adding real estate to a portfolio of bonds and equities would have led to a substantial reduction in
portfolio risk. By contrast, in no case does adding one of the alternative assets to the core asset mix achieve a
significant level of risk reduction. They further identified that in the absence of real estate, the greatest risk
reduction occurs by adding private equity to the mixed-asset portfolio. Newell and Peng (2008b) in a similar
study on the US market, found while utilities provided lower diversification options, infrastructure offer
enhanced portfolio diversification benefits in real estate, real estate-related and mixed-asset portfolios.
Several recent studies have evaluated the performance and diversification benefits of property and alternative
assets in Australia. Earlier studies by CFS (2009), Newell and Peng (2008a), and Peng and Newell (2007),
found that the correlation between unlisted infrastructure and unlisted property in Australia is significantly
low, explaining the potential diversification benefits of including both asset classes within the multi-asset
portfolio. More recently, Newell and Lee (2011) found that while direct property is still seen to play a key
role in the Australian multi-asset portfolio, direct property plays a less significant role in the portfolio when
the alternative assets (such as private equity, infrastructure, hedge funds and commodities) are included. An
evaluation of the correlation matrix showed that in most instances, the diversification benefits of alternative
assets compared to assets such as shares and bonds were much greater than property, which could in general
have a negative impact on the level of allocation to direct property in the multi-asset portfolio. Newell, Peng
and De Francesco (2011) found that even with the impact of the GFC, the performance attributes of unlisted
infrastructure was superior to direct property. Their study found that the diversification benefits of unlisted
infrastructure were more significant than the diversification benefits of direct property. These results provide
justification for the current institutional practice of including alternative assets, such as infrastructure, as a
separate asset class in the mixed-asset portfolio.

22nd
Annual PRRES Conference, Sunshine Coast, Queensland, Australia 17-20 January 2016 5
The literature review shows that direct property, and alternative assets such as infrastructure, has similar
underlying asset characteristics. Infrastructure is a very heterogeneous asset class offering different risk-
return profiles across a range of subsectors, similar to property. Both are real assets and offer relatively stable
investment returns when compared to more volatile assets such as equities. However, there are a number of
qualitative differences between direct property and infrastructure, which further adds weight to including
infrastructure alongside property in a portfolio. Although research (Newell 2008) has identified that
increased allocation to alternatives had not directly impacted a superannuation fund’s property allocation
component, this needs to be further investigated in light of recent changes to institutional asset allocation
strategies.
DATA AND METHODOLOGY
This research will evaluate the diversification benefits and asset allocation components of different property
assets (direct property and listed property) and alternative assets within the setting of two asset and multi-
asset portfolios, including the industry funds’ conventional strategic investment approach. Asset data for this
study covers a 20 year period, 1995-2015, and comprises 81 quarterly data points. Industry standards
generally require a minimum of 20 quarterly period data points for investment analysis (Bacon 2008, p. 64).
The asset data and benchmark representations for the research are detailed below:
Cash – RBA Interbank Rate
Australian Fixed Income (Aust fixed) - CBA Bond: All Series, All Maturities
International Fixed Income (Int fixed) - Citigroup World Government Bond Index (AU$)
Australian Equities (Aust eq) - ASX All Ordinaries Accumulation
International Equities (Int eq) - MSCI WORLD ex AUSTRALIA Standard (Large+Mid Cap) (AU$)
Direct Property (Direct Prop) - PCA/IPD Composite Property Index
Listed Property (Listed Prop) - S&P/ASX 200 A-REIT Index
Alternatives Assets (Altern'ves) - UBS Wealth Management; Dow Jones Credit Suisse; AVCAL &
Cambridge Associates; Reserve Bank of Australia.
The property data used to construct the different asset allocation models are raw and not de-smoothed
property, which is in line with industry practice. Recent studies such as AXA Real Estate (2012) in UK, and
Newell and Lee (2011) in Australia, show that substituting the raw property index data with the de-smoothed
property returns did little to change the weighting of property in the optimal portfolio. The normal industry
practice is to use property index data in the original format.
The sourced overseas data was converted to Australian dollars, based on the prevailing exchange rate. For
the alternative asset class data series, the Australian managed fund industry appears to have a range of
benchmark data series which seem incomplete compared to the assets included in the alternative asset class.
It is appreciated that there was difficulty in sourcing and establishing the alternative asset class definition and
related index composition. This is because in Australia there is no recognised alternatives index available to
industry. The index in this research is constructed from the commencement of selected Australian data series
for Infrastructure and Utilities, Hedge Funds (AU), Private Equity, and Commodity Prices (AU) based on an
equal weighted formula, which follows the UK alternative asset class index structure (Bond et al. 2007a).
The benchmark allocation series data for the seven asset classes in industry superannuation balanced funds
was sourced from the Rainmaker Group, a leading superannuation service provider in Australia. Each
quarter, Rainmaker Group surveys and publishes asset allocation data for the Australian industry and retail
superannuation funds. Average asset allocation for industry superannuation fund for the period 1995-2015
was displayed in Figure 1. The range of asset allocation is exhibited in Table 2.
22nd
Annual PRRES Conference, Sunshine Coast, Queensland, Australia 17-20 January 2016 6
Minimise 𝜎𝑝 2 = 𝑥𝑖
𝑛
𝑗=1
𝑛
𝑖=1
𝑥𝑗𝜎𝑖𝑗
subject to 𝜇𝑝 = 𝑥𝑖
𝑛
𝑖=1
𝜇𝑖
𝜇𝑝 ≥ 𝜇𝑜
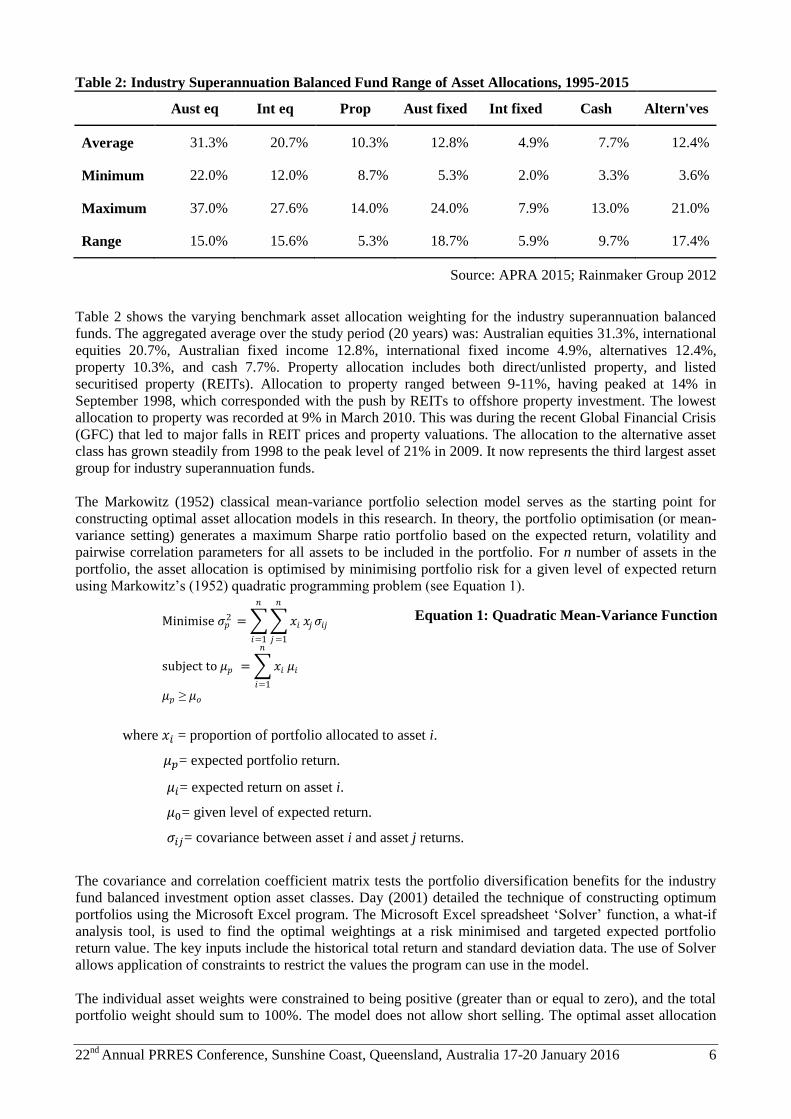
Table 2: Industry Superannuation Balanced Fund Range of Asset Allocations, 1995-2015
Aust eq Int eq Prop Aust fixed Int fixed Cash Altern'ves
Average 31.3% 20.7% 10.3% 12.8% 4.9% 7.7% 12.4%
Minimum 22.0% 12.0% 8.7% 5.3% 2.0% 3.3% 3.6%
Maximum 37.0% 27.6% 14.0% 24.0% 7.9% 13.0% 21.0%
Range 15.0% 15.6% 5.3% 18.7% 5.9% 9.7% 17.4%
Source: APRA 2015; Rainmaker Group 2012
Table 2 shows the varying benchmark asset allocation weighting for the industry superannuation balanced
funds. The aggregated average over the study period (20 years) was: Australian equities 31.3%, international
equities 20.7%, Australian fixed income 12.8%, international fixed income 4.9%, alternatives 12.4%,
property 10.3%, and cash 7.7%. Property allocation includes both direct/unlisted property, and listed
securitised property (REITs). Allocation to property ranged between 9-11%, having peaked at 14% in
September 1998, which corresponded with the push by REITs to offshore property investment. The lowest
allocation to property was recorded at 9% in March 2010. This was during the recent Global Financial Crisis
(GFC) that led to major falls in REIT prices and property valuations. The allocation to the alternative asset
class has grown steadily from 1998 to the peak level of 21% in 2009. It now represents the third largest asset
group for industry superannuation funds.
The Markowitz (1952) classical mean-variance portfolio selection model serves as the starting point for
constructing optimal asset allocation models in this research. In theory, the portfolio optimisation (or mean-
variance setting) generates a maximum Sharpe ratio portfolio based on the expected return, volatility and
pairwise correlation parameters for all assets to be included in the portfolio. For n number of assets in the
portfolio, the asset allocation is optimised by minimising portfolio risk for a given level of expected return
using Markowitz’s (1952) quadratic programming problem (see Equation 1).
where 𝑥 = proportion of portfolio allocated to asset i.
𝜇 = expected portfolio return.
𝜇 = expected return on asset i.
𝜇 = given level of expected return.
𝜎 = covariance between asset i and asset j returns.
The covariance and correlation coefficient matrix tests the portfolio diversification benefits for the industry
fund balanced investment option asset classes. Day (2001) detailed the technique of constructing optimum
portfolios using the Microsoft Excel program. The Microsoft Excel spreadsheet ‘Solver’ function, a what-if
analysis tool, is used to find the optimal weightings at a risk minimised and targeted expected portfolio
return value. The key inputs include the historical total return and standard deviation data. The use of Solver
allows application of constraints to restrict the values the program can use in the model.
The individual asset weights were constrained to being positive (greater than or equal to zero), and the total
portfolio weight should sum to 100%. The model does not allow short selling. The optimal asset allocation
Equation 1: Quadratic Mean-Variance Function

22nd
Annual PRRES Conference, Sunshine Coast, Queensland, Australia 17-20 January 2016 7
model is reviewed annually. The construction of the efficient frontier involved calculating the possible
portfolio weighting at a 10% interval for return and standard deviation. The Australian government 10 year
bonds are used as the risk-free rate.
In practice, the Markowitz mean-variance framework is altered with various types of constraints that follow
the institution’s investment guidelines and investment objectives. This is because the classical mean-variance
portfolio optimisation can often result in extreme allocation in specific assets. Therefore, in addition to the
Strategic asset allocation policies, industry superannuation funds also formulate a range of permissible
investable asset weights as a primary risk management tool. Including holding constraints leads to a more
industry practical application of the mean-variance optimisation problems. Table 3 illustrates the assumed
predetermined weight constraints for industry superannuation fund balanced portfolios.
Table 3: Industry Superannuation Funds Asset Weight Parameters
Asset Class Minimum Weight Maximum Weight
Australian Equities 20% 40%
International Equities 10% 30%
Property 0% 20%
Australian Fixed 0% 20%
International Fixed 0% 15%
Cash 0% 15%
Alternatives 0% 25%
Source: Reddy et al. 2013
Industry superannuation fund asset allocation parameters appear to place high weighting on the equity
markets. The property allocation range is set as 0-20%. Previous overseas studies (Lee & Byrne 1995;
Stevenson 2000) have also examined the role of property within unconstrained and constrained mixed-asset
portfolios, with the upper limit to property set at 20% for constrained strategies. This research follows the
methodology to evaluate the optimal allocation to property and alternative asset classes within two-asset and
multi-asset unconstrained (Optimal – No Constraints model) and weight constrained (Optimal – Weight
Constrained) mean-variance models.

22nd
Annual PRRES Conference, Sunshine Coast, Queensland, Australia 17-20 January 2016 8
RESULTS AND DISCUSSION
Table 4 details the industry superannuation fund balanced investment option asset allocation trend, with
property allocation split into direct property and listed property components. The total return data for all
asset classes are displayed at different time intervals.
Table 4: Asset Total Return at Different Intervals – Quarterly Data, 1995 – 2015
Time Period Cash Aust
fixed
Int
fixed
Aust
eq
Int eq Direct
Prop
Listed
Prop
Altern'
ves
1995 - 2000
Mean Return 1.4% 2.5% 1.9% 3.1% 2.5% 2.4% 2.9% 3.8%
Standard Deviation 0.2% 2.5% 1.6% 4.9% 12.3% 0.3% 4.6% 3.9%
2001 - 2007
Mean Return 1.3% 1.5% 1.1% 3.5% 1.4% 3.2% 4.3% 4.0%
Standard Deviation 0.1% 1.8% 1.5% 5.9% 13.4% 0.8% 4.2% 3.4%
2008 - 2015
Mean Return 1.0% 1.7% 0.6% 0.7% 1.6% 2.0% -0.4% 1.4%
Standard Deviation 0.4% 2.3% 3.8% 8.5% 15.6% 2.1% 11.5% 3.2%
Sharpe Ratio (1995 -2015) -0.37 0.21 -0.08 0.15 0.07 0.80 0.08 0.43
Table 4 results demonstrate that there is significant variance in quarterly total returns for most asset classes at
different time intervals. The data display sharp fluctuations for the Australian equities, international equities,
and A-REITs markets. The returns for cash, direct property, and fixed assets (Australian and international
fixed), remained relatively stable. A-REITs recorded strong performance in 1995-2000, enjoying a ‘golden
era’ with increased investments in offshore properties and increased debt during 2001-2007, recording the
highest total return (4.3%). However, during 2007-2015 (the GFC/ post-GFC period), the sector declined to
its lowest point, recording the only negative mean return (-0.4%). Although direct property performance
lagged the A-REITS returns for most of the analysis period, it significantly outperformed the listed property
sector during 2007-2015.
The performance of the alternative asset class can be explained by the increase in allocation in recent years
to underlying alternatives sector assets – specifically infrastructure investments. On average, the allocation to
alternative assets within the industry superannuation fund portfolio has risen from 8% (prior to 2005) to 17%
in 2015, having peaked at 21% in March 2009. Over a period of 20 years (1995-2015), direct property has
significantly outperformed all other asset classes with a Sharpe ratio of 0.80. Alternatives recorded the
second highest Sharpe ratio (0.43) during this period.
The diversification benefits of direct property, listed property and alternative asset classes in the industry
fund balanced investment option can be attained by examining the correlation matrix. Table 5 and Table 6
assess the correlation between direct and listed property and other assets over different time periods. This
follows the Jones Lang LaSalle (2012) correlation reporting methodology for property assets. Each time
period involved a different number of data points. For example, 1-year represents four quarterly data points
in 2015, 2-year represents eight quarterly data points from 2010-2015, and 20-year represents 81 quarterly
data points from 1995-2015. To better evaluate the correlation of different property assets to the specific

22nd
Annual PRRES Conference, Sunshine Coast, Queensland, Australia 17-20 January 2016 9
alternative asset classes, alternative index assets are separated as infrastructure (Infr), hedge funds, private
equity, and commodity (C’dity).
Table 5: Correlation Matrix: Direct Property and Other Asset Classes at Different Intervals
Direct Property correlation to:
Time
Period
Cash Aust
fixed
Int
fixed
Aust eq Int eq Listed
Prop
Infr Hedge
Funds
Private
Equity*
C’dity
1-year -0.45 -0.34 0.80 -0.65 0.74 -0.33 -0.18 0.73 -0.85 0.33
2-year 0.13 -0.44 -0.64 -0.37 -0.47 -0.19 0.34 -0.59 0.45 0.51
3-year -0.29 -0.07 -0.22 -0.44 -0.41 -0.21 0.01 -0.45 0.45 -0.09
5-year 0.15 0.10 -0.06 -0.10 0.18 -0.01 0.11 0.14 0.08 -0.29
10-year 0.25 -0.05 -0.12 0.17 0.11 0.27 0.26 0.04 0.53 0.08
15-year 0.27 -0.03 -0.03 0.19 0.10 0.28 0.26 0.04 0.35 0.07
20-year 0.18 -0.04 -0.11 0.16 0.09 0.27 0.17 0.03 0.35 0.08
*Private Equity data are available from June 2000.
Table 6: Correlation Matrix – Listed Property and Other Asset Classes at Different Intervals
Listed Property correlation to:
Time
Period
Cash Aust
fixed
Int
fixed
Aust
eq
Int eq Direct
Prop
Infr. Hedge
Funds
Private
Equity*
C’dity
1-year 0.59 1.00 0.30 0.86 -0.09 -0.33 -0.69 -0.13 0.72 0.58
2-year 0.17 0.85 -0.06 0.32 -0.22 -0.19 -0.61 -0.16 0.16 -0.38
3-year 0.40 0.75 0.05 0.23 -0.24 -0.21 -0.44 -0.18 -0.14 -0.28
5-year -0.23 0.20 -0.23 0.48 0.29 -0.01 0.27 0.27 0.18 -0.32
10-year -0.23 -0.20 -0.46 0.71 0.42 0.27 0.55 0.16 0.51 -0.22
15-year -0.16 -0.13 -0.40 0.64 0.39 0.28 0.50 0.21 0.34 -0.23
20-year -0.10 0.01 -0.30 0.59 0.36 0.27 0.49 0.18 0.29 -0.21
*Private Equity data are available from June 2000.
Table 5 demonstrates that over the short-term (1-2 years), the correlation between direct property and listed
property is low (-0.33 and -0.19). This indicates strong diversification potential between the assets. In the
medium term (3-5 years) the correlation between direct and listed property ranges from -0.01 to -0.21, and
increases to 0.27 over the 20-year sample period. Direct property displays strong diversification potential
with most asset classes, including alternative assets such as infrastructure, hedge funds and commodities, in
both short-term and long-term horizons. Table 6 shows that listed property displayed strong diversification

22nd
Annual PRRES Conference, Sunshine Coast, Queensland, Australia 17-20 January 2016 10
benefits with cash, fixed income (Australian and international), and to some extent with commodities and
hedge funds, in the short and long-term horizon. The correlation between A-REITs and Australian equities
was high (> 0.60) in both the short-term and long-term, displaying potential lack of diversification benefit.
The research investigates the diversification benefits of property assets with Australian equities and
alternative assets by constructing two asset optimal portfolio models. The asset allocation is determined
using the mean-variance portfolio optimisation technique. Figure 2 displays the efficient frontier and optimal
allocation results for the two asset models, being Portfolio A (Direct Prop & Listed Prop), Portfolio B (Direct
Prop & Altern’ves), and Portfolio C (Listed Prop & Aust eq).
Figure 2: Efficient Frontier – Property and Alternative in Two Asset Portfolios
Table 7 details the performance statistics of the different two asset optimal portfolios. Table 6 illustrate that
including listed property in the direct property portfolio is insignificant, evident from the low risk-adjusted
return performance (0.29) in Portfolio A when compared to the direct property only portfolio (0.80).
However, including listed property in the direct property portfolio provides a much better performance
profile than including A-REITs in the Australian equities portfolio (0.15). Including alternative assets in the
direct property portfolio (Portfolio B) provides the best risk-adjusted return performance (0.56), although
portfolio weighting is dominated by direct property.
Table 7: Performance Statistics – Two Asset Portfolios
Portfolio Assets Mean Return Standard
Deviation
Sharpe Ratio
Portfolio A Direct Prop & Listed
Prop 2.40% 3.70% 0.29
Portfolio B Direct Prop & Altern'ves 2.79% 2.60% 0.56
Portfolio C Listed Prop & Aust eq 2.35% 6.68% 0.15
Overall, the results provide evidence that placing listed property in the equities portfolio is not a viable
investment option. However, including alternatives assets in the real estate portfolio seems beneficial. The

22nd
Annual PRRES Conference, Sunshine Coast, Queensland, Australia 17-20 January 2016 11
performance of different property assets needs to be tested further within the parameters of multi-asset
allocation models. Table 8 illustrates the quarterly performance of the multi-asset allocation strategies.
Table 8: Industry Fund Asset Allocation Strategies – Descriptive Statistics, Quarterly Performance
Data, 1995-2015
Asset Allocation Strategy Mean
Return
Standard
Deviation
Risk-
Adjusted
Return
Annualised
Return
Annualised
Standard
Deviation
Strategic (original portfolio) 2.15% 4.97% 0.17 8.90% 9.93%
Optimal – No Constraints 1.94% 2.98% 0.20 7.98% 5.96%
Optimal – Weight Constrained 2.15% 3.60% 0.23 8.88% 7.21%
Mean total returns for all asset allocation strategies were similar (around the low 2% mark). Both Optimal –
No Constraints and Optimal – Weight Constrained models recorded high risk-adjusted return profiles of 0.20
and 0.23 respectively. The alternative asset allocation strategies have outperformed the industry
superannuation fund Strategic investment option, which recorded a Sharpe ratio of 0.17. It is appreciated
that rebalancing the portfolio is not without costs. To increase the Sharpe ratio from 0.17 to 0.23 could
provide minimal gains due to added management and transactions costs.
Table 9 details the weightings for the selected asset classes within the different asset allocation models.
Table 9: Asset Allocation Components for Different Investment Strategies
Asset Allocation Strategies Aust
eq
Int eq Direct
Prop
Listed
Prop
Aust
fixed
Int
fixed
Cash Altern
'ves
Strategic (Original Portfolio) 31% 21% 5% 5% 13% 5% 8% 12%
Optimal – No Constraints 3% 7% 46% 2% 2% 3% 18% 19%
Optimal – Weight Constrained 24% 13% 16% 6% 13% 8% 10% 11%
Note: All other asset allocation models were updated on a quarterly basis.
The minimum and maximum allocation for different asset classes varies within each asset allocation strategy.
The highest level of allocation was to cash at 94% in the Optimal – No Constraints asset allocation strategy.
The other assets to attain more than 50% allocation at some point during the 20 year sample period were
alternatives (85%), property (75%), international equities (62%), international fixed (61%) and Australian
equities (52%). All asset classes recorded a minimum asset allocation of 0% at some point during the
analysis period, mainly in Optimal – No Constraints asset allocation strategy. The Optimal – No Constraints
strategy works on the premise of allocating most weighting to assets that display the lowest volatility in
performance.
The Optimal – Weight Constrained investment strategy demonstrates a 22% allocation to property (direct
property 16%; listed property 6%). Despite the higher asset allocation range assigned to alternative assets (0-
25%) than to property assets (0-20%), the allocation to alternatives was 11%, lower than the combined
property allocation (22%). The combined allocation to property and alternatives within the constrained
model was 33%. This can be compared to recent industry fund allocation to property and alternative assets in
APRA report (2015, p.21) of 27% (10% property, and 17% alternatives).
Recent studies (Finkenzeller, Dechant & Schäfers 2010; Newell & Lee 2011; Newell, Peng & De Francesco
2011) have concluded that property may play a less significant role in multi-asset portfolios when the
alternative assets, such as infrastructure, are included. However, the consensus was that both are distinct

22nd
Annual PRRES Conference, Sunshine Coast, Queensland, Australia 17-20 January 2016 12
assets and offer different diversification benefits. The strong allocation to direct property in both the two
assets and multi-asset portfolio in this research further highlights property’s significance in institutional
portfolios. Higher allocation to direct property has limitations, such as illiquidity, higher transaction costs,
availability of stocks and management fees. Lack of liquidity could act as a deterrent for higher allocation to
direct property. However, the continued evolution of unlisted property fund vehicles (such as wholesale
property funds and property syndicates) could provide the medium for increasing allocations to direct
property. These vehicles would allow fund managers to meet specific member investment and liquidity
requirements, alongside retaining some input into property allocation decisions
CONCLUSION
This research examined the role of property and alternative assets in the Australian industry superannuation
fund balanced investment option by constructing and critically evaluating two-asset and multi-asset
investment strategies. The analysis was undertaken for a 20 year timeframe (1995-2015) using ex-post
quarterly total return asset benchmark data, and the industry superannuation fund asset allocation data.
The performance analysis of the two-asset portfolio analysis provides evidence that including alternative
assets in the direct property portfolio provides better risk-adjusted return performance (0.56) than a portfolio
that combines direct property and listed property (0.29). Interestingly, none of these two portfolio models
could replicate the direct property only portfolio risk-adjusted return (0.80).
The key parameters from past market data (risk/return performance and correlation measures) provided the
platform for the analysis of the historical benchmark data for industry superannuation funds’ conventional
Strategic balanced portfolio. The alternative multi-asset investment strategies evaluated included Optimal –
No Constraints and Optimal – Weight Constrained models. The Optimal strategies seek the highest risk-
adjusted returns: a technique known in the field of MPT as Markowitz mean-variance portfolio optimisation.
The alternative asset allocation models outperformed the industry superannuation funds’ conventional
Strategic portfolio. The Optimal – Weight Constrained strategy recorded the highest Sharpe ratio (0.23),
followed by Optimal– No Constraints (0.20). Strategic portfolio had a high standard deviation (4.97%),
reflected in the relatively low risk-adjusted return profile rating (0.17).
The combined allocation to property and alternatives within the Optimal – No Constraints model was 67%
(48% property, and 19% alternatives). It is appreciated allocations of 50% to property within unconstrained
optimisation models may not be practicably justifiable for superannuation funds due to issues surrounding
property such as liquidity. However, including weight constraints, leads to a more industry practical
application of the mean-variance optimisation problem. The Optimal – Weight Constrained strategy
recommended allocation to property for industry funds is 22% (16% direct, and 6% listed). This compares to
the current industry fund property allocation of 10% (8% direct, and 2% listed). Interestingly, despite the
higher asset allocation range assigned to alternative assets (0-25%) than to property assets (0-20%), the
allocation to alternatives within the constrained strategy was 11%, lower than property (22%). This provides
concrete evidence that property will command a significant allocation in institutional portfolios despite the
availability of similar real assets such as infrastructure.
REFERENCES
Australian Prudential Regulation Authority 2015, Quarterly superannuation performance: June 2015,
APRA, Sydney.
Australian Trade Commission 2010, Alternative investments in Australia, Austrade Financial Services
Division, Canberra.
AXA Real Estate 2012, Property’s place in a mixed-asset portfolio, AXA Investment Management
Company, United Kingdom.
Bacon, C 2008, Practical portfolio performance measurement and attribution, 2nd edn, John Wiley & Sons
Ltd Inc, England.
Baum, A & Hartzell, D 2012, Global property investment: strategies, structures, decisions, Wiley-
Blackwell, United Kingdom.
Bond, SA Hwang, S, Mitchell, P & Satchell, SS 2007a, Asset allocation in the modern world, Investment
Property Forum, London.

22nd
Annual PRRES Conference, Sunshine Coast, Queensland, Australia 17-20 January 2016 13
Bond, SA, Hwang, S, Mitchell, P & Satchell, SS 2007b, ‘Will private equity and hedge funds replace real
estate in mixed-asset portfolios? Not likely’, The Journal of Portfolio Management, September edn,
pp. 74-85.
Brown, GR & Schuck, EJ 1996, ‘Optimal portfolio allocations to real estate’, The Journal of Real Estate
Portfolio Management, vol. 2, no. 1, pp. 63-73.
Colonial First State Global Asset Management 2009, Evaluating infrastructure from a property perspective:
the case for a diversified real asset allocation, CFS Research Series, November edn, CFS, Sydney.
Craft, TM 2001, ‘The role of private and public real estate in pension plan portfolio allocation choices’,
Journal of Real Estate Portfolio Management, vol. 7, no. 1, pp. 17-23.
Day, AL 2001, Mastering financial modelling in Microsoft®
Excel: a practitioner’s guide to applied
corporate finance, 2nd edn, Pearson Education Limited, Prentice Hall, Great Britain.
Finkenzeller, K, Dechant, T & Schäfers, W 2010, ‘Infrastructure: a new dimension of real estate? An asset
allocation analysis’, Journal of Property Investment and Finance, vol. 28, no. 4, pp.263-274.
Hoesli, M, Lekander, J & Witkiewicz, W 2003, International evidence on real estate as a portfolio
diversifier, International Center for Financial Asset Management and Engineering, Geneva.
Jones Lang LaSalle, 2012, Real assets and the Asia Pacific, Jones Lang LaSalle Global, Sydney.
JP Morgan Asset Management 2012, The realization: a new world - a new normal – a tectonic shift, JP
Morgan Chase & Co, United States.
Lee, S & Byrne, P 1995, ‘Is there a place for property in the multi-asset portfolio?’, Journal of Property
Investment & Finance, vol. 6, no. 3, pp. 60-83.
Markowitz, H 1952, ‘Portfolio selection’, The Journal of Finance, vol. 7, no. 1, pp. 77-91.
Newell, G & Lee, CL 2011, ‘The impact of alternative assets on the role of direct property in Australian
mixed-asset portfolios’, Pacific Rim Property Research Journal, vol. 17, no. 4, pp. 531-559.
Newell, G, Peng, HW & De Francesco, A 2011, ‘The performance of unlisted infrastructure in investment
portfolios’, Journal of Property Research, vol. 28, no. 1, pp. 59-74.
Newell, G, Chau, KW & Wong, SK 2009, ‘The significance and performance of infrastructure in China’,
Journal of Property Investment & Finance, vol. 27, no. 2, pp. 180-202.
Newell, G 2008, ‘The significance of property in superannuation funds’, Australian and New Zealand
Property Journal, vol. 1, no. 8, pp. 670-677.
Newell, G & Peng, HW 2008a, ‘Assessing the significance of motivating factors and risk factors in
infrastructure funds management’, Pacific Rim Property Research Journal, vol. 14, no. 3, pp. 399-
411.
Newell, G & Peng, HW 2008b, ‘The role of US infrastructure in investment portfolios’, Journal of Real
Estate Portfolio Management, vol. 14, no. 1, pp. 21-33.
Peng, HW & Newell, G 2007, ‘The significance of infrastructure in Australian investment portfolios’,
Pacific Rim Property Research Journal, vol. 13, no. 4, pp. 423-450.
Rainmaker Group 2012, Australian superannuation industry asset class weights: June 1995-December 2011
(data file), Rainmaker Group, Sydney.
Reddy, W, Higgins, D, Wist, M & Garimort, J 2013, ‘Australian industry superannuation funds: investment
strategies and property allocation’, Journal of Property Investment & Finance, vol. 31, no. 5, pp. 462-
480.
RREEF 2005, Understanding infrastructure, RREEF Real Estate Research America, New York.
Stevenson, S 2000, ‘Constructing optimal portfolios and the effect on real estate’s allocation’, Journal of
Property Investment & Finance, vol. 18, no. 4, pp. 488-506.
Worzala, EM & Bajtelsmit, VL 1997, ‘Real estate asset allocation and the Decisionmaking framework used
by pension fund managers’, Journal of Real Estate Portfolio Management, vol. 3, no. 1, pp. 47-56.
Email contact: [email protected]