read.pudn.comread.pudn.com/downloads208/doc/978592/Driving... · Web viewForm ISO 9001...
142
IQ – DRIVING BREAKTHROUGH IMPROVEMENTS Page 1 of 142
Transcript of read.pudn.comread.pudn.com/downloads208/doc/978592/Driving... · Web viewForm ISO 9001...

IQ – DRIVING
BREAKTHROUGH IMPROVEMENTS
STUDY MATERIAL
Page 1 of 102

Date Version Comments
1 Quality Management......................................................................................................................3
2 Capability Maturity Model (Integrated)......................................................................................42.1 Introduction to CMM....................................................................................................................42.2 Evolution of CMMI........................................................................................................................52.3 CMMI Representation...................................................................................................................52.4 Process Maturity Levels.................................................................................................................62.5 Level 1 – Initial Level.....................................................................................................................72.6 Level 2 Managed...........................................................................................................................72.7 Level 3 Defined...........................................................................................................................102.8 Level 4 Quantitatively Managed...............................................................................................132.9 Level 5 Optimizing.....................................................................................................................142.10 Summary.......................................................................................................................................152.11 CMMI @ Zymcwj........................................................................................................................162.12 Updates in CMMI version 1.2.....................................................................................................162.13 Introduction to SCAMPI v1.2.....................................................................................................16
3 Malcolm Baldrige National Quality Award (MBNQA)............................................................183.1 What is MBNQA?........................................................................................................................183.2 Overview and Global Appeal......................................................................................................183.3 Past Winners.................................................................................................................................193.4 Core Values of High Performing Organizations.......................................................................193.5 The MBNQA Criteria for Performance Excellence..................................................................203.6 Key Characteristics of the Criteria.............................................................................................213.7 The Performance Excellence Framework..................................................................................213.8 Assessment Process......................................................................................................................233.9 Scoring System..............................................................................................................................243.10 MBNQA @ Zymcwj.....................................................................................................................263.11 Glossary and References..............................................................................................................27
4 Information Technology Infrastructure Library (ITIL)..........................................................284.1 Overview of ITIL..........................................................................................................................284.2 IT Service Management: Service Support.................................................................................284.3 IT Service Management: Service Delivery.................................................................................304.4 IT Service Management standards ISO/IEC 20000..................................................................324.5 Terminology / References............................................................................................................334.6 References.....................................................................................................................................34
5 ISO 9001:2000...............................................................................................................................355.1 Introduction..................................................................................................................................35
Page 2 of 102

5.2 History of ISO 9000 Series...........................................................................................................355.3 What is ISO 9001..........................................................................................................................355.4 Benefits of ISO 9001.....................................................................................................................365.5 Typical ISO 9001 journey............................................................................................................365.6 Description of requirements ISO 9001:2000..............................................................................375.7 Audits.............................................................................................................................................385.8 Other Related Models..................................................................................................................395.9 References.....................................................................................................................................40
6 PROCESS MANAGEMENT......................................................................................................416.1 What is Process and Process Management................................................................................416.2 Why Process..................................................................................................................................416.3 Process Owner..............................................................................................................................426.4 Process work bench......................................................................................................................436.5 The Process Change Management Process................................................................................46
7 Continuous Process Improvement..............................................................................................487.1 Introduction..................................................................................................................................487.2 Why improve a process?..............................................................................................................497.3 Continuous or Continual Improvement?...................................................................................497.4 Incremental and Breakthrough improvement..........................................................................49
8 Structured Process Improvement Methods...............................................................................508.1 Process Improvement/Life Cycle – PDCA.................................................................................518.2 Total Quality Management.........................................................................................................558.3 Japanese Methods........................................................................................................................578.4 Six Sigma.......................................................................................................................................59
9 Metrics and Measurement...........................................................................................................639.1 Measure and Metric.....................................................................................................................639.2 Objective and Subjective Measures............................................................................................639.3 Levels of Measures.......................................................................................................................649.4 Attributes of a good measure......................................................................................................649.5 Types of Software Metrics...........................................................................................................659.6 Organizational view of Metrics...................................................................................................699.7 Understanding Variation.............................................................................................................719.8 Results...........................................................................................................................................73
10 Quality Tools...............................................................................................................................7410.1 7 QC tools......................................................................................................................................7410.2 Creative or Idea generation Tools..............................................................................................8010.3 Tools for presentation..................................................................................................................81
11 Statistical Methods.....................................................................................................................8311.1 Basic statistics...............................................................................................................................8311.2 Hypothesis testing.........................................................................................................................8511.3 Correlation and Regression Analysis.........................................................................................8611.4 Design of Experiment and Analysis............................................................................................8911.5 SPC – control charts....................................................................................................................8911.6 Quality function deployment.......................................................................................................9211.7 Balanced scorecard......................................................................................................................9311.8 Benchmarking...............................................................................................................................93
Page 3 of 102

1 Quality Management
As discussed earlier in this material, quality evolved as a subject in the first half of the twentieth century. The challenges faced by the industry in that phase of history were very different from what we face now. In this early phase of quality, the need of the hour was to control quality – by using standards. These standards gradually evolved into internationally accepted standards for quality inspection, control, and finally assurance. As the subject of quality evolved and organizations became more complex there arose a need for models to understand and implement quality in an organizational context. With time standards and models evolved and multiplied.
The management landscape is today flooded with quality models, tools, and techniques with all promising same or similar results. In this scenario a quality professional will help him/herself by being adequately aware of the basics of these models, tools and techniques. This knowledge will help the quality professional to decide which tool to apply in what situation and how to apply the same. This section will help you with a basic knowledge of popular quality models, tools, and techniques.
The first topic in this section will focus on the key models that drive a quality program in an organization. The models discussed under this topic are:
CMMi: The software development process is key to the success of an IT Services organization. The most widely followed model for this process is the Software Engineering Institute’s Capability Maturity Model.
ISO 9001: The new version of this widely accepted quality standard is based on a process model and embraces improvement.
MBNQA: The Malcolm Baldrige National Quality Award is the most comprehensive model available for managing and assessing an organization using sound quality management principles.
ITIL: The Information Technology Infrastructure Library provides a comprehensive, consistent and coherent set of best practices for IT Service Management processes, promoting a quality approach to achieving business effectiveness and efficiency in the use of information systems.
The next topic explains the need for continual process improvement and the key approaches used for the same. Key topics discussed here are:
Continuous process improvement Structured models for improvement including PDCA, Juran’s approach, Six Sigma etc. Quality tools: 7 Basic quality tools, 7 Planning tools, and other useful tools. Other quality techniques: Benchmarking, Balanced Scorecard, Reengineering etc…
A quality professional is primarily managing processes. Knowledge of the key aspects of process management is key to his/her success. This topic will address these key aspects.
Ever since the subject of quality gained focus, a key aspect of the quality professional’s trade has been his/her knowledge of working with metrics. In this section we will address the need for metrics, types of metrics, software metrics, and managing a metrics program.
Finally, when using quality models, standards, methods, metrics, and tools, please remember:
Just because you have a hammer in hand, everything is not a nail
Page 4 of 102

2 Capability Maturity Model (Integrated)
2.1 Introduction to CMMIn the 1930s, Walter Shewhart began work in process improvement with his principles of statistical quality control. These principles were refined by W. Edwards Deming and Joseph Juran. Watts Humphrey, Ron Radice, and others extended these principles even further and began applying them to software in their work at IBM and the SEI.
In its research to help organizations develop and maintain quality products and services, the Software Engineering Institute (SEI) has found several dimensions that an organization can focus on to improve its business.
The SEI has taken the process-management premise, "the quality of a system or product is highly influenced by the quality of the process used to develop and maintain it," and defined capability maturity models (CMM) that embody this premise.
Capability maturity models focus on improving processes in an organization. They contain the essential elements of effective processes for one or more disciplines and describe an evolutionary improvement path from ad hoc, immature processes to disciplined, mature processes with improved quality and effectiveness.
Why CMMI
In the current marketplace, companies want to deliver products faster and better and cheaper. All the same, the products that are being built are becoming more complex by the day.
Page 5 of 102

The current trend is that components are built in-house and some are acquired; then all the components are integrated into the final product. Organizations should be able to manage and control this complex product development and maintenance process.The problems that these organizations face today involve both software and systems engineering. Today, there are maturity models, standards, methodologies and guidelines that can help an organization to improve its business. However, most available improvement approaches focus on a specific part of the business and do not take a systemic approach to the problems that most organizations are facing.In that order, CMMI (Capability Maturity Model) provides best practices that address product development and maintenance. It addresses practices that cover the product’s life cycle from conception to delivery and maintenance. There is an emphasis on both systems engineering and software engineering and the integration necessary to build and maintain the total product
CMMI helps the organization to achieve the business objectives like, Produce quality products or services Create value for the stockholders Be an employer of choice Enhance customer satisfaction Increase market share Implement cost savings and best practices Gain an industry-wide recognition for excellence
2.2 Evolution of CMMISince 1991, CMM have been developed for a myriad of disciplines. Some of the most notable include models for systems engineering, software engineering, software acquisition, workforce management and development, and integrated product and process development (IPPD). Although these models have proved useful to many organizations, the use of multiple models has been problematic and was costly in terms of training, appraisals and improvement activities.
The CMM IntegrationSM project was formed to sort out the problem of using multiple CMM. The CMMI Product Team's mission was to combine three source models:
The Capability Maturity Model for Software (SW-CMM) v2.0 draft C [SEI 1997b] The Systems Engineering Capability Model1 (SECM) [EIA 1998] The Integrated Product Development Capability Maturity Model (IPD-CMM) v 0.98 [SEI
1997a] talk
The combination of these models into a single improvement framework was intended for use by organizations in their pursuit of enterprise-wide process improvement. CMMI is a result of the evolution of the SW-CMM, the SECM, and the IPD-CMM. Latest version of CMMI is V1.2 which is released in Aug-2006.
2.3 CMMI RepresentationThere are two types of CMMI model representations: staged and continuous.
The staged representation is the approach used in the Software CMM. It is an approach that uses predefined sets of process areas to define an improvement path for an organization. This improvement path is described by a model component called a maturity level. A maturity level is a well-defined evolutionary plateau toward achieving improved organizational processes. Each of the process areas associated with the maturity level has specific and generic goals associated with it for it to satisfy.
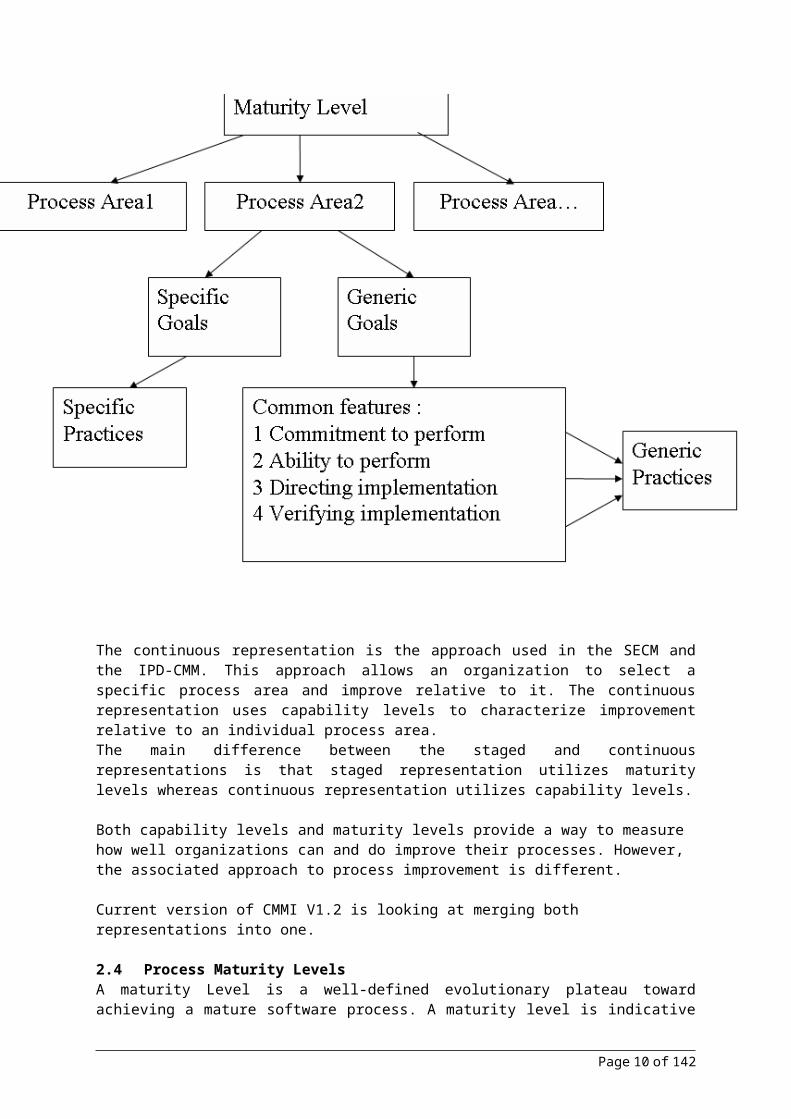
Staged Model Structure
Page 6 of 102

The continuous representation is the approach used in the SECM and the IPD-CMM. This approach allows an organization to select a specific process area and improve relative to it. The continuous representation uses capability levels to characterize improvement relative to an individual process area.The main difference between the staged and continuous representations is that staged representation utilizes maturity levels whereas continuous representation utilizes capability levels.
Both capability levels and maturity levels provide a way to measure how well organizations can and do improve their processes. However, the associated approach to process improvement is different.
Current version of CMMI V1.2 is looking at merging both representations into one.
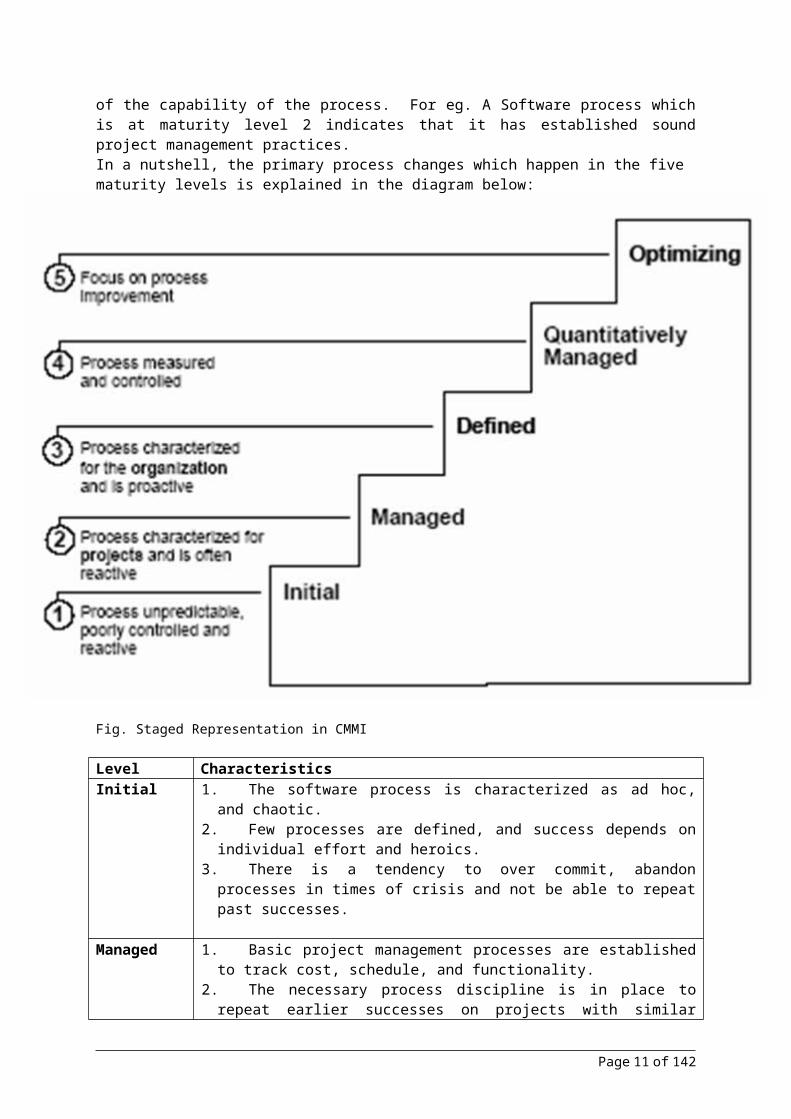
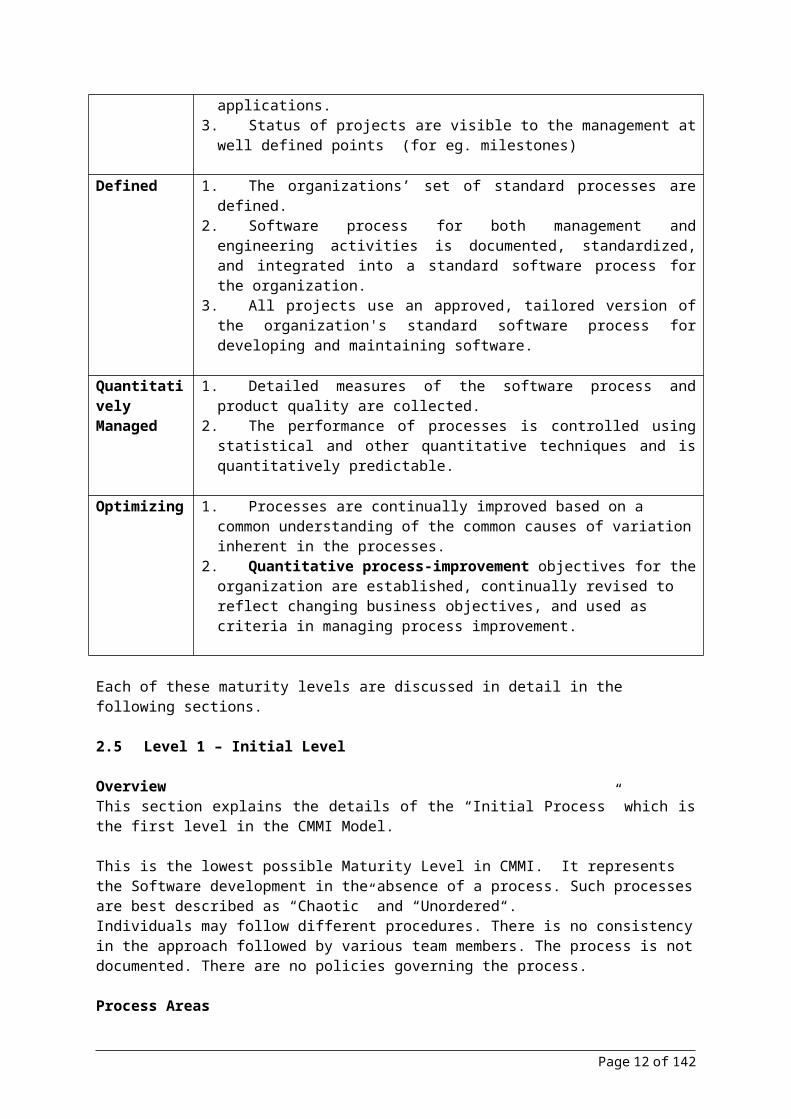
2.4 Process Maturity LevelsA maturity Level is a well-defined evolutionary plateau toward achieving a mature software process. A maturity level is indicative of the capability of the process. For eg. A Software process which is at maturity level 2 indicates that it has established sound project management practices.In a nutshell, the primary process changes which happen in the five maturity levels is explained in the diagram below:
Page 7 of 102

Fig. Staged Representation in CMMI
Level CharacteristicsInitial 1. The software process is characterized as ad hoc, and chaotic.
2. Few processes are defined, and success depends on individual effort and heroics.3. There is a tendency to over commit, abandon processes in times of crisis and not
be able to repeat past successes.
Managed 1. Basic project management processes are established to track cost, schedule, and functionality.
2. The necessary process discipline is in place to repeat earlier successes on projects with similar applications.
3. Status of projects are visible to the management at well defined points (for eg. milestones)
Defined 1. The organizations’ set of standard processes are defined.2. Software process for both management and engineering activities is documented,
standardized, and integrated into a standard software process for the organization.3. All projects use an approved, tailored version of the organization's standard
software process for developing and maintaining software.
Quantitatively Managed
1. Detailed measures of the software process and product quality are collected. 2. The performance of processes is controlled using statistical and other quantitative
techniques and is quantitatively predictable.
Page 8 of 102

Optimizing 1. Processes are continually improved based on a common understanding of the common causes of variation inherent in the processes.
2. Quantitative process-improvement objectives for the organization are established, continually revised to reflect changing business objectives, and used as criteria in managing process improvement.
Each of these maturity levels are discussed in detail in the following sections.
2.5 Level 1 – Initial Level
OverviewThis section explains the details of the “Initial Process” which is the first level in the CMMI Model.
This is the lowest possible Maturity Level in CMMI. It represents the Software development in the absence of a process. Such processes are best described as “Chaotic” and “Unordered“.Individuals may follow different procedures. There is no consistency in the approach followed by various team members. The process is not documented. There are no policies governing the process.
Process AreasSince this is an ad-hoc and unpredictable process, there is no specific process area defined for systems operating at Level 1 Maturity.
2.6 Level 2 Managed
OverviewThis level of CMMI which is also called Managed is the first level where in some basic discipline in executing the project is put in place by having basic project management practices. Project success does not solely depend on individual heroes but on the team effort and the process established. Level 2 projects will have repeatability and will be able to meet client expectations.
There are 7 Process areas associated with this CMMI level. The details of this process area are described below.
Process Areas
1. Requirements ManagementThe purpose of requirement change management is to manage technical and non-technical requirements (e.g user trainings, User Manuals etc) of the project based on client needs. This process area ensures that the requirements are clearly documented, understood and commitment on the requirements from the client is obtained through sign off and acceptance criteria.
Any changes to the signed off requirements are managed by a change management procedure by maintaining the history of changes and the impact on cost and schedule and communicated to the client and relevant stake holders. All the documents and the source code which gets impacted by this change will undergo revision.
Traceability is established from the business requirements to the lower stages of life cycles like design coding and testing to ensure all the requirements have been implemented and tested. This will also be used during change requirements to do impact analysis of the change.
Typical Outputs: Acceptance criteria between vendor and the client on the basis on which product will be
accepted
Page 9 of 102
Requirements sign off from the client Requirement change tracker Bi directional Traceability Matrix
2. Project PlanningThe purpose of the project planning is establishing a plan to define project activities. This process area deals with project planning activities involved in a project. Project estimation is done using established guidelines. A project plan is created which documents the overall life cycle stages involved and the process followed. A detailed WBS to track the project is prepared and milestone check points are identified. Resources allocation is done based on the skills and an appropriate training plan is in place based on project needs.
Typical Outputs: Estimation document Detailed Schedule with WBS structure Project plan documented Risk mgmt plan
3. Project Monitoring and ControlThe purpose of project monitoring and control is to provide an understanding of the project’s progress so that appropriate corrective actions can be taken when the project performance deviates significantly from the plan. Project schedule is tracked and monitored closely for any deviations. Milestone analysis is done to check the project performance with respect to estimated values for parameters like cost, effort and schedule. Deviations are analyzed and corrective actions are taken based on the analysis to bring the project under control. Project status communicated to relevant stake holders.
Typical Outputs: Project Schedule Issue tracker Status reports Milestone analysis reports Risk Management Plan
4. Supplier Agreement ManagementThe purpose of the supplier agreement management is to manage the acquisition of the products from supplier. This primarily applies to the acquisition of products and components which are delivered to the customer as part of the project. E.g. external vendor tools, off the shelf components, design re-use etc.
Suppliers are selected based on evaluation on the requirements using techniques like DAR. A formal agreement is made on price, contractual, specification and licensing details.
Typical Outputs: SAM document DAR document
5. Measurement and AnalysisThe purpose of measurement and analysis process area is to develop and sustain a measurement process. This will help in objective planning and estimates and also to track the performance against planned values. Metrics like effort, defects, size, schedule that need to capture at project level are arrived at based on project commitments and these are tracked and analyzed.
Typical Outputs: Effort captured at task level granular details for request level for maintenance projects or
module level for development/re-engineering projects
Page 10 of 102
Defects and reviews captured in defect tracking system Size trackers SLA trackers Analysis deviation reports.
6. Process and Product Quality AssuranceThe purpose of this process area is to evaluate the processes followed in the project and provide feedback to the project and management on the quality assurance activities.Projects are audited by the quality assurance team periodically based on the process defined by the project. Any non-compliance in the process is communicated to the project team and the management. The non-compliance issues are tracked to closure.
Typical Outputs: Projects audited periodically for process compliance Project Audit reports Review reports PQM reports Testing reports
7. Configuration ManagementThe purpose of this process area is to identify the configuration management plan for the work products in the project to maintain versions, control changes and maintain baselines. Configuration management plan is documented with the process that need to be followed and CM tools like VSS, Endeavour, PVCS, Clear case are used to maintain the work products for version control and change controls. Access permissions are clearly defined in the CM plan so that integrity is maintained. CM audits are conducted at periodic intervals to verify the process adherence and the non-compliance issues are identified and tracked to closure.
Typical Outputs: CM plan prepared and baselined. CM audits conducted Configuration Management plan CM audit reports Change request tracker
SummaryIn Level 2 projects are managed using project management practices and are able to meet client expectations. Following process areas need to be complied to achieve CMMI level 2:
Requirements Management Project planning Project Monitoring and Control Supplier agreement management Measurement and Analysis Process and product quality assurance Configuration management
2.7 Level 3 Defined
OverviewThis level of CMMI called Defined. In this level, standard processes are defined at the organization level. Individual projects define their own standards by tailoring the guidelines provided by the organization.
Page 11 of 102
There are 13 Process areas associated with this CMMI level. The details of this process area are described below.
Process Areas
8. Requirements Development The purpose of this process area is to produce and analyze the customer requirements, and product requirements. Requirements are analyzed using relevant requirement checklists and documented using formal methods like prototype, Usecases etc.
Typical Outputs: Meeting with the users for analyzing and understanding requirements. Requirement elicitation checklist Requirement document
9. Technical SolutionThe purpose of this process area is to design, develop and implement solutions as per requirements. The focus is on evaluating and selecting solutions (design approaches), developing detailed designs (Program Specifications) and implementing the design.
Typical Outputs: Design documents Code as per the design Design and coding guidelines Design and coding checklists
10. Product IntegrationThe purpose of Product Integration is to assemble the product from the product components, ensure that the product, as integrated, functions properly and deliver the product.
Typical Outputs: Assembling the independent components as per the defined Integration Sequence and packaging
the same Integration test plan and results Integration test strategy
11. VerificationThe purpose of this Process Area is to ensure that all the work products meet their specified requirements. Design code and other artifacts are reviewed and tested to ensure that they are meeting the specified required.
Typical Outputs: Reviewed or verified Design Reviewed or verified Code Reviewed or verified Test Plans
12. ValidationThe purpose of Validation is to demonstrate that a product or product component fulfills its intended use when placed in its intended environment. Validation ensures that the product that is built fulfils its intended objective.
Typical Outputs: Corrected versions of design, code and test plans after the testing process Application tested in UAT environment UAT test plan
Page 12 of 102
Test results
13. Organizational Process FocusThe purpose of Organizational Process Focus is to plan and implement the organizational process improvement based on a thorough understanding of the current strengths and weaknesses of the current set of processes.
Typical Outputs: Improved Process Activities Enriched Organizational Process Assets
14. Organizational Process DefinitionThe purpose of this process area is to create define and maintain standard processes in the organization. Different life cycle processes like Development, Maintenance, Testing processes etc are defined at the organization level. There are tailoring guidelines and tailoring criteria available to tailor the process according to the project needs. There is an organization wide repository of artifacts like process assets for reference.
Typical Outputs: Different processes defined at organization level (e.g QSD, PRIDE) Process assets which is collection of artifacts from different projects in the organization
15. Organizational TrainingThe purpose of this process area is to develop the skills and knowledge of the people so that they can perform their roles effectively and efficiently. Training needs for all the employees in the organization in different areas like technical, domain, process, behavioral etc is identified, planned and is being tracked. The effectiveness of training is measured by feedback from the training sessions provided. These trainings can be classroom, web based, self study material or on-job training.
Typical Outputs: Organization wide training system to track the trainings of employees (e.g. ILITE system) Training records Training feedback reports
16. Integrated Project Management (IPPD)The purpose of this process area is to manage the project and the relevant stakeholder involvement using an integrated and defined process that is tailored from organizational set of standard processes. The integrated process ensures there is shared vision between the stake holders and different teams involved in the project in meeting the project objectives. There is an integrated plan available to manage different teams involved in the project (e.g. Domain group, Testing group, Architecture team, Interfaces etc.) and shared vision and team dynamics are established by having team building exercises. Relevant stakeholders are updated with the project status periodically to rule out any dependencies.
Typical Outputs: MOM involving relevant stakeholders Integrated project plan for different teams in the project
17. Risk managementThe purpose of this process area is to identify potential problems before they occur so that risk handling activities may be planned as needed to mitigate adverse impacts in meeting the project objectives. Project risks, both internal and external risks are identified from different sources like Risk database from previous projects, contractual agreements, Client relation ships. These risks are categorized into different categories like Process/People/Client. Each of these risks is being analyzed for the parameters like probability, impact and is being prioritized and mitigation plan is defined. For
Page 13 of 102

critical risks the cost associated with the risk will be calculated. For the risks which cannot be mitigated there will be a contingency plan defined. The risk management plan is periodically reviewed and modified depending on the changes in the project.
Typical Outputs: Risk management plan
18. Integrated TeamingThe purpose of integrated teaming is to form and sustain an integrated team for the development of work products. An integrated team consists of people skilled in the functions that need to be performed to develop required work products and they understand their role in the structure of the teams in the overall project. There are representatives assigned for each of the projects/tracks who will empower for decision making authority.
Typical Outputs: Team structure with clearly defined roles and responsibilities Roles and Responsibility Matrix Tasks defined at each of the track/team level
19. Organizational Environment for IntegrationThe purpose of this process area is to provide infrastructure for implementing the integrated project management and manage people for integration. There will be organizational policies which will support different teams (e.g. Technical, domain, Support groups) to work collaboratively. Organization provides workspace that provides resources to maximize their potential. Organization has reward and recognition policies for individuals and teams to motivate them.
The 3 process areas integrated project management, Integrated teaming and Organization environment for Integration are interrelated and talk about integrated working of the teams. The only difference being Organizational environment for integration caters to the requirements at organizational level completely.
Typical Outputs: Reward & Recognition policies Organizational training programs
20. Decision Analysis and ResolutionThe Purpose of this process area is to make decisions using a structured approach that evaluates identified alternatives against established criteria. Typical applicability of this would be when critical decisions on architecture or tools usage or design alternatives are planned in the project where in we have more than one alternative in hand. Projects use a structured approach to evaluate different alternatives in hand to come up with the best approach based on the evaluation criteria. A structured approach reduces the subjectivity and increases the probability selecting a best possible solution.
Below are some of the techniques that can be used Weighed average method Cost Benefit Analysis AHP (Analytical Hierarchy Process) Delphi Surveys QFD
Typical Outputs: DAR document Evaluation criteria Evaluation of different options available
Page 14 of 102

SummaryIn Level 3 Organization has defined processes established and maintained. All the projects inherent the process from the organization by doing a tailoring based on project needs. Organizational wide training system is planned to plan and track the training activities. Integrated environment for project management and teaming is established. More focus on engineering activities like Requirement development, Technical solution and processes that need to follow for Verification and Validation are defined.
Following Process areas need to complied to for achieving Level 3
Requirement Development Technical Solution Verification Validation Product Integration Organizational Process focus Organization process Definition Organizational Training Risk Management Integrated project management Integrated Teaming Organizational environment for integration Decision analysis and resolution
2.8 Level 4 Quantitatively Managed
OverviewA quantitatively managed process is a defined process that is controlled using statistical and other quantitative techniques. The purpose of Quantitatively Managed level is to control the process performance of the project quantitatively.
There are 2 Process Areas associated with this CMMI level. The details of this process area are described below.
Process Areas
21. Organizational Process Performance The purpose of Organizational Process Performance is to establish and maintain a quantitative understanding of the performance of the organization’s set of standard processes and to provide the process performance data, baselines, and models to quantitatively manage the organization’s projects.
Typical Outputs: Process capability Baseline – Organizational wide capability metrics for different methodologies
based on past projects performance
Process performance models – Models used to represent past and current process performance and to predict future results of the process
22. Quantitative Project ManagementThe purpose of the Quantitative Project Management process area is to quantitatively manage the project’s defined process to achieve the project goals. Sub processes are measured using control charts to know the stability of the process. Quantitative analysis of data is done to check the performance of the project and corrective actions taken.
Page 15 of 102
Typical Outputs: Trend analysis charts Control charts Quantitative analysis of project performance e.g Milestone reports with quantitative data
2.9 Level 5 Optimizing
OverviewAn optimizing process is a quantitatively managed process that is adapted to meet current and projected business objectives. Maturity level 5 focuses on continually improving process performance through both incremental and innovative technological improvements. There are 2 Process Areas associated with this CMMI level. The details of this process area are described below.
Process Areas
23. Causal Analysis and ResolutionThe purpose of Causal Analysis and Resolution (CAR) is to identify causes of defects and other problems and take action to prevent them from occurring in the future.
Problems/Defects are analyzed periodically based on most significant causes using tools like Pareto; C-E and Brainstorming and action plan is identified. Improvement activities are tracked for quantitative benefits.A separate team identified for the defect/problem analysis which will implement the same.
Typical Outputs: Periodic Defect prevention and problem prevention analysis Causal analysis reports Improvement Action plan.
24. Organizational Innovation and Deployment The purpose of Organizational Innovation and Deployment (OID) is to select and deploy incremental and innovative improvements that measurably improve the organization’s processes and technologies. The improvements support the organization’s quality and process performance objectives as derived from the organization’s business objectives. Based on the organization performance quantitative goals are set to improve the processes.
Typical Outputs: New tools deployed in the project New processes or model deployment Quantitative goals set
2.10 SummaryThe below table summarizes the characteristics of different levels in CMMI.
Level1 Level2 Level 3 Level 4 Level5 Processes are
usually adhoc and chaotic
No stable environment
Depends on heroes
Requirements are managed
Processes are planned, monitored and controlled
Status of the projects is visible to Sr. mgmt
Process is
Organizational set of standards are established
Processes are consistent across organization
Standards Procedures available
Quantitative project management
Sub processes are controlled statistically
Process is predictable
Continuous improvement
Quantitative goals for improvement
Processes are optimizing
Page 16 of 102

managed
Page 17 of 102
2.11 CMMI @ ZymcwjZymcwj has integrated CMMI model into its processes along with other models. Each project is evaluated on the CMMI framework and a project level rating is assigned notifying the gaps if any for higher levels. Tools like IPM/IPM+ are used for managing projects .DART, RADAR tools are used to measure effort and defects. ILITE system is used to plan and track the training requirements of people. All processes are defined at the organization level in PRIDE. Process capability baseline is established periodically from the submitted closure analysis reports from projects.
Six sigma techniques are applied to statistically analyze the data and plan for improvements. There are groups like Tools group, Re-use and other process groups at organization level which are formed to improve the organization wide process and bring out innovation.
2.12 Updates in CMMI version 1.2CMMI Version 1.1 incorporated improvements guided by feedback from early use, more than 1,500 change requests submitted as part of the public review, and hundreds of comments as part of the change control process. CMMI version 1.2 was developed using input from nearly 2,000 change requests submitted by CMMI users. More than 750 of those requests were directed at CMMI model content.
The model was changed mainly
To reduce complexity and sizeo Eliminated advanced practices and common featureso Eliminated the supplier sourcing additiono Incorporated integrated supplier management (ISM) into Supplier agreement
management (SAM)o Consolidated and simplified the IPPD materialo Glossary of the model improvedo Adopted a single book approach. Now both representations staged and continuous in
one document. Users can choose to use Representation specific content (staged , continuous) Addition-specific content (i.e. IPPD) Amplifications (hardware engineering, software engineering, systems
engineering) Expand Model coverage
o Added hardware amplificationso Added 2 work environment specific practices – one in organizational process
definition(OPD) and one in Integrated project management (IPM)o Updated notes and Examples to address service development and acquisitiono Updated the model name to CMMI for development (CMMI-DEV) to reflect the new
CMMI architecture Other Significant Model changes
o Improved the quality of overview sectiono Added information about generic practices are usedo Guidelines for “Not applicable” process areas clarifiedo Added emphasis on project start up in OPF and IPMo Added GP Elaborations for GP3.2o Moved generic goals and practices to Part Twoo Explained how process areas support the implementation of GPs.
SCAMPI Appraisal method has been improved for CMMI V1.2 to SCAMPI V1.2. Now the validity of appraisal process is only for 3 years.
Page 18 of 102

2.13 Introduction to SCAMPI v1.2The Standard CMMI Appraisal Method for Process Improvement (SCAMPI) is a method to benchmark an organization’s maturity based on CMMI. Ratings from this appraisal can be used to showcase an organization’s maturity to the outer world. The same will help the organizations for their marketing purpose as well as to meet their client’s needs and contracts.
The appraisal method has 3 classes, A, B and C. SCAMPI Class A method is used for benchmarking. It enables an organization to: gain insight into its capability by identifying the strengths and weaknesses of its current processes relate these strengths and weaknesses to the CMMI reference model(s) prioritize improvement plans focus on improvements (correct weaknesses that generate risks) that are most beneficial to them,
given its current level of organizational maturity or process capabilities derive their capability level ratings as well as a maturity level rating identify development/acquisition risks relative to capability/maturity determination
SCAMPI Class B and C are CMMI appraisal methods that provide information about an organization but that use fewer resources, smaller teams, and less evidence than SCAMPI Class A. These methods are applicable to plan a process improvement approach and to analyze instances of processes in place in an organization.
SCAMPI V1.2 is an appraisal method for CMMI V1.2. One of the key changes in this version is that appraisal period validity is for 3 years only.
Page 19 of 102
3 Malcolm Baldrige National Quality Award (MBNQA)
3.1 What is MBNQA?The Malcolm Baldrige National Quality Award (MBNQA) is perhaps the most widely accepted and deployed Business Excellence models worldwide. The awards are presented annually in five categories viz. Large Manufacturing Companies, Service Companies, Small Businesses, Education, and Healthcare. The NIST is administering a pilot cycle for non-profit organizations in 2006. Each applicant submits an application in response to criteria for performance excellence. This application is evaluated by qualified examiners. Examiners conduct a multiple stage assessment ending in a Site Visit and decision by a Jury. All applicants receive a comprehensive Feedback Report. The awards are presented by President of USA and carry his seal.
“More than any other program, the Baldrige Quality Award is responsible for making quality a national priority and disseminating best practices across the United States.”
Building on Baldrige: American Quality for the 21st CenturyA report by the Private Council on Competitiveness
Business Excellence: Business Excellence is both a journey and destination. It addresses conducting business in a manner that it leads to excellent performance. Performance is excellent in relation to how other companies are performing. These companies could be from any industry. A fundamental belief of Business Excellence is that while results are important, sustainability and predictability of those results is only possible on the bedrock of robust processes.
3.2 Overview and Global AppealIn the early 1980s the United States of America woke up to the realisation of global (especially Japanese) competition. It found that many of its traditional strongholds were being successfully challenged by globally competition. Quality of products and services was found to be a key contributor to this slide. In its efforts to fuel a national movement for improved competitiveness the then Secretary of Commerce, Malcolm Baldrige, instituted a committee headed by NIST’s First Director of the National Quality Program, Dr. Curt Reiman to develop an award process. It was this committee that developed the MBNQA. Baldrige (October 4, 1922 – July 25, 1987) died an untimely death in a Rodeo accident. The award is named in his honour.
The MBNQA program was formally instituted by the National Institute of Standards and Technology (NIST) of the United States of America on 20 August 1987 with the primary objective of improving the competitiveness of American Corporations. According to the official Baldrige site, “The Baldrige Award was envisioned as a standard of excellence that would help U.S. organizations achieve world-class quality.”
It is interesting to note that the MBNQA was instituted following the passing of an Act in the US Congress. The MBNQA Act 100-107 is available on www.baldrige.org. Today, the award is administered by the NIST in collaboration with the American Society for Quality (ASQ).
Deriving inspiration from the founding objectives of the program, sharing best practices was an obligation for all winners from the first cycle in 1987. The concepts of Six Sigma (Motorola) and Benchmarking (Xerox) came out in the open as a result of such sharing.
The MBNQA has rapidly emerged as the Business Excellence model of choice globally. Several large global corporations use the MBNQA Criteria as their Business Excellence criteria. The MBNQA Criteria is freely available for corporations and nations. In India the IMC Ramakrishna Bajaj National Quality Award and the Rajiv Gandhi National Quality Award are based on the MBNQA. Another award, the CII Exim Business Excellence Award is based on the European Quality Award.
Page 20 of 102

Several leading Indian business groups have used the MBNQA Criteria as a group wide program. These include The Tata Group, Aditya Birla Group, RPG Group, Anand Group, and Totyota Kirloskar.
Companies have reported that using the Criteria resulted in better employee relations, higher productivity, greater customer satisfaction, increased market share, and improved profitability. The Conference Board, a business membership organization has reported that a majority of large U.S. firms use the MBNQA criteria for self-improvement. Further, their research suggests that a long-term link between use of the Baldrige criteria and improved business performance.
3.3 Past WinnersPast winners of the MBNQA include Motorola, Boeing, Xerox, AT&T, Federal Express, Cadillac Motor Car Company, TI, Ritz Carlton, Solectron etc. The following list includes select winners from the Manufacturing and Service categories from 2000 onwards. For winners from 1988 onwards please visit www.baldrige.org.
2005 Manufacturing: Sunny Fresh Foods, Inc.Service: Dyn McDermott Petroleum Operations Company
2004 Manufacturing: The Bama Companies, Inc.2003 Manufacturing: Medrad, Inc.
Service: : Boeing Aerospace SupportService: : Caterpillar Financial Services Corporation--U.S.
2002 Manufacturing: : Motorola Commercial, Government & Industrial Solutions Sector
2001 Manufacturing: : Clarke American Checks, Inc.2000 Manufacturing: Dana Corporation–Spicer Driveshaft Division
Manufacturing: KARLEE Company, IncService: Operations Management International, Inc.
3.4 Core Values of High Performing OrganizationsThe MBNQA Criteria is based on a set of core values. These core values were identified through research on high performing companies. Thus these values represent what winning organizations do to win. The MBNQA Criteria is developed and upgraded keeping this core values in context. Each requirement of the criteria is traceable to one or more core value. These values are:
Visionary leadership refers to the role of Senior Leaders in setting a clear direction, creating customer focus, articulating clear and visible values, and setting high expectations. They must inspire and motivate entire work force and encourage all employees to contribute, to develop and to learn, to be innovative and to be creative. Leaders must be personally involved and committed to the overall well-being of the organization.
Customer driven excellence refers to alignment of actions to current and future customer needs. Excellence should be evident in the how we acquire our customer, how we service them, how our product/service characteristics provide the desired value to the customer, how does our customer place us on satisfaction, preference, referral, retention and loyalty, and business expansion. This includes anticipating, listening and responding to customer and market change with high degree of flexibility.
Organizational and personal learning refers to the process of learning and the need for continuous improvement and significant change in existing approaches. Learning should be part of daily routine, and practiced at personal, project, account, unit, and organization levels (habitual behavior).
Page 21 of 102
Valuing Employees and partners refers to how the organization commits to their satisfaction, development and well being and provides flexible high performance work practices which takes care of their work-life balance.
Agility refers to how well the organization is able to successfully demonstrate its capacity to handle rapid changes in the market-place. Also included are how flexible its operations and processes are, how well it innovates in bringing down the cycle time; in deploying newer services, products etc.
Focus on future refers to the short term and long term factors which affect business and market. This includes the strategic planning process. Further addressed are issues such as how is the company balancing the expectations of all stake holders; anticipation of the factors which can affect future business; developing employees and suppliers; and succession planning.
Managing for Innovation refers to making innovation a part of daily activities and should result in building a learning culture in the organization. It should also build on the accumulated knowledge of the organization and its employees, and its ability to rapidly disseminate and capitalize this knowledge base.
Management by fact refers to how successful organizations heavily depend on accurate and reliable measurements and analysis of the performance. Measurements should be derived from business needs and strategy. An organization’s performance measurements need to focus on key results. Measurements should provide critical data and information about key processes, outputs and results. Analysis refers to extracting larger meaning from data and information to support evaluation, decision making and improvement.
Social responsibility refers to the vital role the organization’s leaders and senior management should play with respect to social responsibility by demonstrating values, business ethics, protection of public health, safety and environment, practicing good citizenship, resource conservation and waste reduction at source, and ethical behavior.
Focus on results and creating value: Results should include a balance across measures for customers, employees, stockholders, suppliers and partners, the public and the community. The organization should use leading and lagging performance measures as a means to communicate the short term and long term priorities and to monitor actual performance. System perspective: The system perspective provides means for senior leaders to monitor, respond to, and manage performance based on the business results. It helps to synthesize measures and indicators and organizational knowledge to build key strategies; and links these strategies with key processes, and aligns resources to improve overall performance. The Baldrige Criteria provide a system perspective for managing the organization and its key processes to achieve results - performance excellence.
The seven categories and core values form the building blocks and integration mechanism for the system. Overall performance, however, greatly depends on how well the organization is able to adopt, align, and integrate the core values embodied in the seven categories.
3.5 The MBNQA Criteria for Performance ExcellenceThe 2006 MBNQA Criteria for performance excellence comprises of 7 Categories, 19 Items and 32 Areas to Address. The Categories and their inter-linkage are pictorially presented below.
Page 22 of 102
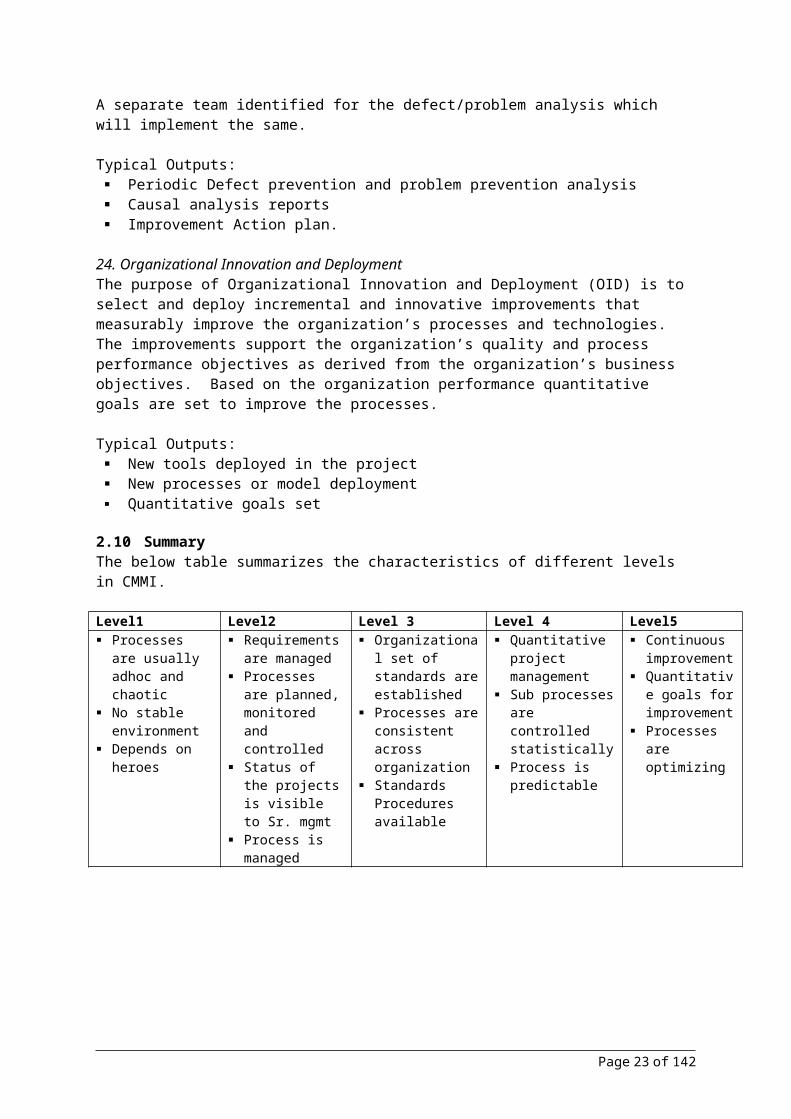
Fig. Performance Excellence Framework
3.6 Key Characteristics of the CriteriaThe MBNQA criteria are by design non-prescriptive and hence adaptable. This means that the same Criteria can be applied to any and all types of organizations. Thus the same performance excellence criteria are equally applicable to a Cement company, an Airline, a Hotel, and a Car manufacturing company.
The Criteria provides linkage across Categories and Items. This helps in understanding how one requirement connects/links with another. Further there is a cause and effect relationship between processes and results. This is derived from the fundamentals of process management – take care of the process the results will follow. Further, results achieved with no specific correlation to efforts do not auger well for predictability of these results. Also, efforts are of no consequence if they don’t lead to improvement in results.
Focus on Results – the MBNQA criteria allocates 450 points to the results category. This may indicate a disproportionate bias towards results. However, it is an effort to reinforce the importance of results. A good process is not good enough if it fails to deliver the results when compared to competition and industry at large.
The MBNQA criteria keep changing to remain current with time. The criteria are updated annually. On a periodic basis the NIST examines latest concepts with a view to include them in the Criteria. However, as a practice the NIST avoids usage of specific methodologies. For example the criteria do not specify the use of a method for structured quality improvement. A company may or may not use Six Sigma. Similarly as long as a company uses a robust and cascading approach to managing performance goals the Criteria is not keen to specify Balanced Scorecard.
The Criteria provides a balanced focus through assigned points across items and criterion. These points have been developed after thorough research on winning companies over the years. The points indicate the relative importance of the Category and Items.
3.7 The Performance Excellence FrameworkThe following paragraphs attempt to present the MBNQA Criteria in a simplified manner.
Criteria Points Essence1. Leadership 120 Examines how senior executives guide the organization
and how the organization addresses its responsibilities to the public and practices good citizenship
1.1 Senior Leadership 701.2 Governance and Social Responsibilities 502. Strategic Planning 85 Examines how the organization sets strategic directions
and how it determines key action plans.2.1 Strategy Development 402.2 Strategy Deployment 453. Customer And Market Focus 85 Examines how the organization determines
requirements and expectations of customers and markets; builds relationships with customers; and
3.1 Customer and Market Knowledge 403.2 Customer Relationships and Satisfaction 45
Page 23 of 102

acquires, satisfies, and retains customers.4. Measurement, Analysis and KM 90 Examines the management, effective use, analysis, and
improvement of data and information to support key organization processes and the organization’s performance management system.
4.1 Measurement, Analysis, and Review of Organizational Performance
45
4.2 Information and Knowledge Management
45
5. Human Resource Focus 85 Examines how the organization enables its workforce to develop its full potential and how the workforce is aligned with the organization’s objectives
5.1 Work Systems 355.2 Employee Learning and Motivation 255.3 Employee Well-Being and Satisfaction 256. Process Management 85 Examines aspects of how key production/delivery and
support processes are designed, managed, and improved.
6.1 Value Creation Processes 456.2 Support Processes and Operational Planning
40
7. Results 450 Examines the organization’s performance and improvement in its key business areas: customer satisfaction, financial and marketplace performance, human resources, supplier and partner performance, operational performance, and governance and social responsibility. The category also examines how the organization performs relative to competitors.
7.1 Product and Service Outcomes 1007.2 Customer Focused Outcomes 707.3 Financial and Market Outcomes 707.4 Human Resource Outcomes 707.5 Organizational Effectiveness Outcomes 707.6 Leadership and Social Responsibility Outcomes
70
1. Leadership (120 points)Leadership addresses how your senior leaders guide and sustain your organization, setting organizational vision, values, and performance expectations. Attention is given to how your senior leaders communicate with employees, develop future leaders, and create an environment that encourages ethical behavior and high performance. The Category also includes your organization’s governance system, its legal and ethical responsibilities to the public, and how your organization supports its community.
2. Strategic Planning (85 points)Strategic Planning addresses strategic and action planning, deployment of plans, how plans are changed if circumstances require a change, and how accomplishments are measured and sustained. The Category stresses that long-term organizational sustainability and your competitive environment are key strategic issues that need to be integral parts of your organization’s overall planning.
The Baldrige Criteria emphasize three key aspects of organizational excellence. These aspects are important to strategic planning: Customer-driven quality is a strategic view of quality. Operational performance improvement contributes to short- and longer-term productivity growth
and cost/ price competitiveness. Organizational and personal learning are necessary strategic considerations in today’s fast-paced
environment.
3. The Customer and Market Focus (85 points)Customer and Market Focus addresses how your organization seeks to understand the voices of customers and of the marketplace, with a focus on meeting customers’ requirements, needs, and expectations; delighting customers; and building loyalty. The Category stresses relationships as an important part of an overall listening, learning, and performance excellence strategy. Your customer satisfaction and dissatisfaction results provide vital information for understanding your customers and the marketplace. In many cases, such results and trends provide the most meaningful information, not only on your customers’ views but also on their marketplace behaviors—repeat business and positive referrals—and how these views and behaviors may contribute to the sustainability of your organization in the marketplace.
Page 24 of 102

4. Measurement, Analysis, and Knowledge Management (90 points)The Measurement, Analysis, and Knowledge Management Category is the main point within the Criteria for all key information about effectively measuring, analyzing, and reviewing performance and managing organizational knowledge to drive improvement and organizational competitiveness.
In the simplest terms, Category 4 is the “brain center” for the alignment of your organization’s operations with its strategic objectives. Central to such use of data and information are their quality and availability. Furthermore, since information, analysis, and knowledge management might themselves be primary sources of competitive advantage and productivity growth, the Category also includes such strategic considerations.
5. Human Resource Focus (85 points)Human Resource Focus addresses key human resource practices—those directed toward creating and maintaining a high-performance workplace and toward developing employees to enable them and your organization to adapt to change. The Category covers human resource development and management requirements in an integrated way (i.e., aligned with your organization’s strategic objectives and action plans). Your human resource focus includes your work environment and your employee support climate.
To reinforce the basic alignment of human resource management with overall strategy, the Criteria also cover human resource planning as part of overall planning in the Strategic Planning Category (Category 2).
6. Process Management (85 points)Process Management is the focal point within the Criteria for all key work processes. Built into the Category are the central requirements for efficient and effective process management: effective design; a prevention orientation; linkage to customers, suppliers, partners, and collaborators and a focus on value creation for all key stakeholders; operational and financial performance; cycle time; and evaluation, continuous improvement, and organizational learning.
Agility, cost reduction, and cycle time reduction are increasingly important in all aspects of process management and organizational design. In the simplest terms, “agility” refers to your ability to adapt quickly, flexibly, and effectively to changing requirements. Depending on the nature of your organization’s strategy and markets, agility might mean rapid change from one product to another, rapid response to changing demands, or the ability to produce a wide range of customized services. Agility also increasingly involves decisions to outsource, agreements with key suppliers, and novel partnering arrangements. Flexibility might demand special strategies, such as implementing modular designs, sharing components, sharing manufacturing lines, and providing specialized training. Cost and cycle time reduction often involve Lean process management strategies. It is crucial to utilize key measures for tracking all aspects of your overall process management.
7. Results (450 points)The Results Category examines your organization’s performance and improvement in all key areas—product and service outcomes, customer satisfaction, financial and marketplace performance, human resource outcomes, operational performance, and leadership and social responsibility. Performance levels are examined relative to those of competitors and other organizations providing similar products and services.
3.8 Assessment ProcessA well defined Criteria and a Unique scoring system has helped the MBNQA program earn the reputation it has. Like any good quality product/service reputation is built by word of mouth over a period of time. This reputation depends on trust. Trust comes from the understanding that the assessment process is fair and robust. It is not dependent of the individual fancies or perceptions. This of course is, easier said than done.
Page 25 of 102

Key aspects of the MBQNA assessment process: Based on the application submitted by the applicant Multiple examiners ensure fair assessment Multi stage assessment ensures that effort is invested for deserving clients Scoring system Each applicant receives a feedback report – the bedrock of improvement
Application DocumentThe application document is the key to a MBNQA assessment. The entire assessment is based on what is presented in the application document. The examiner team has an opportunity to verify the contents during the assessment. So what are the contents of this application document? The application document is a compilation of application form, organizational profile (5 pages), and criteria responses (50 pages). The Organizational Profile provides an overview of the nature of business, products/services, customers, employee profile, and most importantly organizational challenges of the applicant. The organizational profile is assessed and scored. They are only used to set the stage or context for the examiner team. The Criteria Responses are prepared in response to the requirements of the Criteria for all 7 categories in 50 pages.
Examiner TeamA qualified and experienced Examiner team is another pillar for the MBNQA Assessment Process. An examiner team typically includes 5 to 8 examiners. The team is led by a Senior Examiner/Team leader. Members of the team are sourced from industry, consulting, and academia. It is mandatory for every aspirant to attend and clear an Examiner Training program. The Examiner Team is assembled based on the best fit for the application being considered. The examiner pool is churned every year. The team includes a mix of experienced and first time examiners. It is a matter of great pride to be invited as an Examiner for the MBNQA. About one-third of the examiner pool retires each year.
Multi-Stage AssessmentMBNQA assessments derive their respect from the comprehensive and fair multiple stage assessment that each application goes through.
Individual review: Each examiner in the team receives a copy of the allotted application. Each examiner, independently, invests time and effort in reviewing the application. A draft feedback report is the output of this effort. Examiners are not permitted to interact with each other during this stage. High scoring applicants make it to the next stage – consensus review.
Consensus review: All team members now meet for 2 to 3 days to discuss and debate the comments and scores awarded by each examiner. A common draft feedback report and Site Visit Issues are developed during this meeting/review. Site Visit issues are verifications and clarifications that the team wishes to seek from the applicant, in case the applicant qualifies for the next stage. High scoring applicants make it to the next stage – site visit review.
Site Visit review: A team of examiners visits the applicant at its location (referred to as site) and conducts a series of discussions with various levels of management. This team may include new members based on experience and fit as decided by the NIST. Each visit is typically for 2-3 days. Scores and comments are also finalized during this visit.
A Panel of Judges, constituted of eminent professionals, reviews the recommendations and announces the awards.
3.9 Scoring System The MBNQA Criteria uses a scoring system developed and improved over the years. The scoring system is organized around four assessment perspectives. These are Approach – Deployment –
Page 26 of 102

Learning – Integration for Processes (Category 1 to 6) and Levels, Rate/Breadth of Trends, Comparisons, Linkage (L-T-C-Li) for Results (Category 7).
Scoring is a key skill in the MBNQA assessment process. It takes experience of several cycles to master this skill. The MBNQA assessment process is dependent on what the applicant writes in the application document. While every examiner has a method to go about assessing the application, it is useful to follow some key step. These could include:
1. Study the Unit Profile. Mark key points from a significance point of view.2. Develop key factors from the Unit Profile. Key factors are brief observations about the
applicant. These key factors are useful in assessing the application as they provide a context. 3. Now read the application and take mental notes on the highs and lows you notice. 4. Read the application and mark +, ++, -, and - - etc. throughout the application.5. In the third reading start recording strengths and areas for improvement. 6. Do not score before recording comments.7. Now score using the scoring perspectives and guidelines.
For writing a comment and deciding on a score you will need to understand the submission in context of the above described perspective, and apply the scoring scale (% band) provided in the criteria. Find the best fit percentage band and then the description within the band to award a score to the item. Scoring must be done at an item level. Eg. Give a score each for 1.1 and 1.2. The aggregate of these two will be the score for Category 1. The final score indicates a state of maturity and performance of the applicant. The following scoring bands are used as indicators of such maturity and performance.
Band Band Percent Applicants Descriptors
0–250 The organization demonstrates the early stages of developing and implementing approaches to Category requirements. However, important gaps exist in most Categories.
251–350 The organization demonstrates the beginning of a systematic approach responsive to the basic requirements of the Items, but major gaps exist in approach and deployment in some Categories. The organization is in the early stages of obtaining results stemming from approaches, with some improvements and good performance observed.
351–450 The organization demonstrates an effective, systematic approach responsive to the basic requirements of most Items, but deployment in some key areas or work units is still too early to demonstrate results. Early improvement trends and comparative data in areas of importance to key organizational requirements are evident.
451–550 The organization demonstrates effective, systematic approaches to the overall requirements of the Items, but deployment may vary in some areas or work units. Fact based evaluation and improvement address the efficiency and effectiveness of key processes. Results address key customer/stakeholder, market, and process requirements, and they demonstrate some areas of strength and/or good performance.
551–650 The organization demonstrates an effective, systematic approach responsive to the overall requirements of the Items and to key organizational needs, with a fact-based, systematic evaluation and improvement process resulting in overall organizational learning. There are no major gaps in deployment. Improvement trends and/or good performance are reported for most areas of importance. Results address most key customer/stakeholder, market, and process requirements and demonstrate areas of strength.
651–750 The organization demonstrates refined approaches, including key measures, good deployment, and very good results in most Areas. Organizational alignment, learning, and sharing are key management tools. Some outstanding activities and results address key customer/stakeholder, market, process, and action plan requirements. The organization is an industry3 leader in some Areas.
751–875 The organization demonstrates refined approaches, innovation, excellent deployment, and good to excellent performance improvement and levels in most Areas. Good to excellent integration and alignment are evident, with organizational analysis, learning, and sharing of best practices as key management strategies. Industry leadership and some benchmark leadership are demonstrated in results that address most key customer/stakeholder, market, process, and action plan requirements.
876–1000 The organization demonstrates outstanding approaches, innovation, full deployment, and excellent and sustained performance results. Excellent integration and alignment are evident, and organizational analysis, learning, and sharing of best practices are pervasive. National and world leadership is demonstrated in results that fully address key customer/stakeholder, market, process, and action plan requirements.
Page 27 of 102

3.10 MBNQA @ Zymcwj iSOP (Zymcwj Scaling Outstanding Performance), a pioneering organization wide program, has helped Business Units to scale higher platforms of performance excellence and meet the challenges of fast growth, scalability and collaboration. iSOP brought about significant understanding of best in class practices in areas such as Leadership, Business Planning, Customer Focus, and People Management besides other facets which contribute to sustained Business Results. iSOP program has been embraced units and enabling functions to drive organizational improvement.
Zymcwj commenced its structured Business Excellence journey in 2000. Early efforts were limited to applying for National Business Excellence awards such as IMC Ramakrishna Bajaj National Quality Award and CII EXIM Bank Business Excellence Award. Zymcwj won both these awards in 2000 and 2002 respectively. Over the last five years, Zymcwj underwent annual assessments from External Examiners to move forward in its Business Excellence journey. In 2004, when Zymcwj was reorganized in IBU and ECU structure, a need to take the Business Excellence initiative to Unit level was felt by Zymcwj IBOD. This led to the birth of the iSOP (Zymcwj Scaling Outstanding Performance) initiative in 2005.
The primary driver for Zymcwj to adopt iSOP at unit level was to enable its Unit Leadership take their Business Units to higher platforms of performance excellence which would help Units to: handle growth and scalability issues manage unit performance and their integration with corporate improve overall effectiveness and capabilities learn, reuse and share knowledge at organization level identify and address systemic issues.
iSOP encompasses the spirit of all major business models such as CMMi and Six Sigma (Refer fig.)
iSOP Workshops: Unit Leadership including Unit Head participate in a two day workshop. This helps Unit Leaders understand the robust and globally accepted MBNQA framework and assess their Units on business excellence parameters. iSOP has highlighted generic gaps across Units including Revision of the Tiered leadership development program; Unit Business planning for increased IBU/ECU collaboration, Units capture Competition Data; Unit scorecards are now getting deployed to 2-3 levels below Unit Head.
The customization/standardization of the MBNQA Criteria for IT Services is perhaps a global first and defiantly unique in India. Zymcwj has deployed the iSOP Program as a Change and Leadership Development program.
The iSOP program has captured the mindset and attention of Senior Leadership at Units and Corporate Level. It enjoys one of the highest sponsorships from all IBOD members. The iSOP Program has brought about the following: an understanding of the importance of using a systematic approach on various facets of
business such as Leadership, Strategic Planning, Customer Focus, People focus, Process focus, and results.
highlighted generic and specific key gaps at Unit level such as leadership development, collaborative business planning,
standardized approach to unit evaluation culminating in the Best Unit award at Zymcwj capability improvement in individual Units to handle growth, scale, and integration issues Driven as a single umbrella for all Unit level improvement initiatives aligned to their Business
Plans The iSOP assessments have generated a compilation of Useful practices across all Units.
The iSOP program is now accepted as the vehicle for change management across Zymcwj.
Page 28 of 102
Balance
d Scoreca
rd

3.11 Glossary and References
This Glossary of Key Terms defines and briefly describes terms used throughout the MBNQA Criteria booklet. For a more detailed list please refer the MBNQA Criteria Booklet.
Approach: The term “approach” refers to the methods used by an organization to address the Baldrige Criteria Item requirements. Approach includes the appropriateness of the methods to the Item requirements and the effectiveness of their use. Approach is one of the dimensions considered in evaluating Process Items.
Customer: The term “customer” refers to actual and potential users of your organization’s products, programs, or services. Customers include the end users of your products, programs, or services, as well as others who might be the immediate purchasers or users of your products, programs, or services. These others might include distributors, agents, or organizations that further process your product as a component of their product. The Criteria address customers broadly, referencing current and future customers, as well as the customers of your competitors.
Deployment: The term “deployment” refers to the extent to which an approach is applied in addressing the requirements of a Baldrige Criteria Item. Deployment is evaluated on the basis of the breadth and depth of application of the approach to relevant work units throughout the organization. Deployment is one of the dimensions considered in evaluating Process Items. For further description, see the Scoring System on pages 51–54.
Integration: The term “integration” refers to the harmonization of plans, processes, information, resource decisions, actions, results, and analyses to support key organization-wide goals. Effective integration goes beyond alignment and is achieved when the individual components of a performance management system operate as a fully interconnected unit. Integration is one of the dimensions considered in evaluating Process Items.
Mission: The term “mission” refers to the overall function of an organization. The mission answers the question, “What is this organization attempting to accomplish?” The mission might define customers or markets served, distinctive competencies, or technologies used.
Performance Excellence: The term “performance excellence” refers to an integrated approach to organizational performance management that results in (1) delivery of ever-improving value to customers and stakeholders, contributing to organizational sustainability; (2) improvement of overall organizational effectiveness
and capabilities; and (3) organizational and personal learning. Process: The term “process” refers to linked activities with the purpose of producing a product or service for a customer (user) within or outside the organization. Generally, processes involve combinations of people, machines, tools, techniques, and materials in a defined series of steps or actions. In some situations, processes might require adherence to a specific sequence of steps, with documentation (sometimes formal) of procedures and requirements, including well-defined measurement and control steps. In many service situations, particularly when customers are directly involved in the service, process is used in a more general way. In knowledge work, such as strategic planning, research, development, and analysis, process does not necessarily imply formal sequences of steps. Rather, process implies general understandings regarding competent performance, such as timing, options to be included, evaluation, and reporting.
Senior Leaders: The term “senior leaders” refers to an organization’s senior management group or team. In many organizations, this consists of the head of the organization and his or her direct reports.
Stakeholders: The term “stakeholders” refers to all groups that are or might be affected by an organization’s actions and success. Examples of key stakeholders might include customers, employees, partners, governing boards, stockholders, donors, suppliers, taxpayers, policy makers, funders, and local and professional communities.
Systematic: The term “systematic” refers to approaches that are well ordered, repeatable, and use data and information so learning is possible. In other words, approaches are systematic if they build in the opportunity for evaluation, improvement, and sharing, thereby permitting a gain in maturity.
Value Creation: The term “value creation” refers to processes that produce benefit for your customers and for your organization. They are the processes most important to “running your business”— those that involve the majority of your employees and that generate your products, services, and positive business results for your key stakeholders, including your stockholders.
Vision: The term “vision” refers to the desired future state of your organization. The vision describes where the organization is headed, what it intends to be, or how it wishes to be perceived in the future.
References Criteria for Performance Excellence, NIST, 2006 www.baldrige.org www.asq.org www.baldrige21.com www.baldrigeplus.com www.dhutton.com www.forwardaward.org www.balancedscorecard.org
Page 29 of 102

4 Information Technology Infrastructure Library (ITIL)
4.1 Overview of ITIL In today’s world, Organizations are increasingly dependent upon IT to satisfy their corporate aims and meet their business needs. This growing dependency leads to growing needs for quality IT services (use of IT to deliver a business process e.g. billing, sourcing) to match the business needs and user requirements.
ITIL provides a comprehensive, consistent and coherent set of best practices for IT Service Management processes, promoting a quality approach to achieving business effectiveness and efficiency in the use of information systems.
Key objectives of IT Service Management
– To align IT services to the current and future needs of the business and its customers– To improve the quality of IT services delivered– To reduce the long-tem cost of service provision
Developed in the late 1980’s, the IT Infrastructure Library (ITIL) has become the world-wide de facto standard in Service Management. Starting as a guide for UK government. CCTA collected information on how various organizations addressed Service Management, analyzed this and filtered those issues that would prove useful to CCTA and to its Customers in UK central government, later it was adopted by other organizations.
4.2 IT Service Management: Service Support
Service Support: It is the practice of those disciplines that enable IT Services to be provided effectively. It includes one Function and 5 disciplines.
Service Desk: The Service Desk provides a vital day-to-day contact point between Customers, Users, IT services and third-party support organizations. Service Level Management is a prime business enabler for this function.
A Service Desk:
acts as a strategic function to identify and lower the cost of ownership for supporting the computing and support infrastructure
supports the integration and management of Change across distributed business, technology and process boundaries
reduces costs by the efficient use of resource and technology supports the optimization of investments and the management of the businesses support services helps to ensure long term Customer retention and satisfaction assists in the identification of business opportunities
Incident Management: The objective of Incident Management is to return to the normal service level, as defined in the SLA, as soon as possible, with the smallest possible impact on the business activity of the organization and the user. Incident Management should also keep effective records of incidents to measure and improve the process, and report to other processes.
Page 30 of 102
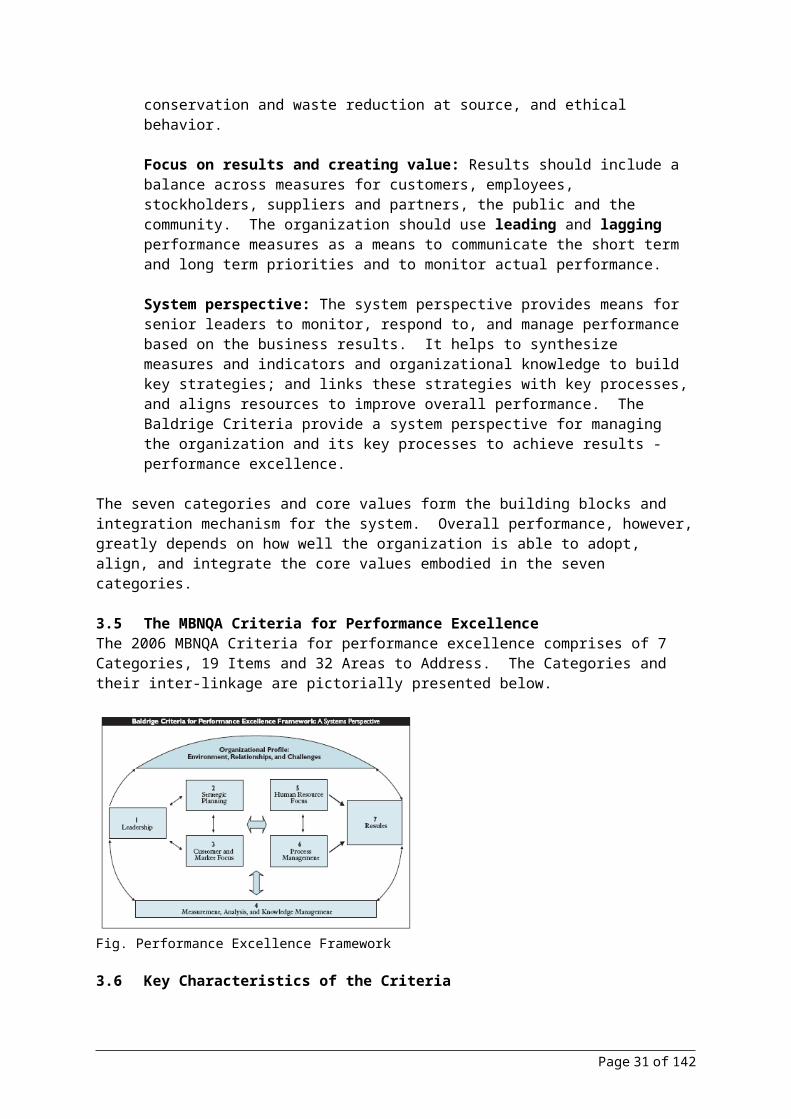
Benefits: Improved monitoring, allowing performance against SLAs to be more accurately measured. Useful management and SLA reporting by effective use of the available information. Better and more efficient use of personnel. No lost or incorrectly registered incidents and service requests. Improved user and customer satisfaction.
Problem Management: The objective of Problem Management is to root out the underlying cause of problems and consequently prevent incidents. Problem Management includes proactive and reactive activities. Reactive Problem Management aims to identify the root cause of past incidents and presents
proposals for improvement or rectification. Proactive Problem Management aims to prevent incidents by identifying weaknesses in the infrastructure and making proposals to eliminate them.
The major activities of Problem Management are: Problem Control: defining and investigating problems Error Control: monitoring known errors and raising RFCs Proactive Problem Management: Preventing incidents by improving the infrastructure Providing information: reports on the results and major problems
Configuration Management: Configuration Management aims to assist with managing the economic value of the IT services (a combination of customer requirements, quality and costs) by maintaining a logical model of the IT infrastructure and IT services, and providing information about them to other business processes. Configuration Management implements this by identifying, monitoring, controlling and providing information about Configuration Items and their versions.
Benefits: Provides accurate information on CIs and their documentation and supports all other Service
Management processes Facilitates adherence to legal obligations Improves security by controlling the versions of CIs in use. Allows the organization to perform impact analysis and schedule Changes safely, efficiently and
effectively. This reduces the risk of Changes affecting the live environment.
Change Management: The objective of Change Management is to ensure that standard methods and procedures are used, such that changes can be dealt with quickly, with the lowest possible impact on service quality
Page 31 of 102
Service
Incident detection and recording
YES
Classification and initial support
Investigation and diagnosis
Resolution and recovery
Incident closure
Service Request

PROJECT CHANGE MGNT.
Monitoring Planning
Build
Test
Implementation
RegistrationClassification
Approval
AuthorizationImplementation
Evaluation (PIR)Back out
RFC
Refusal
Refusal
PROJECT CHANGE MGNT.
Monitoring Planning
Build
Test
Implementation
RegistrationClassification
Approval
AuthorizationImplementation
Evaluation (PIR)Back out
RFC
Refusal
Refusal
Benefits: Reduced adverse impact of changes on the quality of IT services. Fewer changes are reversed, and any back-outs that are implemented proceed more smoothly. Enhanced management information is obtained about changes, which enables a better diagnosis of
problem areas. Improved user productivity through more stable and better IT services.
Release Management:The objectives of Release Management include: Planning, coordinating and implementing (or arranging the implementation) of software and
hardware Designing and implementing efficient procedures for the distribution and installation of changes
to IT systems Ensuring that the hardware and software related to changes are traceable and secure, and that only
correct, authorized, and tested versions are installed Communicating with users and considering their expectations during the planning and rollout of
new releases
Page 32 of 102

Ensuring that the original copies of software are securely stored in the Definitive Software Library (DSL) and that the CMDB is updated; the same applies with respect to the hardware in the DHS
4.3 IT Service Management: Service Delivery
Service Delivery: It is the management of the IT services themselves, and involves a number of management practices to ensure that IT services are provided as agreed between the Service Provider and the Customer.
Availability Management:The objective of Availability Management is to provide a cost-effective and defined level of availability of the IT service that enables the business to reach its objectives.
Benefits: There is a single contact and person responsible for the availability of products and services. New products and services fulfill the requirements and availability standard agreed with the
customer. The availability standards are monitored continuously and improved where appropriate. The occurrence and duration of unavailability are reduced. The emphasis is shifted from remedying faults to improving service.
Service Level Management:
Service Level Management ensures that the IT services required by the customer are continuously maintained and improved. This is accomplished by agreeing, monitoring and reporting about the performance of the IT organization, in order to create an effective business relationship between the IT organization and its customers
Benefits: Overall, improvement in the quality of service and reduction in the cost of service provision Clearer understanding of expectations of service levels from both sides (customer & service
provider) Service reviews are established which help maintain regular lines of communication between IT
and its customers Arriving at target service levels helps measure performance Offers a basis for charging
Continuity Management:The objective of IT Service Continuity Management is to support the overall Business Continuity Management (BCM) by ensuring that required IT infrastructure and IT services, including support and the Service Desk, can be restored within specified time limits after a disaster. The various stages of ITSCM are depicted in the following diagram.
Page 33 of 102

Capacity Management:Capacity Management aims to consistently provide the required IT resources at the right time (when they are needed), and at the right cost, aligned with the current and future requirements of the customer.
Benefits: Reduced risks associated with existing services as the resources are effectively managed, and the
performance of the equipment is monitored continuously. Reduced costs, as investments are made at the appropriate time, neither too early nor too late,
which means that the purchasing process does not have to deal with last-minute purchases or over-purchases of capacity well in advance of when they are needed.
Reduced business disruption through close involvement with Change Management when determining the impact on the capacity and preventing urgent changes resulting from incorrect capacity estimates.
Page 34 of 102

Higher efficiency as demand and supply are balanced at an early stage.
Managed, or even reduced,
capacity-related expenses as the capacity is used more efficiently.
Financial Management:Financial Management aims to assist the internal IT organization with the cost-effective management of the IT resources required for the provision of IT services.
Budgeting enables an organization to: predict the money required to run IT Services for a given period ensure that actual spend can be compared with predicted spend at any point reduce the Risk of overspending ensure that revenues are available to cover predicted spend (where Charging is in place).
IT Accounting enables an organization to: account for the money spent in providing IT Services calculate the cost of providing IT Services to both internal and external Customers perform cost-benefit or Return-on-Investment analyses identify the cost of Changes.
Charging enables an organization to: recover the costs of the IT Services from the Customers of the service operate the IT organization as a business unit if required influence User and Customer behavior
In summary, the benefits are increased confidence in setting and managing budgets accurate cost information to support IT investment decisions accurate cost information for determining cost of ownership for ongoing services a more efficient use of IT resource throughout the organization
4.4 IT Service Management standards ISO/IEC 20000 The itSMF (IT Service Management Forum) was set up to support and influence the IT Service Management industry. It has been influential in promoting industry best practice and driving updates to ITIL.
ISO 20000 is the international standard for IT Service management based on BS15000. The standard actually comprises two parts:
Page 35 of 102
Problem Management
Supplier ManagementIncident Management
Customer Relationship ManagementResolution Processes
Release Management
Supplier ProcessesRelease Processes
Financial ManagementService ReportingAvailability & Contingency Management
Capacity ManagementService Level ManagementSecurity ManagementService Design & Management Processes
Control Processes
Asset & Configuration ManagementChange Management

Part 1: Specification provides requirements for IT service management and is relevant to those responsible for initiating, implementing or maintaining IT service management in their organization.
Part 2: Code of practice, represents an industry consensus on guidance to auditors and assistance to service providers planning service improvements or to be audited against ISO/IEC 20000-1:2005.
Published by ISO (International Organization for Standardization) and IEC (International Electro technical Commission), ISO/IEC 20000 enables organizations to benchmark their capability in delivering managed services, measuring service levels and assessing performance.
4.5 Terminology / References1. ITIL- Information Technology Infrastructure Library2. CCTA- Central Computer and Telecommunications Agency3. OGC- Office of Government Commerce4. itSMF- Information Technology Service Management Forum (itSMF) is the only internationally
recognized and independent user group dedicated to IT Service Management. It is owned and operated solely by its membership
5. EXIN- Exameninstituut voor Informatica - a Dutch foundation that developed a professional certification system for ITIL
6. ISEB- The Information Systems Examining Board, part of the British Computer Society7. DSL- Definitive Software Library - Library in which the definitive authorized versions of all
software CIs are stored and protected8. DHS- Definitive Hardware Store - Area for the secure storage of definitive Hardware spares9. Delta Release- Release that includes only those CIs within the Release unit that have actually
changed or are new since the last full or Delta Release 10. Full Release- All components of the Release unit that are built, tested, distributed and
implemented together. See also 'Delta Release‘11. OLA- Operational Level Agreement - An internal agreement covering the delivery of services
which support the IT organization in their delivery of services12. Service Catalogue- Written statement of IT services, default levels and options13. UC- Underpinning Contract - A contract with an external supplier covering delivery of services
that support the IT organization in their delivery of services14. Demand Management- The prime objective of Demand Management is to influence the demand
for computing resource and the use of that resource15. Application sizing- Estimating the resource requirements to support a proposed application
Change or new application, to ensure that it meets its required service levels 16. Capacity Database- Holds the information needed by all the sub-processes within Capacity
Management17. Immediate Recovery ('Hot stand-by‘) - Provides for the immediate restoration of services
following any irrecoverable incident. Recovery time of 2 or 4 hours18. Intermediate Recovery ('Warm stand-by‘)- Involves the re-establishment of the critical systems
and services within a 24 to 72 hour period19. Gradual Recovery ('Cold stand-by‘)- Applicable to organizations that do not need immediate
restoration of business processes and can function for a period of up to 72 hours, or longer, without a re-establishment of full IT facilities
20. Mean Time Between Failure(MTBF)- Average time between restoration of service following an incident and another incident occurring
21. Mean Time Between System Incidents- Average time between Incident occurrence22. Mean Time to Repair- Average downtime between an Incident occurring and restoration of
service/ the system23. Call Center- Handling large call volumes of telephone-based transactions, registering them and
referring them to other parts of the organization24. Help Desk- Managing, coordinating and resolving incidents as quickly as possible
Page 36 of 102

25. Service Desk- Handles Incidents, Problems and questions, but also provides an interface for other activities
26. Configuration Management Database (CMDB)- A database that contains all relevant details of each CI and details of the important relationships between CIs
27. Configuration item (CI)- Component of an infrastructure 28. Problem- The unknown root cause of one or more incidents (not necessarily – or often solved at
the time the incident is closed)29. Known Error- A condition that exists after the successful diagnosis of the root cause of a problem
when it is confirmed that a CI is at fault30.Request for Change (RFC)- Form, or screen, used to record details of a request for a Change to
any CI within an infrastructure or to procedures and items associated with the infrastructure
4.6 References Service Support: Service Support, OGC / HMSO, 0 11 330015 8 Service Delivery: Service Delivery, OGC / HMSO, 0 11 330017 4 ISEB’s web-site: www.bcs.org.uk itSMF web-site: www.itsmf.com EXIN web-site: www.exin.nl Internal material ISO website: www.iso.org
Page 37 of 102

5 ISO 9001:2000
5.1 IntroductionISO (International Organization for Standardization) is a network of the national standards institutes of 157 countries, on the basis of one member per country, with a Central Secretariat in Geneva, Switzerland, that coordinates the system. ISO has been developing voluntary technical standards over almost all sectors of business, industry and technology since 1947. The vast majority of ISO standards are highly specific to a particular product, material, or process. However, Standards such as ISO 9001 and ISO 14001 are known as Generic Management system standards.
Generic means that the same standards can be applied to any organization, large or small, whatever its product - including whether its "product" or “service “, and whether it is a business enterprise, a public administration, or a government department.
Management system refers to what the organization does to manage its processes or activities in order that the products or services that it produces meet the objectives it has set itself, such as the following:
satisfying the customer's quality requirements, complying to regulations meeting environmental objectives
Contrary to Popular understanding, ISO is not an acronym. Because "International Organization for Standardization" would have different abbreviations in different languages ("IOS" in English, "OIN" in French for Organisation internationale de normalisation), it was decided at the outset to use a word derived from the Greek isos, meaning "equal". Therefore, whatever the country, whatever the language, the short form of the organization's name is always ISO.
5.2 History of ISO 9000 SeriesThese standards are required to maintain consistency and improve the Operational parameters while meeting the Customer’s requirements and other regulatory requirements.
Earlier standards in the Year 1987 are correction based (ISO 9000: 1987). Later it moved to Prevention based approach (ISO 9000:1994). Now it focuses on Improvement Based Approach (ISO 9001:2000).
Current standard moved away from procedurally based approach to “Process” based approach. There is considerable change with respect to documentation, more focus on competence and results than documenting the activity. Also Move to “Customer satisfaction” rather than “Customer complaints”.
Though Software companies may adopt CMMI model for their core processes, still ISO is relevant for such companies due to the following reasons: ISO covers all the functions in the Organization (CMMI covers only the work related to the core
software Development). It is universally accepted Certifiable standard.
5.3 What is ISO 9001 ISO 9001: 2000 is an International Standard which specifies the Quality Management systems requirements for an Organization. It is built on the following Principles.
i) Customer Focusii) Leadershipiii) Involvement of Peopleiv) The Process Approachv) A System Approach to management
Page 38 of 102

vi) Continual Improvementvii) Factual Approach to Decision makingviii) Mutually beneficial supplier relationships
5.4 Benefits of ISO 9001Benefits to the different stakeholders Since it is internationally recognized standard, it gives the Confidence to the Customers about the
Products / Services offer to them. Improved operational efficiencies like Improvement in Quality , Productivity , Greater focus on Customer Improved communication, morale, Job satisfaction and satisfaction .Staff members understand
what is expected from each and every role. Improved Consistency of Service/Product performance and therefore Higher Customer
satisfaction Cost savings due to consistent Process results. Competitive advantage in Marketing and Sales.
5.5 Typical ISO 9001 journey
1. Get the Management commitment: Typically any Change management program will need a complete support from the Management .So Management should have the confidence in this Journey .Typically Management Representative (MR) is appointed to monitor the Implementation of the Quality Management System(QMS) .Senior management is responsible for setting the Organization’s Quality Polices ,objectives and Goals .
2. Form ISO 9001 Implementation Core team: Choosing the Right team to Implement ISO 9001 based QMS is a Key to success of any Quality Program .There is no right or wrong way to choose a team because Organization vary in Size, Scope and Complexity .It is better to have people with Different skill sets on the team, from cross functional parts of the Business to provide valuable inputs top this program.
3. Get the Management system training: ISO 9001 management system detailed training is extremely important for the Implementation core team to aid understanding of the ISO 9001 requirements and to develop the QMS for the Organization.
4. Do Gap analysis: A Gap analysis is a process to identify the Gaps in the Current QMS / current processes with respect to ISO 9001 requirements
5. Define the QMS: After the Gaps are identified, QMS is developed to meet the ISO 9001 Requirements. Typically QMS will have four levels as given below:
Quality Manual Processes (Engineering & Management) Work Instructions Records, Forms, etc.
6. Implement the QMS: The Key to implementation is communication and Training of the Staff in the QMS .Once staff members are trained and understand what is expected from them and also why it is required, then Implementation becomes effective.
7. Verify the effectiveness thru Internal Audits and review with the Management: In order to verify the effectiveness of the QMS implementation, Internal Audits are conducted by the trained internal Auditors .The Audit outcome are reviewed with the senior management periodically.
Page 39 of 102

8. Choose the Registrar: Registration to ISO 9001 takes place when an accredited third party visits an organization, audits the QMS and issues the Certificate .A number of factors to be considered while selecting the Registrar, including Industry experience, Price, Service level, reputation of the Registrar.
9. Registrar conducts the Audit: Third Party Registrar conducts the Audit and issues the Certification after successful completion of the Audit.
5.6 Description of requirements ISO 9001:2000ISO 9001: 2000 requirements can be grouped under 5 categories as given in figure below Quality Management System Management Responsibility Resource Management Product realization Measurement Analysis and Improvement
Each these categories are explained below
Fig. Generic Quality Management Framework used in ISO 9001: 2000
1. Quality Management System:The Organization must have a Quality Management system (QMS) that is documented, implemented, maintained and continuously improve its effectiveness .Documentation requirements and Control requirements for the Documents & Records are explained in this Clause.
2. Management Responsibility:Top management has an ongoing commitment to the QMS .They are responsible for the identifying all of the relevant business requirements , Communicating Organisational Policies & Objectives , and providing resources to ensure implementation, maintenance, and continuous improvement of QMS . This includes Management commitment towards defining the Quality Policy for the Organisation & the measurable Quality Objectives, communicating to all the stakeholders.
Top management need to ensure that customer requirements are understood and are met with the aim of enhancing the Customer satisfaction .Also Top management need to review the effectiveness of the
Page 40 of 102

QMS implementation , Customer feedback , status of the Corrective and Preventive actions and Product & Process Performance on a ongoing basis .
3. Resource Management:The day to day management of Quality and Effectiveness relies on using the appropriate resources for each and every task .These include Competent Staff with relevant training , the correct tools ,required Infrastructure , appropriate Work environment and supporting services
4. Product Realization:Customer requirements (both explicit & Implicit), statutory & regulatory requirements related to the Product need to be determined and reviewed. Also arrangements for communicating with the customer in relation to enquiries, product information & feedback etc to be defined.
Purchasing will include the selection of the Supplier based on the Supplier’s capability to meet the requirements, Purchasing from Suppliers and verification of the Purchased product.
In addition to Production planning and scheduling the resources, Product realization includes Design & Development, Verification & Validation of the Products. Organization should plan and carry out the Production and Service Provision under controlled conditions .Control condition would include availability of the required Inputs , required work instructions ,machines and monitoring & measuring devices etc .Identification of the product through out the Product realization and unique Traceability mechanisms to be established .Wherever the customer property is involved in the Product realization , Organization should exercise sufficient care to safeguard the customer property and appropriate use .Product storage , preservation, and handling procedure need to ensure the product characteristics not affected .
Also Monitoring and measuring devices are periodically calibrated so that the measurements are accurate always.
5. Measurement Analysis and Improvement:This is a key requirement for a successful business .It involves those measurements being made to improve the QMS and demonstrate Product conformity .Statistical techniques need to be used where appropriate.
One of the Key measurements for the QMS is to collect the Customer feedback, analyze it and plan for the Improvement. Also Non conforming products need to be identified and controlled appropriately. Then appropriate Corrective action and Preventive actions need to be taken.
Based on all these data Organization need to continually improve the Quality Management System.
5.7 AuditsISO 9000: 2000 defines audit as: “Systematic, independent and documented processes for obtaining audit evidence and evaluating it objectively to determine the extent to which audit criteria is fulfilled”
It is important to realize that the audit is an information gathering exercise, which will help to identify improvement or corrective actions. The information sought is the objective evidence of compliance, and not the number of non-conformities
Audit Classification: The criteria for classifying audits are based upon who is auditing whom, and for what purpose.
i) First Party Audits: First party audits are conducted within an organization. It is conducted for the benefit of the management who will use the information gathered during the audit. e. g. internal quality audits
Page 41 of 102

ii) Second Party Audits: Second party audits are conducted by an organization on another organization for the benefit of the organization that undertook the audit. This includes audits undertaken by customers on their current or potential suppliers
iii) Third Party Audits: These are the audits undertaken by an independent third party that has no vested interest in the results of the audit. Typically, these are certification (registration) audits, audits for quality awards, etc.
5.8 Other Related Models
i) TickIT: TickIT is a quality-management certification program for software companies, supported primarily by the United Kingdom and Swedish software industries.TickIT guidelines (issue no :5) are directly related to ISO 9001:2000 requirements .Hence Software development organizations seeking TickIT Certification are required to show conformity with ISO 9001:2000.
Purpose of TickIT is to stimulate software system developers to think about: what quality really is in the context of the processes of software development, how quality may be achieved, and how quality management systems may be continuously improved in the Software Development
context.
A successful audit by a TickIT-accredited certification body results in the award of a certificate of compliance to ISO 9001:2000, endorsed with a TickIT logo.
ii) TL 9000: (Telecommunications Leadership 9000) TL 9000 is a common set of quality system requirements and Measurements designed specifically for the Telecommunications Industry, built on ISO 9001 and other best practices. It is supported by the QUEST (Quality Excellence for Suppliers of Telecommunications) forum.
iii) AS/EN 9100: This standard AS9100 includes ISO 9001:2000 quality management system requirements and specifies additional requirements for a quality management system for the aerospace industry. AS 9100 was developed by representatives from Aerospace industry from Europe, Japan, Asia, USA, Brazil and Mexico, and is published by the Society of Automotive Engineers (SAE).
iv) ISO 14001: The ISO 14001 environmental management standards exist to help organizations minimize how their operations (processes, etc.) negatively affect the environment (i.e. cause
adverse changes to air, water, or land) comply with applicable laws, regulations, and other environmentally oriented requirements , continually improve in the above.
ISO 14001 is similar to ISO 9001 quality management in that both pertain to the process-the comprehensive outcome-of how a product is produced, rather than to the product itself. As with ISO 9001, certification is performed by third-party organizations rather than being awarded by ISO directly. The ISO 19011 audit standard applies when auditing for both 9001 and 14001 compliance at once.
v) ISO/IEC 27001: ISO/IEC 27001 is an information security standard published in October 2005 by the International Organization for Standardization and the International Electro technical Commission. Its complete name is Information technology -- Security techniques -- Information security management systems -- Requirements. The current standard replaced BS 7799-2:2002, which has now been withdrawn.
ISO/IEC 27001:2005 specifies the requirements for establishing, implementing, operating, monitoring, reviewing, maintaining and improving a documented Information Security Management
Page 42 of 102
System (ISMS). It specifies requirements for the management of the implementation of security controls. It is intended to be used in conjunction with ISO 17799:2005, a security Code of Practice, which offers a list of specific security controls to select from.
vi) ISO 20000 (IT service management, ITIL, BS 15000): ISO/IEC 20000 is the first international standard for IT Service Management. It is based on and is intended to supersede the earlier British Standard, BS 15000.
Formally: ISO 20000-1 ('part 1') "promotes the adoption of an integrated process approach to effectively deliver managed services to meet the business and customer requirements". ISO 20000-2 ('part 2') is a 'code of practice', and describes the best practices for service management within the scope of ISO 20000-1. ISO 20000, like its BS 15000 predecessor, was originally developed to reflect best practice guidance contained within the Information Technology Infrastructure Library Framework, although it equally supports other IT Service Management frameworks and approaches including Microsoft Operations Framework. It is comprised of two parts: a specification for IT Service Management and a code of practice for service management.
5.9 References http://en.wikipedia.org/wiki http://www.iso.org Integrating ISO 9001:2000 with AS 9100 and ISO/TS 16949 book by D.H.Stamatis
Page 43 of 102
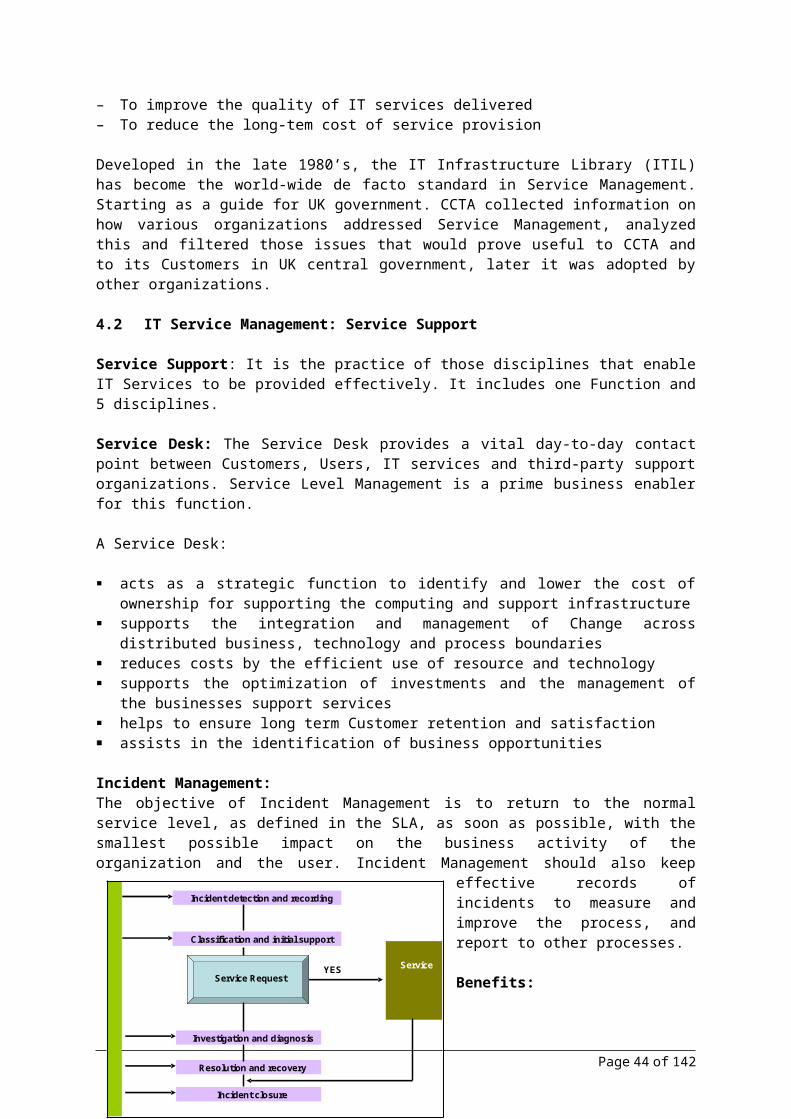
InitialPlan
DefinePilot
DeployFeedback
6 PROCESS MANAGEMENT
Companies must constantly improve their ability to produce quality outputs and assure customers that the products produced are of high quality that will bring value add to their business. This includes defining of process, measuring its performance and continuously improving its performance by making necessary changes to the process during the life of the process. Also some of these processes are to be retired at regular intervals if it is redundant to the current needs of the business
6.1 What is Process and Process ManagementA series of steps, actions or set of common tasks that lead to a desired result or satisfy a customer or group of customers. It is designed to meet the organization needs
Processes are largely influenced by one or more of the following factors: Objective of the process Participants of the process Inputs of the process (including tools, methodologies etc.) Environment
Process management is: The study and understanding of these factors how it interacts with each other The study of its performance at regular intervals Modifying, redesigning, reengineering of any process, checklist, guidelines, to remove
redundancy, to make it more agile for delivering greater business value,
It includes: Collect improvement ideas Prioritize based on the business impact, ease of implementation etc., Define Pilot if it is large change Plan for organization wide deployment Measure the benefits to check the effectiveness and issues and analyse the data to find opportunity
for change
6.2 Why ProcessProcesses will help you to deliver quality product consistently and brings value to all stake holders (Management, Employees and customers)
A new process may be defined
When the existing processes are not suitable for a class of projects that are executed regularly and there is extensive tailoring
When there are major changes to an existing process
Page 44 of 102

To meet business strategy To meet Organization wide improvement goals On request from process users Based on proactive identification / environmental scanning of beneficial innovations To meet customer specific needs
Management: It states how each task to be performed so that it is consistently performed by all employees To scale up with the available resources quickly thru knowledge transfer Predictable business model and assures customer a quality output
Employees: Increase the confidence and probability that the deliverables produced will meet desired
requirements of the customer Enable employees to concentrate more on creative or out of the box ideas instead of having to
develop process to build product Improve work productivity, predictability etc.,
Customers: Assure predictability of deliverables so that they can meet market requirements, Within IT budgets
6.3 Process OwnerThe individual(s) responsible for process definition, implementation and monitoring its performance. The process owner is accountable for institutionalizing the process, and identifying future improvements to the process. Some of the inputs/triggers for process changes are: Customer Satisfaction survey Request from Process users Best Practices in Projects/Closure reports Extensive Tailoring of existing process Risk Analysis GAP Analysis against new models like CMM/CMMI/MBNQA/TL9000 etc., Benchmarking against industry practices Proactive identification/Environmental scanning of beneficial innovations Audit Analysis Results; Findings from external assessments Innovative Proposals from technology group/SEPG etc... Inputs from internal assessments
Typical Activities: Identify processes to be defined/modified Obtain CR or proposal for process definition Evaluate process definition proposals for expected cost benefits Prioritize process definition proposals Obtain senior management authorization (from MC) Plan for process definition – Resources, training, identify risks, identify critical success factors,
methods, tools, deliverables, timelines etc., Identify how process definition activities will be tracked & monitored by the Process Council and
senior management (Generally MC review) Define/Change Process., Document Process in Process Definition Template – Model Template
attached Get it reviewed by experts Identify appropriate methods and tools for process execution Establish cross-reference to CMM, ISO, if necessary Define Tailoring Guidelines & Special considerations Review status with senior management
Page 45 of 102

The Deming Cycle, or PDCA Cycle (also known as PDSA Cycle), is a continuous quality improvement model consisting out of a logical sequence of four repetitive steps for continuous improvement and learning: Plan, Do, Study (Check) and Act. The PDSA cycle (or PDCA) is also known as the Deming Cycle, the Deming wheel of continuous improvement spiral. The PDCA is discussed in detail later in this chapter.
6.4 Process work benchIt is a visual representation of the work-flow either within a process - or an image of the whole operation. Process work bench depicts stream of activities that transforms a well defined input or set of inputs into a pre-defined set of outputs.
Page 46 of 102

Page 47 of 102

Page 48 of 102

6.5 The Process Change Management ProcessTo have the process work effectively requires that the user submit change to be considered. Anyone within the project team, user community, stakeholders, or contractors can submit a change request. This is to be done in writing either on paper or in automated format with required information as defined in the change control form.
Changes may be triggered by means of:
Organizational business goals Inputs from organization wide improvement initiatives like defect and problem prevention,
technology incorporation/changes Process improvement or change proposals from process users on QSD elements Introduction of new methods/Technologies based on proactive identification / environmental
scanning of beneficial innovations Introduction of new tools Evaluation of processes\tools in limited use for organization wide adoption Feedback from internal and external audits and assessments Lacunae in existing processes Feedback obtained from process users Analysis of process usage information obtained via the process assets Periodic analysis of feedback on usage and effectiveness of process assets Best practices and related seminars Analysis of Project performance data & process capability baselines Inputs from projects based on their defect and problem prevention activities, tools introduction &
process changes Implementation of models like ISO and CMMi.
Change Request FormIdentification – Is completed by the requester and identifies the change request with title, Process name or Process unique id on which the change is requested, Date of submission, Unit or organization etc.
Justification - A discussion of why the change is being proposed, including a cost benefit analysis. In other words, what will be the benefit to the organization/customer/vendor/employees etc. Also highlight how it impacts the organization and customer
Ease of implementation- How easy to implement the change across organization, in terms of training requirements, system changes, investments etc.
Alternatives - List at least one alternative (more if possible) to the change you are proposing, and indicate why the proposed change is better. Briefly indicate why the alternative is not the better choice.
Initial Review of the Change RequestAll change requests will be reviewed on a regular basis by the Change Control Board. This board will typically meet on a weekly, bi-weekly, or monthly basis. During periods that typically have a high volume of change, the board might meet weekly. The CCB will typically review to shortlist, reject a request. All stakeholders including individuals who have suggested the change will be informed of the decision. The process owner will prioritize the short listed request based on the justification, ease of implementation, complexity of change etc.
Page 49 of 102
Initial Impact Analysis & Process ChangeThe process owner will make an initial assessment of the process change, cost, schedule, and resources required to implement the proposed change. The process owner will indicate the timelines, cost, schedule and request for the budget and resource allocation. The change is classified as incremental and breakthrough change. If it is breakthrough change a sponsor is identified to drive the change. Sponsor is responsible for setting the direction, reviewing the progress at regular intervals, directing its implementation on pilot basis, institutionalization etc.
PFMEAAt regular intervals the process owners analyses the process to find out its usefulness using Process Failure Modes Effects Analysis - PFMEA. It’s a group of activities intended to:
(a) recognize and evaluate the potential failure of a product/process and its effect, (b) identify actions which could eliminate or reduce the occurrence, (c) document the process.(d)Track changes to process-incorporated to avoid potential failures.
Process Control Vs Process CapabilityTo say "a process is in control" you compare the process against itself. If its behavior is consistent over the time then it is in control. You don't even need specifications to see if it is in control or not.
When you compare the process output against a specification, then you are talking about process capability or process performance.
Even when a good capability is needed, typically stability (another way to say "in control") is needed first. If the process is stable, you can compare its performance against the required performance and take corrective actions if needed. But if it is not stable, you can hardly even compare the process against something, because a thing such as "the process" does not even exist from a statistical point of view, as its behavior is changing over the time so you don't have one distribution to model the process.
Process Definition templateEach phase in the process typically has the following aspects. However all these may be defined for each activity as well. It is a decision by the process group regarding the level of detailing required for the definition of a process:
Overview (gives objective and introduction) Inputs (list of inputs required to do the activities) Entry Criteria (Objective criteria on which the activities can initiate) Activities and tasks Outputs (List of outputs generated/updated by the activities performed) Exit Criteria (Objective criteria to be met for closure of the activities) References (checklists, standards, templates, guidelines) Measures & Metrics (Base measures like Size, Effort, Defect & Schedule apart from effectiveness
parameters) Roles & Responsibilities (list of roles involved and their responsibilities) Special Considerations Tools Best Practices
There are many process definition tools in the industry that will help define a template and standardize process definition across the organization (e.g. Influx workbench at Zymcwj, IRIS Process live from Osellus)
Page 50 of 102

7 Continuous Process Improvement
7.1 IntroductionIn a world of rapid development, dynamic business needs, complexities, high customer demand and value of service, IT scenario has changed significantly and so is the need to look out for techniques, practices and tools to drive and sustain improvements in projects and at organizational level. It is imperative to look out for models and methodologies offering the best return on investment thereby meeting customer demands of high quality delivery, service output, time to market and customer satisfaction.
Quality and Continuous Improvement are a never ending effort and go hand in hand. The primary purpose of Continuous Improvement is to eliminate common causes of variation and waste leading to reduced variation in process performance. According to the Guru of Gurus Dr J M Juran, this can only be done project by project using a systematic approach. Continuous improvement is therefore to look at ways for “how to do things better”.
Continuous improvement, in context of organizational quality and performance, focuses on improving customer satisfaction through continuous and incremental improvements in processes. This includes removing unnecessary activities and variations.
While the World Wars had disastrous consequences for the world in general, they were perhaps the most productive period in history for evolution of new management practices. Quality is no exception. During this period, pioneering work by a number of engineers and statisticians led to the development of techniques for improving the control of production processes so that the number of defective products could be reduced. It was during these periods that the quality improved from being an ‘inspection’ subject to a ‘control’ and then a ‘prevention/assurance’ subject.
After World War II W. Edwards Deming, then a professor of statistics in the USA was invited to serve as a consultant to the Japanese industry. His invite was based on a study conducted by the Japanese where they found Dr Deming’s teachings in Quality Control as particularly useful. Dr Deming taught the principles and mechanics to the Japanese through a series of lectures. The central idea was to improve the production system to prevent defects instead of inspecting and throwing out the defective products.
Quality is defined as meeting or exceeding the needs and expectations of the customer. Thus, the goal of a business should be to find out what the customer wants and then fine tune the process to ensure that they get it. The term 'customer' is used to include internal customers as well as external customers. Thus every work group has a customer - the person who receives their output. Deming’s teachings embraced a number of techniques and methodologies for process control. They also embraced the philosophy that quality should be the responsibility of everyone in the organization.
The Japanese adopted Dr Deming’s ideas, and over time they developed them further. They extended the application of process improvement from manufacturing to administrative functions and service industries so that the quality concept affected the whole organization. Japanese industry succeeded in taking over many markets because they were able to drive down their costs while at the same time improving the quality of their products.
In this journey the Japanese were guided by yet another American. Dr Joseph Moses Juran. He was instrumental in elevating the subject of quality from ‘control’ to improvement. Dr Juran also established a structured method for quality improvement.
Continuous improvement is applicable to all industries. Continuous improvement is achieved through incremental breakthrough improvement. We will address these topics in the section. We will also present other continuous improvement concepts, techniques and practices.
Page 51 of 102
7.2 Why improve a process?
Why improve a process at all? Why is status quo not sufficient?
First, let’s quickly revise what is a process. A process is defined as a series of activities which when executed will deliver a meaningful output. In a process inputs are transformed to deliver an output. A process is useful if it is predictable. The efficiency of a process lies in its predictable outcome, delivering the same output to a close precision time and again under defined controlled environment. In a manufacturing industry, say for example a process of producing a ring of desired diameter meeting customer specification is important. To scale up this operation, producing a higher yield but maintaining the specification determines the predictability aspect of the process.
Now let’s return to our question. Why improve a process at all? Of course there is no one universal answer to such a question. In a competitive world, if we do not improve our processes, rest assured our competitors are surely improving theirs. Assuming that we have a lead over them, it won’t take long for them to catch up. Moreover, if we are the follower then it is only through improvement that we can catch up with the leader. It is often said that we have to keep running faster to remain where we are.
We don’t improve for fear of competition. Much improvement comes through a general improvement mindset of the leaders. We leave a mark only if we improve a process. Nobody thanks a watchman just because he helped maintain the process.
7.3 Continuous or Continual Improvement?
This is an often raised question. What is the correct usage, continuous or continual? As the subject developed, the word commonly used was Continuous. During the 1990s usage of the term Continual became more prevalent. What is the difference?
Continuous is a linear path with no breaks. Without interruptions. In the context of improvement, however, this is not feasible. After each improvement project there is a need to stabilize and reap the benefits of the improvement. Moreover, continuous indicates a path with no end. In some cases there may be a need to step back on the improvement journey for one process and focus on another.
Continual is with breaks/steps. This is a more realistic term for an improvement journey. We carry out a project, reap the benefits, and then start all over again. Therefore this journey is more like ‘steps’ than linear. Another interpretation of the term Continual is something that happens repeatedly.
Thus by nature, all process improvements are continual.
7.4 Incremental and Breakthrough improvement
Another set of terms often used in the context of improvement is Incremental and breakthrough. Incremental refers to small improvements where the process being improved does not change dramatically. In a way it is doing the same thing better. Breakthrough improvement is a term proposed by Juran where significant improvements are sought. The process being improved could change dramatically as a result of a breakthrough change.
Both Incremental and Breakthrough approaches are needed for a successful organization to keep pace in market, remain ahead of its competitions and deliver high quality output. One needs to carefully examine the merits and demerits associated with using a specific way of improvement or a blend of both to attain benefits. A key area of differentiation among the two is the scope.
Breakthrough improvement may need a thorough process redesign.
Page 52 of 102

8 Structured Process Improvement Methods
All processes need to be improved for the organization to stay competitive. Further, having a process focus is key to delivering a stable output. This requires a systematic and disciplined approach. Such discipline is the corner stone of structured process improvement methods. These methods propose a sequence of steps to perform and tools to use to achieve process improvement.
Process improvement should lead to results that include: Reduced process variation Reduced waster including non-value adding activities Improved customer satisfaction.
Juran presented the powerful philosophy of Diagnostic and Remedial journey for process improvement. He developed this further in the Juran for Quality Improvement (JQI) video series.
Deming described process improvement as a continuous cycle which follows these steps:1. Understand the status of the development process2. Develop a vision of the desired process3. List improvement actions in priority order4. Generate a plan to accomplish the required actions5. Commit the resources to execute the plan.6. Start over at step 1.
In general, any structured approach for improvement includes the following steps:1. Assess the As-Is state of the process2. Plan for the To-Be state of the process3. Implementation: execution for solution4. Evaluate and Evolve on continuous basis.
Why is structure required? Structure provides discipline to the improvement journey. An unstructured approach may yield results in a one-off case. An organization can not and should not depend on such uncertainty. A structured approach is also easier to teach and train; monitor and control. It allows the team to focus on solving the problem rather than defining a structure.
The following table summarizes the some popular structured process improvement methods:
Kaizen QC Circles Juran’s method Six SigmaWho does it? Individual Small team with
voluntary participation
Cross functional team identified by management
Cross functional team identified by management
Involvement Junior management
Workmen Middle management
Senior management
Benefit Low or medium Low to medium Medium HighProject selection Visible pain or
improvement areaVisible pain within work area
COPQ On a process – high COPQ and customer impact
Method Individual area Team identifies problem and brainstorming sessions
Team uses structures step-by-step method based on teachings of Juran
Team uses DMAIC with Statistical tools
The primary objective of a software process improvement project is to improve software development processes with the aim to reduce the number of errors. If done successfully, this leads to improving the predictability in software development.
Page 53 of 102

8.1 Process Improvement/Life Cycle – PDCA
The most fundamental structured process improvement approach is the PDCA Cycle. The Plan-Do-Check-Act cycle is a generic model and can be applied in any situation. The concept was developed by Walter Shewhart and popularized by Deming. Shewhart developed the PDCA concept while working at Bell Laboratories in the USA during the 1930's. Ideally, PDCA cycle should be known as Shewhart cycle. However, it is more popular as the Deming’s Cycle. PDCA is cyclic in nature. The PDCA cycle emphasizes and demonstrates that improvement programs must start with careful planning, must result in
effective action, and must move on again to careful planning in a continuous cycle.
The PDCA can be summarized as follows:
PLAN Define the problem or opportunity Analyze the situation. Study and define the problem. Brainstorm for causes and corrective actions. Think creatively to determine the best approach and best possible corrective action. Develop an implementation plan.
DO Implement corrective action Document the procedures and observations Use data-gathering tools to collect information.
CHECK Analyze information Monitor trends Compare obtained results against expected results from the plan.
ACT on the Difference If the results are as expected, do nothing If the results are not as expected, repeat the plan/do/check/act cycle. Document the process and the revised plan.
The PDCA Cycle can also be used in team meetings as a reminder of the stage at which we are.
Page 54 of 102
The above diagram also helps in identifying the right tool at each stage. The generic improvement cycle can be mapped to the PDCA as follows:
The PDCA Cycle can be used in the following situations: As a model for continuous improvement. When starting a new improvement project. When developing a new or improved design of a process, product or service. When defining a repetitive work process. When planning data collection and analysis to verify and prioritize problems/root causes. When implementing any change.
The PDCA Cycle can be used to: Plan to improve a process by first conducting a gap analysis or identifying what is not in order.
The plan step also includes identifying the ideas which could improve the process. Do the changes identified in Plan on an experimental scale. This could also include a pilot in
actual conditions. Check if the experiment/pilot has achieved the desired result or not. Identify the gaps in
performance for rectification in further iterations. Act on the difference in performance.
At the end of Act, you complete an iteration of the PDCA Cycle. You could carry out iteration if the problem is not fully solved or the process is not improved to the desired level.
While PDCA presents a generic process improvement philosophy, it is important to remember that the actual improvements will need to be carried out using other quality improvement tools and techniques.
Page 55 of 102

PDSA: A variation of the PDCA proposed by Deming, late in his career, is as follows: Plan. Recognize an opportunity and plan a change. Do. Test the change. Carry out a small-scale study. Study. Review the test, analyze the results and identify what you’ve learned. Act. Take action based on what you learned in the study step: If the change did not work, go
through the cycle again with a different plan. If you were successful, incorporate what you learned from the test into wider changes.
PDCA in PDCA Concept: With time the concept of PDCA has undergone key interpretations. One of the most significant interpretations is the PDCA within the PDCA. In the Plan phase there is an
embedded PDCA. You need to plan to plan, do the plan, check on the plan, and act on the difference. Similarly in the Do phase you need to plan the doing, do the required, check the doing, and act on the difference.
Another interpretation of the PDCA in PDCA refers to the larger wheel being a strategic or business level PDCA. The inner PDCA is the operations or project level. The inner wheel could also refer to unit level goals/metrics while the larger wheel could refer to the overall organization.
The Ramp of Improvement: This is a graphical representation of the PDCA cycle in the improvement process. As each PDCA cycle comes to completion, a new PDCA cycle is initiated. This is integral to the continual improvement philosophy.
SummaryThe PDCA cycle provides a generic framework for improvement of a process. It can be used to guide an improvement project or to improve a process. The cycle can be adopted to develop projects once the one level of improvement has been achieved. PDCA is a cyclic dynamic model. The end of one phase embarks the beginning of the next phase. It follows the spirit of continuous improvement.
Page 56 of 102
Juran’s Quality TrilogyJuran is often referred to as the Guru of Gurus. His contribution to the subject is fundamental. He has made significant contributions in the field of management theory, human resource management and consulting. Among his key contributions is the Quality Trilogy.
Juran’s Quality trilogy, published in 1986, is globally accepted as for a fundamental way to understand quality management. The Trilogy, developed after years of research presents in a clear manner how the processes of planning, control, and improvement are interconnected. The Trilogy defines managing for quality as three basic quality-oriented, interrelated processes: Quality planning Quality control Quality improvement
Quality Planning relates to designing the product, processes, and goals for a process. Quality Control relates to meeting the identified goals. Quality improvement relates to challenging the goals and exceeding them through structured improvement methods.
Practitioners suggest that the entire subject of quality management can be summarized in the Trilogy.
Several concepts are embedded in this timeless diagram. Some key ones are: Design leads to the minimum expected quality level All process have an inbuilt chronic waste Processes experience sporadic spikes in waste Structured quality improvement can lead to a new level in process performance.
Juran also detailed a series of steps for each process. These are:
Quality Planning 1. Identify the Customers 2. Determine customer needs 3. Develop product features 4. Establish quality goals 5. Develop a process 6. Prove process capability
Quality Control 1. Choose control subjects (what to control) 2. Choose units of measurement 3. Establish measurement 4. Establish standards of performance 5. Measure actual performance 6. Interpret the difference (actual versus standard)
Page 57 of 102

7. Take action on the difference
Quality Improvement 1. Prove the need for improvement 2. Identify' specific projects for improvement 3. Organize to guide the projects 4. Organize for diagnosis - for discovery of causes 5. Diagnose to find the causes 6. Provide remedies 7. Prove that the remedies are effective under operating conditions 8. Provide for control to hold the gains
While teaching the Trilogy, Juran presented an interesting analogy to finance. According to him the subject of finance can be understood through three processes of planning, control, and improvement.
Process Who is involved? How often is it done? OutputFinancial planning Senior Management Annually BudgetFinancial control All Daily Maintain standardsFinancial improvement Teams/Task forces Project by project Cost reduction
If you apply the above learning to quality process, the following appears:
Process Who is involved? How often is it done? OutputQuality planning Senior Management Establishing a process Process capabilityQuality control All Daily Maintain standardsQuality improvement Teams/Task forces Project by project Quality improvement
Page 58 of 102

8.2 Total Quality ManagementTotal Quality Management is often confused as a technique. In absence of a definitive body of knowledge such confusion is at times valid. Unlike concepts such as Total Productive Maintenance (JIPM, Japan) and Six Sigma (Motorola, GE, Six Sigma Academy etc.) there is no single body of knowledge for TQM.
Some key interpretations of TQM can be summarized as:
Total Quality Management (TQM) can be defined as a management strategy aimed at institutionalizing a quality mindset across the entire organization. TQM has been widely used in manufacturing, education, government, and service industries The International Organization for Standardization (ISO) defines TQM as a management approach for an organization, centered on quality, based on the participation of all its members and aiming at long-term success through customer satisfaction, and benefits to all members of the organization and top society. As a general guideline, TQM requires that the company maintain this quality standard in all aspects of its business. This requires ensuring that things are done right the first time and that defects and waste are eliminated from operations TQM provides a platform for management and employees to get involved in the continuous improvement of goods and services. It is a combination of quality and management tools aimed at increasing business and reducing losses due to wasteful practices.
Juran defined the four objectives of TQM as: Delighted customers Empowered employees Higher revenue Lower cost
Juran also emphasized on the need for a set of processes, an infrastructure and a foundation for the above objectives to be achieved.
TQM is infinitely variable and adaptable. Although originally applied to manufacturing operations, TQM is now recognized as a management approach applicable to any sector. The subject has evolved with time and every new application it was used for. However, fundamental principles have remained consistent. These are: Commitment by senior management and all employees Meeting customer requirements Reducing development cycle times Just In Time/Demand Flow Manufacturing Improvement teams Reducing product and service costs Systems to facilitate improvement Line Management ownership Employee involvement and empowerment Recognition and celebration Challenging quantified goals and benchmarking Focus on processes / improvement plans Specific incorporation in strategic planning
While it is today very difficult to bind TQM to a body of knowledge, the following attempts to present the key topics in an organized structure.
Management Commitment Plan (drive, direct) Do (deploy, support, participate)
Page 59 of 102

Check (review) Act (recognize, communicate, revise)
Employee Empowerment Training Suggestion scheme Measurement and recognition Excellence teams
Fact Based Decision Making SPC (statistical process control) DOE, FMEA The 7 statistical tools TOPS (FORD 8D - Team Oriented Problem Solving)
Continuous Improvement Systematic measurement and focus on CONQ Excellence teams Cross-functional process management Attain, maintain, improve standards
Customer Focus Supplier partnership Service relationship with internal customers Never compromise quality Customer driven standards
Continuous Improvement and TQMContinuous Improvement is an integral element of TQM. It is through continuous improvement that the key objectives of TQM are achieved. TQM addresses improvement in all work, from high level strategic planning and decision-making, to detailed execution of work elements. This is based on the premise that mistakes can be avoided and defects can be prevented. This leads to improved results, in all aspects of work, as a result of improved capabilities, people, processes, technology and process capabilities.
ConclusionWhile, there is no formalized body of knowledge for TQM, the works of Juran, Deming, Crosby, Feigenbaum, Ishikawa etc. can be considered all encompassing.
Key principles of TQM include: it is a discipline and philosophy it aims at institutionalizing planned and continuous improvement quality is the outcome of all activities that take place within an organization all functions and all employees have to participate in the improvement process organizations need both quality systems and a quality culture based on the assumption that 90 percent of problems are a result of process, not employees places responsibility for quality problems with management rather than on the workers. aims at management of process variation through treatment of special and common causes
The primary objective of TQM is the continual improvement of processes, achieved through a shift in focus from outcomes (or products) to the processes that produce them. TQM achieves its objective through data collection and analysis, flow charts, cause and effect diagrams, and other tools which are used to understand and improve processes.
Page 60 of 102

8.3 Japanese MethodsThe Japanese contribution to Quality has often not received the attention it deserves. The Japanese have contributed through methods such as Kaizen, QC Circles, 5S, QFD, SMED, etc. More importantly the Japanese have contributed by applying Quality concepts and methods more than any other nation.
KaizenApart from giving the world a living example of the power of quality, Kaizen is perhaps Japan’s most important contribution to quality. Kaizen, a Japanese management philosophy, promises big rewards through continuous incremental change. Kaizen means continuous improvement taken from words 'Kai' meaning continuous and 'zen' meaning improvement. Another translation of Kaizen is Good Change ('Kai' to mean change and 'zen' to mean good, or for the better). Kaizen can be seen as a soft and gradual method of incremental improvement by eliminating wastes, involving everyone from mangers to workers, and using common sense.
Masaaki Imai made the term famous in his book, Kaizen: The Key to Japan's Competitive Success.
Kaizen is popular as a process where individuals suggest and carry out small improvements in processes. While most Kaizen are carried out by individuals, the method does not restrict teams to participate in the process. Also, while the method is more suited for small/incremental improvements, it does not restrict making large/breakthrough improvements.
The steps involved in Kaizen can change from organization to organization. However, the key principles will be: Improvement idea is identified by individual or small team It is submitted to a review council If found suitable, the idea is implemented The individual/team who suggested the change is rewarded.
Variations of the above can be more rigorous in the manner in which ideas are admitted, team size, review process, tools used, structure, etc. Many companies erroneously run Kaizen as a Suggestion Scheme. This is a sub-optimal usage of a powerful concept of Kaizen.
Quality Control (QC) CirclesDeveloped in the 1950s by Kaouru Ishikawa, the Quality Circle is another very popular adaptation of a quality technique by the Japanese. QC Circles were developed as a means to involve workmen in the quality improvement journey. Initially, participation was mandatory. Workmen were introduced to a simplified quality improvement process and basic quality tools. These teams then identified chronic problems and attacked them in a structured manner. The concept was hugely successful and is still followed in all major Japanese companies.
5SAnother popular Japanese quality concept is the 5S concept. The concept looks at elimination of wastes (muda) and inefficiency through good housekeeping. The key terms here are: Seiri –tidiness Seiton –orderliness Seiso –cleanliness Seiketsu –standardized clean-up Shitsuke -discipline
The key benefit of 5S is a clean and organized work-place. In the manufacturing sector this is of immense value. This concept has off late gained popularity in the service sector such as banks and branch-based organizations also.
Page 61 of 102

CMMi The Capability Maturity Model – Integrated (CMMi) is a framework for software development process improvement. Developed by the Software Engineering Institute (SEI) of the Carnegie Melon University, the CMMi is widely accepted as the model of choice of the Software Industry. The model is organized around five levels of maturity. Level 5, the highest, is called the optimizing level. It is at this level that the model expects continuous improvement to be embedded in the software development process of an organization.
At CMMi Level 5 the model expect an organization to have:
1 Processes are continually improved based on a quantitative understanding of the common causes of variation inherent in processes. 2 Maturity level 5 focuses on continually improving process performance through both incremental and innovative technological improvements. 3 Quantitative process-improvement objectives for the organization are established, continually revised to reflect changing business objectives, and used as criteria in managing process improvement. 4 Both the defined processes and the organization’s set of standard processes are targets of measurable improvement activities. 5 Process improvements to address common causes of process variation and measurably improve the organization’s processes are identified, evaluated, and deployed. 6 Improvements are selected based on a quantitative understanding of their expected contribution to achieving the organization’s process-improvement objectives versus the cost and impact to the organization. 7 A critical distinction between maturity level 4 and maturity level 5 is the type of process variation addressed.
The two Process Areas (basic building blocks of the model) at CMMi Level 5 are:
Page 62 of 102
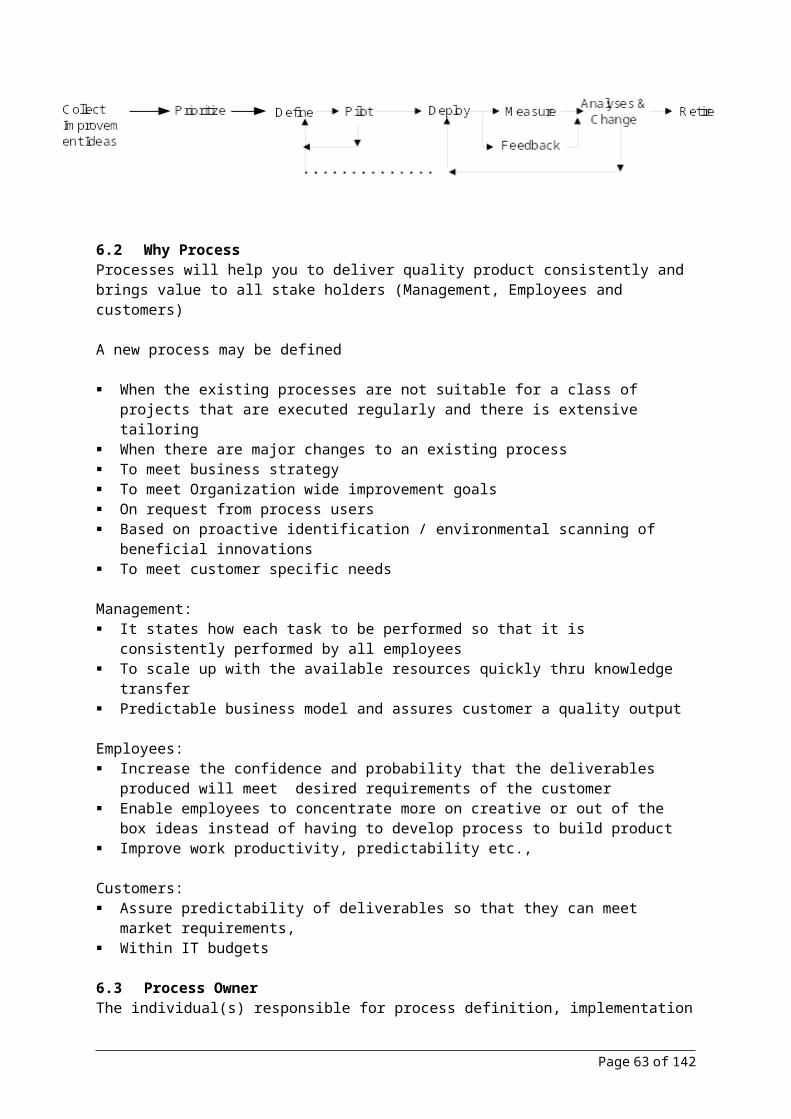
Organizational Innovation and Deployment Causal Analysis and Resolution
Both these Process Areas are critical also building blocks of quality improvement.
At level 5 the CMMi model refers to innovative/large improvements and Incremental /small improvements.
The CMMi model is discussed in detail earlier in this material.
Source: www.sei.cmu.edu .
Page 63 of 102

8.4 Six Sigma In the last 15 years, no other management method, has delivered as much business benefit as Six Sigma. Referred by many as TQM on Steroids, Six Sigma has rapidly become the methodology of choice for quality improvements globally. Developed as an improvement methodology to address the need for rapid improvements at Motorola, the Six Sigma methodology gained immense popularity when Jack Welch and GE through their weight behind it.
What is Six Sigma?Six Sigma is both a management method and a statistical term. As a management method it is helps an organization to systematically identify key improvement areas and then apply a structured method to carry out an improvement project using statistical and managerial tools. As a statistical term Six Sigma is a measure of process capability of a process. Statistically, a process at Six Sigma levels will deliver only 3.4 defects per million opportunities (DPMO). In real world scenarios this is almost zero-defects.
If one combines the management method and the statistical perspectives, one can understand Six Sigma as a management method that can help an organization improve its process to such an extent that they will deliver only 3.4 DPMO. An “opportunity” is defined as a chance for nonconformance, or not meeting the required specifications. This means we need to be nearly flawless in executing our key processes. Six Sigma is a vision we strive toward and a philosophy that is part of our business culture.
Note: Six Sigma can be used as a measure of Process Capability. Defects per Million Opportunities (DPMO) and Parts per Million (ppm) are similar concepts.
Starting as a quality improvement methodology, today Six Sigma is seen as a Customer-centric, Systematic and Data-driven management methodology. It is a now method for doing things better, delight customers, and increase a company’s profits. Above all it is a driver of cultural change and improvement.
Often, our inside-out view of the business is based on average or mean-based measures of our recent past. Customers don’t judge us on averages, they feel the variance in each transaction, and each product we ship. Six Sigma focuses first on reducing process variation and then on improving the process capability. Customers value consistent, predictable business processes that deliver world-class levels of quality. This is what Six Sigma strives to produce.
At its core, Six Sigma revolves around a few key concepts. Critical to Quality: Attributes most important to the customer Defect: Failing to deliver what the customer wants Process Capability: What your process can deliver Variation: What the customer sees and feels Stable Operations: Ensuring consistent, predictable processes to improve what the customer sees
and feels Design for Six Sigma: Designing to meet customer needs and process capability
History of Six SigmaSix Sigma originated at Motorola in the mid 1980s in response to the challenges it faced from it Japanese competitors. Bob Galvin, the then Chairman of Motorola wanted their quality to improve by 10 times in 3 years. While working on a project to achieve this goal, an Engineer, Bill Smith, proposed a common statistical metric to measure the performance of manufacturing processes. This metric was ‘standard deviation’ or sigma (Greek alphabet – used in mathematics to denote standard deviation). He and his team then developed the concept of Six Sigma as a metaphor for zero defects. They then refined the then popular Juran’s quality improvement method and included a range of
Page 64 of 102
Sigma Level PPM2 308,5373 66,8074 6,2105 2336 3.48 0.2Process Capability DPMO
statistical analysis in the methodology. And a new methodology was born. This was later named Six Sigma and registered as a trade mark by Motorola.
In the late 1980s consultants including Mikel Harry propagated this wining formula of Motorola. This method traveled to Allied Signal and from there to GE. It was at GE that this became a ‘way to work’. Once convinced of the power of Six Sigma, Jack Welch drove the Six Sigma program from the top and made a range of management decisions that made it essential for managers to embrace Six Sigma. Thereafter it was only a matter of time for Six Sigma to attain global popularity.
The Six Sigma journey can be summarized as: 1987 – Motorola Six Sigma journey 1989 – Six Sigma Research Institute established 1991 – Allied Signal & GE take up Six Sigma 1992 – First Black Belts in Asia & the US 1995 – Polarid & others start Six Sigma 1995 onwards – Adopted globally as a quality methodology for better business results.
Six Sigma Project TeamsSix Sigma improvement projects get done through project teams. Each project team includes about 5 to 8 individuals. These individuals must have prior training on Six Sigma for them to be useful in the project. Each team must have a leader and an expert on the methodology and tools of Six Sigma.
The project team meets on a defined frequency, generally once every week for about 2-3 hours. The team then uses the Six Sigma steps described later in this chapter. As a guideline a typical Six Sigma project is completed in about 4 to 6 months.
Six Sigma Competency ModelSix Sigma uses a competency model, interestingly, modeled around usage of the word ‘Belt’ borrowed from the martial arts. The key roles in this model are:
Role Knows ManagesGreen Belt Basics of the methodology
and tools.Team members or Team leader for basic projects
Black Belt Advanced tools including applied statistics, team work, and project management.
Team leader for advanced projects or guide for basic projects
Master Black Belt Application and assessment of advanced tools.
Guide for the overall program and all projects
Champion Business issues and how Six Sigma connects to the business.
Champions the cause of Six Sigma
The above roles must be seen as different and not in a hierarchy.
The Six Sigma Improvement MethodologySix Sigma improvement methodology is organized in five key steps. These are Define – Measure – Analyze – Improve – Control. Popularly referred to as DMAIC this methodology has further steps that combine to make an organized approach.
There are many versions of the DMAIC in practice today. DMAIC itself is not a standard term for the improvement journey. For several years MAIC was the standard. GE Capital added the D to the process. Other variants include PCOR (prioritize, characterize, optimize, and realize) from AIR Academy, RDMAIC (Recognize, DMAIC) from Six Sigma Academy, and GETS (gather, evaluate, transform, and sustain) from GE Transportation Systems.
Page 65 of 102

Page 66 of 102

The key steps of a generic Six Sigma methodology can be summarized as:
Steps Key Activities/Tools Key Output(s)DefineIn the define phase the customer needs are stated and the process and products to be improved are identified.Create problem statement Define process to improve
Define project objectives Identify project stakeholders Identify customers
Problem statement Project scope Project goals
Identify CTQs CT trees Identified customer needsDefine performance standards Identify performance measures
Financial analysis High-level process mapping
Gap analysis Project charter High-level process map Definition of performance measures
MeasureThe measures phase determines the baseline and target performance of the process, defines the input/output variables of the process, and validates the measurement systems.Understand process and validate measurement system
Process map the as is process Identify process inputs and outputs Collect data Evaluate measurement system of process y’s
Detailed process map Identified process output variable Identified
process input variables Validated performance system Data collection and sampling plan
Determine process capability Control charts on process y’s Capability analysis Graphical techniques
Baseline control charts Baseline capability DPMO and Z value
Finalize performance objectives
Cause and effect analysis Create FMEA Review of project goals and plan
Revised project goals Quantitative project objectives Validated financial goals Revised project plan Causes and effect relationships Prioritized risk
AnalyzeThe analyze phase uses data to establish the key process inputs that affect the process outputs.Identify sources of variation Detailed process map
Brainstorming Fishbone diagram, Cause and effect matrix FMEA SPC on x’s and y’s MSA on x’s
Identified sources of variation Identified potential leverage variables Updated process map Updated FMEA
Screen potential causes Graphical analysis Hypothesis testing Multi-vari analysis Correlation and regression analysis
Potential x’s critical to process performance Identifies improvement opportunities Data on KPIVs Statistical analysis of data
ImproveThe improve phase identifies the improvement to optimize the outputs and eliminate/reduce defects and variation.Determine variable relationship y = f (x)
Design of experiments Regression analysis ANOVA simulation
Relationships between x’s and y’s KPIV setting for optimum process outputs and
minimum variation
Establish operating tolerances Establish relationships between x’s and y’s Use optimum settings for x’s Determine new process capability Cost/benefit analysis
Optimum robust settings for x’s with tolerances
Updated project plan Established implementation plan
Confirm results and validate improvements
Confirmation experiments Process maps MSA Control chards Process capability Corrective actions
Updated process maps, FMEA, data collection Pilot run Validated measurement systems after
improvements Improved capability
ControlThe control phase documents, monitors, and assigns accountability for sustaining the gain made by the process improvements.Redefine process capabilities Control plan SPC on x’s and y’s
Capability analysis Control plan Control charts DPMO and Z
Implement process control Mistake proofing Standard procedures Accountability and responsibility audits Finalize transition to process owner FMEA and Preventive maintenance
Validated control process Sustained performance Monitoring plan Recalculated FMEA System changes to institutionalize
Complete project documentation
Financial validation Team meeting with stakeholders and customer Project tracking completion Identify replication of project result opportunities
Lessons learned and best practices Communicated project success Project report and Executive summary Final deliverables
Page 67 of 102

Customer feedbackSix Sigma @ Zymcwj Zymcwj adopted the Six Sigma methodology in the early 2000s. Over the years it adapted the generic Six Sigma methodology to the IT services environment after learning from the initial projects. This Zymcwj version of Six Sigma was christened – BrITe.
The key steps of the BrITe methodology are:
Define Phase1. Identify CSF’s – CSAT , VOC, Customer statements, High risk factors, SLAs etc. Y = f ( x1, x2, …, xn)2. Develop Project Charter –Project scope, goals, benefits, milestones, roles / responsibilities3. Define Process Map – steps ‘as-is’ , key CSFs / variables at each step
Measure Phase4. Select CSF characteristics – measurement standards
QFD, Process Map, FBD, C&E Matrix, FMEA5. Define Performance Goal – Client defined / Industry Class – should be measurable which will be used for
Operational definition, target / spec. limits, defect detection6. Response Variable Measurement Analysis
Gage R & R, FMEA
Analyze Phase7. Process Capability for CSF – stability of CSF
Cp, Cpk, SPC - converting attribute data into DPMO8. Define Performance Objective – target for improvement in CSF
Benchmarks9. Identify Sources of Variation inputs – identify key input sources
Hypothesis Tests
Improve Phase10. Screen Potential Causes – vital input variables
Screening DOE11. Uncover Variable Relationships – proposed model
Factorial design12. Establish Operating tolerances
Statistical Tolerancing/Simulation/Response Surface Methodology
Control Phase13. Validate Measurements
Gage R & R14. Determine Process Capability15. Implement Process Control
SPC Charts / Mistake Proofing / Documentation Mistake proofing – either detect when errors are about to occur or Prevent errors from
happening
Currently, all Business Units of Zymcwj have adopted the BrITe methodology.
BrITe received a registered trademark in early 2006.
Page 68 of 102

9 Metrics and Measurement
"You can't control what you can't measure"
Tom DeMarco, Controlling Software Projects: Management, Measurement & Estimation, 1982, Yourdon Press
The primary purpose of a measure is to help assess extent of progress. This progress could be against plans, goals, objectives, mission, or vision. For every transaction in real life, various measures are being used for decision making. For example when one buys a used car, typical measures looked at are, year of manufacture, distance driven, and number of owners etc. These become the key inputs for negotiating or decision making. In software too, measures play a key role in predicting outcome and measuring progress in projects, analyzing deficiencies and so on. E.g. measures for software development are quality, productivity, customer satisfaction, etc.
9.1 Measure and MetricA measure is single quantitative attribute of an entity. It is often referred to as a parameter also. A measure is directly measurable using a measurement system. For meaningful comparison measures must be expressed in numbers. Examples of a measure include effort, defect, size etc.
Measures must be expressed in a consistent and standard manner. This consistency is achieved through having a standard unit of measure.
A metric is derived from a combination of measures. A metric is not directly measurable through a measurement system. It is calculated. Since a metric is a combination of two or more measures, it brings normalization for comparison across sources and aids management to take a decision. For example, productivity of developing software is a ratio of size and effort (Function points/ person months) and defect rate is a ratio of defect and effort.
9.2 Objective and Subjective MeasuresMeasures are broadly classified as - Objective and Subjective.
Objective measures uses data that can be obtained by counting, stacking, weighing, timing, etc. Examples include number of defects, hours worked, or completed deliverables. Since objective data is an expression of true value of the data it will remain same for different people measuring it. Example: Lines of code in a program will remain same irrespective of how many people count it. Similarly the distance from one place to another will remain same for the same measurement system.
Subjective measures are based on observation and perception. It is based on feelings and opinion. . Examples of subjective data include user friendliness, look and feel, etc. The subjective measurement is likely to change values across users. In fact it is unlikely that the same user returns identical values when measured across time. While some levels of inconsistency is impossible to remove, we can improve this consistency by better training, use of clear guidelines, etc. Example: User rating on usefulness of software in a scale of 1 to 7 is a subjective measure. As explained, one user might be delighted where the other may perceive it to be mediocre. Rating might significantly vary. However, a guideline that states what signifies 7, 6 etc., will help reduce variation
Objective measures are often referred as quantitative data while subjective data is referred to as qualitative data. Objective data is easy to present and communicate. However, a more meaningful opinion can be generated using subjective data. While management will need objective data to assess progress it will always need subjective data to make a decision. As professionals one needs to understand the balance between objective and subjective data.
Practice QuestionsIs it an objective or subjective measure?
Page 69 of 102

Experience Level of a programmer Skill level of a programmer Development time Development process maturity
9.3 Levels of MeasuresNature of analysis is dependent on the type of data or measure. Hence the first question in data analysis needs to be – what type of data are we working with? Answer to this question will help you decide the tools and methods for analysis.
Measures can be categorized in four levels. These are nominal, ordinal, interval, and ratio. The following paragraphs present a basic understanding of these levels.
Nominal: Nominal measures are those that cannot be used for arithmetic operations. It can only be listed and categorized. The word nominal is derived from the word name. Imagine listing names of all people in your family. You can only list them but not put them in any order unless you apply criteria like age or alphabetical order. You can however examine if one data is similar to the other in nature.
Ordinal: The word ordinal is derived from order. Thus ordinal measure points can be placed in an order or ranking. In such a ranking distance from one rank to another does not convey any meaning. For example a highly skilled programmer does not have double the skill of a lesser skilled programmer. While a rank can be established it is not meaningful to establish a ratio.
Interval: Interval measure can be ranked and expresses meaningful difference between two values. Thus the distance from one value to another has a consistently understood meaning. However, a ratio of such values will not be meaningful. In case of temperature we can say the difference between 50 Fahrenheit and 100 Fahrenheit is 50 but we cannot conclude that the degree of heat is double. J. McCabe’s complexity metric is an example of an interval scale.
Ratio: Ratio measure allows us to calculate meaningful ratios amongst its values. For example an escaped defect density of 4 is double that of 2. Also, a ratio type data can have a zero value while other data types described earlier cannot.
As a quality professional we must be able to consider the level of measure when designing a measurement and analysis system. On a client satisfaction score of 3.5 in a scale of 5, one can not set a goal to improve by 20%. Satisfaction score being ordinal value is not amenable to multiplication and division. If you need data where mathematical operations are to be performed to you should prefer ratio type data.
9.4 Attributes of a good measureGood, useful, and effective measurement must be able to help predict performance and not just describe it. To predict we will need to conduct an analysis on the data. Thus, such data must be clearly defined, objective, easy to obtain, true representation of the measured parameter, and robust in nature. Robustness in this case refers to the ability to absorb minor changes in the process or product parameters.
Good measurement is heavily dependent on the measurement system. A measurement system includes the method to be used, the tools/sensors, the recorder (automatic or manual), and the ambient conditions. In most cases the utility of the measurement is impaired by the variations in this measurement system.
For meaningful analysis all measures and metrics must be tested on the following attributes: Simplicity represents the ease and simplicity in capturing the measurement data
Page 70 of 102
Validity refers to the extent to which a measure actually represents what it was meant to measure. For example when measuring…
Timeliness of measurement refers to the ability of the measurement to provide the measurement in time for it to be useful in decision making
Consistency – This refers to two people measuring the same entity return the same values. Variations in the measured value may be due to measurement method, including human error. Where possible, consistency of measure could be achieved by automated measurement systems.
Calibration refers to the continued suitability of the measurement system to return valid measurements. This could include changing the measurement system and/or the method.
Before introducing types of software metrics, let us see some key terminologies that are used and misused as well.
Efficiency & Effectiveness: Efficiency is w.r.to time that indicates how quick the outcome has been achieved. Effectiveness is how good the outcome has been achieved. Hence it is the relative picture of how it was performed with respect to how well it could have been performed. E.g. review effectiveness and review efficiency. Both are entirely different metrics and should not be confused.
Density & Rate – Density is with respect to size while rate is w.r.to effort. For e.g. defect rate (defects/hour of work) & defect density (defects/FP or defects/LOC). Of the two, size is the best option for normalization. However, effort metric is easier obtained compared to software size metric
9.5 Types of Software MetricsFor metrics to be useful and results comparable across software development lifecycle stages, it is essential to define these metrics. Effective use of metrics through a consistent measurement system is of great help to the management in controlling and monitoring progress of a project/program.
Across industries there is generic categorization of metrics as metrics for Product, Process, and Service. In the software industry too, all these metrics play a vital part. Measuring these metrics helps in estimating effort, cost, schedule adherence, productivity, and quality of the software being produced. By measuring these metrics we allow us an opportunity to manage, control, and improve them.
While there is no doubt about the importance of metrics in the software process, like in most industries, there is little unanimity in the definition of these metrics. This is perhaps a price the software industry pays for still evolving on a process maturity continuum. Industries in the manufacturing sector have already achieved significant unanimity in definition of metrics.
Metrics in software vary based on the kind of work being undertaken. Two broad classification of work is development and maintenance. Maintenance is ongoing while development has a fixed scope and time. Metrics produced below are aligned towards development however maintenance will have same or similar metrics under each of these categories
Software Process Metrics Metric that helps judge and improve the process is known as process metric. For eg., estimation accuracy judges the effectiveness of estimation process. Defect removal effectiveness judges the effectiveness of quality control process. In a software development process the following are the commonly used process measures
Productivity – Size per function point (Size in function points (FP)/ Total effort in person months). If a team developed 1500 function points in 10 person months, productivity will be 15 FP/pm
Page 71 of 102

Review effectiveness = (Number of defects detected in reviews at a given stage)/ (Sum of defect injected in that stage + number of defects slipped from earlier stages). Here stage refers to the life cycle phase of the review
Overall Defect Detection Effectiveness % = {(# of defects detected in all reviews and testing excepting user acceptance defects)*100} / (Total # of defects detected in the system (including acceptance defects)).
If in a project there were 1000 defects and 10 defects slipped to customer, defect removal effectiveness will be 99%
Test/Review Efficiency - Efficiency is measured to check whether the time taken to review or test any work product is worth the effort.
Review efficiency = (Number of defects detected in a review stage)/ (Review effort) Test efficiency = (Number of defects detected in a test) / (effort)
If a review found 20 defects in 5 hours of review, efficiency will be 4 defects per hour. Similar for testing, it will denote the number of defects per hour of testing.
Cost of QualityThe cost of quality comprises of two factors: Cost of conformance (prevention and appraisal) and cost of non-conformance (failure).COQ includes the following:
Cost of Prevention - includes training, defect prevention and process improvement activities Cost of Appraisal - includes reviews/inspection effort, testing, audits, etc Cost of Failure - includes any rework caused by delivering bugs to customer plus any rework
after internal reviews and testing.Cost of rework, reviews, prevention and training can be considered as directly proportional to effort. Effort is typically captured in effort tracking tools (e.g. DART at Zymcwj). The cost of Quality can then be expressed as the sum of appraisal, prevention and failure cost as a percentage of total effort for Life Cycle activities. Thus COQ % = (Appraisal effort (Review +Test) + Rework effort + Prevention effort (e.g. Training & defect prevention) * 100
---------------------------------------------------------------------------------------------------------------------------Total effort (for the Project)
Software Product MetricsA software product can be measured at different stages of the life cycle. In the initial stages requirements can be measured to assist in estimation of effort. Further, complexity of the software design, the size of the program, quality etc. can be measured. The key sub-categories of software product metrics include Size, Complexity, Quality, and Customer Perception.
As a general guidance, the earlier in the life cycle a measurement is available, the more useful it is. By nature therefore size and complexity are very useful in controlling and monitoring the software development life cycle.
Software product metrics typically falls into 3 sub categories Size Metrics Complexity Metrics Quality Metrics
While a variety of means exist to measure the software product, some key metrics are discussed here under.
Page 72 of 102

Measures of Software SizeLines of Code and Function Points are the two most common methods for measuring size of software. While LOC can be measured only when the software is produced, Function Points can be estimated in advance.
Lines of Code: LOC is the most common measure of software program size. While this is a simple and easily understood measure, there are variations in its definition. Most of these variations are related to the manner in which one would count blank lines, comment lines, non-executable statements, multiple statements per line, multiple lines per statement, and the issue of how to count reused lines of code. The most commonly used definition is to count any line that is not a blank or a comment. This is done irrespective of the number of statements per line. LOC is a useful indicator of program complexity, development effort, and programmer performance.
Function Points: While LOC is a useful method to estimate size, it is often found inconsistent with the actual effort. Moreover, LOC can be estimated only much later in the software life cycle. Function Points help resolve this issue. Function points (FP) value for a program is calculate by adding the number of external user inputs, inquiries, outputs, and master files, and then applying the following weights: inputs (4), outputs (5), inquiries (4), and master files (10).
A J Albrecht is credited with proposing the FP method for estimating program size.
Apart from being a more logical measure, the key advantage of FP over LOC is that FP can be estimated very early in the software development process.
Measures of Complexity
McCabe’s Cyclomatic ComplexityMcCabe Cyclomatic complexity is the most widely used measure of complexity. Cyclomatic complexity may be considered a broad measure of soundness and confidence for a program. Introduced by Thomas McCabe in 1976, it measures the number of linearly-independent paths through a program module. This measure provides a single ordinal number that can be compared to the complexity of other programs. Cyclomatic complexity is often referred to simply as program complexity, or as McCabe's complexity. It is often used in concert with other software metrics. As one of the more widely-accepted software metrics, it is intended to be independent of language and language format.
Interpretation McCabe Cyclomatic complexity is a good indicator of number of test cases required to cover
the complete program Higher McCabe means high number of paths in the programs which makes the program
difficult to understand Branches in the program to call a subroutine or a paragraph are not to be considered a
contributor to McCabe Case statements like EVALUATE in COBOL can reduce McCabe significantly as structure
case constructs are not considered bad from McCabe point of view.
Halstead Actual Program LengthThe Halstead measures are based on four scalar numbers derived directly from a program's source code:
N1 the total number of operators N2 the total number of operands
Operators can be "+" and "*" but also an index "[...]" or a statement separation "..;..". The number of operands consists of the numbers of literal expressions, constants and variables.
Page 73 of 102
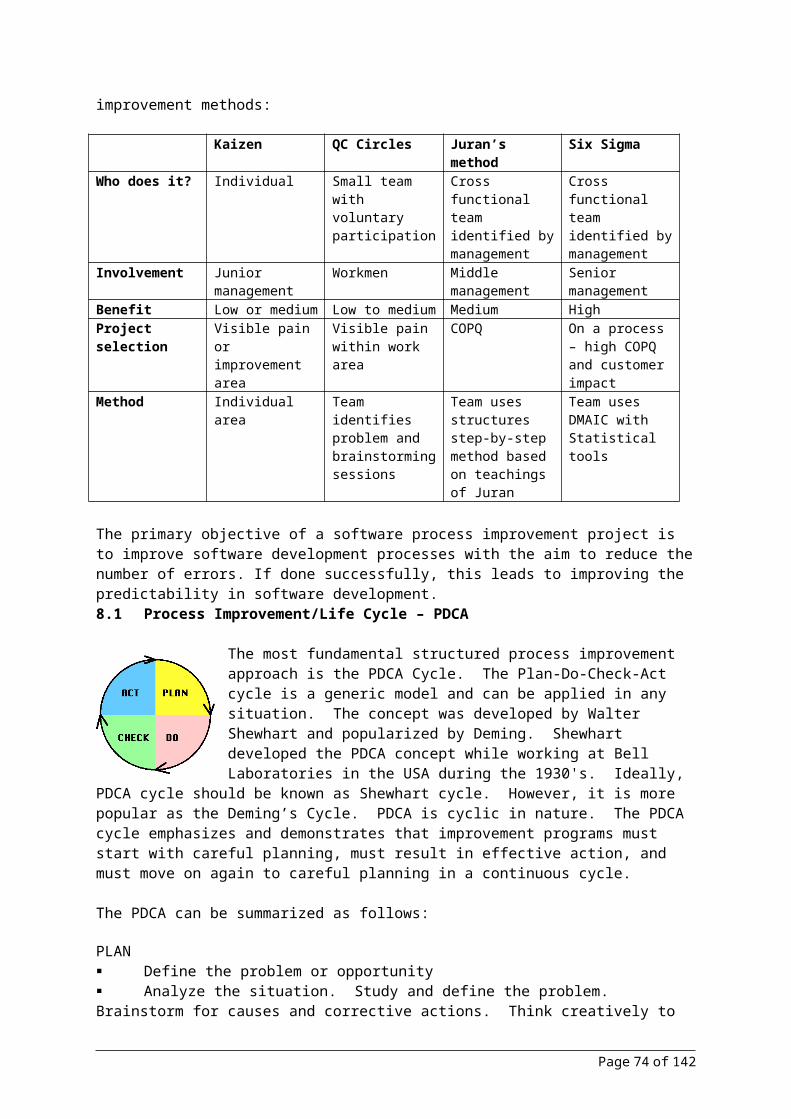
Program length N= N1 + N2
Interpretation Halstead Actual Program Length is a good indicator of computational complexity of a
program Higher Halstead means high number mathematical computations in the programs which
makes the program heavy Splitting the programs into multiple smaller programs can be considered to reduce high
Halstead.
McClure Control Variable ComplexityThe McClure complexity metric is concerned not so much with the number of paths in a program but how complex the tests are that control their selection. It is based on the number of conditions and the number of unique data items used in comparison expressions.
McClure Complexity = the # of conditional branches in a program + the # of unique operands used in conditional branches.
McClure Complexity = B + N.B is the number of conditional branches in a program and N is the number of unique operands used in conditional branches,
InterpretationTo improve McClure value for a particular program, we can look at complex IF statements
The IF statements that have multiple test conditions should be looked at Try to substitute these constructs with nested IF as far as possible Improving McClure value should be done in conjunction with McCabe complexity. E.g.
splitting complex test conditions with nested IF can result in a simultaneous increase in McCabe Complexity.
Measures of QualityThere are multiple attributes that define quality like correctness, reliability, usability, performance, serviceability, capability, interoperability, maintainability etc. The key attributes of quality with respect to operations are correctness and reliability.
Correctness: Correctness is typically the measure of functional correctness. This can be measured during the LC phase. However, overall functionality of the application is measured at the end of the life cycle phasesHence the two metrics correspondingly will be
Overall defect injection metric - Number of reported defects calculated at the end of each lifecycle phase against effort or size
Delivery defect metric - Total number of field defects reported after customer installation at the end of suitable time period against effort or size
Reliability: Reliability is the probability of failure-free behavior in a specific context (executing environment and usage profile) and time period.
Failure density - # of failures with respect to size Failure rate - # of failures with respect to effort MTBF – Mean time between two failures MTTF – Mean time to fail (i.e. average time the system is operational)
Page 74 of 102

Though correctness and reliability are based on defects data, reliability only considers defects that bring down the application or system. Typically these are considered as Critical severe defects or failures.
Customer Satisfaction: Customer satisfaction is a measure based on multiple aspects and not just product or service. However it a good indicator of product or service quality as perceived from the customer.
Software Service MetricsMetrics that help judge and improve the performance of service are service metrics. Typical measure is cycle time. Depending on the nature of service expected, metrics can be any of the following
On time delivery Response Time (Time taken to respond to a user query) Resolution Time (Time taken to resolve an user query) or MTTR (Mean time to repair and
restore the system)
9.6 Organizational view of MetricsMetrics help trigger actions based on events and trends in the organization that guide the organization toward informed decisions. Typically metrics are fall in three broad level
Strategic level Tactical level Operational level
Operational level –Measures are captured typically at operational level and are rolled up to higher levels. Examples of operational data are effort and defect tracked as part of software development/maintenance, revenue as part of billing etc.,
Tactical level – Tactical level is the analytical level or process level. In the hierarchical chain, it is the middle management that pertains to this level. Data from multiple operations and processes are rolled up to achieve this view.
Strategic level – These are metrics that are aligned with strategic or business needs of the organization. These are typically few metrics. Examples include business metrics like overall revenue and margins, critical customer complaints, revenue at risk.
Measurement CycleMeasurement cycle as you see typically has the following steps
Identification of Stakeholder Needs
Formation of strategies Defining Goals & Targets Identifying Indicators Rollup & Analysis Measuring results
Identification of Stakeholder Needs: Metrics acts as the catalyst to propel performance of an organization by aiding fact based decisions
Page 75 of 102

(Management by fact). Typically metrics are aligned with stakeholder needs. Typical stakeholders to an organization are employees, investors, customer, partners and society. Table shows the mapping of their needs and typical indicators.
Formation of Strategies:Stakeholder needs flow as inputs for strategic planning. Strategies are the high level management plan for meeting organizational vision.
Defining Goals and Targets: Based on the strategies goals are identified.
Typically the words “objectives”, “goals” and “targets” are interchangeably used. This typically is a quantitative perspective of the organization’s direction.
Identifying Indicators: In-process metrics are instituted that help track progress of these strategies. Indicators or metrics that helps assess performance may fall into any of the following classifications – leading & lagging indicators.
Leading Indicator – This is a metric that has a direct impact on either a) performance or b) other emergent metrics. Leading indicators are typically internal. Leading indicators help take proactive steps midcourse to achieve performance.
Lagging Indicator – This is a metric that is the result of a change in one or more leading indicators. Lagging indicators are typically result metrics. At an organization level they are not unique to an industry or company (e.g. customer satisfaction, revenue growth etc.). Lagging indicators can usually not be adjusted until after it is too late. One lagging indicator might be a leading indicator in another context e.g. ESAT is a lagging indicator for employee result while it has been noticed that it is a good lead indicator for customer satisfaction.
Metrics can fall into any of these categories – Approach, Deployment or results. There should typically be metrics on all three aspects to judge progress. Goals will be the result metrics. For large programs that might take years to deliver results, measures of approach and deployment will be leading indicators for a successful result. Let us consider a course being developed like this. Approach metric will be # of skill elements present in the course, # of subject matter experts participating etc. Deployment metrics will be # of sessions conducted, #of batches, and #of people cleared the certification etc. Result metrics will be reduction of defects in projects driven by certified professionals and revenue generated through the course etc.
Setting appropriate attributes for the measures is a key step for analysis. Analyzing a problem or defining a strategy needs an ability to drill down. 80/20 rule applies in performance too. Not all sections of an organization perform to the same level. Hence it is imperative that these weak sections are identified. Segmentation analysis helps rollup or drill down to each segment so that comparison can help identify the areas to focus. At organization level, segmentation and aligning metrics happens as early as strategic planning level (e.g. market segments, functional units in an organization). However there can be multiple sub segments to aid analysis. Segmentation is direct output of multiple attributes. The following example will help the importance of attributes. 1000 defects in a program may not covey the impact. Assume if the data was presented as this – Out of 1000 defects 50% is injected in requirements, 80% are critical severity, 60% detected in system testing. From this it is obvious that product is of poor quality & requirements process is weak and all initial test stages are weak as well. The three attributes – stage injected, staged detected and severity has brought these
Page 76 of 102
Stakeholder Key Expectation Sample IndicatorsInvestor Investor Satisfaction Earnings Per Share
DividendTransparency
Employee Employee Satisfaction SalaryWork environmentTransparency
Customer Customer Satisfaction Value for MoneyQualityOn time deliveryRelationship
Partner Value for money PriceTransparency
Society Impact on Society

insights. Revenue will have attributes like the client from whom the revenue is received, time period, partners involved and so on. A set of proper attributes will help segment the data for better decision making. However, it is a fine balance between cost of tracking the metrics and the flexibility required. It depends on the business context. It is suggested to be conservative and build higher flexibility to the system as cost of changing systems to accommodate new attributes is a tedious change process.
Rolling up & Analysis: As explained earlier, Measures are rolled up to process and at organization level. However, another dimension is the rollup based on levels of hierarchy – middle management level and top management level. Middle management too may have multiple levels depending on the levels of hierarchy. These are typically called Dashboard. The key considerations for the metrics chosen in the dashboard are
Number of parameters are to be few (say 4 – 6 parameters) Parameters chosen should be reflective of the scorecard of manager Rollup of data typically should be automated for efficiency and effectiveness of decision
making process.
Understanding Central tendency: There are three measures of central tendency - mean, medium, and mode. The mean is the arithmetic average of the data in the population; the medium is the data at which half the items in the population are below this item and half the items are above this item; and the mode represents which items are repeated most frequently.
Mean is the most commonly used measure of central tendency. Mean is easy to compute and is strongly influenced by extreme values. Hence it is to be used when data is believed to spread evenly. Median is not affected by extreme values. Hence median is preferred in cases where data points are believed to be bunched within the spread. Mode should be used when the most repeated data point could be considered as the representative of the data. Hence choice for measure of central tendency depends on the nature of data available.
Consider the following Scenario There are 10 applications maintained by a IT unit. The Manager needs some measure to
compare complexity levels. Using that information, necessary improvements could be identified and implemented.
What is the typical variation in the duration of knowledge transfer phase between the client and IT vendor?
Cost per function point is being analyzed. There are variations but mostly it is X $/FP
All the scenarios above indicate a need of some measure of central tendency. For the first case, to get an understanding of complexity level, a simple average of complexity level might give a picture. Duration of knowledge transfer is a highly varying parameter as it is dependent on multiple parameters. Hence Median would be a best choice. On the last scenario, there is a certain cost per function point that is normally incurred that is the same in many cases. Hence Mode will be the best choice
Let us consider this scenario. A set of architects are evaluating multiple options for the architecture of the new application to be developed. The parameters for evaluation are – scalability, performance, ease of implementation and cost. However, the importance of these parameters is not same for the given context. Each parameter is scored on the scale of 1-5. Mean, Median or Mode will not give the central tendency as the weightages for each of the parameter is different. A weighted average will be the best option to get the overall score from each evaluator.
9.7 Understanding VariationHaving understood mean, let us look at the scenarios below.
Page 77 of 102
Projects IBU 1 IBU 2P 1 72 61P 2 73 72P 3 76 76P 4 76 76P 5 78 90Mean 75 75Median 76 76Mode 76 76

% of non defective code across two units is given. Mean, Median and Mode are the same. In reality, are they same?They key here is a variation. First unit is consistent while the other unit is inconsistent. A measure of variation will help explain this phenomenonThe two measures of variation are the range and variance. A third measure the standard deviation is a derivative of variance. Range is defined as the difference between the maximum and minimum values in a data set. Standard deviation is defined as the expected distance of a value from the mean of the data set. The topic of standard deviation is covered in some detail in the section on basic statistics.Range is a useful measure of variation when the number of points in the data set is few (typically less than 10). However, as this number increases Range ceases to be a useful measure. Also, range doesn’t consider all the data as only the maximum and minimum is considered. Variance is average of the square of difference from the mean. It takes into consideration all the observations. Square root of variance is standard deviation. This is a most widely used measure for variation.
A common question is, to what extent variance in a data can be accepted before using it for decision making. Relative measure of spread ‘CV’ (Coefficient of Variation) helps answer the question.
Coefficient of variation = standard deviation / mean
If CV is greater than 0.5, variation in data is high that it should not be used as such
Tackling Variation: Variation is the root cause in many cases of failure. Processes bring in standardization thereby reducing variation and improving predictability. This brings in the element of control of process. Shewart defined control as “A phenomenon will be said to be controlled when, through the use of past experience, we can predict, at least within limits, how the phenomenon may be expected to vary in the future. Here it is understood that prediction within limits means that we can state, at least approximately, the probability that the observed phenomenon will fall within the given limits” An important aspect to note is that control is not absence of variation. It is about predictable variation. A controlled process isn't necessarily a sign of good management, nor is an out-of-control process necessarily producing non-conforming product. To understand it better, explanation of causes of variation will help. There are two causes for variation – Common and special causes.
“Special cause” is a term coined by Edward Deming. Walter A.Shewhart originally used the term “assignable-cause”. These are external to the process. It means that they do not occur on a frequent basis and is a rare occurrence. It has a disruption to the normal operation of the system. However, it can be on the positive or negative side as well. It is typically traceable to known factors such as environmental conditions or inputs issues and can be positively removed.
Examples Termination of computer batch operations due to power outage Power outage causing severe impact in system availability Outbreak of a disease causing sudden spurt in absenteeism
“Common cause” the term was coined by Harry Alpert in 1947. Walter A. Shewhart originally used the term “chance cause”. These are causes inherent to a process or sometimes referred to as noise within the system. Hence they are called inherent or random causes or variation also. They occur frequently and the reason for variation on a single instance is typically unknown.
Examples Skill issues in people causing higher defects Load on the server causing performance variation Errors in measurement causing variation in data
Page 78 of 102

Consider this example to understand it better. Let us take a simple example of a person walking a kilometer in the morning to take a shuttle to office. On an average if he or she may take 10 minutes to cover the distance. However, when the person is starts late, may walk fast and cover it in 8 minutes. The same person might take 12 minutes on another other day if he has someone to speak with on his journey. Characteristics of these causes like late start, having a partner occur quite often. There may be multiple other reasons as well. These are typically common causes of variation. However the person falls sick and walks that distance. Say, it takes 20 minutes or a friend of him picks him up in car and covers it in just 2 minutes, these are special causes of variation. These are clearly traceable to external events that are not part of the regular routine.
Hence an unstable process is characterized as below It is under the influence of special causes There is no predictability in the process. Fundamental changes to the process are not required as special causes needs to be identified
individually and eliminated.
As the special causes are eliminated, the process becomes stable. The following characterizes a stable process.
Under the influence of common causes Constant mean and standard deviation over time Predictable process: outcome can be predicted within given range with certain confidence
As the stable process is in the influence of only the common causes, the mean and variance are stable over a period of time. Sigma is a measure of variation. It has been found that within the limits of 3 times sigma from mean on both sides 99.7% of data will fall. Hence if the same process is adopted, only 3 out of 1000 instances can fall out side the limit. Consider we get 10 defects per 1000 LOC with standard deviation being 1 defect. Hence we can conclude that in 99.7% of programs defect density would be around 7 defects per 1000 lines of code to 13 defects per 1000 LOC. If we want to bring the average from 10 defects per 1000 LOC to 5 defect per 1000 LOC, it will require fundamental changes to the process.
However, not all stable processes are capable. Capability is determined by the ability of the process to deliver to customer needs. Hence it is compared against the customer specified specification limits.
Control charts help identify special causes. Common causes cannot be improved based on one instance of variation. Causes of variation have to be analyzed and top causes across a period have to be analyzed and prioritized. Pareto chart helps prioritize the top common causes. Once the cause of problem is identified, various techniques like cause and effect and other similar techniques will help identify the root cause and identify solutions.
Interpreting data: Treatment of special cause & common cause are entirely different. Below are some general rules for making inferences and decision
Look into trends. Do not tweak the process too often. Look into correlations. In any process there are very few independent parameters. Look for
correlating parameters before arriving a decision Comparison with benchmarks is an important element for competitive improvement
9.8 ResultsResults show how the organization has performed against the goals & targets. Also it reflects the effectiveness of organization’s strategies. Hence results become the key input for next cycle of improvement in an organization.
Page 79 of 102

10 Quality Tools
A tool is defined as a vehicle that assists in performing a task. Research and other literature most often use the term “quality tools” to refer to the methods used in total quality management (TQM) or continuous quality improvement (CQI), to improve work processes. Quality tools can be used in performing following tasks:
Defining a mission, vision, goals, and objectives Implementing PDCA framework Defining measures Collecting data and assessing Problem-solving Designing solutions Improving processes Measuring results.
As in other trades it is critical to pick the right tool for the right task. Imagine a sculptor using the wrong tools to carve. While, an accomplished sculptor may still be able to create a work of art, it will surely take longer and waste a lot of material. This is what we need to avoid when working on quality problems. We must remember that the tool does not solve the problem; it is our usage and interpretation of these tools that solves these problems.
Three generic steps to select and use a quality tool are:
1. Select the ToolFirst define the objective. Identify the needs to perform the task more effectively and efficiently. Next, from the vast pool of tools, identify the tool that meets these needs and objectives. The pre-requisite to selecting a tool, therefore is a knowledge of this pool of tools.
2. Learn the ToolIf applicable, the person using the tool must receive some training through classroom session or self-study course. Reading through the tool’s documentation is the minimum. Many tools are not only valuable in quality improvement, but can help individuals in the performance of their day-to-day work. Dr. W. Edwards Deming frequently stated that individuals knowledgeable in quality tools tend to be better on-the-job performers.
3. Use the Tool The tool should be utilized in the manner in which it is taught. The user should ensure that there is an approach for deploying and using the tool, and that the results meet the objectives.
In this section we will present a bouquet of tools used in a quality journey. All these tools are presented in an introductory manner. For application, please refer a more detailed text.
10.1 7 QC toolsThese are the most fundamental quality control (QC) tools. They were first emphasized by Kaoru Ishikawa, professor of engineering at Tokyo University. This list is sometimes called the “seven basic tools” or the “seven old tools.”
a. Cause-and-effect diagram b. Histogram c. Check sheetd. Pareto chart e. Flow or Process Mapf. Control charts g. Scatter diagram
Page 80 of 102
Cause and Effect Diagram
Description The fishbone diagram identifies many possible causes for an effect or problem. This tool is also called as Cause-and-Effect Diagram or Ishikawa Diagram. First step is to identify the problem statement (effect). Brainstorm the major categories of causes of the problem. Some generic categories are People, Process, Place, Policy etc. Again ask “why does this happen?” about each cause. Write sub-causes branching off the causes. Continue to ask “Why?” and generate deeper levels of causes till the root cause is identified.
When to Use Need to study a problem/issue and to determine the root cause. For example during causal
analysis to identify the root cause of specific type of defects Need to know all the possible reasons for failure of new process, tools etc Need to know why a process is not performing properly or produce the expected results
ExampleReasons for the high GUI defects are highlighted using the fishbone diagram
Cause and Effect Diagram
GUI defects in IAS project
Project Management
Input (Requirement)
ProcessPeople
No Milestones
No in-process metrics analysis
No standards
Lack of expertise in GUI
Cause
Customer not clear about requirements
Changes in message wording as required by customer
Highly frequent customer changes
PL part time
Spelling mistakes
Test plans does not contain test cases
Environment
Highly people dependent
Not trained
Inexperience in GUI usageCauseNot motivated
Less priority for GUI
GUI standards not followedLack of awareness of GUI
standards
No good GUI standards across projects
Poor customer management
No time
Poor negotiation skills of PL for GUI related reqs change
Different monitor properties
Different monitor size
Browser properties
Lighting
Erratic behaviour of monitor
Customer confused
Frequent GUI related changes
Requirement specs from customer not clear
No project plan
Perception
Advantages of this tool are Adaptable to analyzing causes of problems in a variety of settings.
Page 81 of 102

There is a strong sense of involvement in resolving problems and in ownership of results.
Limitations are Does not usually clarify sequences of causes The magnitude and probability of a cause contributing to a need are not established as part of the
technique The causes identified require verification of some kind.
Histograms
DescriptionA histogram is the most commonly used graph to show frequency of data in columnar form. It looks very much like a bar chart, but there are important differences between them. The horizontal or X-axis shows the scale of values into which the measurements fit. These measurements are generally grouped into intervals to summarize large data sets. Individual data points are not displayed. The vertical or Y-axis is the scale that shows the number of times the values within an interval occurred. The number of times is also referred to as "frequency." The bars have two important characteristics—height and width. The height represents the number of times the values within an interval occurred. The width represents the length of the interval covered by the bar. It is the same for all bars. Common histogram shapes are Symmetrical, Skewed or discontinued.
When to Use Need to summarize large numerical data sets graphically Need to know whether a process produce goods and services which are within specification
limits Need to see whether a process change has occurred from one time period to another. Need to determine whether the outputs of two or more processes are different. Need to communicate about the distribution of data quickly and easily to team.
Example This example shows the distribution of batch jobs in queue.
Check Sheets
DescriptionA check sheet is a form used to gather data in organized manner. This tool records number of occurrences over a specified interval of time to determine the frequency of an event. To use a check sheet decide on what data to be collected, when it will be collected and for how long.
When to Use Need to collect data on the frequency or patterns of events, problems, defects by types, defects by
location, defect by causes, etc.
Page 82 of 102

Need to collect data from a production process. Example The figure below shows a check sheet used to collect data based on type of defects.
Defect Type Week1 Week2 Week3 Week4 TotalLogicalStandardsUser InterfacePerformanceTotal
Advantages of using a check sheet are easy to use; effective way of displaying data using structured approach; first step in the construction of other graphical tools. Disadvantages might be limiting of options.
Pareto Diagrams
DescriptionA Pareto chart is a bar graph whose length reflects the frequency of impact of the problem. The bars are arranged in descending order of height from left to right. In this way the chart visually depicts categories represented by the tall bars on the left are more significant. The Chart get its name from the Pareto Principle that 80 percent of the trouble comes from 20% of the problem
When to Use Need to analyze data about the frequency of problems or causes in a process. Need to break a big problem into small pieces and identify the significant contributor of the
problem
ExamplesBased on contribution defect types are arranged in descending order and cumulative % of defects is also represented in the chart. User interface, Logical, Coding standard and DLD defects are the most significant defects which needs to be addressed.
Page 83 of 102

Pareto Analysis
216
101
7254
33 2816 13 5 2 1
0
50
100
150
200
250U
ser I
nter
face
Logi
cal
Cod
ing
Sta
ndar
ds
DLD
Def
ect
Sta
ndar
ds
Per
form
ance
Mis
sed
Test
Sce
nario
s
Exc
eptio
n H
andl
ing
Sub
Opt
imal
Sol
utio
ns
Inad
equa
te D
escr
iptio
n
Impr
oper
Sco
pe
Defect Type
No. o
f Def
ects
0
20
40
60
80
100
120
Cum
ulat
ive
% o
f Def
ects
No.of Defects
Cumulative % ofDefects
Advantage of using Pareto chart is in choosing the most important changes to be made. Limitations of using Pareto chart are that the data must be in terms of either counts or costs. The data that cannot be added, such as percent yields or error rates are not used in this chart
Flow Chart and Process MapFlow charts are easy-to-understand diagrams displaying the sequential steps of a process. Process Map is a detailed version of flowchart that depicts processes, their relationship and the owners. Different types of flowchart are top-down flow chart, detailed flow chart, work flow diagrams, and a deployment chart.
When to Use To understand and communicate how a process is done To study a process for improvement
Example
Page 84 of 102

Configuration and review process of a document from the point of creation to baseline is explained using flowchart
AdvantageFlow chart will help in understanding the process and also think about where the process can be improved.
Scatter Diagram
Page 85 of 102

DescriptionA Scatter Diagram examines the relationships between pairs of numerical data collected for two different characteristics. If the variables are correlated, the points fall along a line or curve. A strong relationship between the two variables is observed when most of the points fall along an imaginary straight line with either a positive or negative slope. No relationship between the two variables is observed when the points are randomly scattered about the graph
When to Use Need to determine if there is correlation between two characteristics After brainstorming causes and effect using fishbone to determine whether a particular cause and
effect are related To determine whether 2 effects that appear to be related occur with same cause
ExampleIn this example negative correlation is observed as the size of the program increases, effort deviation % comes down. We can also use scatter diagram to determine Onsite effort vs Gross margin, Complexity of program vs DIR
Scatter Diagram
0%
10%
20%
30%
0 50 100 150 200 250
Size of Program (Function Point)
% E
ffor
t dev
iatio
n
Advantage of using scatter diagram is to determine whether or not a relationship exists between 2 variables and how strong the relationship is. Limitation is it cannot determine the cause of relationship
Control Charts
DescriptionThe control chart is a graph used to study the behavior of a process over a period of time. A control chart always has a central line that represents the average, upper control limit (UCL) and lower control limit (LCL).
When to Use To determine whether a process is stable. To analyze whether the process variation are from special causes or common causes To determine whether specific problems to be prevented or to make fundamental changes to the
process.
ExampleThis example determines that the process is out of control.
Page 86 of 102

Out-of-control signals A single point outside the control limits. In Figure 1, point sixteen is above the UCL (upper
control limit). Two out of three successive points are on the same side of the centerline and farther than 2 σ
from it. In Figure 1, point 4 sends that signal. Four out of five successive points are on the same side of the centerline and farther than 1 σ from
it. In Figure 1, point 11 sends that signal. A run of eight in a row are on the same side of the centerline. Or 10 out of 11, 12 out of 14 or 16
out of 20. In Figure 1, point 21 is eighth in a row above the centerline. An unusual or nonrandom pattern in the data.
10.2 Creative or Idea generation ToolsIn a quality journey there are two key situations where idea generation is necessary. These are:
What is the cause of the problem we face? What are the possible ways in which we eradicate this root cause(s)?
Some key creative and idea generation tools include:
Brainstorming Brainwriting Morphological forecasting Idea rooms Delphi Imaginary brainstorming Knowledge/mind mapping Morphological box Picture associations ad bio-techniques Problem reformulation/heuristic reformulation TILMAG Word associations and analogies.
All the above tools are based on brainstorming.
Brainstorming
Description: Brainstorming is used to quickly generate a large number of creative ideas in a short period of time. Common rules of a brainstorming session are:
1. Invite the people judiciously to the session. Too few (<5) or too many (>8) participants must be avoided.
2. Define the objective of the session clearly and keep the participants focused3. Participants must not criticize or evaluate ideas during the session 4. Record all ideas as mentioned by the contributor5. Continue to generate and record ideas until ideas become redundant or infrequent.
Page 87 of 102
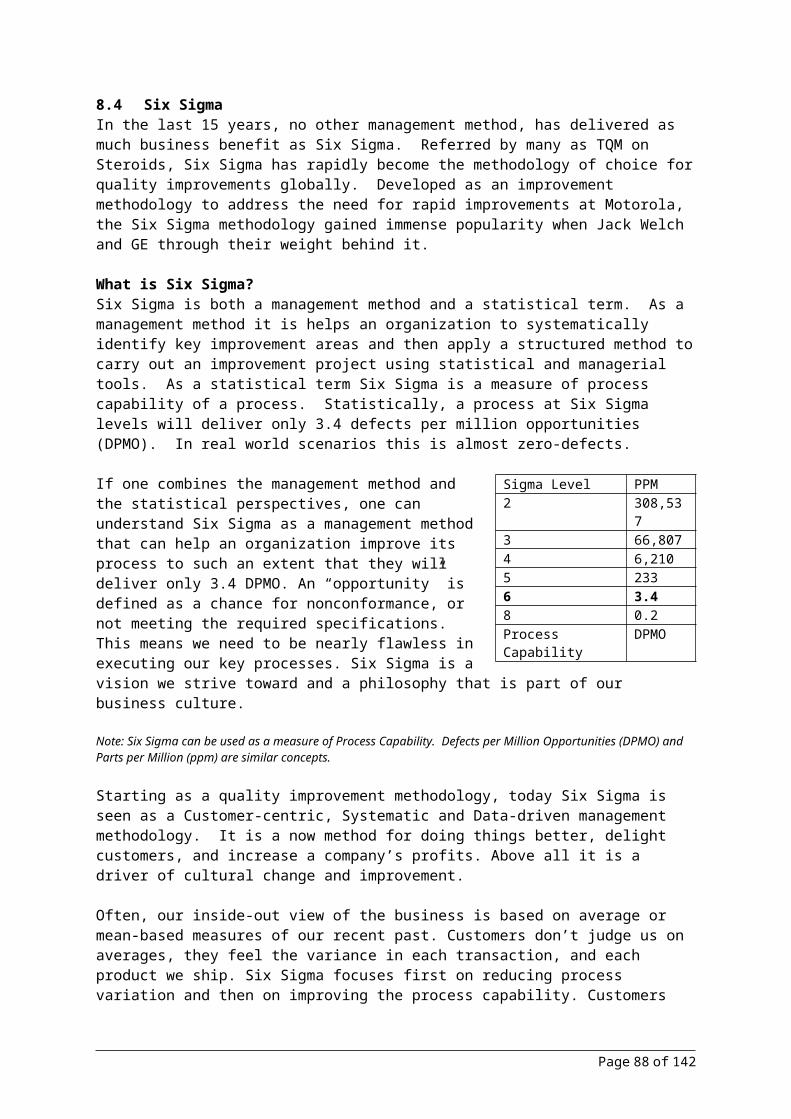
When to Use When new ideas are required, to generate a large list of possibilities. Use it when a solution to a problem cannot be logically deduced. Use it when information about a problem is confused and spread across several people, to gather
the information in one place.
Example To review the input, output and workflow of a process. To establish standards, guidelines or measures. To develop a vision.
Limitation is when ideas or opinions need to be gathered from within a group, Brainstorming is not always the best solution, for example where the group prefers a more structured style of working or where some group members are dominant.
Tip: A brainstorming (or idea generation) session is most useful when coupled with a tool that helps in arranging these ideas, such as Affinity Diagram another tool used as a follow-up tool with Brainstorming is the Nominal Group Technique..
Nominal group technique
DescriptionNominal group technique (NGT) is a structured method for group brainstorming to achieve consensus.
1. Objective of the session to be defined clearly2. Each team member silently thinks of and writes down as many ideas as possible in a set
period of time (5 to 10 minutes). 3. Using voting or ranking prioritize the ideas.4. Based on which priority of the items are determined
When to Use When some group members are more dominating than others. When some group members think better in silence. When there is concern about some members not participating. When all or some group members are new to the team. When the issue is controversial or there is heated conflict.
10.3 Tools for presentation
TableA table is both a mode of visual communication and a means of arranging data in row and column format. Table can be created using Word processing, spread sheet, presentation applications.
Example show Monthly income from each account is represented in tabular formMonth Account A Account B Account CJan-07 10000 5400 8500Feb-07 25600 7900 16600Mar-07 15575 10300 24000Total 51175 23600 49100
Pie chart
Page 88 of 102

A pie chart is a way of summarizing a set of categorical data. It is a circle which is divided into segments. Each segment represents a particular category. The area of each segment is proportional to the number of cases in that category.
Example shows the distribution of defects based on cause
Defects distribution (based on cause)
32
25
6
38
Oversight
Lack of domainknowledge
Lack of technicalknowledge
Ambiqousrequirement
Incompleterequirement
Line ChartA line graph is used for showing how one variable measured on the vertical y-axis, changes as another variable, on the horizontal x-axis, increases. The x-axis variable will be independent variable usually time and y-axis variable will be dependent variable.
Income from Account A
0
5000
10000
15000
20000
25000
30000
Jan-07 Feb-07 Mar-07
Period
$ Account A
Bar chartA bar chart is a 2 dimensional chart to represent value of items using bars. Bar charts can be displayed horizontally or vertically and they are usually drawn with a gap between the bars (rectangles), whereas the bars of a histogram are drawn immediately next to each other.
Page 89 of 102

Accountwise Income
0
5000
10000
15000
20000
25000
30000
Jan-07 Feb-07 Mar-07
Period
$
Account A
Account B
Account C
Box PlotA box and whisker plot is a way of summarizing a set of data measured on an interval scale. It is often used in exploratory data analysis. It is a type of graph which is used to show the shape of the distribution, its central value, and variability. The picture produced consists of the most extreme values in the data set (maximum and minimum values), the lower and upper quartiles, and the median.
A box plot (as it is often called) is especially helpful for indicating whether a distribution is skewed and whether there are any unusual observations (outliers) in the data set. Box and whisker plots are also very useful when large numbers of observations are involved and when two or more data sets are being compared.
Example shows the comparison of Pre and post COQ value
Page 90 of 102

11 Statistical Methods
11.1 Basic statistics
“In GOD we trust, Rest bring data “
Collection of data and analysis are very important to understand and validate the improvements made through different methodologies described above. This necessitates basic knowledge on statistics. Statistics means, methods specially adapted to the collection, classification analysis and interpretation of data for making effective decisions in all the functional areas of management. There are 2 types of statistics, namely descriptive statistics and inferential statistics.
Descriptive statistics, this is concerned with data summarization, graphs/ charts, and tables. As the name suggests, it’s used to describe the set of data. It process raw data into information. There are two basic methods: numerical and graphical. Using the numerical approach one might compute statistics such as the mean and standard deviation. Graphical methods are better suited than numerical methods for identifying patterns in the data. Numerical approaches are more precise and objective. Since the numerical and graphical approaches compliment each other, it is wise to use both. This will help us to articulate the improvements and as well to do quick validations.
Example: An FA computes the average onsite/offshore ratio for one IBU. This describes the characteristics of one IBU but does not make generalization about the entire organization.
Inferential statistics are used to draw inferences about a population from a sample. Population is the collection of all possible observations of a specified characteristic of interest. It’s also called as universe. Sample, is a subset of the population. There are two main methods used in inferential statistics: estimation and hypothesis testing. In estimation, the sample is used to estimate a parameter and a confidence interval about the estimate is constructed. In the most common use of hypothesis testing, a "straw man" null hypothesis is put forward and it is determined whether the data are strong enough to reject it. This is very important tool which would help us to statistically question and confirm if any improvements have happened. We will deal it detail in further sections.
Example: Use of average onsite/offshore ratio of one IBU to estimate the same for all the IBUs of Zymcwj
Measures of Central Tendency Central tendency is part of descriptive statistic, it is typical representative average of the fairly large amount of data, in such a way that, rest of the data will cluster around this value. The most widely used measures of central tendency are Arithmetic mean, median & Mode. Each of this measure has it own advantages and have to be used based on the data.
Arithmetic Mean, this is most common measure of Central tendency, it is defined as sum of all the observations in a data set divided by the total number of observations.
The arithmetic mean X = (∑ X )/n
Arithmetic mean is affected by extreme values or fluctuations in sampling. So when the data is highly diverse, arithmetic mean is not the right representation of the central tendency.
Median, is the middle most observation, when you arrange data in ascending or descending order of magnitude. That is the data is ranked and the middle value is picked up as the median. So there will be 50% of observations above and below the median.
Median=(n+1)/2 th Value of ranked data
Page 91 of 102

This is not affected by extreme values, but is affected by number of observations. This is typically used in measuring central tendency of ordinal data.
Mode, is that value which occurs most often. It has the maximum frequency of occurrence. Mode is not affected by extreme values. At times there can be more than one mode, such as bimodal, multimodal values. In these cases mode cannot be uniquely determined.
Measure of DispersionMeasure of dispersion assesses the magnitude of departure from the average value (central tendency).
Example: Two CMM Level 5 companies claim to have similar productivity (x FP/pm) in a technology. Which one is more consistent. If one has to answer this question, then we need to understand the most important concept, the dispersion.
The popular measures of dispersion are Range, semi- interquartile range, Mean absolute Deviation, standard deviation and coefficient of variation. Today the basic problem faced is the variation in data. So it’s important to qualify the data with both central tendency and dispersion, to understand the reality.
Range is the simplest measure of spread or dispersion: It is the difference between the largest and the smallest values. Range is very simple to measure and easy to understand. But range is very sensitive to extreme values and may not be the appropriate measure as it uses only 2 values. So it’s not advisable to use it as the only measure of spread and is usually supplemented with other measures like standard deviation or interquartile range.
Semi-interquartile range is computed as one half the differences between the 75th percentile [often called (Q3)] and the 25th percentile (Q1). The formula for semi-interquartile range is therefore: (Q3-Q1)/2. The percentile indicates the relative position of the data points in the ordered set and the position of the Pth percentile is given by (n + 1)P/100, where n is the number of observations in the set. Percentiles are used when the variations are very high.
Mean absolute Deviation is defined as the average based on the deviations measured from arithmetic mean, in which all deviations are treated as positive ignoring the actual sign . MAD = ∑(X-X) / n
Standard Deviation , this forms the basis for inferential statistics. It is the classic measure of dispersion. It is based on observations. It can be algebraically treated.
Standard deviation for sampleS = √ ∑(X-X)2 / (n-1)Standard deviation for population = √ ∑(X-µ)2 / (N)
The square of standard deviation is Variance.
Example: Let us consider this situation, an improvement initiative was done on 2 IBUs to improve the revenue Productivity, the summary of Revenue productivity of 2 IBU’s are described below.
Revenue productivity IBU1 IBU2Mean 4000 6000St. Dev 200 200
In the above situation, is the pattern the same? Which IBU is more consistent and has better result? To answer this, we need to understand the relative dispersion, Co- efficient of variation
Page 92 of 102

Co-efficient of Variation (CV), the relative dispersion is defined as the ratio of standard deviation to mean. This is used when we need to see the relative spread across groups or segments. Larger is the CV, greater is the percentage of spread.
So in the above example, IBU2 is better and has less spread compared to IBU1.
Let us look into another few important aspects in Statistics:
Confidence Interval, Probably the most often used descriptive statistic is the mean. The mean is a particularly informative measure of the "central tendency" of the variable if it is reported along with its confidence intervals.
The confidence intervals for the mean give us a range of values around the mean where we expect the "true" (population) mean is located (with a given level of certainty
A probability of 95% would mean the following:If we select 100 samples of medium program at random from several projects and construct an interval of plus and minus 2 standard errors around the mean of each of these samples, about 95 of these intervals will include population mean.
Note that the width of the confidence interval depends on the sample size and on the variation of data values. The larger the sample size, the more reliable it’s mean. The larger the variation, the less reliable the mean. The calculation of confidence intervals is based on the assumption that the variable is normally distributed in the population.
11.2 Hypothesis testingExample: Commitment on 10% productivity improvement has been made in a large, multi-year engagement. Average productivity in current period is 33 FP/person month as compared to 30 FP/person months in the previous period. The variation in previous period is 5 FP/P month and current period is 8 FP/ P month. Have we met the commitments? Though by mean there seems to be an increase, the variation also has increased, so it cannot be concluded without further investigations.
Hypothesis testing is very important helps to statistically validate the improvements made. There are several statistical test under hypothesis testing tat could be performed to ascertain if the improvements are significant= To use this technique, let’s understand the basics of Hypothesis testing.
What is hypothesis? Hypothesis is a statement or assertion about the state of nature (about the true value of an unknown population parameter): Revenue productivity has improved Average COQ () = 30
There are totally only 2 hypothesis, the null hypothesis H0 and Alternate hypothesis H1. H0 and H1 are mutually exclusive (Only one can be true.) and exhaustive (Together they cover all possibilities, so one or the other must be true)
A null hypothesis, denoted by H0, represents status quo and to be hold true until we have sufficient evidence to conclude otherwise. H0: =100
The alternative hypothesis, denoted by H1, is the assertion of all situations not covered by the null hypothesis. H1: 100
Page 93 of 102
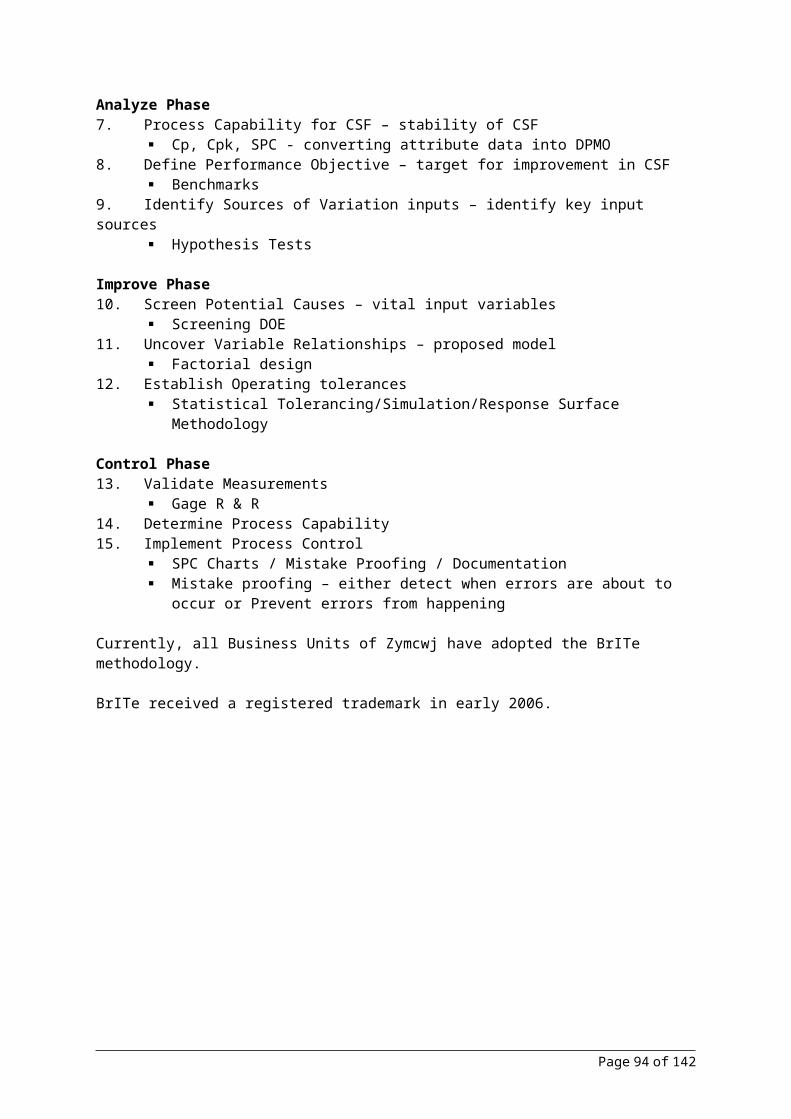
The hypothesis may be true or false and the decision is taken based on the information, statistical evidence like Test statistic. The Test statistic is a sample statistic computed from sample data. The value of the test statistic is used in determining whether or not we may reject the null hypothesis. That is if we have set the null hypothesis as No improvements made, we will use this test statistics to see if there is a real improvement (reject null hypothesis). Setting that the No improvements made as the Null Hypothesis is called the decision rule. So the decision rule of a statistical hypothesis test is a rule that specifies the conditions under which the null hypothesis may be rejected
Decision MakingIn hypothesis testing, nothing but stating a hypothesis and performing statistical tests and based on the evidence the decision is made. The following contingency table illustrates the possible outcome of the decisions,
• One hypothesis is maintained to be true until a decision is made to reject it as false:– Guilt is proven “beyond a reasonable doubt”– The alternative is highly improbable• A decision to fail to reject (accept) or reject a hypothesis may be:– Correct• A true hypothesis may not be rejected» An innocent defendant may be acquitted• A false hypothesis may be rejected» A guilty defendant may be convicted– Incorrect• A true hypothesis may be rejected (Type 1 error)» An innocent defendant may be convicted• A false hypothesis may not be rejected (Type 2 error)» A guilty defendant may be acquitted
The statistical techniques that help us testing this hypothesis depends the type of data, amount of data, and type of distribution it follows.
11.3 Correlation and Regression Analysis
Correlation:Correlation tests are used to assess whether there is a relationship between two or more variables. This can be used to select the factor which would contribute to higher improvement, in prioritizing the factors. Also can be used after improvement to ascertain the same fact
The most common measure of correlation is the Pearson Product Moment Correlation (called Pearson's correlation for short). When measured in a population the Pearson Product Moment correlation is designated by the Greek letter rho (ρ). When computed in a sample, it is designated by the letter "r" and is sometimes called "Pearson's r." Pearson's correlation reflects the degree of linear relationship between two variables. It ranges from +1 to -1. The scatter plot is also used to depict relationship.
Page 94 of 102

Onsite Effort Vs Revenue
-500,000
1,000,000
1,500,0002,000,0002,500,0003,000,000
3,500,0004,000,000
- 50 100 150 200 250 300
Onsite Effort (pm)O
nsite
Rev
enue
A correlation of +1 means that there is a perfect positive linear relationship between variables.
A correlation of -1 means that there is a perfect negative linear relationship between variables.
A correlation of 0 means there is no linear relationship between the two variables. The second graph shows a Pearson correlation of 0.
More examples of correlation are given below,
S. No Correlation Expected Relationship
1 Effort deviation % Vs Defects Deviation % Positive 2 Effort Deviation % Vs Schedule slippage Positive3 Review Effectiveness Vs Effort Overrun Negative4 Rework % Vs Productivity Negative5 DIR Vs Rework % Positive6 DIR Vs COQ Positive7 DP & Training Effort % Vs COQ Negative8 Quality Vs DIR Positive9 No. Requirement Changes Vs AT Defects Zero (No Correlation)10 Review effectiveness Vs COQ Negative11 DP Effort % Vs DIR Negative
Page 95 of 102
COQ Vs Review Effectiveness
202530354045
50
20 40 60 80Review Effectiveness %
CO
Q %

Regression:Regression is a simple statistical tool used to model the dependence of a variable on one (or more) explanatory variables. This functional relationship may then be formally stated as an equation, with associated statistical values that describe how well this equation fits the data.
So, Regression is prediction of future events based on the relationship, i.e. it uses independent variables to predict the dependent variable.
Let us take this example, in last one quarter; lot of focus is given on defect prevention to reduce defect injection rates. It is found that lower defect injection rates result in lower rework effort. If we have the data of DIR and rework, can we answer this question, how much reduction in rework effort is expected if DIR reduces by 10%? This is possible through regression.
Let us look into detail about the Simple Linear Regression, it assumes the relation between the variables is Linear, and straight line is the best fit.
So if we know the Y intercept, slope and error, we can predict the Dependent variable.
DIR vs Rework (%) y = 1.3307x + 0.5018R2 = 0.5579
02468
10121416
0 2 4 6 8 10 12
DIR (def/ 100 phrs)
Rew
ork
(%)
So from the above example, 10% reduction in DIR will give 13% reduction in rework effort.
Difference between Regression and Correlation:
Correlation makes no a priori assumption as to whether one variable is dependent on the other(s) and is not concerned with the relationship between variables; instead it gives an estimate as to the degree of association between the variables. In fact, correlation analysis tests for interdependence of the variables.
As regression attempts to describe the dependence of a variable on one (or more) explanatory variables; it implicitly assumes that there is a one-way causal effect from the explanatory variable(s) to the response variable, regardless of whether the path of effect is direct or indirect.
11.4 Design of Experiment and Analysis
Page 96 of 102
iii XY 10
Y intercept
Slope
Random Error
Dependent (Response) Variable
Independent (Explanatory) Variable
DOE is a systematic approach to investigation of a system or process. A series of structured tests are designed in which planned changes are made to the input variables of a process or system. The effects of these changes on a pre-defined output are then assessed. This will help us to alter only the required variable to bring in the improvements, with less effort.
Why is it important? DOE is important as a formal way of maximizing information gained while minimizing resources required. It has more to offer than 'one change at a time' experimental methods, because it allows a judgment on the significance to the output of input variables acting alone, as well input variables acting in combination with one another.
'One change at a time' testing always carries the risk that the experimenter may find one input variable to have a significant effect on the response (output) while failing to discover that changing another variable may alter the effect of the first (i.e. some kind of dependency or interaction). This is because the temptation is to stop the test when this first significant effect has been found. In order to reveal an interaction or dependency, 'one change at a time' testing relies on the experimenter carrying the tests in the appropriate direction. However, DOE plans for all possible dependencies in the first place, and then prescribes exactly what data are needed to assess them i.e. whether input variables change the response on their own, when combined, or not at all. In terms of resource the exact length and size of the experiment are set by the design (i.e. before testing begins).
When to use1. When we need to see how key variables affect the output2. When we need to find which variables are important3. When we want to change the process average4. When we want to reduce process variation
How to use it? Define the product/process to be studied Determine the response(s) - Y Validate the Measurement System for the response(s) - Gage R&R Generate candidate factors - Xs Determine the levels for the selected factors Select the experimental design Have a plan to control the noise factors Perform the experiment according to the design Analyze the results and draw conclusions Document the new settings and perform confirmation runs
ExampleThe has been used to 1. Predicting the performance of the application & improving the same 2. Optimizing the testing3. Influence of different environment in testing
11.5 SPC – control charts Today, the huge problem with software with respect to data is variation. Reduction in variation is the key to Quality. The causes of variation can be of 2 types, the common causes and special causes.
Common causes are something inherent to the system, also known as random variation. Example: Defect Injection Rates in several programs of same complexity by the same team
Special causes are one that occurs due to a special or unique environment. Example: Defect Injection Rates in several programs of same complexity by the same team
Page 97 of 102

Usually a process is said to be unstable when it is under the influence of special causes, where the results cannot be predicted. When the special causes are addressed then the process becomes stable where it is under the influence of common causes and process is predictable. When the process yields results as per the customer expectation the it is called a capable process.
Shewhart's discovery statistical process control or SPC, is a methodology for charting the process and quickly determining when a process is "out of control" (e.g., a special cause variation is present because something unusual is occurring in the process). The process is then investigated to determine the root cause of the "out of control" condition. When the root cause of the problem is determined, a strategy is identified to correct it.
Structure of a Control Chart:
Process – Out of control:
The process above is out of statistical control. Notice that a single point can be found outside the control limits (above them). This means that a source of special cause variation is present.
Rules for Interpretation for special causes1. One Point more than 3 Sigma's from Center Line2. Nine Points in a Row on same side of Center Line3. Six Points in a Row , all increasing or all decreasing4. Fourteen points in a row, alternating up and down5. Two out of three points more than 2 sigma's from center line (same side)6. Four out of five points more than 1 sigma from center line ( same side )
Page 98 of 102
Unstable Stable Capable

7. Fifteen points in a row within 1 Sigma of Center line ( either side )8. Eight points in a row more than 1 sigma from center line (either side )
Process In control:
The process above is in apparent statistical control. Notice that all points lie within the upper control limits (UCL) and the lower control limits (LCL). This process exhibits only common cause variation.
It is management's responsibility to reduce common cause or system variation as well. This is done through process improvement techniques, investing in new technology, or reengineering the process to have fewer steps and therefore less variation. Management wants as little total variation in a process as possible--both common cause and special cause variation. Reduced variation makes the process more predictable with process output closer to the desired or nominal value. The desire for absolutely minimal variation mandates working toward the goal of reduced process variation.
Selection of Statistical Process ControlA large number of control charts exist which may be used in different situation. While the basic philosophy and interpretation remains same (as discussed in the previous sections) the statistical theory and construction do differ.
A parameter that is measured on a numerical scale is called a variable. Examples include effort deviation, turn around time etc. X-Bar R chart, X-Bar S chart and XmR chart are used for variables.
Many parameters can not be conveniently represented numerically. In such cases, we usually classify each item inspected as either conforming or nonconforming to the specifications on that parameter. Parameters of this type are called attributes. Examples include number of defects found, number of people with certain skills etc. p chart, np chart, c chart etc are used for attribute.
In Zymcwj two types of control charts are generally applicable - XmR chart and c chart.
Page 99 of 102
Use XmR chart
Variable data
Is sample size equals to 1?
Are you charting attribute data?
Use XmR chart or C chart
Yes
No Yes
Use X-Bar and R chart
No

Control chart decision tree
XmR chart is used when every unit of the parameter measured is used for analysis or the measurements are spaced widely in time. We use the short term variation between adjacent observed values to estimate the inherent variation of the process. This leads to a pair of charts – one for the individual values and another for the successive two point moving ranges. This combination of charts for individual observations and moving ranges is called an XmR chart, where X and mR symbolize the individual and moving range, respectively. XmR chart can be used for variable as well as attribute data.
Parameter Period / Level Type of chartEffort deviation Program level XmR chart
Defect injection rate Program level C chartDefect density Program level C chartReview efficiency Review component level C chart
Review effectiveness Program/Request level XmR chartReview coverage rate Review component level XmR chart
11.6 Quality function deploymentQuality function deployment or QFD was originally developed by Drs. Yoji Akao and Shigeru Mizuno in the early 1960s. "QFD" is a flexible and comprehensive group decision making technique. QFD transforms customer needs (the voice of the customer [VOC]) into engineering characteristics of a product or service, prioritizing each product/service characteristic while simultaneously setting development targets for product or service development. When completed it resembles a house structure and is often referred to as House of Quality.
When to use: This is typically used 1. When analyzing customer requirements2. When customer requirements need to be translated into technical requirements3. When conflicting requirements are there and it needs some trade off4. When you are beginning design of a new product or process etc
Procedure
Page 100 of 102
Roof
LeftRight
Attic
Basement

1. Assemble a cross functional team, they should be knowledgeable about the customer , product, process
2. Write the customer requirements in the Left side of the house3. Add a column next to the requirements to capture the importance 1 to 10 of the requirement4. in the attic write the product or service characteristics, that directly affect the customer
requirements5. In the centre of the table use the matrix to depict the relationship between the requirements and
characteristics. We could use numerical values to depicts the strength 6. Also depict the correlation of the characteristics and the requirements in form of symbols in the
Roof 7. In the basement provide the summation of the relation and comparable scores of competitive
products or targets for easy comparison.8. Analyze the values and select the right characteristic9. Generally the How of the Fist Hose becomes the what for the next house, This exercise continues
till we could actionize on the how’s
11.7 Balanced scorecardThe Balanced Scorecard is a proven performance measurement system. It is a comprehensive strategic performance management system and methodology. It is a framework for defining, refining and communicating strategy, for translating strategy to operational terms, and for measuring the effectiveness of strategy implementation. The BSC approach was developed by Professor Robert Kaplan and David Norton in the early 1990s in response to a need for a better performance management system.
The system consists of four processes: Translating the vision into operational goals; Communicate the vision and link it to individual performance; Business planning; Feedback and learning and adjusting the strategy accordingly.
The scorecard seeks to measure a business from the following perspectives:
Financial Perspective - measures reflecting financial performance, for example number of debtors, cash flow or return on investment. The financial performance of an organization is fundamental to its success. Even non-profit organizations must make the books balance. Financial figures suffer from two major drawbacks:
They are historical. Whilst they tell us what has happened to the organization they may not tell us what is currently happening, or be a good indicator of future performance.
It is common for the current market value of an organization to exceed the market value of its assets. Tobin's-q measures the ratio of the value of a company's assets to its market value. The excess value can be thought of as intangible assets. These figures are not measured by normal financial reporting.
Customer Perspective - measures having a direct impact on customers, for example time taken to process a phone call, results of customer surveys, number of complaints or competitive rankings.
Business Process Perspective - measures reflecting the performance of key business processes, for example the time spent prospecting, number of units that required rework or process cost.
Learning and Growth Perspective - measures describing the company's learning curve -- for example, number of employee suggestions or total hours spent on staff training.
11.8 BenchmarkingBenchmarking is the process of identifying, understanding, and adapting outstanding practices from organizations anywhere in the world to help your organization improve its performance.
Page 101 of 102
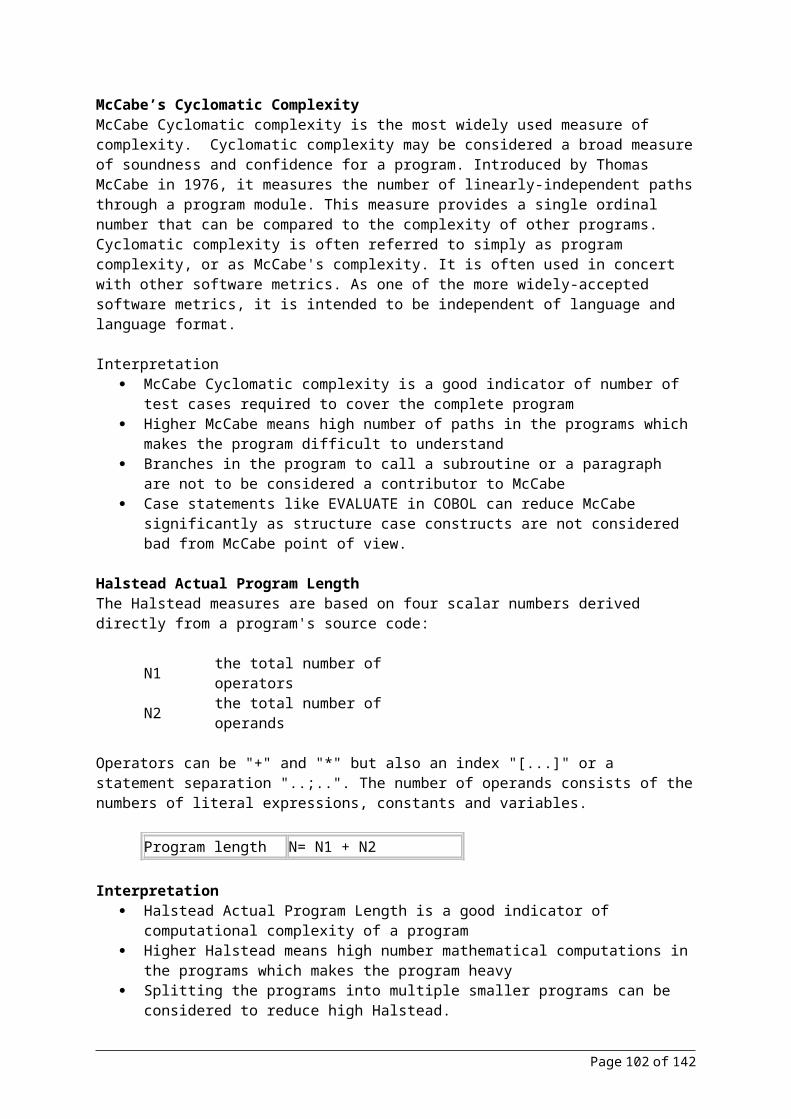
Benchmarking is a highly respected practice in the business world. It is an activity that looks outward to find best practice and high performance and then measures actual business operations against those goals. Benchmarking is a tool to help you improve your business processes. Benchmarking opens organizations to new methods, ideas and tools to improve their effectiveness.
Some of the organizations that are heavily engaged in Benchmarking are Bank of America, Xerox, Bearing Point etc. Some of the Top business Processes that get benchmarked are IT, HR, Activity based costing etc.
Benchmarking can be of 2 types, Performance and process Benchmarking.
Performance benchmarking: Performance benchmarking is the collection of (generally numerical) performance information and making comparisons with other compatible organizations.
It answers the question: What are the most important performance yardsticks and where do we rank, compared with others in our industry and other analogous industries? Ideally performance benchmarking is repeated over two or three years, so that progress can be effectively monitored.
In Zymcwj, Performance Benchmarking is done against Caper Jones, SPIN – SIG, ISBSG. For more details you can refer to PriDE
Process benchmarking:Process Benchmarking is the comparison of practices, procedures and performance, with specially selected benchmarking partners, studying one business process at a time.
It answers the question: What is the best practice in this topic, where are the best practitioners and what can we learn from them?
In Zymcwj, Process Benchmarking is done through Jugalbandhi. Based on the concept of benchmarking, Jugalbandhi aims to study practices from different type of projects on specific areas so that the Zymcwj processes can be enriched. Just as in a musical opera, the session name has been branded to promote the culture of sharing information in a harmonious manner, for organizational benefits.
Benefits of benchmarking It can create huge leaps in performance Benchmarking establishes goals that are ambitious and realistic It encourages creativity and innovation and promotes an attitude of learning Getting better gets faster
Page 102 of 102