Reading to Young Children: A Head-Start in Life?ftp.iza.org/dp7416.pdfReading to Young Children: A...
45
DISCUSSION PAPER SERIES Forschungsinstitut zur Zukunft der Arbeit Institute for the Study of Labor Reading to Young Children: A Head-Start in Life? IZA DP No. 7416 May 2013 Guyonne Kalb Jan C. van Ours
Transcript of Reading to Young Children: A Head-Start in Life?ftp.iza.org/dp7416.pdfReading to Young Children: A...

DI
SC
US
SI
ON
P
AP
ER
S
ER
IE
S
Forschungsinstitut zur Zukunft der ArbeitInstitute for the Study of Labor
Reading to Young Children:A Head-Start in Life?
IZA DP No. 7416
May 2013
Guyonne KalbJan C. van Ours

Reading to Young Children:
A Head-Start in Life?
Guyonne Kalb MIAESR, University of Melbourne
and IZA
Jan C. van Ours CentER, Tilburg University,
University of Melbourne, CESifo, CEPR and IZA
Discussion Paper No. 7416 May 2013
IZA
P.O. Box 7240 53072 Bonn
Germany
Phone: +49-228-3894-0 Fax: +49-228-3894-180
E-mail: [email protected]
Any opinions expressed here are those of the author(s) and not those of IZA. Research published in this series may include views on policy, but the institute itself takes no institutional policy positions. The IZA research network is committed to the IZA Guiding Principles of Research Integrity. The Institute for the Study of Labor (IZA) in Bonn is a local and virtual international research center and a place of communication between science, politics and business. IZA is an independent nonprofit organization supported by Deutsche Post Foundation. The center is associated with the University of Bonn and offers a stimulating research environment through its international network, workshops and conferences, data service, project support, research visits and doctoral program. IZA engages in (i) original and internationally competitive research in all fields of labor economics, (ii) development of policy concepts, and (iii) dissemination of research results and concepts to the interested public. IZA Discussion Papers often represent preliminary work and are circulated to encourage discussion. Citation of such a paper should account for its provisional character. A revised version may be available directly from the author.

IZA Discussion Paper No. 7416 May 2013
ABSTRACT
Reading to Young Children: A Head-Start in Life?* This paper investigates the importance of parents reading to their young children. Using Australian data we find that parental reading to children at age 4 to 5 has positive and significant effects on reading skills and cognitive skills of these children at least up to age 10 or 11. Our findings are robust to a wide range of sensitivity analyses. JEL Classification: C26, I21, J24 Keywords: reading to children, reading skills, other cognitive skills Corresponding author: Guyonne Kalb Melbourne Institute of Applied Economic and Social Research University of Melbourne Parkville VIC 3010 Australia E-mail: [email protected]
* This research was commissioned by the Victorian Department of Education and Early Childhood Development (DEECD). The authors thank Yin King Fok for her excellent research assistance, and John Micklewright, Mario Fiorini, and participants at the Labour Econometrics Workshop 2012 and seminars at the University of Erlangen-Nuremberg and the University of Melbourne for their comments on earlier versions. This paper uses unit record data from the Longitudinal Study of Australian Children (LSAC) Survey. The LSAC Project was initiated and is funded by the Australian Government Department of Families, Housing, Community Services and Indigenous Affairs (FaHCSIA) and is managed by the Australian Institute of Family Studies (AIFS). The findings and views reported in this paper, however, are those of the authors and should not be attributed to FaHCSIA, AIFS or DEECD.

2
1 Introduction
The cognitive and non-cognitive development of young children is important from an economic
perspective because of their effects on economic productivity later-on in life (Heckman and
Masterov, 2007). Cognitive skills are an important determinant in explaining socio-economic
success in terms of schooling, wages and quality of jobs. Such skills are influenced by
preschool training, education at school but also by parental efforts. Cunha and Heckman (2008)
for example use data from the U.S. National Longitudinal Survey of Youth (1979) to establish
the importance of parental investments in raising skills of their children and thus success later
on in life. As measures of parental investments they consider the number of books available to
the child, whether the child has a musical instrument, whether the family receives a daily
newspaper, whether the child receives special lessons and whether the child goes to museums
and the theater. They find that the most effective period for cognitive skills investments by
parents is early on in the life of their children. Cunha et al. (2006) conclude from an overview of
a large number of empirical studies that cognitive ability affects both the likelihood of acquiring
advanced training and higher education, and the economic returns to those activities.
Stimulating the development of cognitive skills of young children seems to be beneficial to
them later on in life. Several papers in the education literature have found a positive association
of parents reading to their children and the child’s subsequent reading skills, language skills and
cognitive development. Parents reading to their children may stimulate these children to read
books themselves and further develop their cognitive skills.1
Our paper investigates the relationship between reading to children and the effects this has
on reading skills and other cognitive skills of the child. Previous studies on this relationship do
not distinguish the causal effect of reading to children on the reading skills of the child from
simply an association between the two. It is not easy to make such a distinction as experimental
data are usually not available, and to the extent that they are available they are mostly for small
samples from specific sub-populations. In our paper we determine whether there is evidence for
a causal effect from reading to children following two distinct econometric methods. The first
approach uses a range of different instrumental variable model specifications. We use two
1 Parents may also stimulate reading by their children through buying children’s books, taking them to public
libraries, talking about reading, giving the example of reading, instruction, et cetera. Reading by children can
also be influenced by governments and school teachers. Governments can stimulate book-reading through
subsidies for libraries, tax concessions on the sale of (children’s) books, and measures to increase the
production of book titles (Canoy et al., 2006). Schools and teachers can stimulate children to read by
expanding the number of hours on literacy education or stimulate pupils’ cultural interest. Plentiful
availability of books in schools can also help.

3
instrumental variables: whether the child is the oldest child in the family and the number of
siblings in the family at the time of observing how much the child is read to. Both variables are
associated with the time the parent has available for the child and thus affect the intensity with
which children are being read to. The second approach uses propensity score matching, which
relies on applying weights to the observations on children who are not read to or not read to so
frequently to make this group as comparable as possible on all aspects to the families who read
to their children more frequently.
Our identifying assumption in the instrumental variable approach is that birth order and
family size do not have a direct effect on the child’s inherent reading ability. This assumption is
not uncontroversial. Using Norwegian data, Black et al. (2005) conclude that family size itself
hardly has an effect on children’s outcomes. However, birth order has. Higher birth order is
found to have significant and large negative effects on children’s education, adult earnings,
employment and increases the probability of teenage childbearing. It is not clear what is causing
these birth order effects.2 There are a number of potential explanations such as a stopping rule
or financial constraints, but Black et al. (2005) conclude that these do not seem to be very
important.3 Silles (2010) using data from the British National Child Development Study finds
that in terms of test scores last-born initially have an advantage over older siblings but first-born
ultimately outperform their younger siblings by the end of compulsory education.
A logical explanation for the birth order effect is time spent by parents with their children.
Previous papers have found a correlation of birth order and the time mothers spent reading to
their child (e.g. Silinskas et al., 2010). Price (2008) uses data from the American Time Use
Survey to investigate the relationship between birth order and time spent with parents. Parents
seem to provide equal time to each child at each point in time which is beneficial to the oldest
child since for some time this child is the sole beneficiary of parents’ attention, i.e. parental
investments. A second-born always has to share parental time with the first-born. According to
Price, in two-child families the first-born receives about 20 minutes of quality father-time and
25 minutes of quality mother-time more each day at each age than the second-born child does at
2 Although there is no genetic component to birth order, there may be biological differences since children of
higher birth order have older mothers. However, conditional on the age of the mother this suggests there
should be no birth order effects. Black et al. (2005) find that controlling for the age of the mother at birth and
for birth characteristics, such as birth weight, increases the estimated birth order effect, suggesting that
potential biological differences are actually working in the opposite direction. 3 The stopping rule is related to perceptions of parents on the optimal number of children in response to the
“quality” of previous children. If a high quality child is born first, this may induce parents to have more
children who may have a lower quality on average. If the first child is low quality, parents may stop at the first
child. The financial constraints refer to the lower per capita budget in larger families available for investments
in education.

4
the same age. The second-born child gets only slightly less total time with their parents but
quality time, for example time spent reading to or with the child, is crowded out by other
activities such as watching television. Price (2012) confirms this for children in two-child
families where the oldest is read to more often than the younger child (ceteris paribus). He
shows this affects their reading skills at different ages. We similarly argue that first-born
children receive more attention from their parents and assume that there is no direct effect of
birth order on reading skills but only through the time parents read to their children. Any
birth-order effect that is found later on in life originates from the time allocation of the parents
when the children were young. We investigate the possibility that this assumption is false in a
number of sensitivity analyses in this paper.
The propensity score matching analysis relies on different identifying assumptions as the IV
analysis. Therefore this approach is particularly suitable as an additional sensitivity analysis.
What is important in this approach is that there is common support, which means that amongst
families where children are not being read to, there are a sufficient number of families who have
relatively high predicted probabilities of reading to their children, and vice versa amongst
families where children are being read to.
Our paper studies the effects of parental reading to children using Australian data. A major
advantage of these Australian data is the high quality and diversity of the information that is
collected: early reading skill is assessed at age 4 to 5 by the parents and care provider/preschool
teacher separately, and information on reading skill is provided by the teacher at age 6 to 7 up to
age 10 to 11. Furthermore, national reading test results at age 8 to 9 and cognitive skills test
scores at ages 4 to 5, 6 to 7 and 8 to 9 are available. In addition to this, a broad range of other
variables are available describing the household, the child and its childcare or school
environment. Another advantage of the Australian data is its large sample size: two cohorts of
around 4,000 children are followed for 8 years (at 2-yearly intervals) from age 4 to 5 and from
age 0 to 1 respectively. We find that reading to children has positive effects on the reading skills
of these children, even after allowing for the endogeneity of reading to children and after
accounting for a wide range of personal and family characteristics.
Our contribution to the literature is threefold. First, although not conclusive, our results
provide substantial support for a causal effect of reading to children on the reading skill of the
child rather than establish a mere correlation. Second, we use a variety of measures of the
reading skill of the child in addition to cognitive skill measures at different ages, as well as
different methodologies. Third, since we can follow young children up to age 10 to 11, our data
allow us to study persistence of the “reading to” effect.
5
Our paper is set up as follows. In section 2 we discuss selected recent studies on the effects
of reading to children. Section 3 presents the data. Section 4 explores the relationship between
reading to children and reading skill of the child. Section 5 presents our baseline estimates and a
wide range of sensitivity analyses using both instrumental variable and propensity score
matching approaches. Section 6 concludes.
2 Previous studies on reading to children
We are interested in the early reading skills of children, in particular in the role that reading to
children at a young age has in the development of these reading skills. Several studies in the
education literature have investigated this issue.
There have been a few papers that ask a question similar to ours and even use similar
information. For example, Raikes et al. (2006) study a sample of low-income families and find
critical links between maternal bookreading and children’s language and cognitive
development at age 14, 24, and 36 months. Positive associations between bookreading and
children’s language and cognitive development were apparent around 36 months of age. The
probability of mothers reading to their children daily depends among others on being first born
and on maternal education. First-born children were more likely to be read to daily than were
later-born children, possibly because the former had fewer competing demands for their time.
Boys were less likely to be read to daily than were girls, possibly because parents perceive boys
as less verbal, more active, or harder to engage in reading activities. Even after controlling for a
range of parent and child factors, concurrent reading (i.e. reading to the child in the current time
period) is associated with child language. However, Raikes et al. (2006) are not concerned with
confirming the actual causality of reading to a child, and stop at identifying the strong
association.
Bradley et al. (2001) investigate the differential effects of reading to children, finding that
the effect of reading to 3- and 4-year-olds may be less strong in the absence of enriching
out-of-home experiences than in the presence of such experiences. Parents from a higher social
background engage children more in conversations, read to their children more, and provide
more teaching experience. Despite this more in-depth analysis, again actual causality is not
investigated.
Two other papers, Sénéchal and LeFevre (2002) and Kloosterman et al. (2011), compare
the effect of reading to children to other reading-related behavior, such as formal reading
instruction and the parental reading example. The first paper examines informal and formal
literacy activities at home. The primary goal of informal literacy activities is the message

6
contained in the print, not the print per se (parents reading a story to their children). If the parent
talks about letters or provides the name and the sound of specific letters, there is a formal
literacy activity. For children from middle- and upper-class homes in Canada, children’s
exposure to books at home played an important indirect role in the development of their reading
skills, whereas, parents’ reports of more formal teaching appear to have a more limited
influence on the process of learning to read. The second paper analyzes a cohort of Dutch
Children (PRIMA) who are followed from age 5 to 6 up to age 11 to 12. They investigate the
effects of the parental reading example and parental reading guidance. Kloosterman et al.
(2011) find that the parental reading example is most relevant for a child’s language
achievement in later grades whereas parental reading instruction, which includes reading to
children, is beneficial for language performance at the start of children’s primary schooling.
This positive effect remains as primary school continues. Again, neither of these two papers
formally investigates causality of reading to children.
In fact, it seems that most previous papers have not tried to isolate the causal effect of
reading to children, although Mol and Bus (2011) in their meta-analysis of print exposure from
infancy to early adulthood indicate that there have been a few experimental and longitudinal
studies which allow for stronger causal inference. The ideal way to investigate this is through an
experiment where children are randomly read to or not.4 Unfortunately, many experimental
studies have been for small numbers of children only (up to 280 observations as reported in
Manz et al., 2010) and are for specific subpopulations.
Three papers explicitly aim to estimate relationships that can be interpreted as causal effects
of parents’ reading behavior on children’s outcomes. Using time-use data for parents and their
6-15 year old children, Mancini et al. (2011) investigate the effect of parent’s reading behavior
in the presence of their children (including a broad range of activities, such as studying and
reading, helping with siblings’ homework, and reading to siblings) on their children’s reading
behavior. They find long-run associations, comparing children’s and parents’ reading habits,
and they find a short-run causal effect on reading by the child after exposure to parental reading.
The short-run effect is identified through child-specific exposure to reading by the parent within
a family fixed-effect approach. The association can be interpreted as a causal effect under the
assumption that any unobservable differences between siblings relevant to the propensity to
4 Neuman (1999) for example presents the results from a field experiment in which some child care centers in
the U.S. (Pennsylvania) were flooded with high-quality children’s books, at a ratio of 5 books per child while
other child care centers did not receive such treatment. Some 8 months after the start of the experiment the
children from the treated centers scored significantly higher in reading tests than the children from the control
group.

7
read are not related to differences in exposure to reading by the parent. This is equivalent to our
assumption of reading skill not being directly affected by being the oldest child but only
indirectly through the frequency of being read to, which is expected to be higher for the oldest
child than for children down the birth order.
The second paper aiming to identify a causal effect is by Hale et al. (2011) who analyze the
influence of having a language-based bed-time routine (reading a story, telling a story, praying,
talking, singing, and/or playing a game) at age 3 on a range of outcomes at age 5. They use the
National Child Development Study (NCDS), a British cohort study. To account for potential
endogeneity of the bed-time routine they use propensity score matching. The study finds a
positive effect of having a language-based bedtime routine on cognitive development, which
remains after controlling for a wide range of variables and applying the propensity score
matching approach. We use a similar approach in this paper, but extend the analysis by applying
the alternative methodology of Instrumental Variables to address the potential endogeneity of
reading to a child, and by investigating a very extensive range of reading-related skill measures
as well as other cognitive skill measures.
The third and most recent paper (Price, 2012) uses intra-family differences in reading to
children by birth order and birth spacing to estimate a causal effect of time spent reading to a
child on the child’s reading outcomes at different ages.5 He focuses on families with two
children. The advantage of this approach is that unobserved heterogeneity across families is
taken into account, while using birth order and birth spacing as instruments circumvents the
issue that mothers may spend more time reading to their child if it performs poorly at reading. In
our paper, we only observe outcomes for one child per family but we aim to control for as much
of the unobserved heterogeneity as is possible using our rich data, and in one of our sensitivity
analyses we limit the sample of analysis to same-size families with two children.
3 Data – Australia’s LSAC
The empirical analysis in our paper is based on data from Growing Up in Australia, the
Longitudinal Study of Australian Children (LSAC).6 The LSAC is a biennial cohort-based
panel dataset, which started in 2004. Information is collected for two birth cohorts: the Birth
Cohort (B cohort) children who were born in a 12-month period from March 2003 to February
2004, so all children are aged between 0 and 1 in the first wave; and the Child Cohort (K cohort)
children who were born between March 1999 and February 2000, so they were between 4 and 5
5 Birth spacing is potentially endogenous and therefore is instrumented with miscarriage between births.
6 See the appendix for additional information on the survey.
8
years old in the first wave. Families with children of the appropriate ages were selected from the
Medicare (Australia’s universal health care scheme) enrollment database held by the Health
Insurance Commission and invited to participate in the study. Only one child per family is
observed in detail and followed over time. Although surveys are only conducted once every two
years, secondary information is gathered via mail-out questionnaires in the years in which the
primary surveys are not conducted.
The unit of observation in LSAC is the so called “study child” i.e. the child who is being
studied. Information about this child is collected from multiple sources: parents, childcare
centers/home-based carers, pre-school/school teachers and the study children themselves.
LSAC collects data through various methods: parent’s face-to-face interview, parent’s
self-completion questionnaires, time-use diaries, home/center-based carer’s questionnaire,
teacher’s questionnaire, child assessments, and child self-report interview once they are 4-5
years old.
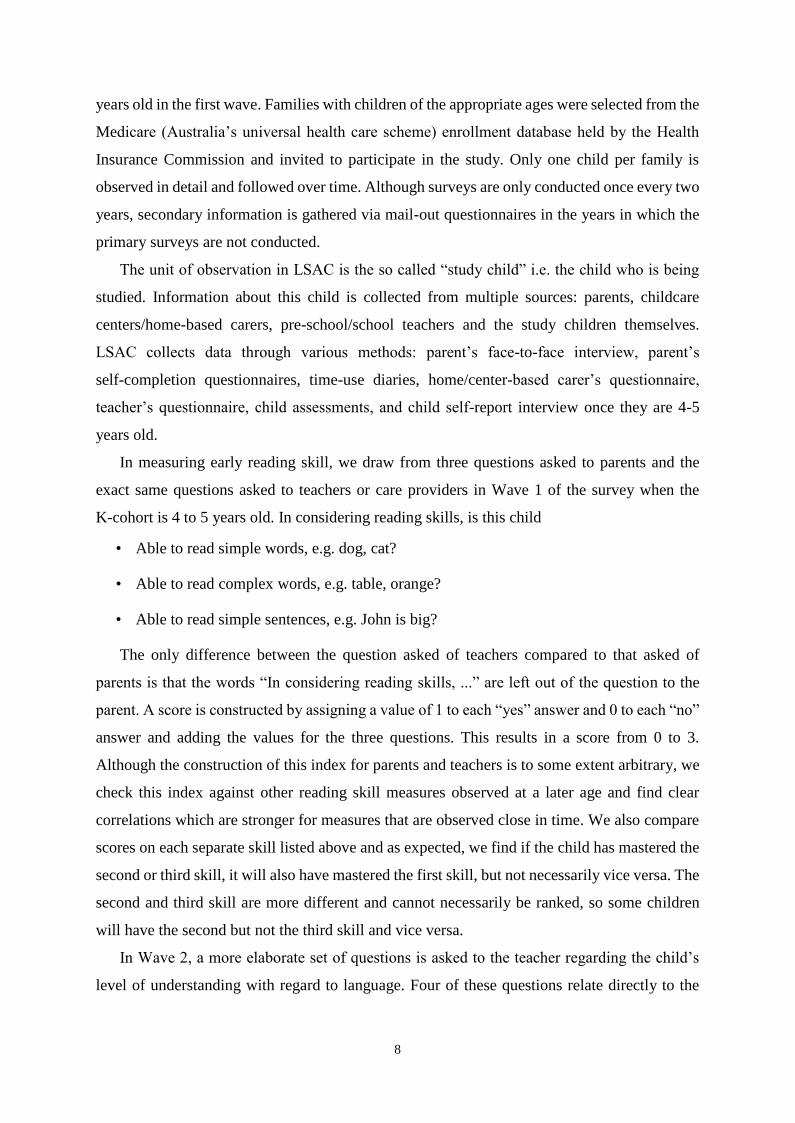
In measuring early reading skill, we draw from three questions asked to parents and the
exact same questions asked to teachers or care providers in Wave 1 of the survey when the
K-cohort is 4 to 5 years old. In considering reading skills, is this child
• Able to read simple words, e.g. dog, cat?
• Able to read complex words, e.g. table, orange?
• Able to read simple sentences, e.g. John is big?
The only difference between the question asked of teachers compared to that asked of
parents is that the words “In considering reading skills, ...” are left out of the question to the
parent. A score is constructed by assigning a value of 1 to each “yes” answer and 0 to each “no”
answer and adding the values for the three questions. This results in a score from 0 to 3.
Although the construction of this index for parents and teachers is to some extent arbitrary, we
check this index against other reading skill measures observed at a later age and find clear
correlations which are stronger for measures that are observed close in time. We also compare
scores on each separate skill listed above and as expected, we find if the child has mastered the
second or third skill, it will also have mastered the first skill, but not necessarily vice versa. The
second and third skill are more different and cannot necessarily be ranked, so some children
will have the second but not the third skill and vice versa.
In Wave 2, a more elaborate set of questions is asked to the teacher regarding the child’s
level of understanding with regard to language. Four of these questions relate directly to the
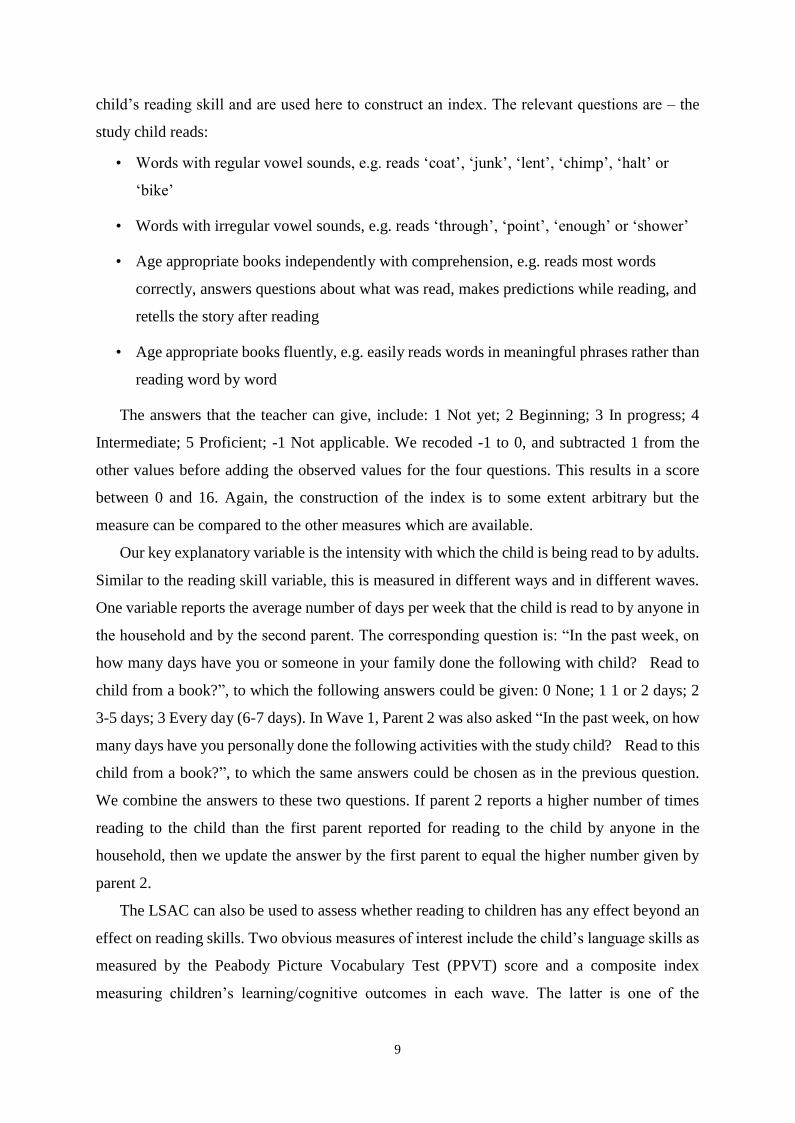
9
child’s reading skill and are used here to construct an index. The relevant questions are – the
study child reads:
• Words with regular vowel sounds, e.g. reads ‘coat’, ‘junk’, ‘lent’, ‘chimp’, ‘halt’ or
‘bike’
• Words with irregular vowel sounds, e.g. reads ‘through’, ‘point’, ‘enough’ or ‘shower’
• Age appropriate books independently with comprehension, e.g. reads most words
correctly, answers questions about what was read, makes predictions while reading, and
retells the story after reading
• Age appropriate books fluently, e.g. easily reads words in meaningful phrases rather than
reading word by word
The answers that the teacher can give, include: 1 Not yet; 2 Beginning; 3 In progress; 4
Intermediate; 5 Proficient; -1 Not applicable. We recoded -1 to 0, and subtracted 1 from the
other values before adding the observed values for the four questions. This results in a score
between 0 and 16. Again, the construction of the index is to some extent arbitrary but the
measure can be compared to the other measures which are available.
Our key explanatory variable is the intensity with which the child is being read to by adults.
Similar to the reading skill variable, this is measured in different ways and in different waves.
One variable reports the average number of days per week that the child is read to by anyone in
the household and by the second parent. The corresponding question is: “In the past week, on
how many days have you or someone in your family done the following with child? Read to
child from a book?”, to which the following answers could be given: 0 None; 1 1 or 2 days; 2
3-5 days; 3 Every day (6-7 days). In Wave 1, Parent 2 was also asked “In the past week, on how
many days have you personally done the following activities with the study child? Read to this
child from a book?”, to which the same answers could be chosen as in the previous question.
We combine the answers to these two questions. If parent 2 reports a higher number of times
reading to the child than the first parent reported for reading to the child by anyone in the
household, then we update the answer by the first parent to equal the higher number given by
parent 2.
The LSAC can also be used to assess whether reading to children has any effect beyond an
effect on reading skills. Two obvious measures of interest include the child’s language skills as
measured by the Peabody Picture Vocabulary Test (PPVT) score and a composite index
measuring children’s learning/cognitive outcomes in each wave. The latter is one of the
10
domains of the LSAC Outcome Index with the two other domains being: physical, and social
and emotional. For learning there are two sub-domains: language and literacy, and numeracy
and cognition. A group of researchers associated with the LSAC has developed the LSAC
Outcome Index using various child outcome measures in the LSAC (described in Sanson et al.,
2005). The Outcome Index is a composite measure to indicate how children are developing.
The components of this index change over the waves (with the children’s ages), but the
interpretation of the index is broadly consistent across the waves (and children’s ages). In the
first two waves for the B cohort the outcome measures are based on what the main carer reports.
In the third wave of the B cohort (and all waves of the K cohort) some of the measures are based
on tests applied by the interviewer. In our paper we use the learning domain, which represents
children’s cognitive skills. The score for each domain is standardized to have a mean of 100 and
a standard deviation of 10 over all children in each wave. Finally, Wave 4 of the LSAC includes
the so-called NAPLAN [National Assessment Program – Literacy and Numeracy] at ages 8-9
for those children whose parents have given their consent to merge this information with the
survey data. This is the result from a nationally comparable test held on the same date in all
schools across Australia for all students in Year 3.
4 Exploring the relationship between reading to children and reading skills
of the child
Examining the raw data in Table 1 shows that children who are read to on more days of the
week score higher on average on the parent’s assessment of reading, the teacher’s or carer’s
assessment of reading when the child is aged 4 to 5, on the teacher’s assessment when the child
is aged 6 to 7 up to age 10 to 11, on the NAPLAN reading test, PPVT, on the NAPLAN
numeracy test, and on the cognitive index at age 4 to 5, 6 to 7 and 8 to 9, as well as the
non-cognitive index. 7 Only the Physical Health index varies to a much lesser degree with the
“reading to" frequency. These patterns are observed for boys and girls, although girls score
higher than boys on average across the board (except on the numeracy test).
The raw correlations are equally visible when using data on children observed in Wave 3 of
the B cohort, independent of whether reading to the child at age 4 to 5 or reading to the child at
age 2 to 3 are used, and independent of whether parents’ scores, teachers’ scores or cognitive
indices are used. Figures 1 to 4 clearly show better reading outcomes and higher cognitive skills
for boys and girls who have been read to more often at age 4 to 5. The graphs in Figure 1
consistently show that the lowest score is observed less often and higher scores are observed
7 The LSAC data show that parents are equally likely to read to boys as to girls (see Appendix Table A1).

11
more often amongst children whose parents read to them more frequently. Figure 2 presents a
kernel density graph of a nationally comparable reading measure for boys and girls at age 8 to 9
as observed through the NAPLAN reading test results. Again this shows a shift to higher
reading scores for children who are being read to more frequently. Broadening our skill
measure to cognitive skills, the top panels of Figures 3 (boys) and 4 (girls) show kernel density
graphs of the cognitive index. These also show a shift to the right of the probability line with a
higher frequency of reading to the child. Clearly, the probability of high learning outcomes
increases for children whose parents read to them more often. Across all “reading to"
frequencies girls are more likely than boys to score high on the reading skill index and on the
learning/cognitive measure.
Despite the availability of panel data, a standard panel approach is not useful given that
reading to children is usually done at younger ages only (before children can read for
themselves). Nevertheless in this exploration of the raw data it is useful to examine the
development of reading skill and the cognitive index over time, overall and for different levels
of reading to the child. Panels b and c of Figures 3 and 4 show that cognitive skills of children
who have been read to more often remain high at ages 6 to 7 and 8 to 9. Furthermore, as Table 2
shows, reading skills are correlated over time, as well as with general language skills (PPVT)
and cognitive skills. This consistency over time and between the various reading skill measures
provides further confidence in the measures used, particularly in the index constructed from
answers to questions on the child’s reading ability by the parent or the teacher at age 4 to 5.
Reading scores or other skill measures that are observed closer in time to each other have higher
correlation coefficients. As expected, skills that are more similar have higher correlation
coefficients. For example, teacher-assessed reading skill measures are more correlated with the
NAPLAN reading test score than with the NAPLAN numeracy score. The index for
socio-emotional development is much less correlated with the other scores, which all measure
some aspect of cognitive skill, and physical health is the least correlated. Finally, correlations
are higher for skill measures observed from age 6 to 7 onwards compared to earlier skill
measures.
Table 1 and Figures 1 to 4 show that there is a clear association between reading to children
at a young age, and the level of reading and other skills that these children develop in the
following years. In the multivariate analyses, we explore whether this association is likely to be
a causal effect by controlling for many personal and family characteristics that affect reading
skill directly and by allowing for the potential endogeneity of the intensity with which children
are being read to.

12
5 Empirical analysis
5.1 Set-up of the analysis
The recent literature on educational attainment emphasizes the significance of parental
investments in human capital since childhood. It recognizes the importance of human capital
investments throughout childhood on later schooling choices and outcomes (see for example,
Feinstein and Symons, 1999 who use a value-added formulation from one period to the next;
Haveman and Wolfe, 1995 for a literature review; Maani and Kalb, 2007; and Sandy and
Duncan, 2010 for an application).
We follow the literature in which models of children’s academic performance are based on
a production function (Todd and Wolpin, 2003; 2007), where the parents are producers in the
sense that parents make human capital investments in their children throughout childhood. In
our paper academic performance is measured at an early age by either the level of reading skill
as measured by the parent, teacher or national tests, or by the cognitive index at different ages.
We model academic performance, as measured by the level of reading or other skills as:
( )
where is the reading skill or cognitive skill displayed by the child (representing both ability
and investments or effort); represents personal talents and abilities (as for example
approximated through the parents’ education level); and is a vector of personal and parental
resources, and environment; and is an error term which represents the effect of unobserved
factors, such as motivation. In the central analysis we use as dependent variable the reading skill
S of children at age 4 to 5. We assume that the reading skill of child i is a latent variable,
observed imperfectly through a discrete score , which is constructed from information given
by parents on a scale from 0 to 3. We assume that the reading skill S of children at age 4 to 5
depends linearly on the ability of the child , the child’s resources and effort , resources of
the parents and the living environment and the effort of parents in reading to their children
:
+ + + (1)
where β, and are vectors of parameters, and δ represents the effect of reading to on
reading skill.
We only observe
(2)

13
where α is a vector of parameters to be estimated together with the parameters above, in which
equals −∞ and equals ∞. The parameters can be estimated using an ordered probit
specification which assumes ε is normally distributed.
Variables considered for inclusion in are age of the child (Age), and the parents’
education level. Variables considered for inclusion in are health status of the child (Health
child), presence of special care needs of the child (Needs child), whether the child enjoys
physical activity (Activity), amount of time the child watches TV on average on weekdays
(Watching TV weekdays) and on weekends (Watching TV weekends), amount of time the child
uses a computer on weekdays (Use computer weekdays) and on weekends (Use computer
weekends). Variables considered for inclusion in are the number of children’s books in the
home (Books), whether another language than English is spoken to the child (Non-English), the
number of televisions in the home (Television number), whether the child has access to a
computer (Computer access), logarithm of total household income (log HH Income), and age of
the parents (age1 and age2).
The main variable of interest in our study is the time parents spent reading to the child. Our
“reading to” variable is the time during which the child was read to at home, distinguishing
between three categories: less than 3 times a week, 3-5 times a week and 6-7 times a week.
Since most parents read at least once per week to their child, we combine the two lowest
observed frequencies of reading to the child of 0 times and 1-2 times per week.
In order to measure the causal effect of the intensity with which children are read to, we
need to account for the potential endogeneity of , since this is likely to be affected by similar
unobserved factors as the reading skill of the child. We need to instrument for with
variables that are strongly correlated with but uncorrelated with the unobserved
heterogeneity in the reading skill of the child. In our baseline estimates we use variables that
affect the time that the parent has available due to reasons exogenous to the reading skill. These
variables are the number of siblings and whether or not the child is the oldest child. The
intensity with which children are read to can be represented by:
+ + (3)
where , , and are vectors of parameters, and is an error term which is
potentially correlated with in equation (1).
We use three different approaches for the empirical analysis. In the first approach we
estimate joint equations for reading skill (or other skills) and the amount of reading to the child,
using the Full Information Maximum Likelihood method (FIML). In this approach we specify

14
the equations in line with how we observe the dependent variables. For example, we use an
ordered probit specification for the amount of reading to the child and the reading assessments
by the teacher, but we use a continuous specification for the NAPLAN reading test. The
frequency of reading to the child is specified as an ordered probit, leading to a number of
different joint model specification, which are estimated using the BIOPROBIT (Sajaia, 2008)
and CMP (Roodman, 2011) commands in Stata. In the second approach, we simplify the
equations by linearizing all dependent variables, and then applying a 2SLS approach using the
IVREG2 command in Stata. Finally, in the third approach we use propensity score matching
(command PSMATCH2 in Stata) to account for selectivity in the intensity with which children
are being read to through a reweighing of the skill equation in (1) based on predicted propensity
scores (Leuven and Sianesi, 2003).
5.2 Baseline estimates
Columns (1) and (4) of Table 3 show the parameter estimates when we ignore potential
endogeneity of the intensity of reading to children. In the estimation we use an ordered probit
specification of the reading skill. The three top rows present the results when only a constant is
included and the bottom set of rows present results with all explanatory variables included. The
coefficients on the parental reading variable remain significant and of the same size after
including a broad range of variables. If anything, the size of the coefficients increases slightly
although significance decreases somewhat. Clearly, reading skills of children at age 4 to 5 are
positively associated with the intensity of parental reading to children; although for girls only
intensive parental reading to their children – 6 to 7 times per week – has a significant effect,
once all the explanatory variables are included. Most of the other variables do not have a
significant effect on the reading skills of children with the exception of age of the child and
children of non-English speaking parents (which both have a positive effect). Other variables
with an effect are computer use in the weekends, which has a positive effect – for boys only –,
and age of the first parent, which has a negative effect up to age 40.
As discussed before, it need not be the case that reading to children is exogenous to the
reading skills of the children. It could be that there are unobserved characteristics of the
children or unobserved circumstances that affect both the time read to children and the reading
skills of the children thus causing a spurious correlation between the two. For example, parents
who have more of a reading attitude which their children inherit may also enjoy reading to
children. Or, children who enjoyed reading more because they have better reading skills may
also enjoy more being read to. Columns (3) and (6) of Table 3 show parameter estimates for
15
boys and girls respectively if we allow for correlation between being read to and reading skills
by estimating a bivariate ordered probit model. Clearly, the effects of observed characteristics
on reading skill hardly change, with one exception: the effect of being read to. In the bivariate
ordered probit there is negative correlation between reading to children and the reading skills of
children through some observed characteristics. The age of the child has a positive effect on its
reading skill but a negative effect on the intensity they are read to (the latter is not obvious from
the observed raw data). The same holds for the age of parent 1 which increases the frequency of
reading to the child up to age 40 at first after which it declines, whereas reading skill of the child
declines with age of the parent at first after which it increases again just after age 40. Perhaps
older parents are more keen to invest in their children, but their age may have a direct negative
effect on their child’s abilities. Again, after introducing a broad range of explanatory variables,
the coefficients on parental reading to the child remain significant and increase slightly
compared to a simple specification including only constants in each equation and the
instrumental variables in the “reading to” equation.
Furthermore, conditional on the observed characteristics there is a significant negative
correlation through unobserved characteristics between reading to children and the reading
skills of children. This suggests that children who have better reading skills are less likely to be
read to, or similarly, children with worse reading skills are more likely to be read to. If we do
not account for this correlation the “treatment effect” of being read to would be underestimated.
Indeed the parameter estimates of reading intensity on reading skill increase substantially.
Now, less intensive reading to girls also has a significant positive effects on the reading skill.
Columns (2) and (5) of Table 3 show that there are a couple of variables that influence the
intensity with which children are being read to. The older the child the lower this intensity. The
number of books at home has a positive effect, while the number of televisions as well as
watching television during weekdays have negative effects. Furthermore, higher educated
parents are more likely to read to their children. Finally, being the oldest child has a positive
effect on the intensity of being read to while the number of siblings has a negative effect. The
effect on the intensity of being read to is stronger for the oldest child variable than for the
number of siblings variable. The effects of the latter two variables are in line with what one
would expect: parents are likely to have more time available for the oldest child, since at least
for a few years this is the only child in the household, whereas having more siblings means the
parents’ time available for their child needs to be shared with brothers and sisters. Apart from

16
the effect on available time to read to the child, these two latter characteristics are not expected
to have a direct effect on the child’s ability to read.8
Although the number of children is potentially linked to the socio-economic status of the
household, where low-SES families are more likely to have a large number of children and to
have children with lower skills, this does not appear to play a major role in the analysis. First, all
analyzes include education of the parents and household income which combined are likely to
remove most of the low SES effect. Furthermore, when we exclude families over three children,
the results do not change much, indicating that the concern regarding low-SES families with
many children driving the results is unlikely to be relevant. Applying an even more stringent
selection (following Price, 2012) by re-estimating the models for two-child families only,
relying on an indicator for the oldest child as the only instrument, the results again remain. As a
final check, we include the number of siblings of the study child, six years later when the study
child is aged 10 to 11. If the effect of the number of siblings on the amount of time spent reading
to the child is caused by the fact that the number of siblings is an indicator of low-SES status of
the family, then this new variable should be a better predictor for the amount of time spent
reading since it is a better approximation of the completed family size. The difference in family
size between being aged 4 to 5 and being aged 10 to 11 is particularly important when the study
child is the oldest or second-oldest child. The results for this alternative specification show that
the coefficient on the number of siblings becomes smaller and its significance is reduced. If we
include both current number of siblings and "future" number of siblings then only the current
number of siblings is significant. This indicates that it is the actual presence of other children in
the household at that point in time that affects the frequency the study child is read to, and not
the socioeconomic status of the family that the number of children variable may reflect.
An alternative pathway for birth order to have an effect on reading skill is through different
birth outcomes. However, we find that including observed birth characteristics such as birth
weight, early vs. late birth and twin (or more) birth did not change the results, and that these
additional characteristics were mostly insignificant. This indicates that the effect of birth order
does not work through biological differences at birth. In addition, we control for mother’s age to
take out any effects arising because of the age of mother at birth.
Finally, instead of reading to the child, we use other activities that the parent does together
with the child, using again number of siblings and being the oldest child in the other activity
equation and not in the reading skill equation. Unlike for the “reading to” variable there are no
8 See our discussion in the introduction.

17
clear patterns of positive effects across specifications, and the relationship of the number of
siblings and being the oldest child with these activities is much less clear than for reading.
Furthermore, often the estimated effect on reading skills is zero and negative (e.g. for playing
outside) or it is small and insignificant (e.g. for involving child in everyday activities at home).
5.3 Sensitivity analysis and robustness checks
To further explore the robustness of our findings we performed a number of sensitivity analyzes
and robustness checks which are reported in Tables 4 to 7. Panel a of Table 4 replicates the
main parameters of interest from the bivariate ordered probit model estimates in Table 3.
5.3.1 Different instrumental variable choices and the addition of variables
Panel b of Table 4 shows how the main parameter estimates are affected if we use different
variables. When we only use the dummy variable for being the oldest child as instrumental
variable the relevant parameter estimates hardly change. When we only use the number of
siblings as instrumental variable the parameter estimates for boys change and become much
less significant, while for girls there is hardly any effect. Apparently being the oldest child is an
important variable for boys.
The last row in panel b of the table shows that when we add two additional explanatory
variables that indicate the parents’ involvement with the child through other activities –that is,
other educational activities with the child (such as going to a museum or the library) and other
activities with the child (such as going to the movies or a playground)– the relevant parameter
estimates for the level of reading to the child are hardly affected. Estimation results (not fully
presented in this paper) show that although these other activities are also associated with
reading skills (particularly the education activities and particularly for boys) and are to some
extent correlated to the level of reading to your child, they do not alter the effect of reading to
your child in the simple ordered probit nor in the bivariate ordered probit. This indicates that it
really is the reading to a child through which the effect works and not just the amount of
attention provided by the parent (despite this being important as well in its own right).
5.3.2 Alternative measures of reading skill
Panel c of Table 4 shows parameter estimates when we use alternative measures for the reading
skills of the children. When teacher (or childcare worker) assessment at children’s age 4 to 5 is
used, neither for boys nor for girls is there a significant effect of reading to children on the
reading skills of the children. It could be that at these ages of the child it is difficult for teachers

18
to assess the reading skills of the children.9 This appears to be confirmed by the observation
that teacher assessments at children’s ages 6 to 7, 8 to 9, and 10 to 11 all show positive effects of
reading to children at age 4 to 5 on their reading skills at later ages. The final reading skill score
measured by teachers is a relative score by teachers of each child with regard to their reading
progress compared to other children.10
Again this confirms the persistence of positive
(flow-on) effects of reading to children. Interestingly, it appears that teachers are better able
than parents to assess the child’s relative reading ability, since a similar score provided by
parents clearly overestimates the child’s relative performance on average. Only 9% of parents
believe their child has below-average reading skills versus 19% of teachers, compared to 63%
of parents who think their child has above average skills versus 39% of teachers. Despite this
difference, the two scores are clearly correlated.
The data also allow the inclusion of the NAPLAN reading test results for the children whose
parents have provided consent for these results to be linked to the information provided in the
survey. Results using Year 3 (age 8 to 9) information on the reading test are reported in the
bottom row in panel c of the table. Although this results in a much smaller sample for boys and
girls than the samples used in the previous specifications, the reading results are derived from a
nationally administered test which makes the outcomes for the children more comparable
across the sample. The results again show substantial positive effects of reading to young
children.
5.3.3 Measures of other skills
Panel d reports the results for a few broader skills acquired by the child. The first component
included in panel d, PPVT, focuses on language skills for ages 4 to 5, which shows strong
positive results of reading to children. The PPVT score feeds into the cognitive index, which is
a broader measure of learning skills. The cognitive skill index is measured at various ages – 4 to
5, 6 to 7, 8 to 9 – and it shows very similar results over time, but the effect of being read to more
frequently appears to increase as children age. Since the index used to measure cognitive skills
is standardized (with mean 100 and standard deviation 10) within each age group the size of the
effect is comparable across time.
The final row reports results for the non-cognitive index, which shows that although there is
a correlation between reading to children and non-cognitive outcomes in the raw data, this is
9 We checked that it was not the much smaller sample when using the teacher scores that caused the lack of
effect by using the same sample in the analysis with the reading skill assessed by the parent as is used by the
reading skill assessed by the teacher. 10
There are five possible outcomes ranging from much below average to much above average (1-5).

19
unlikely to be due to a direct effect from reading to children. The effects are small and
insignificant for boys and girls.
5.3.4 Restricting the sample: two-child families
Panel e in Table 4 reports the parameter estimates when we restrict the sample of analysis to
two-child families only. Although unlike Price (2012), we do not have the benefit of multiple
observations per family to filter out family heterogeneity completely, the sample restriction
leads to a more homogenous set of families while still controlling for a broad range of other
family characteristics. For boys the significance of the effects remains nearly as strong as in the
baseline estimates despite a much reduced sample size, while for girls the significance reduces
substantially although one of the “reading to” dummy variables is still significant at the 10%
level.
5.3.5 Using alternative data: the Birth Cohort
The final panel in Table 4, Panel f, shows parameter estimates when we use the other cohort in
the data, the Birth Cohort. Being read to at age 4 to 5 has similar effects as the effects measured
for our baseline Child Cohort in Panel a. For this younger cohort we also have information on
whether the child was read to at a younger age. For boys and girls being read to at age 2 to 3 has
a positive effect on their reading skills at age 4 to 5 which is similar to the results reported for
the effect of being read to at age 4 to 5.11
5.3.6 Linearized models: OLS and 2SLS
In Table 5 we investigate the sensitivity of our main findings with respect to functional form
assumptions by performing OLS and 2SLS estimates in which the intensity of being read to is
included as a continuous linear variable while reading skill is also specified as a linear
continuous variable. In both the OLS estimates and the 2SLS estimates the intensity with which
children are being read to has positive effects on the reading skills of the children. The
diagnostic tests for the 2SLS estimates are all passed except for the overidentification test for
boys.
Similar results are obtained when only a dummy for being the oldest child is included as an
instrument (columns 3 and 4 of the table), or when two additional variables indicating the
number of other non-educational and the number of other educational activities undertaken
with the child are included. In the latter case the effect of reading to children becomes slightly
11
In addition to the parameter estimates reported in Table 4 we also performed estimates in which we use an
alternative “reading to” measure, i.e. the reading intensity in average number of minutes per day. This
variable is not observed as frequently as our main “reading to” measure. Nevertheless the results are again
very similar.
20
smaller but not by much (similar to what was found in Panel b of Table 4. This again confirms
that it is the reading to a child and not just the amount of attention provided by the parent
through which the effect works.
We investigate the results obtained here further by restricting the sample to families with 1
or 2 siblings. Although the overidentification test for boys improves, the p-value is still only
0.12. Similarly, if we replace the indicator for being the oldest child with a birth order variable,
the p-value of the test improves but is still only 0.18. The failure to pass the overidentification
test convincingly appears quite persistent. However, this changes when we use the Birth Cohort
in the LSAC to run similar regressions as for the Child Cohort. The results reported in Table 6
show that the estimated coefficients from the Birth Cohort are similar to those from the Child
Cohort, but now the diagnostic tests for the 2SLS estimates are all passed for boys and girls, and
for the specification based on reading to children at age 4 to 5, as well as for the specification
based on reading to children at age 2 to 3.
5.3.7 The Propensity Score Matching approach
As a final robustness check we used propensity score matching to account for possible
selectivity in the reading to children. PSMATCH2 in Stata is used to compute the matching
weights. We used the kernel matching approach using only observations which are on the
common support. Table 7 shows the parameter estimates for the propensity score matching
approach and for comparison the table also shows the unconditional effects, which are obtained
by estimating the relevant specification of equation (1) on its own. For example, for reading
skill measured by the parents we estimate an ordered probit similar to what was used in Table 3
in the first columns for boys and girls to obtain the unconditional effects. The only difference is
the way the “reading to" variable is specified. Instead of three categories, we now only
distinguish two categories (reading on 6 to 7 days per week versus reading on fewer days). This
restriction is necessary to apply the propensity score matching approach which requires the
definition of a treatment group and a control group based on the potentially endogenous
variable. In our case, the treatment group is defined as the children whose parents read to them
on 6 to 7 days per week, whereas the control group consists of all other children.
Propensity scores are obtained for each child by predicting the probability of being in the
treatment group based on the estimated coefficients of the probit specification of equation (3).
The propensity scores are then used to match children from the control group to children from
the treatment group. Each child from the treatment group is matched to children from the
control group who are on the common support and who have the smallest difference in

21
propensity score. Children in the control group who are closest to the child in the treatment
group are assigned the highest weight, with decreasing weight for children who have a larger
difference. Some children in the control group are used multiple times as a match (the weights
assigned in each of the matches are added together to obtain the total weight for that observation
in the control group) while others may not be used at all (they will have weight zero). Weights
are also zero for observation off the common support.
Comparing summary statistics across the full sample and across the reduced sample used in
the estimation applying propensity score matching weights, we find that they are the same,
indicating that the reduced sample is still representative of the same population as the full
sample. For each analysis we also carry out a covariate imbalance test in the treatment and
control group before and after matching (using PSTEST in Stata). In all cases we find improved
balancing after the matching, with t-tests rejecting inequality of variable means after matching,
while before matching inequality can often not be rejected. The pseudo of the propensity
score equation is in between 0.111 and 0.136 for the analyses for boys, and between 0.105 and
0.128 for the analyses for girls in Table 7. Several of the explanatory variables in these
equations are estimated with significant coefficients.
To obtain the conditional effects, we use the weights generated by the propensity score
matching approach to estimate the same equation as for the unconditional effects. That is, a
weighted estimation of equation (1) on its own with a binary “reading to" variable. Conditional
and unconditional estimates of the “reading to" coefficient are reported in Table 7, together
with the number of unweighted observations used in the analysis. The unconditional effects are
smaller than those reported in Table 3, since the reference group is now children who are read to
0 to 5 times per week instead of only 0 to 2 times per week. This is shown clearly in the second
row of the table, where we present the effect of reading to a child 6-7 times per week compared
to 0-2 times per week which is estimated on a smaller sample, leaving out the children who
were read to 3-5 times per week. The coefficients are now considerably larger, although not as
large as the coefficients in Table 3.
The other coefficients in the model which are not reported here, are similar to those reported
in Table 3. Compared to the FIML results reported in Table 3, we find that correcting for
selectivity using the propensity score matching approach only changes the effect of being read
to on the reading skills slightly. The conditional effect of reading to the child 6 to 7 times per
week remains significant and about the same size. For both boys and girls we find that the
significant positive effects of being read to on reading skills remain after applying the weights.
22
Most of the other parameter estimates presented in Table 7 are also positive and
significantly different from zero, particularly for girls. Most often the propensity matching
score estimate is bigger than the unconditional estimate, but not by much. For the effects of
being read to on cognitive skills we also find significant positive effects which decreases with
age for boys and for girls. Although generally smaller, these effects are comparable to the
estimation results presented in Table 4. For example, the numeracy effect as measured through
NAPLAN is positive and significant, and smaller than the reading effect measured through
NAPLAN. Finally, the most important difference from the results in Table 3 is that the effects
of being read to on non-cognitive skills for boys and girls remain significantly different from
zero although for girls the effect is different from zero at a 10% significance level only and the
effect remains smaller than the effect on the cognitive skill index.12
5.4 Interpretation of the effects of reading to children
The size of the effect of reading to children can be interpreted in a number of different ways.
Table 8 presents a few examples of these to gauge the size of estimated effects. We start with
the baseline results. First, comparing these to the effect of being older in age shows that
compared to not reading or reading on 1-2 days per week, reading on 3-5 days per week to boys
has a similar effect as being just under half a year older, whereas reading on 6-7 days per week
has a similar effect as being just under one year older. For girls the effects are slightly larger
relative to age than for boys, comparing to just over half a year increase in age and just over one
year increase in age respectively. Using the PSM approach, much smaller effects comparable to
being between 1.5 and 2.25 months older are found when we compare the effects of reading to a
child to the effect of age on reading skill as measured by the parent. However, note that in this
approach we are comparing children who are read to 6-7 days per week with children who are
read to 0-5 days per week.
Alternatively we can compute the probability of scoring a 0 on the parental reading skill
measure for the average boy if they are read to at the lowest level (87%) and if they are read to
at the highest level (57%).13
The probability of scoring the highest score of 3 is 1% and 8%
respectively for boys. Similar results are obtained for girls: the probability of scoring a 0 for the
average girl is 86% if they are read to at the lowest level and 43% if they are read to at the
12
When using the 2SLS specification, the results are similar to the findings in Table 3. That is, the effect of
reading to the child on the non-cognitive skill measure disappears when taking the potential endogeneity of
reading to the child into account. 13
These values are computed by averaging the marginal probability of obtaining a score of 0 when being read
to 0-2 times per week (or 6-7 times per week) across all children in the sample using the estimated parameters
from Table 3. This represents the direct effect of reading to children.

23
highest level, whereas the probability of scoring 3 is 1% and 13% respectively. These effects
are stronger than what is observed in the raw data where we don’t allow for the endogeneity of
reading to children, nor for the effects of other characteristics on reading skill.
An interesting alternative specification uses the NAPLAN reading test. Using the observed
standard deviation of around 86 units for boys and girls, we can express the effects of reading to
the child in terms of standard deviations. Using the FIML approach, for boys the effect is about
two thirds of a standard deviation for reading 3 to 5 days per week and just over one and a half
standard deviation for reading 6 to 7 days per week. For girls the effect is smaller than for boys
at 0.58 a standard deviation for reading 3 to 5 days per week and 1.09 standard deviation for
reading 6 to 7 days per week. These effects are larger than those observed in the raw data,
whereas applying the PSM approach to control for endogeneity we obtain smaller effects than
observed in the raw data. However, all effects are of a substantial size.
Finally, examining the results using the specification based on the standardized cognitive
skills at age 4 to 5 more closely, boys experience just over half a standard deviation increase in
the cognitive skill index when they are read to on 3 to 5 days per week, while boys who are read
to on 6 to 7 days per week experience an increase of just under one standard deviation increase
in the cognitive index. The estimated effects for girls are very similar, although slightly smaller
than for boys as was the case with the NAPLAN reading test. Again the effects are larger than
those observed in the raw data, whereas the effects estimated through the PSM approach result
in smaller (but still substantial) effects than observed in the raw data. Price (2012) expresses the
effects he finds for the children in his two-child families also in terms of standard deviations of
difference. He finds that “if the mother increases the frequency of reading to her child by one
day per week during the first ten years of the child’s life, the child’s reading test scores would
increase by about half a standard deviation”.
The above examples show substantial direct effects of reading to children on reading and
cognitive skills for boys and girls, which are smaller when applying the PSM approach but
remain significant under all approaches used to control for the endogeneity of reading to
children. Smaller (and less significant) effects of reading to children are found for numeracy
skills through the NAPLAN numeracy test. For girls, the effect is only significant at the
10%-level, and its size is a third of a standard deviation (for 3 to 5 days of reading) to two thirds
of a standard deviation (for 6 to 7 days of reading). Boys experience a larger effect from 0.41
standard deviation to just over one standard deviation. Very small and insignificant direct
effects of reading to the child are found for the effect on non-cognitive skills of boys and girls at
24
ages 4 to 5, 6 to 7 and 8 to 9.14
Although reading to the child and non-cognitive skills are clearly
correlated in the raw statistics, this seems less likely to be a direct causal effect than for the
cognitive skills.15
Intuition would lead us to expect that skills that are closely related to the “reading to”
activity would be most affected by it, while skills that are in a different domain will be less
affected. Nevertheless, we would expect that all skills related to learning would improve as a
result of the child being read to, given that the reading skill is such a fundamental skill in the
learning process. The results reported in Table 4 and Table 7 correspond to these intuitive
expectations, with closely related skills such as reading being most affected by being read to,
followed by more general learning outcomes such as cognitive skills, and more distant learning
skills such as numeracy skills experiencing smaller effects, while non-cognitive skills are not
directly affected at all by being read to (or when using the PSM approach they are much smaller
and much less significant than the effect of cognitive skills).
6 Conclusions
Cognitive skills of young children are an important determinant of earnings later on in life.
Cognitive skills are not fixed but can be influenced through investment in preschool training,
education at school, but also through parental efforts. Previous studies have stressed the
importance of early life interventions in the cognitive development of children. We contribute
to this literature by showing the importance of parental reading to young children.
We find that parents can play an important role in the development of reading skills and
cognitive skills of their children by reading to them at a young age. We analyze Australian data
on parental investments in terms of the number of times per week they read to their children.
We find that reading to children at age 4 to 5 frequently has significant positive effects on the
reading skills and cognitive skills of children at least up to an age of 10 to 11. Most likely these
positive effects persist over a longer period in the life of the children. Our results are robust to a
wide range of sensitivity analyses. We use a variety of reading skill measures and broader skill
measures referring to cognitive skills. For boys the effect of being read to increases with age.
For girls we do not find such an effect. Nevertheless, for a wide range of skill measures we find
that being read to at a young age has positive effects.
In our analysis we account for possible selectivity in parental reading to children. Estimates
in which parental investments are assumed to be exogenous to the reading skill of the child may
14
Table 3 only reports the results at age 4 to 5. 15
The coefficient only remains significant for boys when using the propensity score matching approach. Using
any of the other approaches and for girls, the effect disappears.

25
be biased. It could be, for example, that parents who make the investment in reading to their
children have children with a higher latent ability to read. We use a variety of approaches to
account for potential selectivity, propensity score matching being one of them. We also apply
an instrumental variable approach in which we use the number of siblings and being the oldest
child as instrumental variables. Our identifying assumption is that being the oldest child and the
number of siblings have effects on the intensity with which children are being read to but have
no direct effect on the reading and cognitive skills of the children. We have carried out
sensitivity analysis around this assumption, investigating alternative approaches which we have
all rejected. It is true that although there is no genetic component to birth order, there may be
biological differences since children of higher birth order have older mothers. However,
conditional on the age of the mother there should be no biological differences related to birth
order. Although it is not the main purpose of our paper we offer an explanation for the birth
order effect that previous studies find. In these studies, skills of individuals are measured later
on in life when the effects of the parental investments in early childhood materialize. First-born
children receive more attention from their parents than later-born children because parents
distribute their time equally over their children. In the initial years of their life first-born
children are the sole focus of attention from their parents. Second-born children always have to
share their parents with the first-born.
Although we cannot directly test our identifying assumption, there is strong supporting
evidence of the causal nature of the effects of being read to on the development of reading and
cognitive skills. Skills that are closely related to the “reading to” activity should be most
affected by it, while skills that are in a different domain will be less affected. This is indeed
what we find. The effect on reading and other cognitive skills is clearly present and remains
when accounting for the endogeneity of reading to children while the effect on non-cognitive
skills disappears when accounting for this endogeneity. In our view, these results combined
strongly suggest a causal effect of parental reading to the child on child outcomes.
The size of the effects of parental reading to children on the reading and other cognitive
skills of their children is substantial. As indicated before, comparing it to the effect of being
older in age, reading on 3-5 days per week to boys has a similar effect as being just under half a
year older, whereas reading on 6-7 days per week has a similar effect as being just under one
year older. For girls the effects are slightly larger relative to age than for boys, comparing to just
over half a year increase in age and just over one year increase in age respectively. In terms of
standardized cognitive skills at age 4 to 5, boys experience just over half a standard deviation
increase in the cognitive skill index when they are read to on 3 to 5 days per week, while boys

26
who are read to on 6 to 7 days per week experience an increase of just under one standard
deviation increase in the cognitive index. The estimated effects for girls are very similar.
What are the implications of our findings? Our main finding is that it is important that
young children are being read to. This is an early-life intervention that seems to be beneficial for
the rest of their lives. We show that there is an important role for parents in the educational
performance of their children. The evidence strongly suggests that parental reading to children
gives them a head-start in life. An interesting further question, which we cannot answer with
our data, is whether reading to children at a childcare center or at school has similar effects.
References
Australian Institute of Family Studies (2009) Longitudinal Study of Australian Children Data
User Guide – August 2009, Melbourne.
Black, S.E., P.J. Devereux and K.G. Salvanes (2005) The more the merrier? The effect of
family size and birth order on children’s education, Quarterly Journal of Economics, 120,
669–700.
Bradley, R.H., R.F. Corwyn, H.P. McAdoo and C.G. Coll (2001) The home environments of
children in the United States, Part I: Variations by age, ethnicity, and poverty status, Child
Development, 72, 1844–1867.
Canoy, M., J.C. van Ours, and F. van der Ploeg (2006) The economics of books, in: Victor A.
Ginsburgh and David Throsby (eds.), Handbook of the Economics of Art and Culture,
Amsterdam, Elsevier, 721–761.
Cunha, F., J.J. Heckman, L.J. Lochner and D.V. Masterov (2006) Interpreting the evidence on
life cycle skill formation, in: Hanushek, E.A. and F. Welch (eds.) Handbook of the
Economics of Education, Amsterdam, Elsevier, 697–812.
Cunha, F. and J.J. Heckman (2008) Formulating, identifying and estimating the technology of
cognitive and noncognitive skill formation, Journal of Human Resources, 43, 738–782.
Feinstein, L. and J. Symons (1999) Attainment in Secondary School, Oxford Economic Papers,
51, 300–321.
Hale, L., L.M. Berger, M.K. LeBourgeois and J. Brooks-Gunn (2011) A longitudinal study of
preschoolers’ language-based bedtime routines, sleep duration, and well-being, Journal
of Family Psychology, 25, 423–433.
Haveman, R. and B. Wolfe (1995) The Determinants of Children’s Attainment: A Review of
Methods and Findings, Journal of Economic Literature, 33, 1829–1878.

27
Heckman, J.J. and D.V. Masterov (2007) The productivity argument for investing in young
children, Review of Agricultural Economics, 29 (3), 446–493.
Kloosterman, R., N. Notten, J. Tolsma and G. Kraaykamp (2011) The Effects of Parental
Reading Socialization and Early School Involvement on Children’s Academic
Performance: A Panel Study of Primary School Pupils in the Netherlands, European
Sociological Review, 27, 291–306.
Leuven E. and B. Sianesi. (2003) PSMATCH2: Stata module to perform full Mahalanobis and
propensity score matching, common support graphing, and covariate imbalance testing,
http://ideas.repec.org/c/boc/bocode/s432001.html. This version 4.0.4. 10 November
2010.
Maani, S.A. and G. Kalb (2007) Academic Performance, Childhood Economic Resources, and
the Choice to Leave School at Age Sixteen, Economics of Education Review, 26, 361–
374.
Mancini, A.L., Monfardini, C. and Pasqua, S. (2011) On Intergenerational Transmission of
Reading Habits in Italy: Is a Good Example the Best Sermon? IZA Discussion Paper
No. 6038, Bonn.
Manz, P.H., C. Hughes, E. Barnabas, C. Bracaliello, M. Ginsburg-Block (2010) A descriptive
review and meta-analysis of family-based emergent literacy interventions: To what extent
is the research applicable to low-income, ethnic-minority or linguistically-diverse young
children? Early Childhood Research Quarterly 25, 409–431.
Mol, S.E. and A.G. Bus (2011) To Read or Not to Read: A Meta-Analysis of Print Exposure
From Infancy to Early Adulthood, Psychological Bulletin, 137, 267–296.
Neuman, S.B. (1999) Books make a difference: A study of access to literacy, Reading Research
Quarterly, 34, 286–311.
Price, J. (2008) Parent-child quality time, Journal of Human Resources, 43, 240–265.
Price, J. (2012) The effects of parental time investments: Evidence from natural within-family
variation, Brigham Young University Working Paper.
Raikes, H., B.A. Pan, G. Luze, C.S. Tamis-LeMonda, J. Brooks-Gunn, J. Constantine, L.B.
Tarullo, H.A. Raikes and E.T. Rodriguez (2006) Mother-child bookreading in
low-income families: correlates and outcomes during the first three years of life, Child
Development, 77, 924–953.
Roodman, D. (2011) Fitting fully observed recursive mixed-process models with cmp, Stata
Journal, 11, 159-206.

28
Sajaia, Z. (2008) Maximum Likelihood Estimation of a Bivariate Ordered Probit Model:
Implementation and Monte Carlo Simulations, unpublished paper available on
http://adeptanalytics.org/download/ado/bioprobit/bioprobit.pdf .
Sandy, J. and K. Duncan (2010) Examining the Achievement test Score Gap Between Urban
and Suburban Students, Education Economics, 18, 297–315.
Sanson, A., Misson, S., Wake, M., Zubrick, S.R., Silburn, S., Rothman, S. and Dickenson, J.
(2005) Summarizing children’s wellbeing: the LSAC Outcome Index, LSAC Technical
Paper no. 2, Australian Institute of Family Studies.
Sénéchal, M. and J. LeFevre (2002) Parental involvement in the development of children’s
reading skill: a five-year longitudinal study, Child Development, 73, 445–460.
Silinskas, G., P. Rauno, M. Lerkkanen, A. Poikkeus, P. Niemi and J. Nurmi (2010) Mothers’
reading-related activities at home and learning to read during kindergarten, European
Journal of Psychology of Education, 25, 243–264
Silles, M.A. (2010) The implications of family size and birth order for test scores and
behavioral development, Economics of Education Review, 29, 795–803.
Todd, P.E. and K.I. Wolpin (2003) On the Specification and Estimation of the Production
Function for Cognitive Achievement, The Economic Journal, 113, F3-F33.
Todd, P.E. and K.I. Wolpin (2007) The Production of Cognitive Achievement in Children:
Home, School, and Racial Test Score Gaps, Journal of Human Capital, 1 (Winter 2007),
91-136

29
Appendix: Details about the LSAC data
LSAC is a nationally representative longitudinal study on children in Australia jointly
conducted by three Australian government organizations. The sample was drawn in two stages:
first a number of postcodes was randomly selected, before randomly selecting children within
the relevant postcodes. A few remote areas were excluded from the first stage of the sampling
design. The representativeness of the resulting sample of children was assessed by comparing
the distribution of a number of key characteristics with those reported in the 2001 Census. Table
11 in Australian Institute of Family Studies (AIFS) (2009) shows that the LSAC parents are
somewhat better educated than the general population, but are similar with regard to parents’
age and the percentage that are of indigenous background or non-English speaking background.
Detailed information on the sample is available in AIFS (2009).
LSAC is the first-ever comprehensive, national Australian dataset on children as they grow
up.16
The B and K cohort data provide information on various children’s characteristics
including characteristics that can be traced back to pregnancy and childbirth (also for the K
cohort); children’s physical, social, cognitive and emotional development; parents’
demographic and labor market characteristics; and other information such as childcare use, time
use, activities undertaken with the parents and home environment. Appendix Table A1 and the
descriptive analysis in section 4 describes a number of these children’s and parents’
characteristics, and the key variables of interest; that is, reading skill and reading to children.
Table A1 presents definitions of the variables used as well as mean values for the sample used
in the baseline estimation for boys and girls separately. The mean values are mostly similar for
boys and girls, with girls being only slightly less likely to be the oldest child and having more
siblings. The largest difference between boys and girls is that girls are scored more highly on
their reading skills by their parents.
As we seek to assess the early reading skills of children, our analysis focuses on the sample
comprising families from the Child Cohort. The central analysis uses the first wave of the K
cohort data collected at the children’s age of 4-5, with the three later waves collected at the age
of 6-7 (Wave 2), age of 8-9 (Wave 3) and age 10-11 (Wave 4) used in robustness analyzes,
examining the persistence of the effect of reading to children. There are 4,983 children in Wave
1 of the K cohort. Due to survey attrition the sample falls to 4,464 6-7 year olds in Wave 2, to
4,331 8-9 year olds in Wave 3 and to 4,164 10-11 year olds in Wave 4. A nice feature of the
16
The dataset is comparable to Early Childhood Longitudinal Study (US); New Zealand Competent Children
Study; National Longitudinal Survey of Children and Youth (Canada); Millennium Cohort Study (UK).
30
dataset used here is that there are two cohorts of children who are followed over time. The B
cohort in Wave 3 is the same age as the K cohort in Wave 1 and by that time there are still 4386
children left in the sample. Although we do not have the exact same variables, they are the same
to a large extent. In both cohorts, the average number of days per week that an adult living in the
household reads to the child is recorded, so this variable can be used to repeat the analysis for
this group of children and also to compare it to the effect of reading to children at the earlier age
of 2-3.
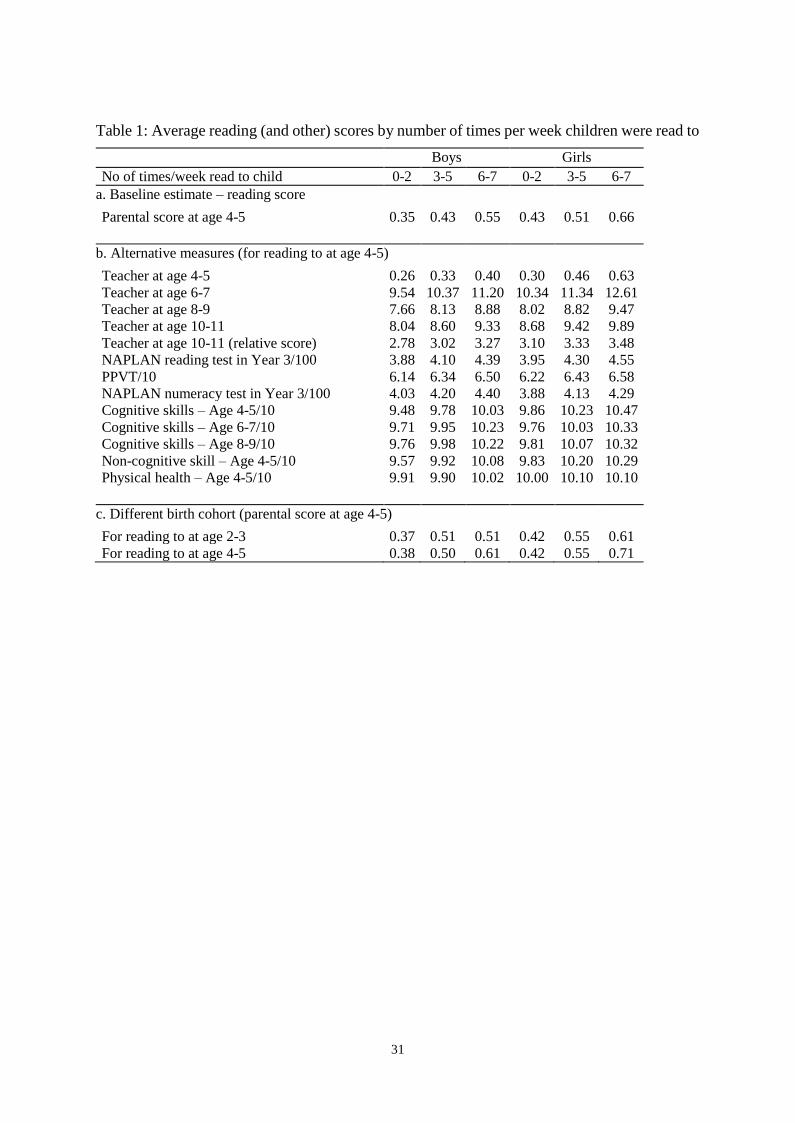
31
Table 1: Average reading (and other) scores by number of times per week children were read to
Boys Girls
No of times/week read to child 0-2 3-5 6-7 0-2 3-5 6-7 a. Baseline estimate – reading score
Parental score at age 4-5 0.35 0.43 0.55 0.43 0.51 0.66
b. Alternative measures (for reading to at age 4-5)
Teacher at age 4-5 0.26 0.33 0.40 0.30 0.46 0.63 Teacher at age 6-7 9.54 10.37 11.20 10.34 11.34 12.61 Teacher at age 8-9 7.66 8.13 8.88 8.02 8.82 9.47 Teacher at age 10-11 8.04 8.60 9.33 8.68 9.42 9.89 Teacher at age 10-11 (relative score) 2.78 3.02 3.27 3.10 3.33 3.48 NAPLAN reading test in Year 3/100 3.88 4.10 4.39 3.95 4.30 4.55 PPVT/10 6.14 6.34 6.50 6.22 6.43 6.58 NAPLAN numeracy test in Year 3/100 4.03 4.20 4.40 3.88 4.13 4.29 Cognitive skills – Age 4-5/10 9.48 9.78 10.03 9.86 10.23 10.47 Cognitive skills – Age 6-7/10 9.71 9.95 10.23 9.76 10.03 10.33 Cognitive skills – Age 8-9/10 9.76 9.98 10.22 9.81 10.07 10.32 Non-cognitive skill – Age 4-5/10 9.57 9.92 10.08 9.83 10.20 10.29 Physical health – Age 4-5/10 9.91 9.90 10.02 10.00 10.10 10.10
c. Different birth cohort (parental score at age 4-5)
For reading to at age 2-3 0.37 0.51 0.51 0.42 0.55 0.61 For reading to at age 4-5 0.38 0.50 0.61 0.42 0.55 0.71

32
Table 2: Estimated correlation coefficients between skill measures (number of observations reported below each correlation)
reading score measured by NAPLAN tests parent teacher teacher teacher teacher teacher teacher teacher teacher cognitive skill index PPVT reading numeracy socio-emot. age 4-5 age 4-5 age 6-7 age 8-9 age 10-11 rel. score age 4-5 age 6-7 age 8-9 age 4-5 age 8-9 age 8-9 index (4-5)
(1) (2) (3) (4) (5) (6) (7) (8) (9) (10) (11) (12) (13)
(2) 0.43 3184 (3) 0.22 0.25 3560 2394 (4) 0.16 0.21 0.65 3558 2392 2848 (5) 0.17 0.22 0.56 0.64 3324 2244 2635 2739 (6) 0.17 0.21 0.57 0.64 0.79 3311 2236 2624 2727 3306 (7) 0.24 0.42 0.49 0.48 0.45 0.46 4921 3188 3549 3544 3316 3304 (8) 0.20 0.26 0.79 0.59 0.54 0.56 0.57 4432 2912 3566 3449 3206 3194 4420 (9) 0.18 0.24 0.57 0.79 0.59 0.62 0.55 0.69 4288 2838 3366 3560 3236 3223 4273 4158 (10) 0.10 0.18 0.30 0.31 0.29 0.29 0.66 0.43 0.40 4398 2913 3229 3202 3017 3006 4406 3987 3859 (11) 0.19 0.22 0.59 0.64 0.60 0.67 0.47 0.61 0.66 0.380 2445 1595 1887 2072 1879 1870 2443 2373 2447 2207 (12) 0.18 0.21 0.51 0.55 0.54 0.57 0.43 0.59 0.67 0.34 0.69 2443 1587 1888 2071 1876 1867 2441 2372 2445 2205 2440 (13) 0.04 0.08 0.20 0.20 0.21 0.22 0.28 0.24 0.23 0.22 0.19 0.17 4959 3184 3566 3559 3327 3314 4921 4433 4289 4399 2446 2444 health index 0.02ns 0.05 0.11 0.13 0.13 0.11 0.12 0.11 0.10 0.08 0.06 0.05 0.34
age 4-5 4971 3189 3570 3568 3334 3321 4932 4443 4299 4406 2452 2450 4969
Note: ns indicates that the relevant correlation is not significant at the 1 percent level.

33
Table 3: Baseline parameter estimates (reading skills as measured by the parent at age 4-5)
Boys Girls
Ordered Probit Bivariate ordered probit Ordered Probit Bivariate ordered probit
Reading skills Reading to child Reading skills Reading skills Reading to child Reading skills
Model with constant only (and IV var.s
in the bivariate ordered probit)
Read to child (3-5 times/week) 0.22 (2.7)** 0.61 (4.0)** 0.16 (2.1)** 0.53 (3.2)** Read to child (6-7 times/week) 0.35 (4.5)** 1.17 (4.3)** 0.33 (4.7)** 1.12 (3.7)** ρ -0.39 ** -0.38 **
Full model with all variables
Read to child (3-5 times/week)
Read to child (6-7 times/week)
Age of child (years)
Child is in poor health
Special needs child
Child likes physical activity
Non-English spoken at home
Children’s books at home
Number of televisions
Watching TV weekdays
Watching TV weekends
Computer access
Use computer weekdays
Use computer weekends
log household Income
Education parent 1
Education parent 2
Age first parent/10
Age first parent squared/100
Age second parent/10
Age second parent squared/100
Child is oldest child
Number of siblings
ρ
0.28 (3.0)**
0.42 (4.5)**
1.19 (8.3)**
0.03 (0.2)
-0.01 (0.1)
-0.03 (0.8)
0.33 (4.2)**
-0.05 (1.0)
-0.03 (0.9)
-0.02 (0.3)
-0.01 (0.2)
0.10 (1.0)
0.04 (0.6)
0.11 (1.9)*
-0.05 (0.9)
0.01 (0.5)
0.02 (1.5)
-1.20 (2.2)**
0.15 (2.1)**
-0.09 (0.2)
0.03 (0.5)
0.56 (3.1)**
0.99 (2.9)**
-0.34 (2.6)** 1.22 (8.4)**
-0.08 (0.5) 0.05 (0.3)
0.02 (0.3) -0.01 (0.1)
0.04 (1.2) -0.04 (1.0)
-0.12 (1.6) 0.34 (4.3)**
0.22 (4.6)** -0.09 (1.7)*
-0.14 (3.8)** -0.00 (0.1)
-0.20 (3.9)** 0.02 (0.3)
-0.03 (0.7) 0.00 (0.0)
0.02 (0.2) 0.10 (1.0)
0.10 (1.6) 0.02 (0.4)
0.04 (0.8) 0.09 (1.6)
0.06 (1.1) -0.07 (1.1)
0.05 (3.6)** -0.00 (0.2)
0.04 (3.1)** 0.01 (0.8)
1.32 (2.5)** -1.36 (2.8)**
-0.13 (1.8)* 0.17 (2.6)**
-0.45 (1.0) 0.03 (0.1)
0.05 (0.7) 0.01 (0.3)
0.34 (4.9)**
-0.14 (3.7)**
-0.26
0.12 (1.3)
0.30 (3.5)**
1.19 (8.6)**
0.17 (0.8)
0.18 (1.8)*
0.04 (1.1)
0.45 (5.8)**
-0.02 (0.5)
0.02 (0.5)
-0.19 (3.8)**
-0.04 (0.9)
0.19 (1.9)*
0.06 (0.9)
0.05 (0.9)
-0.05 (1.0)
-0.01 (0.5)
0.04 (2.4)**
-1.37 (2.4)**
0.16 (2.2)**
-0.04 (0.1)
0.01 (0.2)
0.62 (2.8)**
1.34 (3.2)**
-0.26 (1.9)* 1.18 (7.8)**
-0.13 (0.6) 0.20 (0.8)
-0.03 (0.3) 0.19 (1.8)
0.01 (0.3) 0.03 (0.9)
0.05 (0.6) 0.38 (4.4)**
0.28 (6.1)** -0.12 (2.0)**
-0.13 (3.6)** 0.07 (1.7)*
-0.09 (1.7)* -0.16 (2.9)**
-0.08 (1.9)* -0.00 (0.0)
0.14 (1.5) 0.15 (1.5)
-0.03 (0.4) 0.06 (1.0)
0.05 (0.9) 0.03 (0.5)
0.09 (1.8)* -0.08 (1.5)
0.05 (3.8)** -0.03 (1.8)*
0.04 (3.0)** 0.02 (1.1)
0.66 (1.1) -1.32 (2.1)**
-0.07 (0.9) 0.16 (1.8)*
0.47 (1.0) -0.14 (0.3)
-0.04 (0.8) 0.02 (0.4)
0.39 (5.2)**
-0.03 (1.0)
-0.47 **
Observations 1746 1746 1675 1675
Note: absolute t-statistics in parentheses; the significance level of ρ is based on a Wald test; the ** (*) indicate significance at a 5% (10%) level.
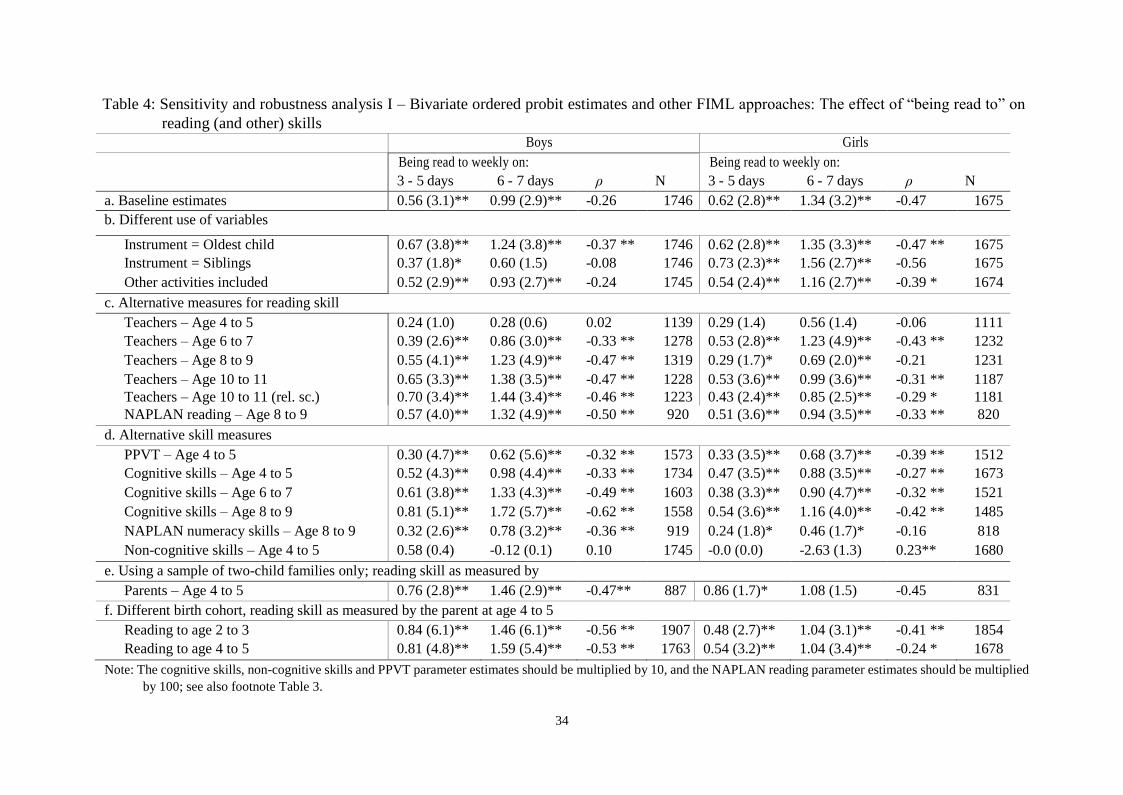
34
Table 4: Sensitivity and robustness analysis I – Bivariate ordered probit estimates and other FIML approaches: The effect of “being read to” on
reading (and other) skills
Boys Girls
Being read to weekly on: Being read to weekly on:
3 - 5 days 6 - 7 days ρ N 3 - 5 days 6 - 7 days ρ N
a. Baseline estimates 0.56 (3.1)** 0.99 (2.9)** -0.26 1746 0.62 (2.8)** 1.34 (3.2)** -0.47
**-0.47
**
1675
b. Different use of variables
Instrument = Oldest child 0.67 (3.8)** 1.24 (3.8)** -0.37 ** 1746 0.62 (2.8)** 1.35 (3.3)** -0.47 ** 1675
Instrument = Siblings 0.37 (1.8)* 0.60 (1.5) -0.08 1746 0.73 (2.3)** 1.56 (2.7)** -0.56 1675
Other activities included 0.52 (2.9)** 0.93 (2.7)** -0.24 1745 0.54 (2.4)** 1.16 (2.7)** -0.39 * 1674
c. Alternative measures for reading skill
Teachers – Age 4 to 5 0.24 (1.0) 0.28 (0.6) 0.02 1139 0.29 (1.4) 0.56 (1.4) -0.06 1111
Teachers – Age 6 to 7 0.39 (2.6)** 0.86 (3.0)** -0.33 ** 1278 0.53 (2.8)** 1.23 (4.9)** -0.43 ** 1232
Teachers – Age 8 to 9 0.55 (4.1)** 1.23 (4.9)** -0.47 ** 1319 0.29 (1.7)* 0.69 (2.0)** -0.21 1231
Teachers – Age 10 to 11 0.65 (3.3)** 1.38 (3.5)** -0.47 ** 1228 0.53 (3.6)** 0.99 (3.6)** -0.31 ** 1187 Teachers – Age 10 to 11 (rel. sc.) 0.70 (3.4)** 1.44 (3.4)** -0.46 ** 1223 0.43 (2.4)** 0.85 (2.5)** -0.29 * 1181 NAPLAN reading – Age 8 to 9 0.57 (4.0)** 1.32 (4.9)** -0.50 ** 920 0.51 (3.6)** 0.94 (3.5)** -0.33 ** 820
d. Alternative skill measures
PPVT – Age 4 to 5 0.30 (4.7)** 0.62 (5.6)** -0.32 ** 1573 0.33 (3.5)** 0.68 (3.7)** -0.39 ** 1512
Cognitive skills – Age 4 to 5 0.52 (4.3)** 0.98 (4.4)** -0.33 ** 1734 0.47 (3.5)** 0.88 (3.5)** -0.27 ** 1673
Cognitive skills – Age 6 to 7 0.61 (3.8)** 1.33 (4.3)** -0.49 ** 1603 0.38 (3.3)** 0.90 (4.7)** -0.32 ** 1521
Cognitive skills – Age 8 to 9 0.81 (5.1)** 1.72 (5.7)** -0.62 ** 1558 0.54 (3.6)** 1.16 (4.0)** -0.42 ** 1485
NAPLAN numeracy skills – Age 8 to 9 0.32 (2.6)** 0.78 (3.2)** -0.36 ** 919 0.24 (1.8)* 0.46 (1.7)* -0.16 818
Non-cognitive skills – Age 4 to 5 0.58 (0.4) -0.12 (0.1) 0.10 1745 -0.0 (0.0) -2.63 (1.3) 0.23** 1680
e. Using a sample of two-child families only; reading skill as measured by
Parents – Age 4 to 5 0.76 (2.8)** 1.46 (2.9)** -0.47** 887 0.86 (1.7)* 1.08 (1.5) -0.45 831
f. Different birth cohort, reading skill as measured by the parent at age 4 to 5
Reading to age 2 to 3 0.84 (6.1)** 1.46 (6.1)** -0.56 ** 1907 0.48 (2.7)** 1.04 (3.1)** -0.41 ** 1854
Reading to age 4 to 5 0.81 (4.8)** 1.59 (5.4)** -0.53 ** 1763 0.54 (3.2)** 1.04 (3.4)** -0.24 * 1678
Note: The cognitive skills, non-cognitive skills and PPVT parameter estimates should be multiplied by 10, and the NAPLAN reading parameter estimates should be multiplied
by 100; see also footnote Table 3.
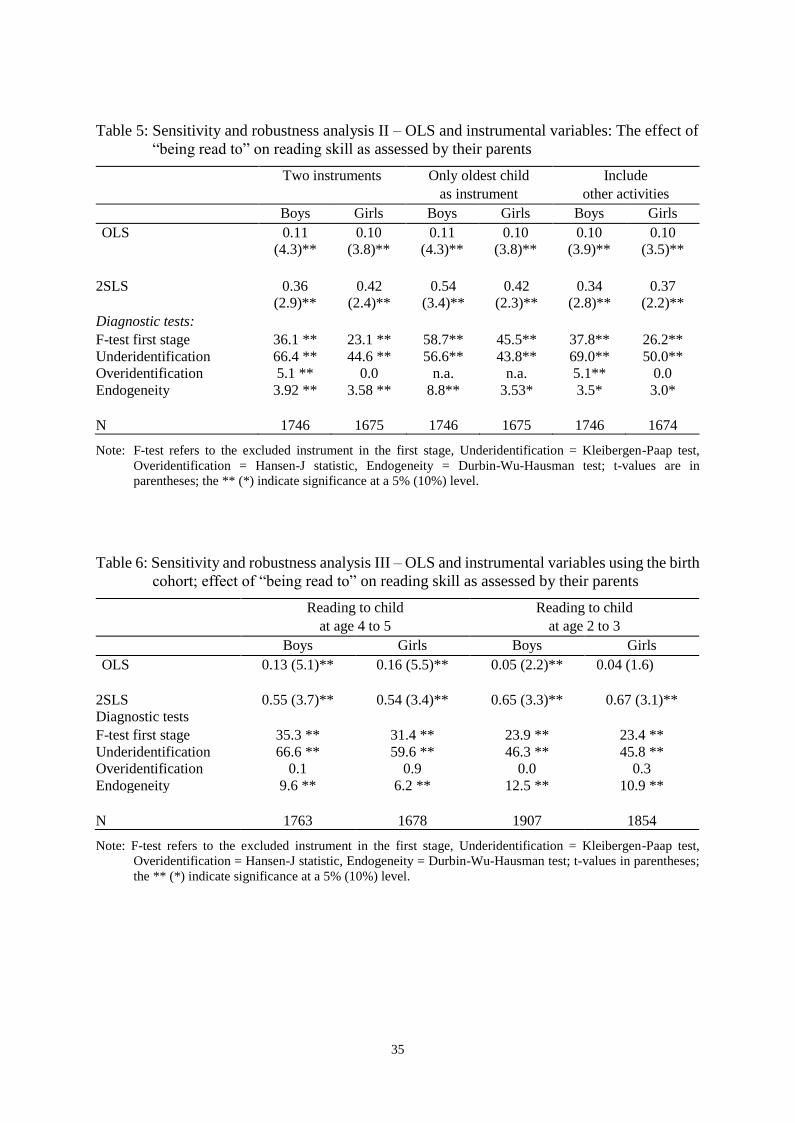
35
Table 5: Sensitivity and robustness analysis II – OLS and instrumental variables: The effect of
“being read to” on reading skill as assessed by their parents
Two instruments Only oldest child Include
as instrument other activities
Boys Girls Boys Girls Boys Girls
OLS 0.11 0.10 0.11 0.10 0.10 0.10 (4.3)** (3.8)** (4.3)** (3.8)** (3.9)** (3.5)**
2SLS 0.36 0.42 0.54 0.42 0.34 0.37 (2.9)** (2.4)** (3.4)** (2.3)** (2.8)** (2.2)**
Diagnostic tests: F-test first stage 36.1 ** 23.1 ** 58.7** 45.5** 37.8** 26.2** Underidentification 66.4 ** 44.6 ** 56.6** 43.8** 69.0** 50.0** Overidentification 5.1 ** 0.0 n.a. n.a. 5.1** 0.0 Endogeneity 3.92 ** 3.58 ** 8.8** 3.53* 3.5* 3.0* N 1746 1675 1746 1675 1746 1674
Note: F-test refers to the excluded instrument in the first stage, Underidentification = Kleibergen-Paap test,
Overidentification = Hansen-J statistic, Endogeneity = Durbin-Wu-Hausman test; t-values are in
parentheses; the ** (*) indicate significance at a 5% (10%) level.
Table 6: Sensitivity and robustness analysis III – OLS and instrumental variables using the birth
cohort; effect of “being read to” on reading skill as assessed by their parents
Reading to child Reading to child
at age 4 to 5 at age 2 to 3
Boys Girls Boys Girls
OLS 0.13 (5.1)** 0.16 (5.5)** 0.05 (2.2)** 0.04 (1.6) 2SLS 0.55 (3.7)** 0.54 (3.4)** 0.65 (3.3)** 0.67 (3.1)** Diagnostic tests F-test first stage 35.3 ** 31.4 ** 23.9 ** 23.4 ** Underidentification 66.6 ** 59.6 ** 46.3 ** 45.8 ** Overidentification 0.1 0.9 0.0 0.3 Endogeneity 9.6 ** 6.2 ** 12.5 ** 10.9 ** N 1763 1678 1907 1854
Note: F-test refers to the excluded instrument in the first stage, Underidentification = Kleibergen-Paap test,
Overidentification = Hansen-J statistic, Endogeneity = Durbin-Wu-Hausman test; t-values in parentheses;
the ** (*) indicate significance at a 5% (10%) level.
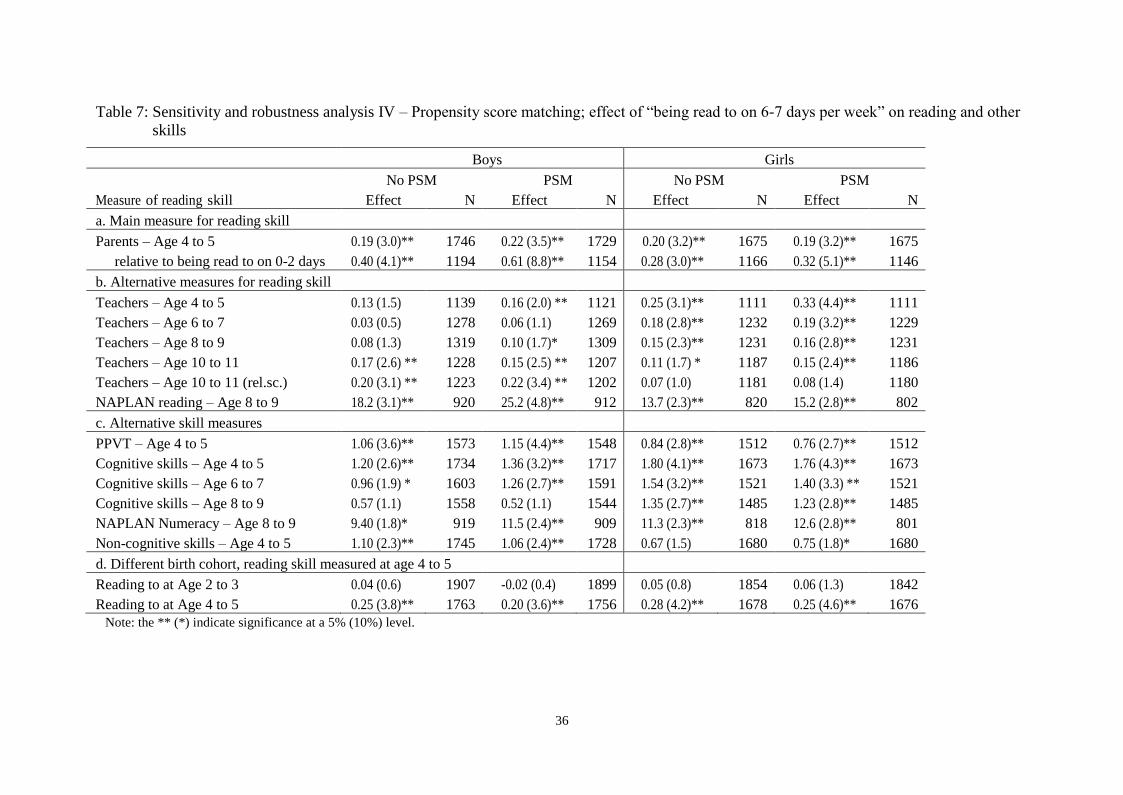
36
Table 7: Sensitivity and robustness analysis IV – Propensity score matching; effect of “being read to on 6-7 days per week” on reading and other
skills
Boys Girls
No PSM PSM No PSM PSM
Measure of reading skill Effect N Effect N Effect N Effect N
a. Main measure for reading skill Parents – Age 4 to 5 0.19 (3.0)** 1746 0.22 (3.5)** 1729 0.20 (3.2)** 1675 0.19 (3.2)** 1675
relative to being read to on 0-2 days 0.40 (4.1)** 1194 0.61 (8.8)** 1154 0.28 (3.0)** 1166 0.32 (5.1)** 1146
b. Alternative measures for reading skill Teachers – Age 4 to 5 0.13 (1.5) 1139 0.16 (2.0) ** 1121 0.25 (3.1)** 1111 0.33 (4.4)** 1111
Teachers – Age 6 to 7 0.03 (0.5) 1278 0.06 (1.1) 1269 0.18 (2.8)** 1232 0.19 (3.2)** 1229
Teachers – Age 8 to 9 0.08 (1.3) 1319 0.10 (1.7)* 1309 0.15 (2.3)** 1231 0.16 (2.8)** 1231
Teachers – Age 10 to 11 0.17 (2.6) ** 1228 0.15 (2.5) ** 1207 0.11 (1.7) * 1187 0.15 (2.4)** 1186
Teachers – Age 10 to 11 (rel.sc.) 0.20 (3.1) ** 1223 0.22 (3.4) ** 1202 0.07 (1.0) 1181 0.08 (1.4) 1180
NAPLAN reading – Age 8 to 9 18.2 (3.1)** 920 25.2 (4.8)** 912 13.7 (2.3)** 820 15.2 (2.8)** 802
c. Alternative skill measures PPVT – Age 4 to 5 1.06 (3.6)** 1573 1.15 (4.4)** 1548 0.84 (2.8)** 1512 0.76 (2.7)** 1512
Cognitive skills – Age 4 to 5 1.20 (2.6)** 1734 1.36 (3.2)** 1717 1.80 (4.1)** 1673 1.76 (4.3)** 1673
Cognitive skills – Age 6 to 7 0.96 (1.9) * 1603 1.26 (2.7)** 1591 1.54 (3.2)** 1521 1.40 (3.3) ** 1521
Cognitive skills – Age 8 to 9 0.57 (1.1) 1558 0.52 (1.1) 1544 1.35 (2.7)** 1485 1.23 (2.8)** 1485
NAPLAN Numeracy – Age 8 to 9 9.40 (1.8)* 919 11.5 (2.4)** 909 11.3 (2.3)** 818 12.6 (2.8)** 801
Non-cognitive skills – Age 4 to 5 1.10 (2.3)** 1745 1.06 (2.4)** 1728 0.67 (1.5) 1680 0.75 (1.8)* 1680
d. Different birth cohort, reading skill measured at age 4 to 5 Reading to at Age 2 to 3 0.04 (0.6) 1907 -0.02 (0.4) 1899 0.05 (0.8) 1854 0.06 (1.3) 1842
Reading to at Age 4 to 5 0.25 (3.8)** 1763 0.20 (3.6)** 1756 0.28 (4.2)** 1678 0.25 (4.6)** 1676 Note: the ** (*) indicate significance at a 5% (10%) level.

37
Table 8: Alternative ways of interpreting the effect of “being read to” on reading and other skills
Raw data FIML estimation PSM method
Reading to child (days per week): 0-2 3-5 6-7 0-2 3-5 6-7 0-5 6-7
Boys 1. Parental reading measure at age 4 to 5:
a. Compared to effect of age in years n.a. n.a. n.a. ref. 0.46 0.81 ref. 0.19 b. Expressed as:
probability of score 0 0.77 0.69 0.64 0.87 0.73 0.57 0.72 0.65 probability of score 3 0.02 0.03 0.05 0.01 0.04 0.08 0.03 0.05
2. Expressed as change in standard deviations NAPLAN reading ref. 0.26 0.59 ref. 0.66 1.53 ref. 0.29 Cognitive skills at age 4 to 5 ref. 0.30 0.55 ref. 0.52 0.98 ref. 0.14
Girls
1. Parental reading measure at age 4 to 5: a. Compared to effect of age in years n.a. n.a. n.a. ref. 0.53 1.14 ref. 0.13 b. Expressed as:
probability of score 0 0.70 0.63 0.57 0.86 0.69 0.43 0.68 0.62 probability of score 3 0.03 0.03 0.07 0.01 0.04 0.13 0.03 0.04
2. Expressed as change in standard deviations NAPLAN reading ref. 0.41 0.70 ref. 0.59 1.09 ref. 0.18 Cognitive skills at age 4 to 5 ref. 0.37 0.61 ref. 0.47 0.88 ref. 0.18
Note: All effects are relative to the lowest “reading to” frequency, except those under 1b; n.a. indicates not applicable; ref. indicates reference
group to which other groups are compared.

38
Table A1: Definition of variables and means of variables for the K cohort in LSAC Variable name Definition of variable Boys Girls Reading scores Reading skill as assessed by parent1 0.46 0.57 at age 4-5 (scale 0-3) Reading skill as assessed by teacher 0.36 0.53 at age 4-5 (scale 0-3) as above at age 6-7 (scale 0-16) (score/10) 1.08 1.19 as above at age 8-9 (scale 0-12) 8.46 9.09 as above at age 10-11 (scale 0-12) 8.94 9.59 NAPLAN reading score in Year 3 4.23 4.41 divided by 100 Relative reading score as assessed by teacher at age 10-11 3.14 3.41 (scale 1-5: much worse - much better than average) Other scores Cognitive index at age 4-5 (score/100) 0.99 1.03 Cognitive index at age 6-7 (score/100) 1.01 1.02 Cognitive index at age 8-9 (score/100) 1.01 1.02 PPVT at age 4-5 (score/10) 6.41 6.48 NAPLAN numeracy score in Year 3 4.30 4.20 Non-cognitive index at age 4-5 (score/100) 1.00 1.02 Read to child last week 0-2 times 0.19 0.20 3-5 times 0.32 0.30 6-7 times 0.50 0.50 Educational activities with child Number of educational activities (0-4) 1.43 1.50 Other activities with child Number of other activities (0-4) 2.08 2.08 Age of child Age of child (to the nearest week) in years 4.78 4.79 Child is in poor health Health of child is rated fair or poor 0.03 0.02 Special needs of child Child has special care needs 0.82 0.90 Child likes physical activity 1-dislikes very much to 5-likes very much 4.64 4.64 Non-English regularly spoken 1 - yes and 0 - no 0.19 0.19 at home Children’s books at home 0 None; 1 1-10; 2 11-20; 3 21-30; 4 30+ 3.74 3.72 Number of televisions at home 1.82 1.79 Watching TV on weekdays 1 - Does not watch TV 0.01 0.02 2 - Less than one hour 0.14 0.15 3 - 1 up to 3 hours 0.68 0.66 4 - 3 up to 5 hours 0.14 0.14 5 - 5 or more hours 0.03 0.03 Watching TV on weekend days 1 - Does not watch TV 0.04 0.04 2 - Less than one hour 0.16 0.16 3 - 1 up to 3 hours 0.59 0.60 4 - 3 up to 5 hours 0.18 0.16 5 - 5 or more hours 0.03 0.04 Computer access 1 -yes and 0 -no 0.79 0.81 Use computer on weekdays 1 - Does not use computer 0.39 0.39 2 - Less than one hour 0.50 0.51 3 - 1 up to 3 hours 0.10 0.10 4 - 3 up to 5 hours 0.00 0.00 5 - 5 or more hours 0.00 0.00 Use computer on weekend days 1 - Does not use computer 0.44 0.44 2 - Less than one hour 0.41 0.43 3 - 1 up to 3 hours 0.14 0.13 4 - 3 up to 5 hours 0.01 0.00 5 - 5 or more hours 0.00 0.00
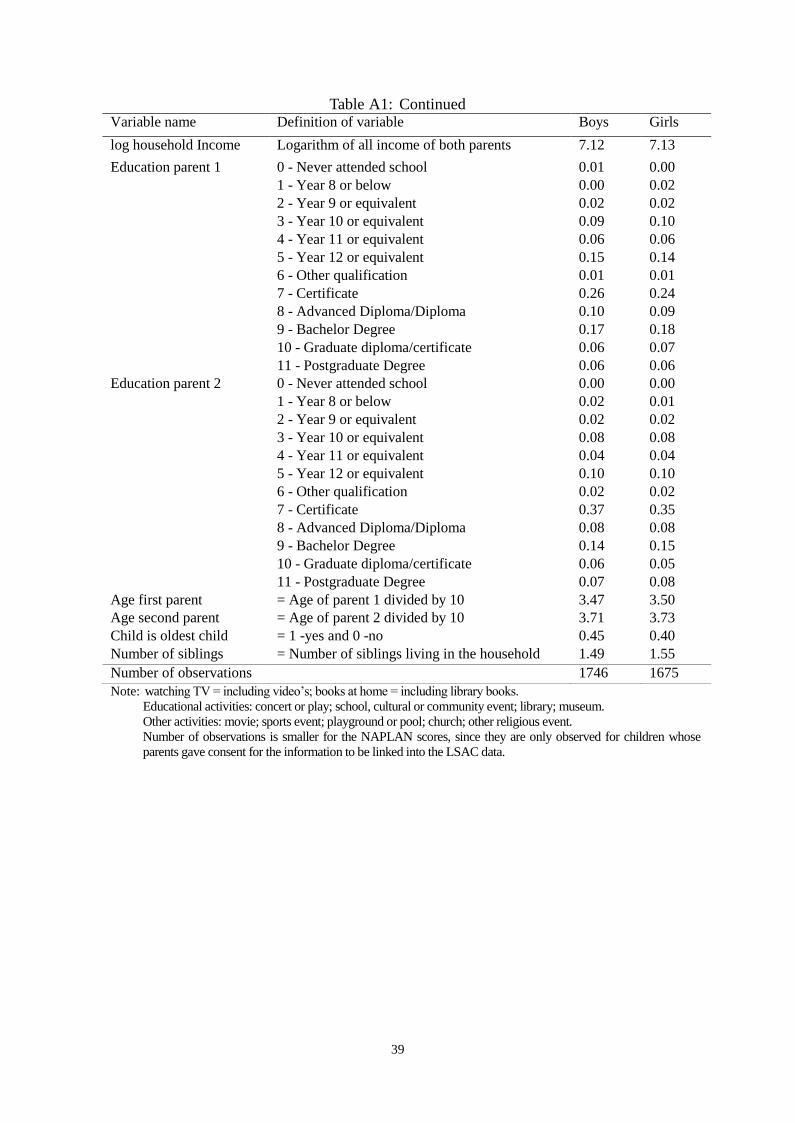
39
Table A1: Continued Variable name Definition of variable Boys Girls
log household Income Logarithm of all income of both parents 7.12 7.13
Education parent 1 0 - Never attended school 0.01 0.00 1 - Year 8 or below 0.00 0.02 2 - Year 9 or equivalent 0.02 0.02 3 - Year 10 or equivalent 0.09 0.10 4 - Year 11 or equivalent 0.06 0.06 5 - Year 12 or equivalent 0.15 0.14 6 - Other qualification 0.01 0.01 7 - Certificate 0.26 0.24 8 - Advanced Diploma/Diploma 0.10 0.09 9 - Bachelor Degree 0.17 0.18 10 - Graduate diploma/certificate 0.06 0.07 11 - Postgraduate Degree 0.06 0.06 Education parent 2 0 - Never attended school 0.00 0.00 1 - Year 8 or below 0.02 0.01 2 - Year 9 or equivalent 0.02 0.02 3 - Year 10 or equivalent 0.08 0.08 4 - Year 11 or equivalent 0.04 0.04 5 - Year 12 or equivalent 0.10 0.10 6 - Other qualification 0.02 0.02 7 - Certificate 0.37 0.35 8 - Advanced Diploma/Diploma 0.08 0.08 9 - Bachelor Degree 0.14 0.15 10 - Graduate diploma/certificate 0.06 0.05 11 - Postgraduate Degree 0.07 0.08 Age first parent = Age of parent 1 divided by 10 3.47 3.50 Age second parent = Age of parent 2 divided by 10 3.71 3.73 Child is oldest child = 1 -yes and 0 -no 0.45 0.40 Number of siblings = Number of siblings living in the household 1.49 1.55
Number of observations 1746 1675 Note: watching TV = including video’s; books at home = including library books.
Educational activities: concert or play; school, cultural or community event; library; museum.
Other activities: movie; sports event; playground or pool; church; other religious event.
Number of observations is smaller for the NAPLAN scores, since they are only observed for children whose
parents gave consent for the information to be linked into the LSAC data.

40
Figure 1: Reading skill by intensity with which children are being read to at age 4 to 5 –
boys & girls
a. Age 4 to 5 – parental score
b. Age 4 to 5 – teachers’ score
c. Age 6 to 7 – teachers’ score
0%
10%
20%
30%
40%
50%
60%
70%
80%
90%
100%
0-2 3-5 6-7 0-2 3-5 6-7
boys girls
No of times/week read to child score of 0 score of 1 score of 2 score of 3
0%
10%
20%
30%
40%
50%
60%
70%
80%
90%
100%
0-2 3-5 6-7 0-2 3-5 6-7
boys girls
No of times/week read to child score of 0 score of 1 score of 2 score of 3
0%
10%
20%
30%
40%
50%
60%
70%
80%
90%
100%
0-2 3-5 6-7 0-2 3-5 6-7
boys girls
No of times/week read to child
score of 0-3 score of 4-6 score of 7-9 score of 10-12 score of 13-14 score of 15-16

41
Figure 2: NAPLAN reading skill by intensity with which child is being read to at age 4 to 5
a. Boys at age 8 to 9
b. Girls at age 8 to 9

42
Figure 3: Cognitive skills by intensity with which boys are being read to at age 4 to 5
a. Skills at age 4 to 5
b. Skills at age 6 to 7
c. Skills at age 8 to 9
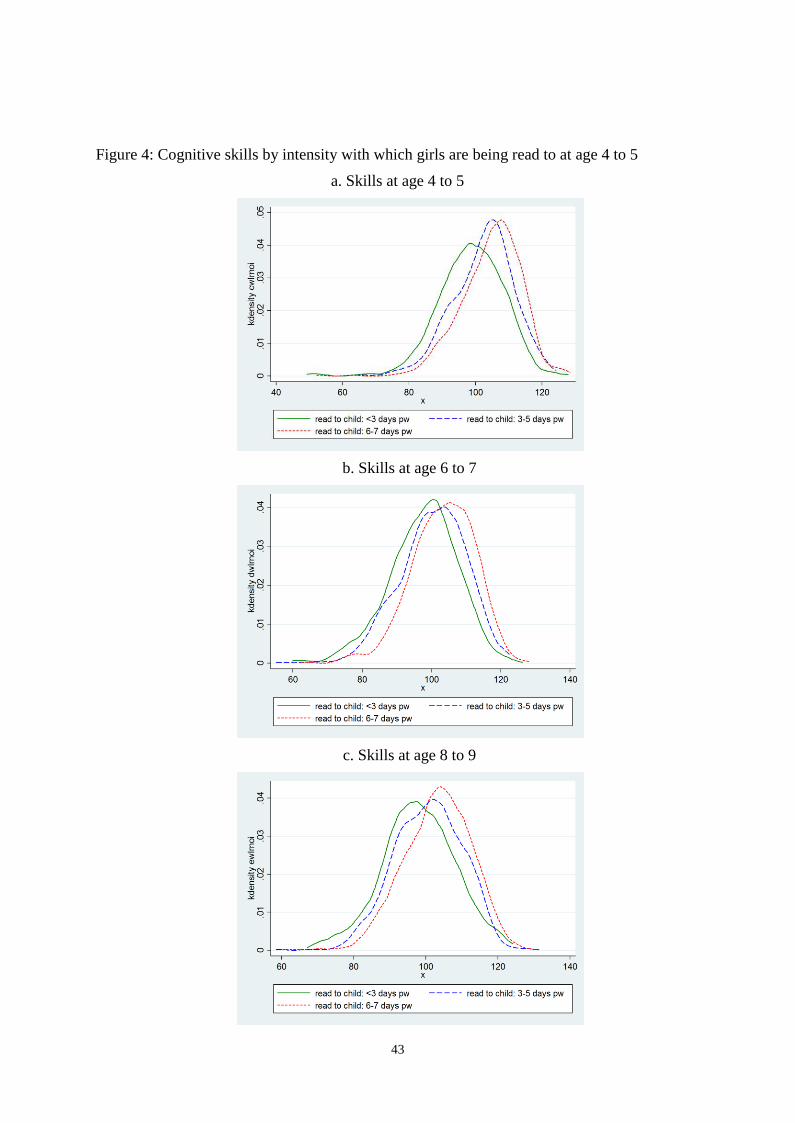
43
Figure 4: Cognitive skills by intensity with which girls are being read to at age 4 to 5
a. Skills at age 4 to 5
b. Skills at age 6 to 7
c. Skills at age 8 to 9