Reading Images: The Grammar of Visual Design Images: The Grammar of Visual Design Gunther Kress &...
38
Reading Images: The Grammar of Visual Design Gunther Kress & Theo van Leeuwen
-
Upload
truongthuan -
Category
Documents
-
view
285 -
download
2
Transcript of Reading Images: The Grammar of Visual Design Images: The Grammar of Visual Design Gunther Kress &...

Reading Images:
The Grammar of Visual
Design
Gunther Kress
&
Theo van Leeuwen

Ch. 3
Conceptual representations:
designing social constructs

Reading Images divides visual structures into two kinds :
narrative & conceptual.
Ch. 3 covers conceptual structures generated from three different
processes.
visualstructures
Ch. 2narrative
Ch. 3conceptual
classificationprocesses
analyticalprocesses
symbolicprocesses

Warning!
The conceptual structure on the previous slide is itself a construct
and may induce mental distress.
Why divide things into hierarchical structures? Especially structures about the structuring of structure?
Aren’t we post-structural?

Blame It on Your Neural Networks
Like the WWW, shown above, neural networks are a dynamic, tangled mess with many-to-one and one-to-many nodal connections. Some nodes are generated on the fly and then disappear; others have been around a long time. What we need, as depicted in the lower right corner, is a way to extract a part of the network and show its relation to the whole. But doing that means we must somehow simplify our representation of the whole.

The tree structures in Reading Images make explicit the conceptual tools which we now think the brain uses to organize, search, and edit versions of its own networks. Most images are not purely narrative or purely conceptual; nor do they exclusively use classificatory, analytic, or symbolic processes. They are assembled on the fly from distributed templates using all of these processes. It is possible, however, to find images where you can catch a glimpse of one or more of these processes at work.

Here’s how it works, more or less, both for Google
and the brain of Nancy Pelosi.
First construct a relational map of some part of a network with labeled nodes and weighted connections. In the network on the left, colored clusters of nodes designate Congressional committees and their sub-committees. Links are weighted to indicate common memberships. Note dominant position of Budget Committee!
Porter, et al (2006) “Community Structure in the United States
House of Representatives” arXiv:physics/0602033

Given a weighted network, we can generate a dendrogram, i.e. a graph which orders its terminal nodes according to their similarity. In the case of the congressional network, committees which share members are more alike than committees which don’t. In the dendrogram on the left, insects from six rivers are ordered by genetic similarity.
Note that the internal structure of a dendrogram is a BINARY TREE!!!!!!
Dendrogram

Binary Sort and Search Spaces
The internal structure of a dendrogram generates a hierarchical category structure. These binary trees provide an efficient way to sort items and then search for them in a complex, network.
Suppose the numbered shapes above are assigned similarity weightings based on some hidden property. The first branch of the tree sorts them into two categories, and the descending branches of the left and right sub-trees then further divide the shapes until each one is associated with a terminal node in the tree. The tree structure on the right is equivalent to the spatial partitioning on the left.

Things and events in the world are not organized in neat, hierarchically structured binary trees. But dendrograms like the one on the left can reveal very rich hidden structures in complex networks and facilitate searches for specific kinds of items

Underlying conceptual structures of a culture are often either implicit or
explicit in its graphic representations and texts.
Implicit Explicit

A network representing frequency of words in the first three
chapters of Genesis reveals three conceptual tiers with “god” in the dominant top node.

Porphyry’s Bio-Theo -Ontology
A binary tree by the Greek philosopher Porphyry which makes explicit one version of the ontology implicit in Genesis and then uses that structural hierarchy as a formal biological taxonomy. Note that the terminal category node for HUMAN can have multiple individual instances.

Medieval representation of the similarity between natural and social hierarchy

Dendrogram which exiles the whole “animal kingdom” to one branch of the “tree of life” that includes slime molds.

Classification Processes
Two level superordinate /
subordinate relationship
Linear dominance hierarchy:
If A > C & C > E
then
A > E
superordinate
subordinate subordinate
A
B C
D E

Implicit taxonomy

Analytic Processescarrier + attributes
This image also represents an
explicit taxonomy of two
kinds of wardrobe items

Symbolic carrierliberated workers

Exhaustive Analytic ProcessCarrier = body
Attributes = bones

Temporal analytic
imposed on
rotated analytic of continents

Implicit taxonomy ?

Participant ranking
on continuous scale

2D analog space with discrete
partitions

Heterogeneous
taxonomy / flow chart of constituent
actors generating Iraq War

2D feature space for categorizing
beauty product ads

Icons as instances of categories

Inclusive analytic with utterance
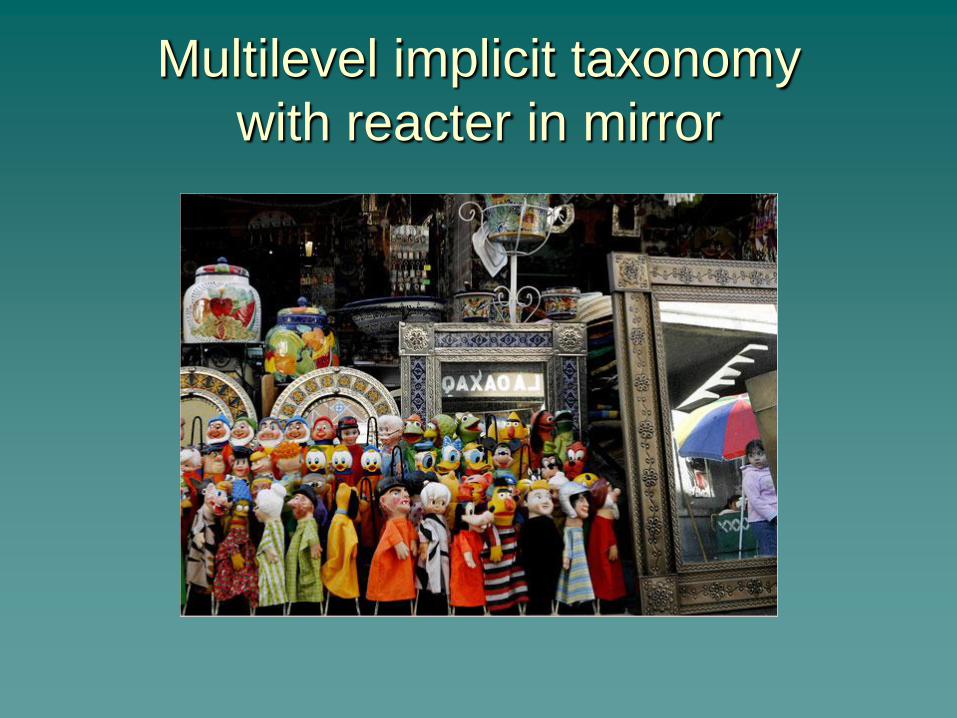
Multilevel implicit taxonomy
with reacter in mirror

Multiple instances of single classno hierarchy

Participant is carrier of symbolic
attribute for utterance

What
conceptual / analytic
processes are implicit or
explicit in the
following images?