Reading GPS Time Series Plots Shelley Olds UNAVCO adapted from Roger Groom, UNAVCO Master...
26
Reading GPS Time Series Plots Shelley Olds UNAVCO adapted from Roger Groom, UNAVCO Master Teaching-in-Residence
-
Upload
dwight-gilbert -
Category
Documents
-
view
219 -
download
0
Transcript of Reading GPS Time Series Plots Shelley Olds UNAVCO adapted from Roger Groom, UNAVCO Master...

Reading GPS Time Series Plots
Shelley Olds
UNAVCO
adapted from Roger Groom, UNAVCO Master Teaching-in-Residence

04/18/23 2
GPS Basics
• Need 3 satellite signals to locate the receiver in 3D space
• 4th satellite used for time accuracy
• Calculate position within sub-centimeter

04/18/23 3
Anatomy of a GPS Station II
GPS antenna inside of dome, solidly attached into the ground with braces. If the ground moves, the station moves.
Solar panel for power
Equipment enclosure
• GPS receiver• Power/batteries• Communications/ radio/ modem• Data storage/ memory

04/18/23 4
Movement of GPS stations
GPS station positions change as plates move.
How will these stations’ positions change
relative to one another?

04/18/23 5
Processed Data
SBCC GPS STATION
• Located near Mission Viejo, CA
• Position data collected every 30 seconds
• One position estimate developed for each day North East Vertical
Date North (mm) East (mm)Vertical
(mm)
1/1/2004 -37.67 36.57 2.33
1/2/2004 -38.04 35.73 5.63
1/3/2004 -37.16 35.83 4.69
1/4/2004 -37.34 36.34 5.36
1/5/2004 -37.59 36.44 9.11
… … … …
1/1/2005 -9.43 9.63 2.36
1/1/2006 16.48 -18.09 7.35
1/1/2007 45.98 -43.42 -6.43

04/18/23 6
Starting with the basics: GPS Time Series Plot
Y-axis:
• North (N/S)
• East (E/W)
• Height (up/down) (sometimes called Vertical)
• In millimeters
X-axis: Date of the measurement In 10ths of year or months
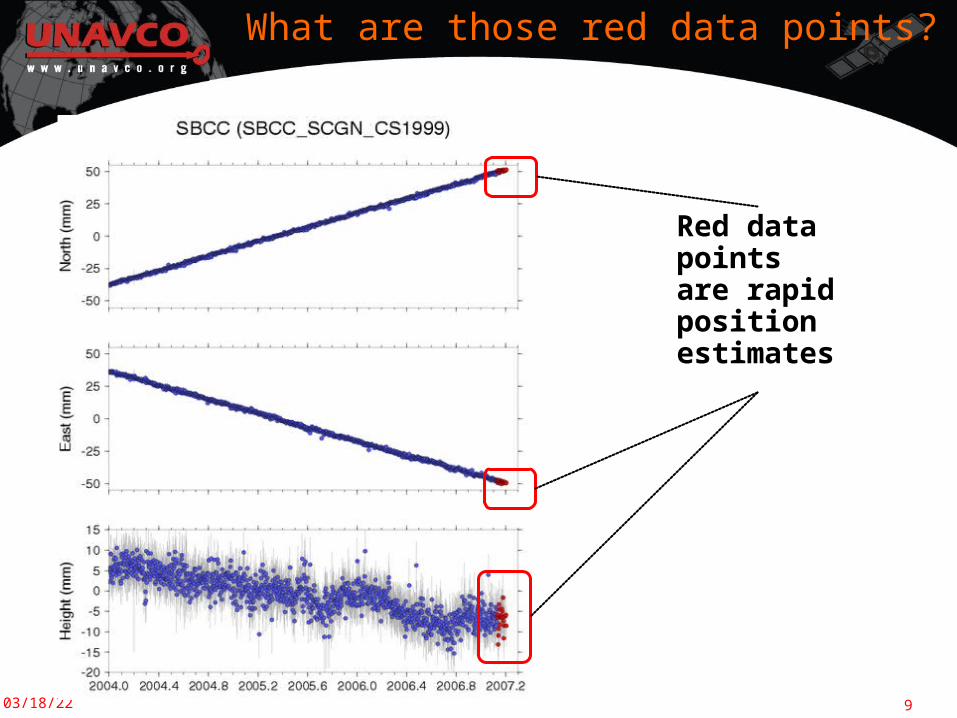
Red data points are rapid position estimates

04/18/23 7
Position time series plot
• Time series plot shows the GPS station’s change in position over time
• X-axis: Date of the measurement In 10ths of year or
months• Y-axis:
North (N/S) East (E/W) Height (up/down)
(sometimes called Vertical)
In millimeters

04/18/23 8
Units of measurement
• X Axis Typically in 10ths of year
• Y Axis Usually millimeters (but always check)
04/18/23 9
What are those red data points?
Red data points are rapid position estimates

04/18/23 10
Data Gaps
• Power outages
• Snow coverage
• Equipment failure
• Vandalism
• Wildlife
• Etc.

04/18/23 11
Gum drop GPS station
Step 1) Build a gum-drop model of a GPS Monument 1 gum drop for the receiver = GPS Receiver 4 toothpicks (3 legs, one center post) = Monument braces 3 small Playdoh feet = Cement Small piece of transparency paper = ‘see-through’ Earth’s plate

04/18/23 12
Gum-drop stations in action

04/18/23 13
Moving north and east
• Positive slope North-south time
series: The station is moving north
East-west time series: The station is moving east
Height time series: The station is moving up
Nor
th (
mm
)E
ast
(mm
)H
eigh
t (
mm
)

04/18/23 14
DateNorth Position
(mm)East Position
(mm)
19992000
01
01
2001 2 2
2002 3 3
2003 4 4
2005 5 5… … …
Step 2) What direction is GPS monument A moving?
GPS Monument A
• Plot the location of the GPS station each year. • Draw an arrow from the first data point to the last data point.• Move your gum-drop GPS monument from year 2000’s position toward 2005’s position. What direction is your GPS monument moving?
54321
1 2 3 4 5
nort
h
east
04/18/23 15
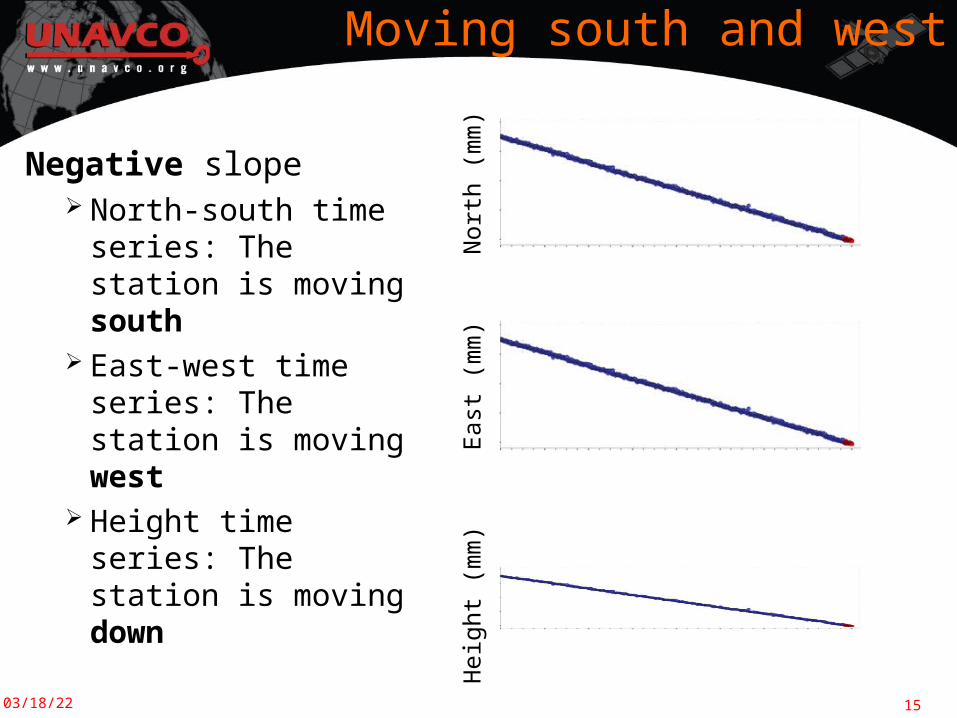
Moving south and west
Negative slope North-south time
series: The station is moving south
East-west time series: The station is moving west
Height time series: The station is moving down
Nor
th (
mm
)E
ast
(mm
)H
eigh
t (m
m)

04/18/23 16
Step 3) What direction is GPS monument B moving?
DateNorth Position
(mm)East Position
(mm)
19992000
0-1
0-1
2001 -2 -2
2002 -3 -3
2003 -4 -4
… … …
• Plot the location of the GPS station each year. • Draw an arrow from the first data point to the last data point.• Move your gum-drop GPS monument from year 2000’s position toward 2005’s position. What direction is your GPS monument moving?
GPS Monument B
-1-2-3-4-5
-5 -4 -3 -2 -1
nort
h
east

04/18/23 17
How to read the time series plots
Zero slope
The station isn’t moving.
Is this GPS station BURN moving?
04/18/23 18
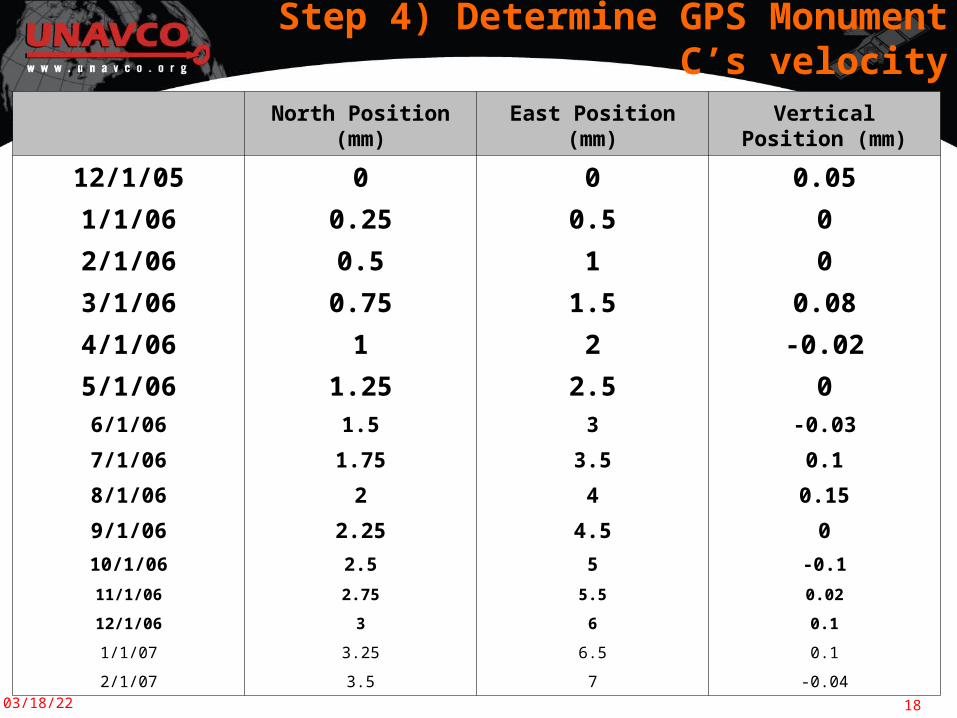
Step 4) Determine GPS Monument C’s velocity
North Position (mm) East Position (mm)Vertical Position
(mm)
12/1/05 0 0 0.05
1/1/06 0.25 0.5 0
2/1/06 0.5 1 0
3/1/06 0.75 1.5 0.08
4/1/06 1 2 -0.02
5/1/06 1.25 2.5 06/1/06 1.5 3 -0.03
7/1/06 1.75 3.5 0.1
8/1/06 2 4 0.15
9/1/06 2.25 4.5 0
10/1/06 2.5 5 -0.1
11/1/06 2.75 5.5 0.02
12/1/06 3 6 0.1
1/1/07 3.25 6.5 0.1
2/1/07 3.5 7 -0.04

04/18/23 19
Calculate North Motion
North position on 12/1/2005 = __ mmNorth position on 12/1/2006 = __ mm
Change in position = ___ mm / year to the North/South
GPS Monument CNorth Position (mm)
-2
-1
0
1
2
3
4
5
6
7
12/1/2005 6/1/2006 12/1/2006
Date
No
rth
(m
m)
0.0
3

04/18/23 20
Calculate North Motion
North position on 12/1/2005 = 0 mmNorth position on 12/1/2006 = 3 mm
Change in position = 3.0 mm / year to the North
GPS Monument CNorth Position (mm)
-2
-1
0
1
2
3
4
5
6
7
12/1/2005 6/1/2006 12/1/2006
Date
No
rth
(m
m)
0.0
3

04/18/23 21
GPS Monument CEast Position (mm)
-2
-1
0
1
2
3
4
5
6
7
12/1/2005 6/1/2006 12/1/2006Date
Ea
st
(mm
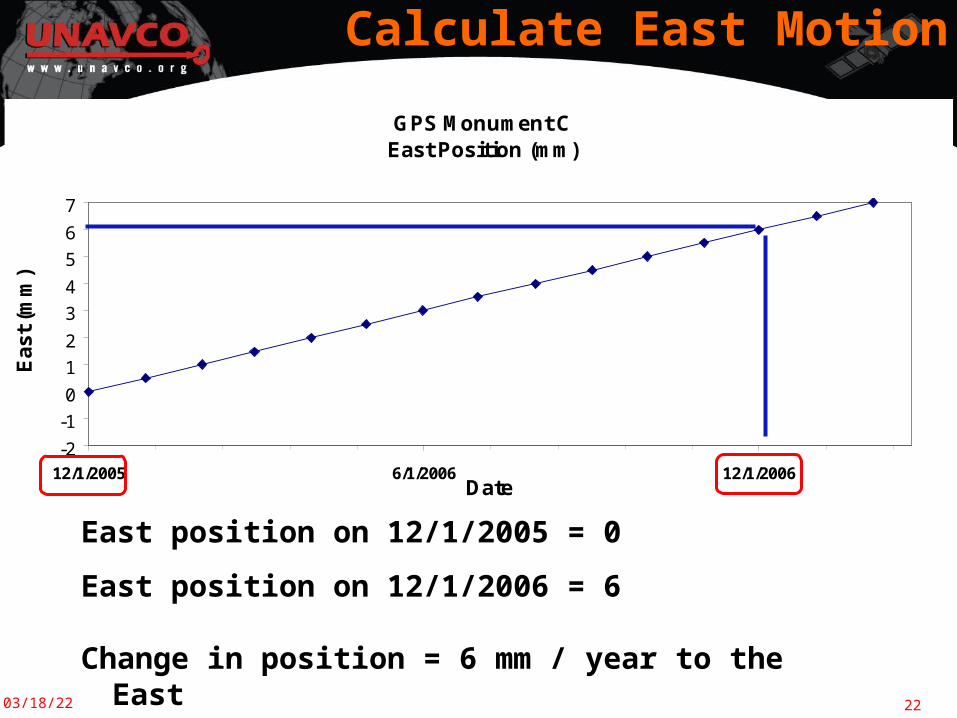
)Calculate East Motion
East position on 12/1/2005 = ________
East position on 12/1/2006 = ________
Change in position =
04/18/23 22
GPS Monument CEast Position (mm)
-2
-1
0
1
2
3
4
5
6
7
12/1/2005 6/1/2006 12/1/2006Date
Ea
st
(mm
)Calculate East Motion
East position on 12/1/2005 = 0
East position on 12/1/2006 = 6
Change in position = 6 mm / year to the East

04/18/23 23
Drawing the north vector
GPS Velocity Vectors
-10
-8
-6
-4
-2
0
2
4
6
8
10
-10 -8 -6 -4 -2 0 2 4 6 8 10East (mm)
North
(mm
)
North
3.0 mm
• Number each axis using the same scale.• Vector: magnitude and direction
Tail is the GPS monument location Length of arrow is the magnitude Shows direction on a map
• Example: GPS Monument C has moved 3.0 mm to the North in one year
04/18/23 24
GPS Velocity Vectors
-10
-8
-6
-4
-2
0
2
4
6
8
10
-10 -8 -6 -4 -2 0 2 4 6 8 10East (mm)
North
(mm
)
North
3.0 mm
6.0 mm
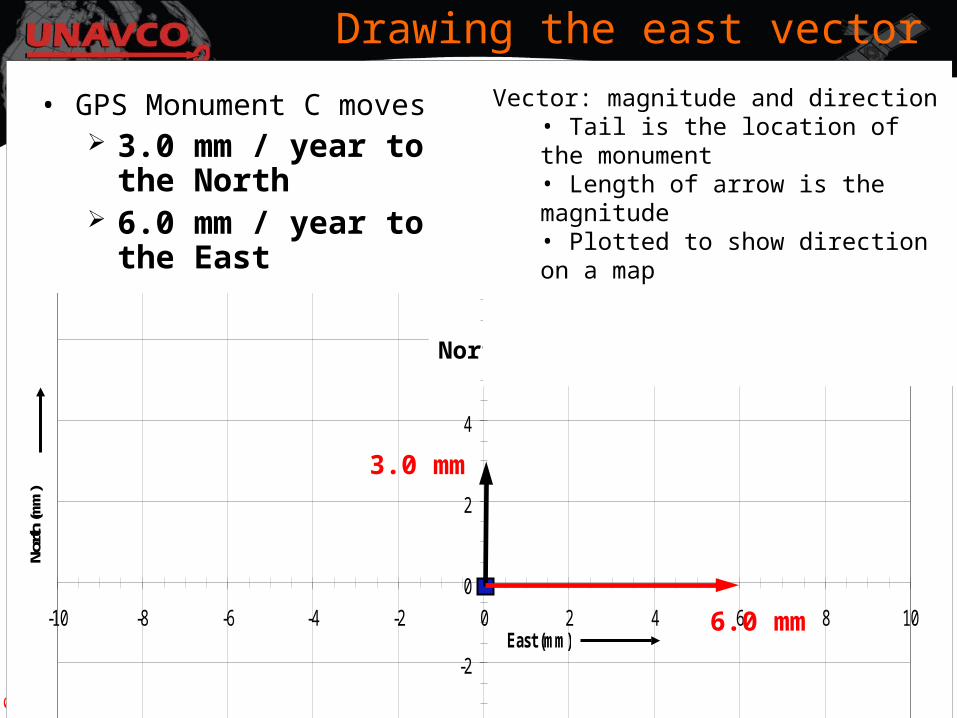
Drawing the east vector
• GPS Monument C moves 3.0 mm / year to the
North 6.0 mm / year to the
East
Vector: magnitude and direction• Tail is the location of the monument• Length of arrow is the magnitude• Plotted to show direction on a map

04/18/23 25
GPS Velocity Vectors
-10
-8
-6
-4
-2
0
2
4
6
8
10
-10 -8 -6 -4 -2 0 2 4 6 8 10East (mm)
North
(mm
)
North
3.0 mm
6.0 mm
Adding the vectors together
• To add the vectors together, Re-draw the East arrow by placing its tail at the arrow head of the
North arrow Then draw a new vector from the tail of the North vector to the
arrow head of the East vector. GPS Monument C moves to the ENE at: √32 + 62 = 6.7 mm / yr

04/18/23 26
Now let’s try a real life example…
Contact info:Shelley Olds
olds unavco.org303-381-7496