Reading Assessment and Intervention: New research … · Reading Assessment and Intervention: New...
27
Reading Assessment and Intervention: New research approach in early ages and learning disabilities Celestino Rodríguez Pérez University of Oviedo [email protected]
Transcript of Reading Assessment and Intervention: New research … · Reading Assessment and Intervention: New...

Reading Assessment and
Intervention: New research
approach in early ages and
learning disabilitiesCelestino Rodríguez Pérez
University of Oviedo

Focus in
ASSESMENT
RESEARCH-PRACTICE
that have beed adapted to
EARLY YEARS
with the tool called EPI.com
and
INTERVENTION
LEARNING/ATTENTION
New tools oportunities
RAN/RAS

3
Impact in children development
Develop without

INTRODUCTION
Naming speed could be defined as the ability to name different
type of familiar stimulus (objects, colours, letters and numbers) as
quickly as possible. This ability is usually measured by Rapid
automatized naming and Rapid Automatized Stimulus-RAN/RAS-
(Wolf & Denckla, 2005) .
Wolf, M., & Denckla, M. B. (2005). RAN/RAS: Rapid automatized naming and rapid alternating stimulus tests. Austin, TX :Pro-ed
ASSESMENT

Objective
1. Analyze the effectiveness of the RAN/RAS test for the early detection ofattentional and reading difficulties in Spanish language.
2. Determine the power of times in naming speed and attentional variablesto predict group membership (LRD with/without ADHD).
Method
Participants: 101 students (64 men and 37 women) were divided into fourgroups:
Instruments
STUDY 1: NAMING SPEED AS A PREDICTOR OF
READING DISABILITIES AND ADHD
40
1428
19
Control RD ADHD ADHD+RD
WISC-IV- (Wechsler, 2005)
EDAH (Farré y Narbona, 1998)
ASSESMENT

Results
0
10
20
30
40
50
60
70
80
Objects
Colours
Numbers
Letters
Letters and numbers
MANCOVA showed that there were significant
differences between four groups.
(= 0.705; F(3,97)= 1.826; p=.023; η2=.110).
STUDY 1: NAMING SPEED AS A PREDICTOR OF
READING DISABILITIES AND ADHD
Objective 1
ASSESMENT

STUDY 1: NAMING SPEED AS A PREDICTOR OF
READING DISABILITIES AND ADHD
Results of discriminant analyses for predicting RLD group membership,
using stepwise method. Analyses with RAN/RAS variables and ADHD
symptoms for age conditions.
Standardized
Coefficients
Function
CoefficientsF
RAN/RAS test from 5 to 9 years of age
Raw.Col 1.000 .036 12.830
Constant -2.341
RAN/RAS test from 10 to 16 year of age
Raw.Col 1.000 .124 10.171
Constant -4.784
Notes: Raw.Col= score obtained in naming colors.
All models are significant at a p < .001 level. Only the variables that resulted statistically significant
are shown.
Objective 2
Classified 78% of the
sample correctly (83% CG
and 74% RLD group)
Classified 77%of the
sample correctly (90% CG
and 50 % RLD group)

Results of discriminant analyses for predicting ADHD group membership, using
stepwise method. Analyses with RAN/RAS variables and ADHD symptoms for age
conditions.
Standardized
Coefficients
Function
CoefficientsF
RAN/RAS test from 5 to 9 years of age
Raw.Col .609 .040 16.350
EDAH.DA .769 .037 12.685
Constant -5.810
RAN/RAS test from 10 to 16 year of age
EDAH.AD .606 .045 13.548
EDAH.I/H .922 .049 10.187
Constant -7.677
Notes: Raw.Col= score obtained in naming colors; EDAH.AD = attention deficit symptoms; EDAH.I/H = impulsivity/
hyperactivity symptoms.
All models are significant at a p < .001 level. Only the variables that resulted statistically significant are shown
STUDY 1: NAMING SPEED AS A PREDICTOR OF
READING DISABILITIES AND ADHD
Objective 2
Classified 84% of the
sample correctly (65% CG
and 96% ADHD group)
Classified 77% of the
sample correctly (83,3%
CG and 71% RLD group)

Objective
Analyze if the explanatory power of different variables (CI, age,
gender, number and type of reading errors, omissions, commissions
...) changes depending on the type of difficulty analyzed.
Method
Participants: a total of 133 student were divided into four groups:
Instruments
34
2241
35
Control RD ADHD ADHD+RD
WISC-IV- (Wechsler, 2005)
EDAH (Farré y Narbona, 1998)
STUDY 2: NAMING SPEED AND ITS RELATIONSHIP
WITH READING DISABILITIES AND ADHD

ResultsGroups Objects Colours Numbers Letters
R2 F R2 F R2 F R2 F
Control
Step 1 .834 10.096*** .700 4.534* .511 6.951** .527 6.905**
Step 2 .914 3.693* .755 3.212* .714 4.674* .784 3.461*
Step 3 .936 2.792 .823 1.607 .728 2.819 .825 2.701
RD
Step 1 .554 5.789*** .494 4.560* .437 3.618* .565 6.055**
Step 2 .709 3.485* .798 10.581*** .878 10.225*** .855* 8.394*
Step 3 .772 2.367 .826 9.073** .880 5.117* .954 14.365***
ADHD
Step 1 .505 5.777*** .373 3.373* .437 4.392- .584 7.940**
Step 2 .751 5.610** .672 3.810* .691 4.174* .749 5.538**
Step 3 .825 4.698** .781 3.563* .711 2.459 .856 5.922*
ADHD+RD
Step 1 .367 5.984** .386 6.508** .304 4.517** .385 6.479**
Step 2 .458 3.256** .509 4.000** .387 2.437* .540 4.532*
Step 3 .547 2.902* .556 3.00* .391 1.539 .541 2.833*
* p < .05, **< .01; ***< .005
STUDY 2: NAMING SPEED AND ITS RELATIONSHIP
WITH READING DISABILITIES AND ADHD
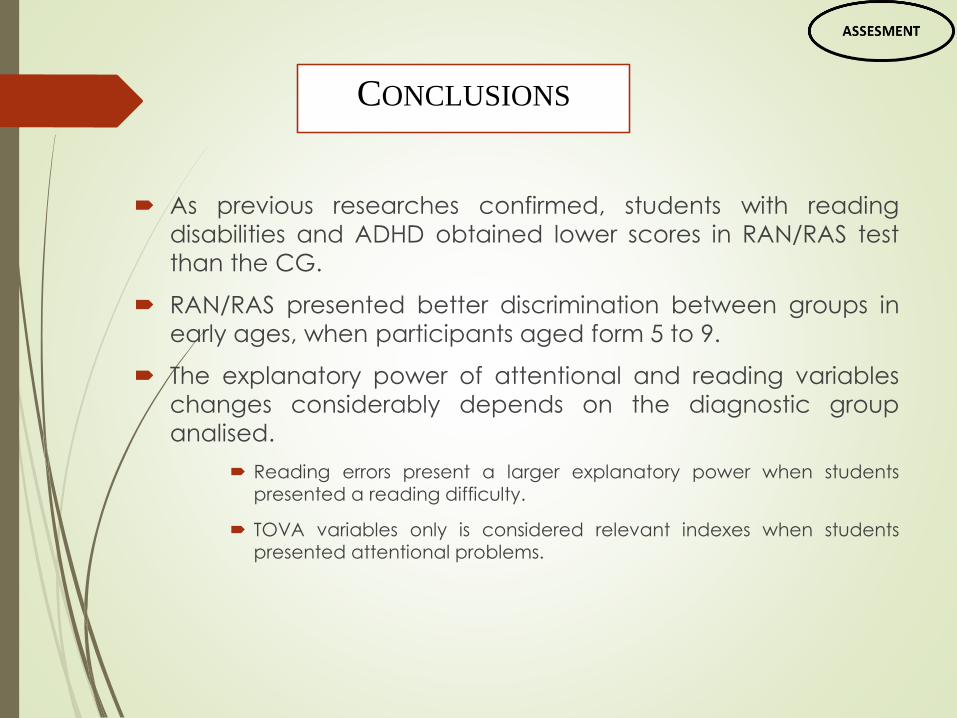
As previous researches confirmed, students with reading
disabilities and ADHD obtained lower scores in RAN/RAS test
than the CG.
RAN/RAS presented better discrimination between groups in
early ages, when participants aged form 5 to 9.
The explanatory power of attentional and reading variables
changes considerably depends on the diagnostic group
analised.
Reading errors present a larger explanatory power when studentspresented a reading difficulty.
TOVA variables only is considered relevant indexes when studentspresented attentional problems.
CONCLUSIONS

are
ORGANIZED OF KNOWLEDGE
THE HYPERTEXTS
have been implemented in students
STUDY 1 (3-6 years old)that have beed adapted to
EARLY YEARS
STUDY 2(6-8 years old)
Cueli, M., Rodríguez, C., Álvarez, A.I., Areces, D., & González-Castro, P. (In
press). Effectiveness of the computerized tool EPI.com to enhance
comprehension and expression in students aged 3 to 6. Journal of
Psychodidactics
AUTHORS??? (2017). Strategy EPI.com Primary Education first
grades. In review
INTERVENTION

Adapted hypertext to early years: EPI.com
Aim The hypertext is a network of processes that foster understanding and expression. It
allows the training of learning strategies
The application at early ages, before the subject read and write, stimulates the three
types of processing: lexical, semantic and syntactic and enhances the read and the
write.
¿How? 3 networks
3 representations
Forms Paper
Computer
La oveja

followed as method
INSTRUMENTSPARTICIPANTS DATA ANALYSIS
– 155 children, aged 3-6 (M = 4.185, SD = 0.824), 80 girls and 75 boys.
– Two groups: Experimental Group (n = 93; follows the EPI.com intervention) and Control Group (n = 62; follows traditional methodology).
– The sample was classified in three groups: Group 1 (65 students; 3 years), Group 2 (55 students; 4 years), Group 3 (35 students; 5 years).
– No statistically relevant differences according to age F(1, 153) = 0.548, p = .460, p
2 = .004; IQ F(1, 153) = 0.074, p = .786, p2 = .000 and sex χ2(1) = 0.161,
p = .688.
STUDY 1INTERVENTION

followed as method
STUDY 1
INSTRUMENTSPARTICIPANTS DATA ANALYSIS
– The PEABODY picture vocabulary test (Dunn, Dunn, & Arribas 2010)
– The Illinois Test of Psycholinguistic abilities ITPA (Kirk, McCarthy, & Kirk, 1986)• 11 variables: auditory comprehension, visual comprehension, auditory association, visual
association, verbal expression, motor expression, grammatical integration, visual integration, auditory integration, sequential auditory memory and sequential visual-motor memory.
– Intervention tool: EPI.com• Three times a week for three months, with 45-minute sessions during which the
intervention took place in presence of the class tutor.
INTERVENTION

Table 1
Means and standard deviations for the pre-test and post-test variables in the PEABODY test and ITPA Pre-test Post-test
EG
(n = 93)
CG
(n = 62)
EG
(n = 93)
CG
(n = 62)
M(SD) M(SD) M(SD) M(SD) F
(1, 153) p
2
Peabody 41.78(19.07) 40.59(17.68) 45.72(20.57) 39.77(17.59) 3.479 0.02
Auditory Comprehension 8.48(7.26) 8.37(849) 11.64(10.04) 8.08(8.49) 5.286* 0.03
Visual Comprehension 7.83(3.93) 7.35(4.27) 10.33(4.86) 6.88 (4.20) 20.75*** 0.11
Visual Memory 2.05(2.32) 1.93(2.30) 3.54(3.18) 1.87 (2.41) 12.45*** 0.07
Auditory Association 7.81(4.44) 7.38(5.07) 10.48(5.33) 6.77(4.77) 19.52*** 0.11
Auditory Memory 3.95(1.96) 3.77(2.19) 5.50(3.140) 3.62(2.15) 16.84*** 0.09
Visual Association 5.67(4.96) 5.30(5.40) 9.24(6.754) 4.95(5.18) 17.98*** 0.10
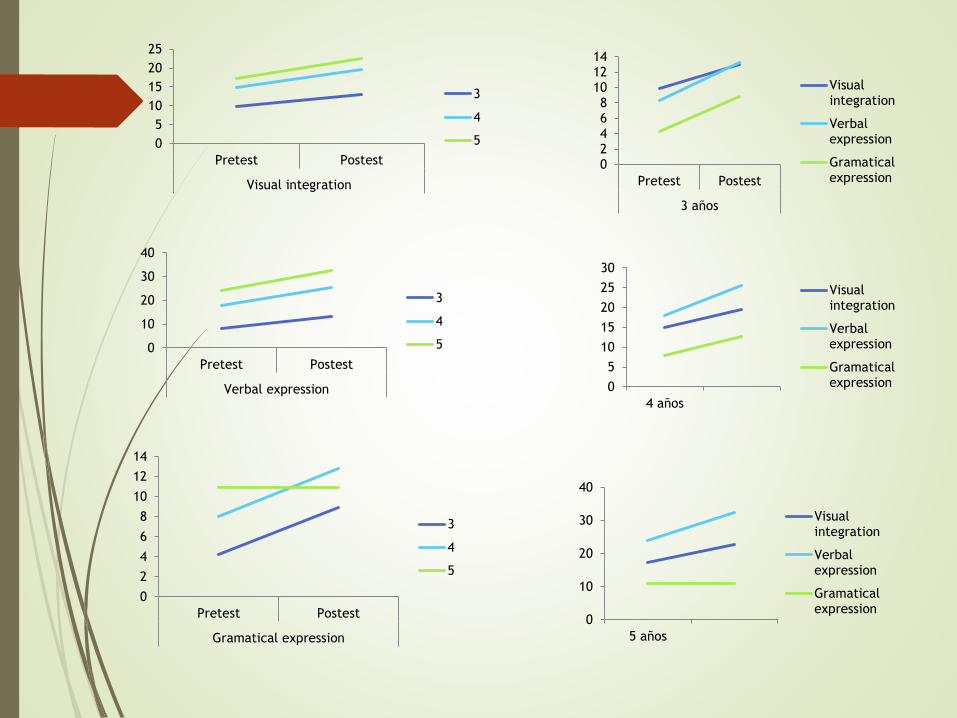
Visual Integration 13.47(4.73) 12.87(5.47) 17.66(7.19) 12.48(5.43) 23.28*** 0.13
Verbal Expression 15.51(8.58) 14.58(9.18) 22.21(11.38) 13.83(8.86) 23.88*** 0.13
Grammatical Integration 7.17(4.16) 6.83(4.59) 12.16(5.69) 6.06(4.60) 49.44*** 0.24
Motor Expression 11.77(5.19) 11.06(5.80) 13.79(5.50) 10.91(5.95) 9.50** 0.05
Auditory Integration 6.30(4.39) 5.61(4.69) 8.01(5.21) 5.83(4.70) 6.96** 0.04
Note. M = Mean, SD = Standard Deviation EG = Experimental Group, CG = Control Group
* p < .05, ** p < .01, *** p < .001.
INTERVENTION
0
5
10
15
20
25
Pretest Postest
Visual integration
3
4
5
0
10
20
30
40
Pretest Postest
Verbal expression
3
4
5
0
2
4
6
8
10
12
14
Pretest Postest
Gramatical expression
3
4
5
02468
101214
Pretest Postest
3 años
Visualintegration
Verbalexpression
Gramaticalexpression
0
5
10
15
20
25
30
4 años
Visualintegration
Verbalexpression
Gramaticalexpression
0
10
20
30
40
5 años
Visualintegration
Verbalexpression
Gramaticalexpression

followed as method
STUDY 2
INSTRUMENTSPARTICIPANTS DATA ANALYSIS
– 62 children, aged 6-7 (M = 6.887, SD = 0.564), 30 girls and 32 boys.
– Two groups: Experimental Group (n = 38; follows the EPI.com intervention) and Control Group (n = 24; follows traditional methodology).
– The sample was classified in two groups in function of the grade: Group 1 (30 students; first grade), Group 2 (32 students; second grade).
– No statistically relevant differences according to age F(1, 60) = 0.50, p = .823, p
2 = .001; F(1, 60) = 0.626, p = .432, p2 = .010; and sex χ2(1) = 0.065, p =
.799.

Tabla 1
Medias, desviaciones típicas para las variables prestest y postest del Peabody e ITPA y
diferencias en el postest entre el GE y el GC
Pretest Postest
GE
(n = 38)
GC
(n = 24)
GE
(n = 38)
GC
(n = 24)
M(DT) M(DT) M(DT) M(DT) F
(1, 60)
p2
Peabody 82.26(17.99) 78.91(18.37) 87.60(20.90) 77.45(19.01)
Auditory Comprehension 32.39(11.95) 31.04(12.76) 35.97(12.55) 30.12(12.90) 3.12 0.05
Visual Comprehension 13.52(3.81) 12.87(5.39) 15.73(4.55) 12.62 (5.28) 6.06* 0.09
Visual Memory 8.15(3.62) 7.58(4.05) 9.71(3.95) 7.29 (4.26) 5.18* 0.07
Auditory Association 17.60(6.88) 16.95(6.82) 20.36(7.30) 16.50(8.54) 3.61 0.05
Auditory Memory 7.78(2.50) 7.66(3.54) 9.76(3.72) 7.50(3.34) 5.86* 0.08
Visual Association 16.94(5.93) 17.00(7.25) 21.92(6.98) 16.54(7.71) 8.31** 0.12
Visual Integration 24.00(5.25) 24.00(7.34) 29.05(6.99) 23.87(7.43) 7.68** 0.11
Verbal Expression 32.60(8.97) 33.75(12.41) 44.73(12.69) 31.95(12.82) 14.79
***
0.19
Grammatical Integration 16.52(5.88) 15.95(6.10) 22.42(5.66) 14.95(6.57) 22.54
***
0.27
Motor Expression 21.02(4.54) 20.45(5.69) 22.97(5.49) 20.62(5.45) 2.69 0.04
Auditory Integration 13.92(5.81) 13.70(5.60) 15.94(6.19) 13.50(6.06) 2.33 0.03
Nota. M = Media, DT = Desviación Típica, GE = Grupo Experimental, GC = Grupo Control.
* p<.05, ** p <.01, *** p <.001.

0
5
10
15
20
25
30
35
40
45
PRE POST
First grade
Visual integration
Verbal expression
Gramaticalexpression
0
10
20
30
40
50
60
PRE POST
Second grade
Visual integration
Verbal expression
Gramaticalexpression
0
5
10
15
20
25
30
35
Pretest Postest
Visual integration
First grade
Second grade
0
10
20
30
40
50
60
Pretest Postest
Verbal expression
First grade
Second grade
0
5
10
15
20
25
30
Pretest Postest
Gramatical expression
First grade
Second grade

It works in other languages?

Does he/she understand oral messages according with
her/his age?
Does he/she understand visual histories?
Can he/she reproduce visual stimuli once memorized?
Can he/she complete unfinished sentences?
Can he/she reproduce even larger series of numbers?
Can he/she associate iconic-symbolic representations
associated each other?
Can he/she identify iconic-symbolic representations?
Can he/she say different words associated to once given
word?
Can he/she unfinished sentences with given words?
Can he/she reproduce with gestures given words (iconic-
simbolic representation?
Can he/she identify unfinished oral words?
EBI ENGLISH TEACHERS QUESTIONNAIRE

0
0,05
0,1
0,15
0,2
0,25
0,3
0,35
0,4
GE PRE
GE POST
-0,05
0
0,05
0,1
0,15
0,2
0,25
0,3
0,35
0,4
0,45
GE PRE
GE POST
ITPA EBI

Conclussions
In the two studies:
EPI.com proves to be effective in interventions on those aspects, hence the
importance of implementing interventions at early ages which lay the
foundation for future learning.
Besides, although the improvement in verbal aspects is not significant, the
means observed show higher scores in the EG than in the CG.
The profile by age and grade showed:
More positive results among the youngest students.
In the two studies,….
The effect sizes were systematically larger in three variables: visual
integration, verbal expression and grammatical integration.
These results point at a more positive evolution in semantic processing
(variables such as visual comprehension) and also in syntactic processing
(visual, grammatical… integration).

ThanksCelestino Rodríguez Pérez
University of Oviedo
https://www.researchgate.net/profile/Celestino_Rodriguez
COST is supported by the EU Framework
Programe Horizon 2020