Reactivity Studies of Tridhydropyridine Radical Cautions ...
189
Purdue University Purdue e-Pubs Open Access Dissertations eses and Dissertations Spring 2014 Reactivity Studies of Tridhydropyridine Radical Cautions by using Fourier-Transform Ion Cyclotron Resonance Mass Spectrometry and Advancement of Mass Spectrometric Analysis of Asphaltenes and Degradation Products Mohammad Sabir Aqueel Purdue University Follow this and additional works at: hps://docs.lib.purdue.edu/open_access_dissertations Part of the Analytical Chemistry Commons , and the Physical Chemistry Commons is document has been made available through Purdue e-Pubs, a service of the Purdue University Libraries. Please contact [email protected] for additional information. Recommended Citation Aqueel, Mohammad Sabir, "Reactivity Studies of Tridhydropyridine Radical Cautions by using Fourier-Transform Ion Cyclotron Resonance Mass Spectrometry and Advancement of Mass Spectrometric Analysis of Asphaltenes and Degradation Products" (2014). Open Access Dissertations. 226. hps://docs.lib.purdue.edu/open_access_dissertations/226
Transcript of Reactivity Studies of Tridhydropyridine Radical Cautions ...
Purdue UniversityPurdue e-Pubs
Open Access Dissertations Theses and Dissertations
Spring 2014
Reactivity Studies of Tridhydropyridine RadicalCautions by using Fourier-Transform IonCyclotron Resonance Mass Spectrometry andAdvancement of Mass Spectrometric Analysis ofAsphaltenes and Degradation ProductsMohammad Sabir AqueelPurdue University
Follow this and additional works at: https://docs.lib.purdue.edu/open_access_dissertations
Part of the Analytical Chemistry Commons, and the Physical Chemistry Commons
This document has been made available through Purdue e-Pubs, a service of the Purdue University Libraries. Please contact [email protected] foradditional information.
Recommended CitationAqueel, Mohammad Sabir, "Reactivity Studies of Tridhydropyridine Radical Cautions by using Fourier-Transform Ion CyclotronResonance Mass Spectrometry and Advancement of Mass Spectrometric Analysis of Asphaltenes and Degradation Products" (2014).Open Access Dissertations. 226.https://docs.lib.purdue.edu/open_access_dissertations/226

PURDUE UNIVERSITY GRADUATE SCHOOL
Thesis/Dissertation Acceptance
To the best of my knowledge and as understood by the student in the Thesis/Dissertation Agreement, Publication Delay, and Certification/Disclaimer (Graduate School Form 32), this thesis/dissertation adheres to the provisions of Purdue University’s “Policy on Integrity in Research” and the use of copyrighted material.
Mohammad Sabir Aqueel
REACTIVITY STUDIES OF TRIDEHYDROPYRIDINE RADICAL CATIONS BY USINGFOURIER-TRANSFORM ION CYCLOTRON RESONANCE MASS SPECTROMETRY ANDADVANCEMENT OF MASS SPECTROMETRIC ANALYSIS OF ASPHALTENES AND LIGNINDEGRADATION PRODUCTS
Doctor of Philosophy
Hilkka I. Kenttämaa
Yu Xia
Chittaranjan Das
Hilkka I. Kenttämaa
Mary J. Wirth
R. E. Wild 02/27/2014


REACTIVITY STUDIES OF TRIDEHYDROPYRIDINE RADICAL CATIONS BY
USING FOURIER-TRANSFORM ION CYCLOTRON RESONANCE MASS
SPECTROMETRY AND ADVANCEMENT OF MASS SPECTROMETRIC
ANALYSIS OF ASPHALTENES AND LIGNIN DEGRADATION PRODUCTS
A Dissertation
Submitted to the Faculty
of
Purdue University
by
Mohammad Sabir Aqueel
In Partial Fulfillment of the
Requirements for the Degree
of
Doctor of Philosophy
December 2014
Purdue University
West Lafayette, Indiana

ii
To my mother Masooda Begum Zaidi For her years of guidance and inspiration
To my brother Makhdoom and sister-in-law Afhra For their unconditional love, affection and support
To my wonderful Wife Kahkashan
For her never ending love, support and encouragement

iii
ACKNOWLEDGMENTS
First and foremost, I would like to extend my thanks to my mother Masooda
Begum Zaidi ,without their motivation and advice through the years; I would not have
become the person who I am proud to be today. Next I would like to thank my advisor
and mentor, Professor Hilkka I. Kenttämaa for her guidance and assistance during my
time at Purdue. I would especially like to thank her for her patience and having faith in
me to become a successful scientist.; Professors Mary.J. Wirth, Chitranjan Das and Yu
Xia for their assistance, time, and commitment as members of my committee. I would
like to thanks the member of Professor Kenttämaa’s research group, Dr. Nelson Vinueza,
Dr. Bartlomiej Jankiewicz, Dr. Vanessa Gallardo, James Riedeman, Dr. Mathew Hurt,
Dr. Lucas Amudson, Ashley Wittrig, Narra Padmaja and other former and present group
members, for their knowledge, support and kindness in my years here at Purdue
University. I would also like to thank the people at Jonathan Amy Facility, specifically
Mark Carlsen, for his time, his expertise and his passion towards fixing instruments,
without his generosity, I would not have been able to fix problems related to the FTICR
mass spectrometers. To Dr. John Nash I extend my appreciation for performing
molecular orbital calculation for the radicals presented in this dissertation studied, and for
all the useful suggestions and insights during radical meetings. To my friends Dr.Aditya
Kulkarni, Amjad Nasir, Dr.Sultan Ahmed, Dr.Charu Kamal, Dr Shrikanth Agnihotra,

iv
Manoj and Sowmya Rudraraju, Afroze Nadaf, Adeel Ahmed, Sulaiman Dawood,
Imaduddin, Aurangzeb, Abdul Rahman Maud, Syeda Fatima Sultana Dr. Vikas Sikervar,
Anusha Karamboor, Ramya Chapperla, Raghavendar Kotha, Ismail Ouraich, Samiul
Haque, Syed Sadiq, Hyder Moosvi, Aladdin Mohammed, Abdul Majid, Dr. Sai Vikram
Vemula, Fazil Ahmed they have been like my family during my graduate studies at
Purdue University and my tenure in United States. And very special thanks go to my
brother Makhdoom and his wife Afhra, Cousins Bushra, Kamran, Zeeshan Souban
Adiba, my aunt Fatima and Uncle Zia for the great time we had when I was in India for
vacations, and to the love of my life, my wife Kahkashan Kazim for her unconditional
love, support and patience.
Finally, I give thanks to Almighty Allah for giving me the strength, health and
blessing during this entire process of development at Purdue.

v
TABLE OF CONTENTS
Page
LIST OF TABLES ........................................................................................................... viii
LIST OF FIGURES ........................................................................................................... ix
ABSTRACT ..................................................................................................................... xiv
CHAPTER 1: INTRODUCTION AND OVERVIEW ........................................................1
1.1 Introduction ........................................................................................................1 1.1.1 FT-ICR Mass Spectrometry .............................................................1 1.1.2 LQIT Mass Spectrometry .................................................................2
1.2 Thesis Overview ................................................................................................2 1.3 References ..........................................................................................................4
CHAPTER 2: FOURIER-TRANSFORM ION CYCLOTRON RESONANCE AND LINEAR QUADRUPOLE ION TRAP MASS SPECTROMETRY: INSTRUMENTAL AND EXPERIMENTAL ASPECTS ...................................................................................5
2.1 Introduction ........................................................................................................5 2.2 FT-ICR Instrumentation .....................................................................................6
2.2.1 Sample introduction ..........................................................................8 2.3 Ion motion in FT-ICR Cell ..............................................................................11
2.3.1 Cyclotron Motion ...........................................................................13 2.3.2 Trapping Motion ............................................................................16 2.3.3 Magnetron Motion .........................................................................17
2.4 Experimental Aspects of Ion-Molecule Reactions ...........................................20 2.4.1 Introduction ....................................................................................20 2.4.2 Distonic Ion Approach ...................................................................20 2.4.3 Experimental Sequence ..................................................................21 2.4.4 Ion Generation ...............................................................................24 2.4.5 Ion Manipulation ............................................................................27
2.4.5.1 Ion Transfer ........................................................................29 2.4.5.2 Swift Excitation and Frequency-sweep .............................29 2.4.5.3 Quadrupolar Axialization(QA) ..........................................30

vi
Page
2.4.5.4 Collision-activated Dissociation(CAD) .............................33 2.4.6 Ion Detection ..................................................................................34
2.5 Ion-Molecule Reaction .....................................................................................36 2.5.1 Ion-Molecule Reaction Kinetics ....................................................37 2.5.2 Brauman Double-Well Potential Energy Surface ..........................39
2.6 Molecular Orbital Calculations ........................................................................42 2.7 Linear Quadupole Ion Trap (LQIT) Mass Spectrometer .................................43
2.7.1 Introduction ....................................................................................43 2.7.2 Ion Generation ...............................................................................45 2.7.3 Ion Transfer from Ion Source into Trap .........................................47 2.7.4 Ion Trapping...................................................................................48
2.7.4.1 Radial Ion Motion ..............................................................50 2.7.4.2 Axial Ion Motion................................................................53 2.7.4.3 Helium Buffer Gas .............................................................54
2.7.5 Ion Ejection and Detection .............................................................55 2.7.6 Ion Isolation and Activation ...........................................................59
2.7.6.1 CAD in the Trap.................................................................60 2.8 References ........................................................................................................61
CHAPTER 3: SYNTHESIS OF RADICAL PRECURSORS AND ASPHALTENE MODEL COMPOUNDS ...................................................................................................66
3.1 Introduction .....................................................................................................66 3.2 Synthetic Procedures ........................................................................................73
3.2.1 4-Amino-2-chloro-5-iodopyridine ................................................74 3.2.2 2-Chloro-4,5-diiodopyridine .........................................................75 3.2.3 2,4,5-Triiodopyridine ....................................................................76 3.2.4 3-Amino-2,6-triiodopyridine. .......................................................77 3.2.5 2,3,6-Triiodopyridine ....................................................................78 3.2.6 2,3,5-Triiodopyridine ....................................................................79
3.3 References ........................................................................................................87
CHAPTER4: CHARACTERIZATION OF THE REACTIVITY OF CHARGED σ, σ, σ,-TRIRADICALS ........................................................................................................88
4.1 Introduction ......................................................................................................88 4.2 Generation of Triradicals .................................................................................90 4.3 Possible Factors Controlling the Reactivity of Triradicals ..............................91
4.3.1 Electron Affinity ............................................................................92 4.3.2 Hydrogen Bonding Interactions in Transition States .....................95 4.3.3 Dehydrocarbon Atom Separation (DAS) .......................................96 4.3.4 Triradical Stabilization Energies (TSEs) .......................................96

vii
Page
4.4 Observed Reactivity .........................................................................................99
4.4.1 The 2,4,5-Tridehydropyridinium Ion .............................100 4.5 References ......................................................................................................109
CHAPTER 5: DEVELOPMENT OF A NOVEL ATMOSPHERIC PRESSURE CHEMICAL IONIZATION (APCI) METHOD USING PRIOR TREATMENT WITH PALLADIUM CHLORIDE FOR IDENTIFICATION OF LIGNIN DEGRADATION PRODUCTS CONTAINING THE 3-PHENYLALLYL ALCOHOL MOIETY ............111
5.1 Introduction ....................................................................................................111 5.2 Experimental Conditions ...............................................................................112
5.2.1 Materials ......................................................................................112 5.2.2 Sample Preparation ......................................................................113 5.2.3 Instrumentation ............................................................................113
5.3 Results and Discussions .................................................................................114 5.4 Conclusions ....................................................................................................130 5.5 References ......................................................................................................131
CHAPTER 6: A CAD STUDY ON IONIZED MODEL COMPOUNDS OF ASPHALTENES .............................................................................................................133
6.1 Introduction ....................................................................................................133 6.2 Experimental ..................................................................................................134 6.3 Results and Discussions .................................................................................135
6.3.1 Hexylbenzene (1) and Dodecylbenzene (2) .................................139 6.3.2 Hexylnaphthalene (3) and Dodecylnaphthalene (4) ....................142 6.3.3 9-Hexylanthracene (5) and 9-Dodecylanthracene (6) ..................144 6.3.4 Hexylpyrene (7) and Dodecylpyrenene (8) ..................................146 6.3.5 Bond Dissociation Energies for Ethylbenzene and
9-Ethylanthracene .......................................................................150 6.4 Conclusions ....................................................................................................151 6.5 References ......................................................................................................152
VITA ................................................................................................................................153
PUBLICATIONS .............................................................................................................154

viii
LIST OF TABLES
Table Page
4.1 Observed reactions, branching ratios for the primary products, and reaction efficiencies for reactions of monoradicals related to 9 with cyclohexane, tetrahydrofuran, allyl iodide and dimethyl disulfide in FT-ICR mass
spectrometer. ............................................................................................................ 101 4.2 Observed reactions, branching ratios for the primary products, and reaction efficiencies for reactions of biradicals related to 9 with cyclohexane, tetrahydrofuran, allyl iodide and dimethyl disulfide in FT-ICR mass
spectrometer. ............................................................................................................ 103 6.1 MS2 spectra measured for asphaltene model compounds ionized by (+) APCI/CS2 and subjected to CAD. ........................................................................... 137
ix
LIST OF FIGURES
Figure Page
2.1 Finnigan Model 2001 Fourier transform ion cyclotron resonance mass spectrometer (FT-ICR). ...................................................................................................................... 7
2.2 Details of FT-ICR dual-cell. Reproduced with permission from Nicolet FT-MS 2000
instruction manual. Copyright 1985 Thermo Fisher Scientific Inc ........................... 10
2.3 Dual cell environment. Reproduced with permission from Nicolet FT-MS 2000 instruction manual. Copyright 1985 Thermo fisher Scientific Inc ............................. 12
2.4 The cyclotron motion of positively charged ion in x-y plane ..................................... 14
2.5 Cyclotron and trapping motions of a positively charged ion in the ICR Cell in the
presence of a uniform magnetic field (B) and electric field ....................................... 15
2.6 The harmonic motion of an ion trapped in the magnetic field before transfer (a) and during transfer (b) ....................................................................................................... 17
2.7 Representation of cyclotron (small circles) and magnetron (big circles) motions
(greatly enhanced for visibility). The magnetron motion follows equipotential lines, and is independent of the m/z ratio of the ion ............................................................. 19
2.8 Distonic ion approach ................................................................................................ 21 2.9 The sequence of events of the ion-molecule reaction involving a radical ion and a
neutral reagent. ............................................................................................................ 22 2.10 The sequence of events leading to generation of an isolated triradical .................... 23
x
Figure Page 2.11 Chemical Ionization reactions a) and b) Protonation, c) methylation and d)
deuteration................................................................................................................... 26 2.12 Ion excitation to a larger cyclotron radius via application of an on-resonance rf-
potential to the excitation plates. ................................................................................ 28 2.13 The electrical configuration for quadrupolar excitation (source cell) and dipolar
excitation (analyzer). ................................................................................................... 31 2.14 Simulation of ion trajectories in ac ICR cell during quadrupolar axailization.
Adapted with permission from ref.39 (A) Projection of three-dimensional simultaneous periodic cyclotron, magnetron, and axial motions in the absence of collisional damping and electric excitation. (B) Cyclotron and axial motions dampen quickly while the radius of the magnetron grows at a lower rate with the addition of collision. (C) Quadrupolar excitation interconverts magnetron and cyclotron motion and dampens the cyclotron radius to bring ions back into the center of cell. Copyright 1994 American Chemical Society. ............................................................................ 32
2.15 Detection of Ions, an image current is produced on the detection plates, detected and
converted to a mass spectrum.. ....................................................................................36 2.16 Potential energy surfaces for ion-molecule reactions in solution and the Gas phase 40 2.17 Brauman’s double-well potential energy surface showing the tightness of the
transition state of a gas-phase ion-molecule reaction ................................................. 41 2.18 Schematic of LQIT mass spectrometer with operational pressure for each
region of the instrument indicated. ..............................................................................44 2.19 Components of the API stack, ion optics, and mass analyzer .................................. 45 2.20 Ionization upon atmospheric pressure chemical ionization (APCI) ......................... 46 2.21 dc Offset voltages applied to the ion source, the API stack and the ion optics to aid in ion transmission in the axial direction. Illustration of the dc voltage
gradient of the ion optics and the voltage applied to the gate lens (-72 V) that is used to accelerate ions into the ion trap .......................................................................47
2.22 Quadrupoles that have the same rf voltage applied to opposite poles but 180oout-of-phase voltage applied between neighboring poles .................................. 49 2.23 The Mathieu stability diagram for a linear quadrupole ion trap ............................... 53

xi
Figure Page 2.24 Trapping of ions in the z-axis .................................................................................. 54 2.25 Use of helium as a buffer gas. Frictional collisions with helium concentrate the transferred ions into the center of the cell so that they can be trapped and detected more efficiently. .................................................................................................................55 2.26 Ion’s ejection with q-scanning vs resonant ejection ................................................ 56 2.27 The ion detection system has two parts: 1) conversion dynode and 2) electron multiplier. Ions ejected through the X-rods are attracted to the conversion dynode and collide with its surface to make secondary particles that travel to the electron multiplier to eject many electrons that the initially produced electrical current is amplified……...58 2.30 Graphical representation of the multi-frequency tailored waveform of variable amplitude for isolation of an ion………………………………………………..60
3.1 Synthesized radical precursors and asphaltene model compounds ........................... 68 3.2 Precursors for 12, 13, 14, and 15 .............................................................................. 73 3.3 1H NMR of Compound 1 .......................................................................................... 80 3.4 Crystal structure of Compound 2 .............................................................................. 81 3.5 1H NMR of Compound 3 .......................................................................................... 82 3.6 13C NMR of Compound 3 ......................................................................................... 83 3.7 1H NMR of Compound 21 ........................................................................................ 84 3.8 1H NMR of Compound 18 ........................................................................................ 85 3.9 1H NMR of Compound 19 ........................................................................................ 86 4.1 Tridehydrobenzenes, tridehydropyridines and substituted tridehydropyridines. ...... 88 4.2 Generation of isomeric tridehydropyridinium ions in the FT-ICR. .......................... 91 4.3 Illustration for the influence of singlet-triplet gap (S-T gap) on the radical
reactivity of biradicals ..................................................................................................92 4.4 The electron affinities (eV) of tridehydrobenzene and tridehydropyridinium
cations). ........................................................................................................................94

xii
Figure Page 4.5 Doublet and quartet states of σ, σ, σ,-triradicals ....................................................... 95 4.6 The 2,4,5-tridehydropyridinium ion 9 and related mono and biradicals. ............... 100 5.1 Model Compounds Containing 3-phenylallyl alcohol Moiety ................................ 114 5.2 Model Compounds without 3-phenylallyl alcohol Moiety ..................................... 115 5.3 Positive mode APCI mass spectra of a) coniferyl alcohol (1) (MW 180 Da), b)
coniferyl alcohol sonicated with PdCl2 ..................................................................... 117 5.4 Positive mode APCI mass spectrum measured after treating compound 2 for 20
minutes with PdCl2. .................................................................................................. 118 5.5 Positive mode APCI mass spectra of a) isoeugenol (15) (MW 164 Da) and b)
isoeugenol sonicated with PdCl2 ............................................................................. 120 5.6 Positive mode APCI mass spectrum of a) compound 5 sonicated for 10 minutes
with PdCl2, b) compound 5 sonicated for 20 minutes with PdCl2, c) compound 6 sonicated for 10 minutes with PdCl2, and d) compound 6 sonicated for 20 minutes with PdCl2. .................................................................................................................121
5.7 Positive mode APCI mass spectra of (E)-2-methyl-4-phenylbut-3-en-2-ol (7) (a)
before and (b) after 10 minute sonication with 10 equivalents of PdCl2 Compound 10 (methyl stearate) formed a protonated molecule upon traditional. .....122 5.8 Positive mode APCI mass spectrum of trans-2-octenol (8) (MW 128 Da) (a)
before and (b) after sonication with PdCl2. ................................................................125 5.9 Positive mode APCI mass spectra of a degraded lignin sample (a) without and (b)
with PdCl2 treatment.. ................................................................................................126 5.10 Positive mode APCI mass spectra of a degraded lignin sample spiked with
coniferyl alcohol (1) (a) before and (b) after treatment with PdCl2. ..........................127 5.11 Positive mode APCI mass spectrum of a degraded lignin sample spiked with
sinapyl alcohol (4) (a) before and (b) after treatment with PdCl2. .........................128 5.12 Positive mode APCI mass spectrum for a degraded lignin sample spiked with
sinapyl alcohol (4) and coniferyl alcohol (1) (a) before and (b) after treatment with PdCl2.. ....................................................................................................................... 129

xiii
Figure Page 6.1 Asphaltene model compounds. ............................................................................... 136 6.2 CAD mass spectrum of the molecular ion of hexylbenzene (1). .......................... 139 6.3 CAD mass spectrum of molecular ion of dodecylbenzene (2). .............................. 140 6.4 CAD mass spectrum of molecular ion of hexylnaphthalene (3). ........................... 142 6.5 CAD mass spectrum of molecular ion of dodecylnaphthalene (4). ....................... 143 6.6 CAD mass spectrum of molecular ion of 9-hexylanthracene (5). ......................... 144 6.7 CAD mass spectrum of molecular ion of 9-dodecylanthracene (6). ...................... 145 6.8 CAD mass spectrum of molecular ion of hexylpyrene (7). .................................. 146 6.9 CAD mass spectrum of molecular ion of dodecylpyrene (8). .............................. 147 6.10 Comparison of CAD spectra of molecular ions of (a) hexylbenzene, (b)hexylnaphthalene, (c) hexylanthracene, (d) hexylpyrene ................................ 148 6.11 Comparison of CAD spectra of molecular ions of (a) dodecylbenzene, (b)
dodecylnaphthalene, (c) 9-dodecylanthracene, (d) dodecylpyrene ......................... 149 6.12 Calculated enthalpies for benzylic cleavages of 9-ethylanthracene (top) and
ethyl benzene (bottom) ..............................................................................................150

xiv
ABSTRACT
Aqueel, Mohammad Sabir. Ph. D., Purdue University, December 2014. Reactivity Studies of Tridehydropyridine Radical Cations by Using Fourier-Transform Ion Cyclotron Resonance Mass Spectrometry and Advancement of Mass Spectrometric Analysis of Asphaltenes and Lignin Degradation Products. Major Professor: Hilkka I. Kenttämaa. Aromatic organic molecules which have unpaired electrons play an important role
in a variety of applications in the fields of organic synthesis, organic magnets, and
biological activity of organic compounds. Several studies have been published on σ- type
carbon-centered mono- and biradicals. Reactive intermediates with three formally
unpaired electrons are known as triradicals. They can be defined as species with three
electrons distributed in three degenerate or nearly degenerate orbitals, based on Salem’s
definition of biradicals from the electronic structure point of view. Very little is known
about the reactivity of carbon-centered σ,σ,σ- triradicals due to the complexity of
studying triradicals experimentally. Fourier-transform ion cyclotron resonance mass
spectrometry (FT-ICR) and “distonic ion approach” were employed to characterize the
reactivity of three isomeric σ,σ,σ-triradicals. The reactivity of the triradicals was
compared with previously studied related mono- and biradicals. Examination of the
reactivity of σ,σ,σ-triradicals not only provides information about the chemical
properties of triradicals but also helps us understand better the influence of spin/spin
interactions within polyradicals.

xv
In addition to fundamental studies, as described above, mass spectrometry can be
helpful in structural elucidation of components of complex mixtures. This dissertation
reports the utility of atmospheric pressure chemical ionization(APCI) tandem mass
spectrometry for the identification of compounds containing the 3-phenylallyl alcohol
moiety in lignin degradation product mixtures. This method was needed because most
lignin degradation products with these structural features undergo fragmentation when
they are ionized in mass spectrometers by using common methods. The specific goal was
to develop a mass spectrometric evaporization/ionization method that produces only one
ion type per analyte without fragmentation that can be used to derive MW information
The results demonstrate that when sample solutions of lignin model compounds
containing the 3-phenylallyl alcohol moiety are dissolved in water and doped with PdCl2,
atmospheric pressure chemical ionization (APCI)yields abundant (M-H)+ ions. The
specificity of the method was explored by analyzing various other model compounds
which do not contain the 3-phenylallyl alcohol moiety. The model compounds that
contained unsaturation in the side chain but no 3-phenylallyl alcohol moiety generated
ions such as (M-H+H2O)+ and (M-H+CH3OH)+ upon APCI after treating the sample with
PdCl2. Finally, the method was used to explore the presence of 3-phenylallyl alcohol
moiety containing compounds in real degraded lignin samples. The mass spectra collected
before and after treatment of the degraded lignin sample with PdCl2 indicated the absence
of compounds with the 3-phenylallyl alcohol moiety. In order to confirm this conclusion,
the degraded lignin samples were doped with known amounts of model compounds
containing the 3-phenylallyl alcohol moiety and the mass spectra were measured before
and after treating the sample with PdCl2. The model compounds were easily identified by

xvi
using this method. This method will greatly facilitate the characterization of mixtures
derived from biomass.
In addition to identification of compounds containing 3-phenylallyl alcohol
moiety in complex lignin mixtures, APCI tandem mass spectrometry was also used to
study the fragmentation behavior of ionized synthetic model compound of asphaltenes.
The CAD studies of ionized molecules with fused aromatic ring systems, such as 9-
dodecylanthracene, dodecylpyrene, 9-hexylnaphthalene and hexylpyrene, show
exclusively benzylic bond cleavages. However, the alkyl side chains of ionized
hexylnaphthalene, dodecylnaphthalene, hexylbenzene and dodecylbenzene react with the
aromatic π-system to produce odd-electron fragment ions from odd-electron ions.
Asphaltene model compounds show less benzylic bond cleavages. This suggests that the
ring size of the fused aromatic ring system plays an important role in controlling these
fragmentations.

1
CHAPTER 1: INTRODUCTION AND OVERVIEW
1.1 Introduction
Aromatic organic molecule such as mono, bi and triradicals plays an important role in
the field of organic synthesis and biological activities of organic compounds.1 The study
of radical reactions has become an interesting area of research because there are several
processes initiated through radicals. Chemical processes such as combustion, aging and
several biochemical processes proceed through radical pathways.2
1.1.1 FT-ICR Mass Spectrometry
Fourier transform ion cyclotron resonance (ICR) mass spectrometry was
developed in 1970’s.3 FT-ICR was developed by Melvin B. Comisarow and Alan G.
Marshall in 1974.4,5 It quickly proved to be a powerful tool for accurate mass
measurement compared to other mass spectrometers., It has the highest mass accuracy
and resolution for ions with m/z values of up to about 3000.6,7It is a versatile and
powerful analytical technique which is used, for example, in the investigation of gas-
phase ion chemistry.8,9 The high resolution and mass accuracy make this technique ideal
for the characterization of many complex mixtures. One of the important features of FT-
ICR are its ion storage capability and the ability to easily manipulate gaseous ions, which

2
allows the gas-phase synthesis and the study of many interesting ions via tandem mass
spectrometry experiments. Therefore, FT-ICR mass spectrometry along with collision-
activated dissociation (CAD) and ion/molecule reactions have been used here to study
the structure and reactivity of charged triradicals.
1.1.2 LQIT Mass Spectrometry
The LQIT instruments have greater versatility and extreme sensitivity. These
instruments have much greater ion trapping capacity and trapping efficiency than their
precedent, the 3-D quadrupole ion traps (QIT).10 Many stages of tandem mass
spectrometry (MSn) can be performed. Multiple-state tandem mass spectrometry is a
powerful tool for ion structural elucidation, wherein an ion of interest is isolated and
subjected to reactions whose product ion’ structures can be probed via a second stage of
mass spectrometry. LQIT mass spectrometry along with multiple-stage tandem mass
spectrometry experiments have been demonstrated to be a powerful tool for ion structure
elucidation.
1.2 Thesis Overview
The research discussed in this dissertation focused on the use of gas-phase
ion/molecule reactions for reactivity studies of organic poly in an FT-ICR mass
spectrometer, and the use of a LQIT mass spectrometer for the development of an
ionization method for 3-phenylally alcohol containing compounds as well as to study the
fragmentation behavior of ionized model compounds of asphaltenes.

3
Chapter 2 summarizes the experimental aspects, principles of instrumentation and the
experimental setups and fundamental principles of FT-ICR and LQIT mass spectrometers
used in these studies. Chapter 3 describes the syntheses of pyridine based triradical
precursors used to generate triradicals in the experiments presented in Chapter 4 and the
synthesis of six asphaltene model compounds used in CAD studies described in Chapter
6
Chapter 4 describes reactivity studies on charged σ,σ,σ-triradicals. These studies
provide information about the chemical behavior of tridehydropyridinium cations.
Chapter 5 describes the utility of palladium chloride as a dopant for the ionization and
identification of lignin degradation products containing the 3-phenylallyl alcohol
functionality by using atmospheric pressure chemical ionization (APCI).
Finally, Chapter 6 describes a study of the fragmentation behavior of ionized
asphaltene model compounds containing different aromatic cores and varying alkyl chain
lengths.

4
1.3 References 1 Wolf, C.; Tumambac, G. E.; Villalobos, C. N. Synlett. 2003, 1801. 2 Bear, K. D.; Coote, M. L. J. Phys. Chem. A. 2004, 108, 6275. 3 Comisarow, M. B.; Marshall, A. G. J. Mass Spectrom. 1996, 31, 581. 4Comisarow.M; Marshall, A. G. Chem. Phys. Lett. 1974, 26, 489. 5Comisarow.M.; Marshall, A. G. Chem. Phys. Lett. 1974, 25, 282. 6Comisarow,M.B.; Marshall, A.G. Chem. J.MassSpectrom. 1996, 31, 588. 7 Marshall, A. G.; Comisarow,M.B.; Parisod, G. J.Chem. Phys. 1979, 71, 4434. 8 Beauchamp, J. L. Annu. Rev. Phys. Chem. 1971, 22, 527. 9 Anders, L. R.; Beauchamp, J. L.; Dunbar, R. C.; Baldeschwieler, J. D.
J. Chem. Phys. 1966, 45, 1062. 10 March, R. R. QuadrupoleIon Trap Mass Spectrometry; John & Wiley, Hoboken, N.J., 2005

5
CHAPTER 2: FT-ICR AND LQIT MASS SPECTROMETRY: INSTRUMENTAL AND EXPERIMENTAL ASPECTS
2.1 Introduction
The principle of ion cyclotron resonance was discovered by Ernest O. Lawrence
and Stanley M. Livingston in 1932.1 Ion cyclotron resonance found a place in the field of
analytical chemistry with the design of Omegatron - the first ion cyclotron resonance
(ICR) mass spectrometer.2 Fourier transform ion cyclotron resonance (ICR) mass
spectrometry was introduced in 1970’s. It quickly proved to be a powerful tool for mass
measurement compared to other mass spectrometers due to its high mass accuracy and
resolution.3,4The promising results of the first scanning ICR mass spectrometers led to the
development of first commercial mass spectrometers led to the development of first
commercial ICR mass spectrometer by Varian (1966), It has been extensively used in
investigation of gas-phase ion chemistry5,6.Furthermore, its tandem mass spectrometry
(MSn) capabilities, detection of all ions simultaneously and ability to store ions for long
periods of time also make the FT-ICR mass spectrometric technique an excellent tool for
various analytical applications.
The principles of FT-ICR mass spectrometry and their applications have been
reviewed extensively. This chapter briefly discusses the fundamentals of FT-ICR mass
spectrometry and operational parameters of the instrument, typical experimental
conditions, and basics of gas-phase ion-molecule reactions. Molecular orbital calculations

6
were carried out by Dr. John J. Nash to complement experimental results. The
importance of LQIT mass spectrometry is discussed in section 2.7
2.2 FT-ICR Instrumentation
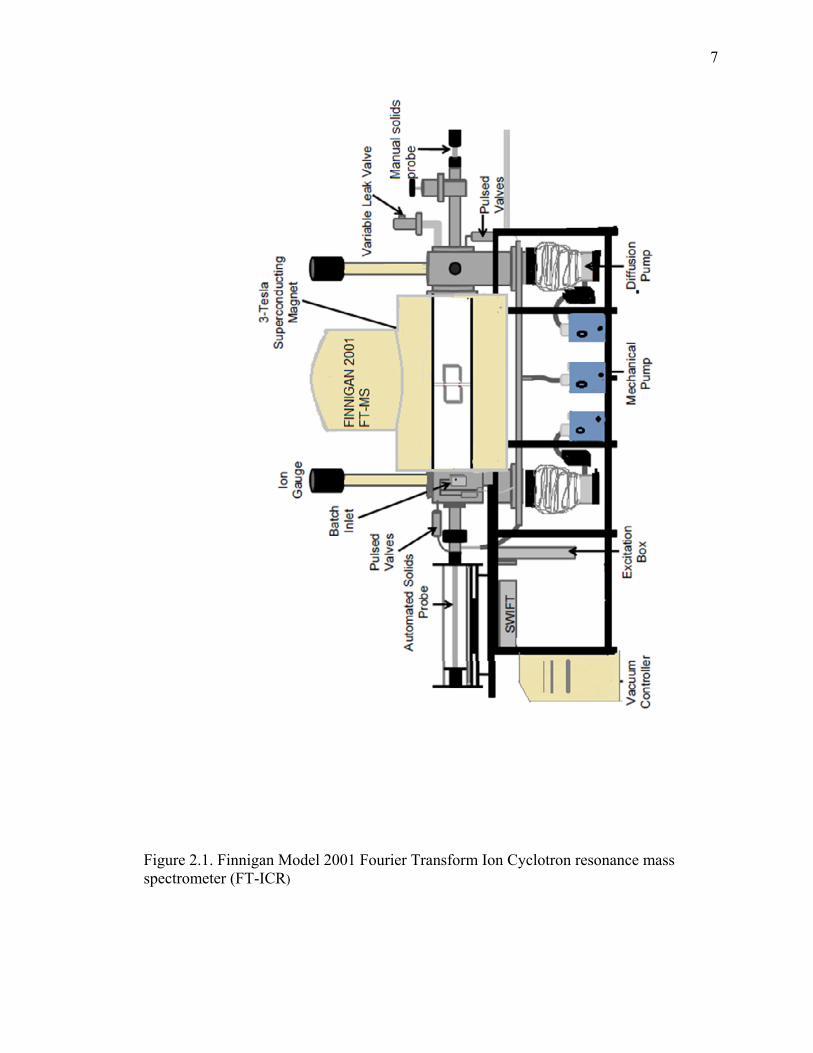
All experiments were carried out using a3-Tesla Finnigan Model FTMS 2001
Fourier transform ion cyclotron resonance (FT-ICR) mass spectrometer (Figure 2.1)
equipped with a Sun Sparc 20 data station running ODYSSEY version 4.0 software and a
Stored Waveform Inverse Fourier Transform7 (SWIFT) cell controller.8,9The system was
equipped with three main components: a superconductive magnet, an ultrahigh vacuum
system, and an analyzer dual cell.10 The high vacuum was maintained by two Edwards
160P/700 (800 Ls-1) diffusion pumps, one for each side of the dual cell, each backed with
an Alcatel mechanical pump. The vacuum system was operated under a nominal base
pressure lower than 10-9 Torr in each of the cells, as measured by two Bayard-Alpert
ionization gauges located about one meter above each cell.11To accurately determine the
pressure of the reagent in the ICR chamber, corrections needed to be made to ionization
gauge readings in order to account for the distance of the ionization gauges from the cell
and their sensitivity toward different neutral reagents12 (for details, see Section 2.5.2).
7
Figure 2.1. Finnigan Model 2001 Fourier Transform Ion Cyclotron resonance mass spectrometer (FT-ICR)

8
2.2.1 Sample Introduction
The instrument used for this research was equipped with three pulsed valve
assemblies, two on the source side and one on the analyzer side of the dual cell, were
used to introduce gaseous and volatile liquid samples. Two batch inlet systems (one on
each side) containing Andonian variable leak valves were normally used for introduction
of liquid samples with relatively low boiling points. Two Varian all metal leak valves
located on each side of the instrument were used for introduction of volatile solid and
highly viscous liquid samples. In addition, both sides of the instrument contained heated
probes for introduction of nonvolatile solid samples. Samples were introduced into the
instrument through various inlets-solids’ probes, Varian variable leak valves,13 batch inlet
systems equipped with variable leak valves and pulsed valves. Gaseous samples, such as
helium and argon, which were used for quadrupolar axialization and ion cooling,
respectively, were introduced into the instrument through Parker Hannifin pulsed
valves.14 Highly volatile liquids were introduced into the instrument using Andonian leak
valves. An automated solids’ probe was used to introduce nonvolatile samples into the
source cell. The automated solids probe’s temperature was raised up to 250 0C whenever
needed.
The instrument contained a dual-cell consisting of two 2-in.cubic cell assemblies
sharing one common side.15 The cells were aligned collinearly with the magnetic field
produced by a 3.0-T superconducting magnet. The two regions of the dual cell, source
region and analyzer region, were framed by a stainless steel, vacuum-tight divider that
separates the bore of the magnet into two equal chambers. This design allowed
differential pumping of each region so that the source region could be maintained at

9
certain pressures without affecting the pressure established in the analyzer region. Each
of the cubic cell assemblies consisted of three pairs of parallel plates which were
electrically isolated from each other and mechanically held together. The three plates that
were perpendicular to the magnetic field were used for trapping ions along the magnetic
field axis by applying a small potential (typically ±2 V) to them. The middle trapping
plate is called the conductance limit.

10
Figure 2.2 Details of FT-ICR dual-cell. Reproduced with permission from Nicolet FT- MS 2000 instruction manual. Copyright 1985 Thermo Fisher Scientific Inc.

11
The conductance limit contained a 2 mm hole in the center, which allowed for
ions to traverse from one cell into the other when this trapping plate was grounded. In
addition, the 2 mm hole allowed for electron beam to travel from the electron source
(electron filament), located on the analyzer site, to the source site, where ions could be
generated by electron ionization. The remaining four plates of each cell were parallel to
the magnetic field and were used for excitation and detection of ions. In each cell, two
opposing plates, at the bottom and at the top, were used for detection and the two
remaining ones were used for excitation. These two plates were maintained at ground
potential during ion-molecule reaction processes, while an rf-pulse was applied to them
during ions’quadrupolar axialization, excitation, detection, isolation and for CAD. All
these events are discussed in detail below
2.3 Ion motion in FT-ICR Cell
Ions’ motion in the FT-ICR mass spectrometer is controlled by the magnetic and electric
fields that are present.16 Equation 2.1 gives the sum of the forces F that act upon an ion
with a charge q and velocity v as a result of its interaction with an electric field E and a
magnetic B.17
Eq. 2.1
The magnetic field is uniform, homogenous and acts in one direction over the volume of
FT-ICR dual-cell (Figure 2.3). The electric field arises from the application of voltages to
the ICR’s trapping plates. The charged particles experience three types of motion:
cyclotron, trapping and magnetron motions18,19 in the collision free environment of the

12
FT-ICR dual cell ( pressure typically 10-9 torr). These motions are described in following
sections.
Figure 2.3 Dual cell environment. Reproduced with permission from Nicolet FT-MS 2000 instruction manual. Copyright 1985 Thermo Fisher Scientific Inc.

13
2.3.1 Cyclotron Motion
An ion moving in a uniform magnetic field is subject to an inward-directed
Lorentz force (F Lorentz) that is perpendicular to the direction of the velocity of the ion (v)
and the strength of the magnetic field (B) as shown in the following equation.
FLorentz = ma = qvB Eq. 2.2
where m is the mass of the ion, a is the acceleration experienced by the ion, and q is the
charge of the ion.20,21 The Lorentz force is counterbalanced by the outward directed
centrifugal force, FCentrifugal. This force is defined by equation 2.3,
FCentrifugal = Eq. 2.3
where m and v are the mass and velocity of the ion, respectively, and r is the radius of the
ions’ cyclotron motion. Since centrifugal and Lorentz forces balance each other, the
equations 2.2 and 2.3 can be set equal to each other as shown in Equation 2.4. Equation
2.4 can be divided by v to yield Equation 2.5.
Eq. 2.4
Eq. 2.5
The cyclotron frequency (υc) of a charged particle in a circular motion is directly related
to the velocity and inversely related to the radius of the motion of the particle.

14
Figure 2.4 The cyclotron motion of a positively charged ion in the x-y plane
2 Eq.2.6

15
Substitution of in Equation 2.5 with 2 gives the following dependence
Eq. 2.7
Equation 2.7 shows that the cyclotron frequency of a charged particle depends on its
mass-to-charge ratio and the strength of the magnetic field. Ions in an FT-ICR revolve at
a frequency independent of their kinetic energies. This feature of FT-ICR mass
spectrometers allows them to achieve much higher resolution than instruments in which
resolution is dependent on the kinetic energies of ions. In this work, the cyclotron
frequencies of singly-charged ions range from 2.5 MHz to 91.4 kHz, corresponding to
mass-to-charge (m/z) ratios of 18-500.
Figure 2.5 Cyclotron and trapping motions of a positively charged ion in the ICR cell in the presence of a uniform magnetic field (B) and electric field (E)
16
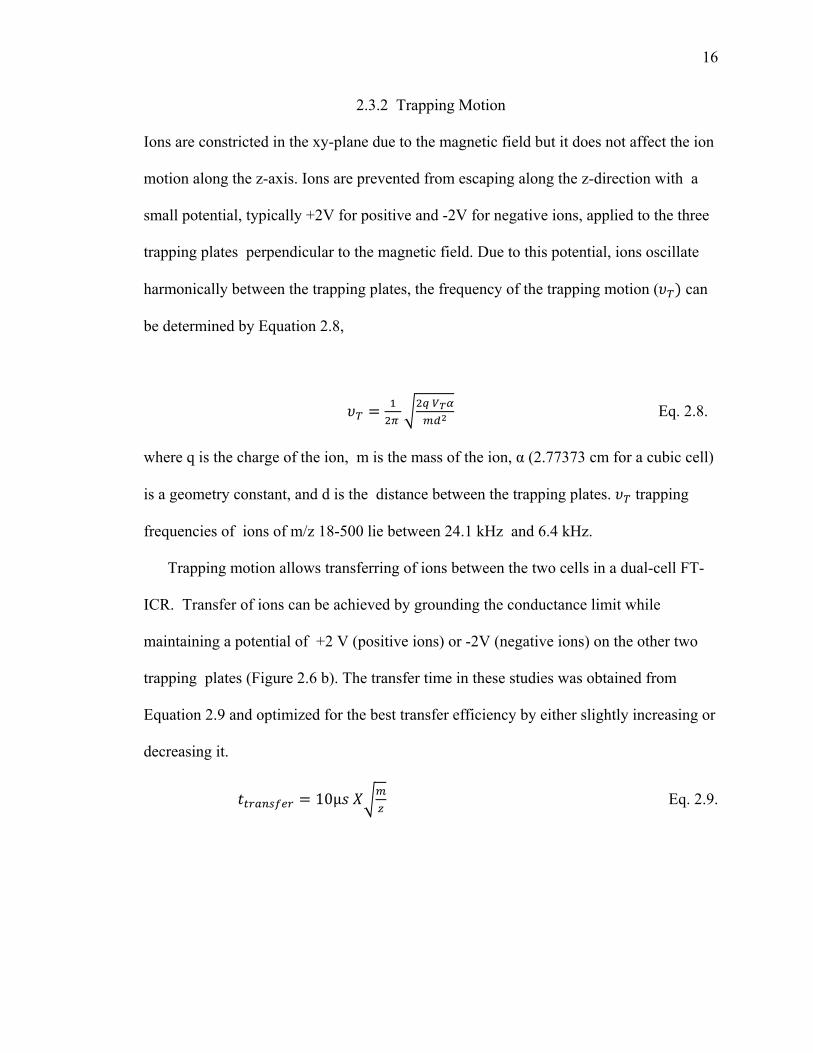
2.3.2 Trapping Motion
Ions are constricted in the xy-plane due to the magnetic field but it does not affect the ion
motion along the z-axis. Ions are prevented from escaping along the z-direction with a
small potential, typically +2V for positive and -2V for negative ions, applied to the three
trapping plates perpendicular to the magnetic field. Due to this potential, ions oscillate
harmonically between the trapping plates, the frequency of the trapping motion ( can
be determined by Equation 2.8,
Eq. 2.8.
where q is the charge of the ion, m is the mass of the ion, α (2.77373 cm for a cubic cell)
is a geometry constant, and d is the distance between the trapping plates. trapping
frequencies of ions of m/z 18-500 lie between 24.1 kHz and 6.4 kHz.
Trapping motion allows transferring of ions between the two cells in a dual-cell FT-
ICR. Transfer of ions can be achieved by grounding the conductance limit while
maintaining a potential of +2 V (positive ions) or -2V (negative ions) on the other two
trapping plates (Figure 2.6 b). The transfer time in these studies was obtained from
Equation 2.9 and optimized for the best transfer efficiency by either slightly increasing or
decreasing it.
10μ Eq. 2.9.

17
Figure 2.6 The harmonic trapping motion of an ion trapped in the magnetic field (a) before transfer and (b) during transfer into the second cell
2.3.3. Magnetron Motion
Ions are trapped in FT-ICR for an extended period of time due to the combination
of magnetic and electric fields. Ions are constrained in xy-plane perpendicular to the
magnetic field while ion motion along z-axis is constrained due to the repulsive
electrostatic potential applied to the trapping plates. The combination of the electric and
magnetic fields produces a third ion motion, the magnetron motion even though trapping
motion and cyclotron motion are not coupled. Magnetron motion of ions guides the
center of the cyclotron motion of the ions around the center of the cell (Figure 2.7). The
outward radial force ( ) which drives the trapped ions outward and away from the center
of the cell is described by Equation 2.10
Eq. 2.10

18
where q is the ion charge, is the potential applied to the trapping plates, r is the radius
of the ions’ magnetron motion, α (1.39 cm for a cubic cell) is a cell geometry factor, and
a is the distance between the trapping plates. The frequency of the magnetron motion is
defined as follows:
Eq. 2.11
The magnetron frequency is directly proportional to the trapping potential, , and
the cell geometry factor α and inversely proportional to the strength of magnetic field, B,
and the distance of trapping plates, a. The magnetron frequency is independent of an
ion’s mass-to-charge ratio (m/z). Therefore, all ions will have the same magnetron
frequency under identical conditions. The frequency of magnetron motion of an ion in the
3 T FT-ICR mass spectrometer used in these studies is about 114 Hz. It is much smaller
than the cyclotron frequencies of ions (2.5 MHz to 45.7 kHz in these studies). The
magnetron motion does not serve any useful analytical purpose. However, it has an
influence on ion motion, which unfavorably affects resolution, mass accuracy, ion
transfer from one cell into the other, and sensitivity. Increase in the ions’ magnetron orbit
due to collisions can bring the ions too close to the cell walls and result in ion loss.
Quadrupolar axialization can be used to minimize the adverse effects of magnetron
motion by converting it into cyclotron motion (discussed below).

19
Figure 2.7 Representation of cyclotron (small circles) and magnetron (big circles) motions (greatly enhanced for visibility). The magnetron motion follows equipotential lines, and is independent of the m/z ratio of the ion.

20
2.4. Experimental Aspects of Ion-Molecule Reactions
2.4.1 Introduction
Ion-molecule reactions of described in this thesis were studied in an FT-ICR mass
spectrometer by using the distonic ion approach. It is important to introduce the
experimental aspects used to study ion-molecule reactions. The following sections
discuss the distonic ion approach used for studying radical reactions in the gas phase,
experimental sequences and all the events included in the experiment.
2.4.2 Distonic Ion Approach
Studies related to reactive intermediates in solution are scarce due to problems
associated with their generation and high reactivity. FT-ICR mass spectrometer provides
a great gas-phase environment for studying highly reactive molecules by using the
“distonic ion” method (Figure 2.8).22,23,24The “distonic ion” method involves the study of
reactive radicals via their derivatives carrying a chemically inert charged group for
manipulation in the FT-ICR mass spectrometer.25 The radical and ionic sites are usually
located on different atoms in the molecule.

21
Figure 2.8 Distonic ion approach
2.4.3. Experimental Sequence
The most common experiments performed in this dissertation research were ion-
molecule reaction measurements involving radical ions and neutral reagents (section 2.5)
and collision-activated dissociation (CAD) studies on the ion-molecule reaction products.
The experiments in FT-ICR can be described as a set of events occurring in the same
place but spread out in time. This is in contrast to traditional mass spectrometers wherein
all events occur simultaneously and continuously but in different parts of the mass
spectrometer. The advantage of the dual-cell FT-ICR is that it can separate experiments
both in time and in space. The purpose of this section is to explain the main events and
their sequence for the experiments mentioned above.
N
Charges serves as a "handle"for mass spectrometric manipulation
22
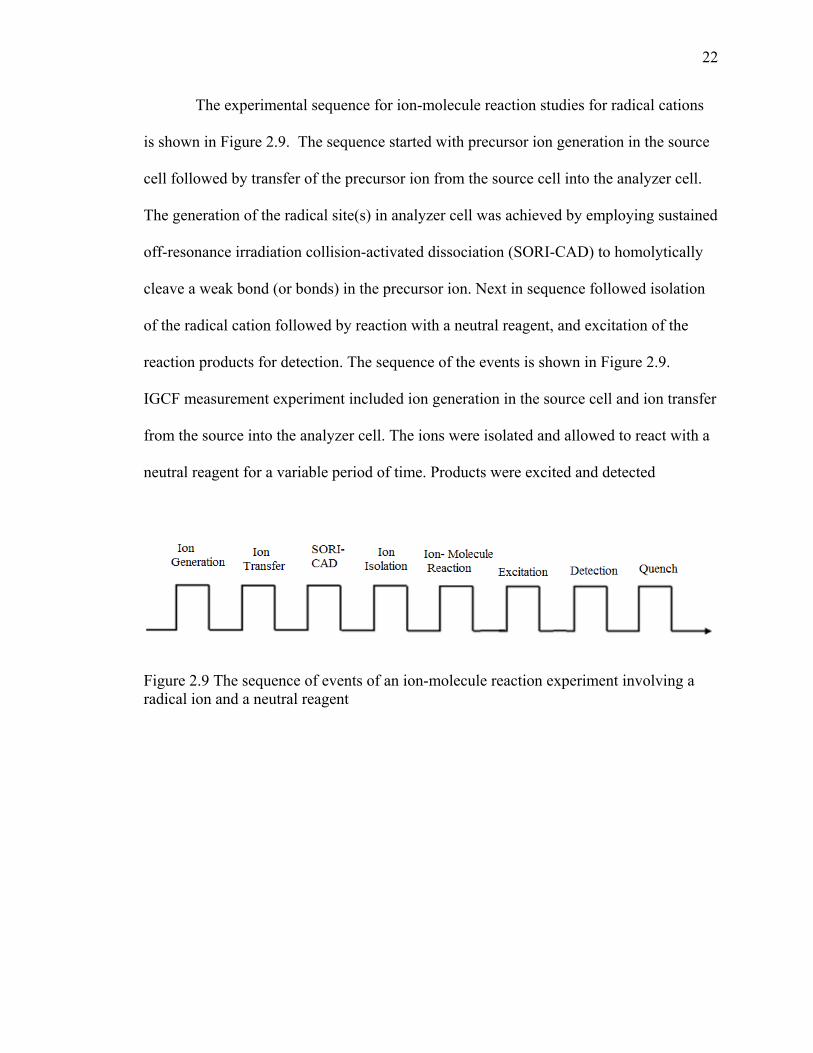
The experimental sequence for ion-molecule reaction studies for radical cations
is shown in Figure 2.9. The sequence started with precursor ion generation in the source
cell followed by transfer of the precursor ion from the source cell into the analyzer cell.
The generation of the radical site(s) in analyzer cell was achieved by employing sustained
off-resonance irradiation collision-activated dissociation (SORI-CAD) to homolytically
cleave a weak bond (or bonds) in the precursor ion. Next in sequence followed isolation
of the radical cation followed by reaction with a neutral reagent, and excitation of the
reaction products for detection. The sequence of the events is shown in Figure 2.9.
IGCF measurement experiment included ion generation in the source cell and ion transfer
from the source into the analyzer cell. The ions were isolated and allowed to react with a
neutral reagent for a variable period of time. Products were excited and detected
Figure 2.9 The sequence of events of an ion-molecule reaction experiment involving a radical ion and a neutral reagent
23
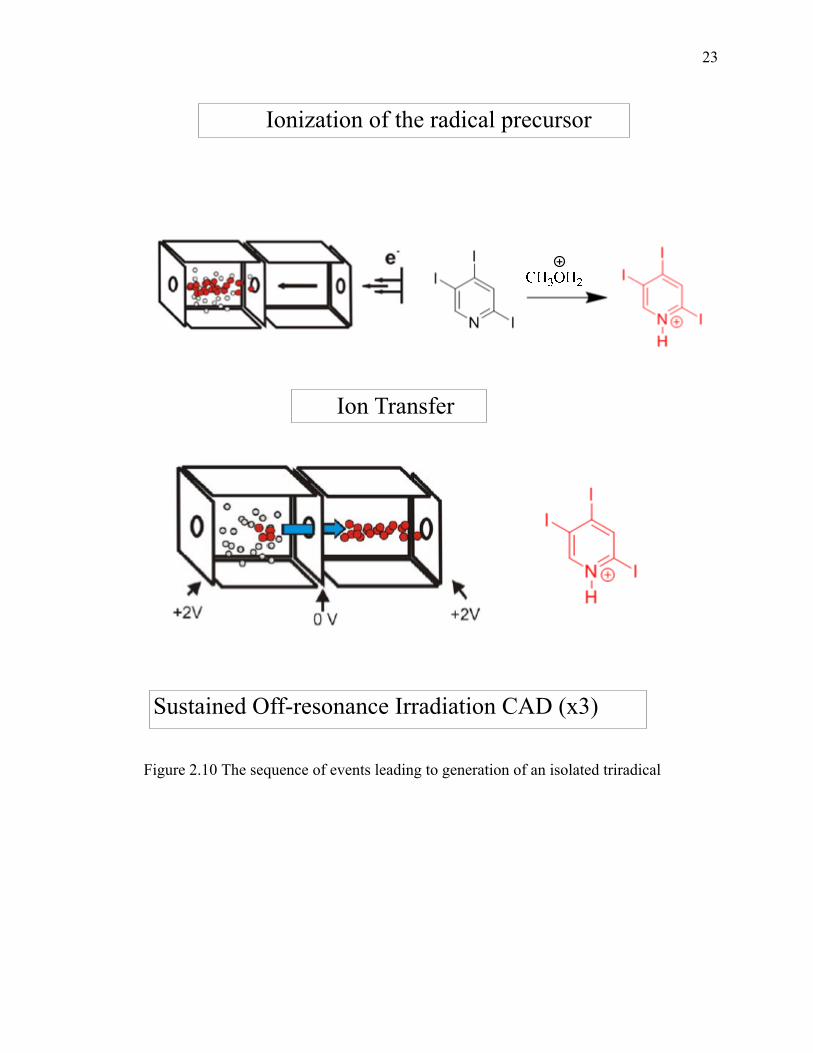
Figure 2.10 The sequence of events leading to generation of an isolated triradical
Ionization of the radical precursor
Ion Transfer
Sustained Off-resonance Irradiation CAD (x3)
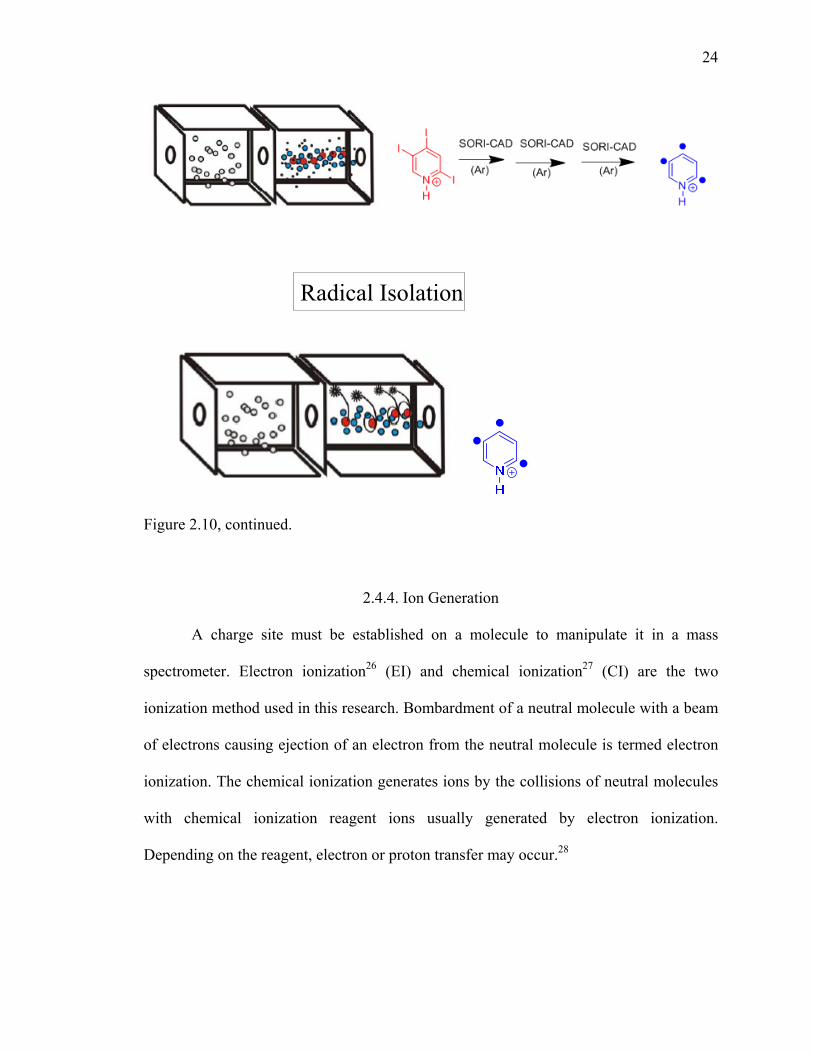
24
Figure 2.10, continued.
2.4.4. Ion Generation
A charge site must be established on a molecule to manipulate it in a mass
spectrometer. Electron ionization26 (EI) and chemical ionization27 (CI) are the two
ionization method used in this research. Bombardment of a neutral molecule with a beam
of electrons causing ejection of an electron from the neutral molecule is termed electron
ionization. The chemical ionization generates ions by the collisions of neutral molecules
with chemical ionization reagent ions usually generated by electron ionization.
Depending on the reagent, electron or proton transfer may occur.28
Radical Isolation

25
Scheme2.1.Representation of EI and CI reaction schemes.
All mono-, bi- and triradicals studied in this research were generated in one side
of the dual-cell from precursors containing iodo- or nitro-substituents. The neutral
precursors were obtained commercially or synthesized using known or novel methods
(see Chapter 3 for details). The neutral radical precursors were introduced into the
instrument at a nominal pressure ranging from 1.0 x 10⁻⁸up to 5.0x 10⁻⁸ torr either via a
Varian variable leak valve29or a heated solids probe. After their introduction into the cell,
a proton, deuteron, or a methyl group was attached to the neutral precursor to ionize it
(chemical ionization, CI). Reaction times for CI varied from 1s upto 25s. Methanol or
acetone (introduced via a batch inlet equipped with an Andonian leak valve) was used as
the reagent for protonation whereas methyl iodide was used for methylation and was
introduced via a pulse valve. Deuteration was accomplished via CI using deuterated
methanol or deuterated acetone introduced via the batch inlet.

26
(a)O Self- CI
OH
N
+CI O
+
N
H
(b)
Self- CI
N
+CI
+
N
H
CH3OH CH3OHCH3OH2
(c)
Self- CI
N
+CI
+
N
CH3
CH3I CH3IH3C--I---CH3
(d)
Self- CI
N
+CI
+
N
D
CH3OD CH3ODCH3OD2
Figure 2.11 Chemical ionization reactions involving a) and b) protonation, c) methylation and d) deuteration.
27
2.4.5. Ion Manipulation
The methods frequently used to manipulate ions in FT-ICRs include ion transfer
from one cell into the other, fast frequency sweep (“chirp”) excitation for detection,30,31
ejection of unwanted ions from the cell via stored-waveform inverse Fourier transform
(SWIFT) excitation,32,33quadrupolar axialization34,35 (QA) to improve the efficiency of
ion transfer from a cell into the other, and sustained off-resonance irradiation collision-
activated dissociation (SORI-CAD) for cleaving bonds.36 Kinetic excitation of ions is
involved in the majority of the ion manipulation techniques. Therefore, before discussing
the ion manipulation techniques in detail, general information about excitation is given
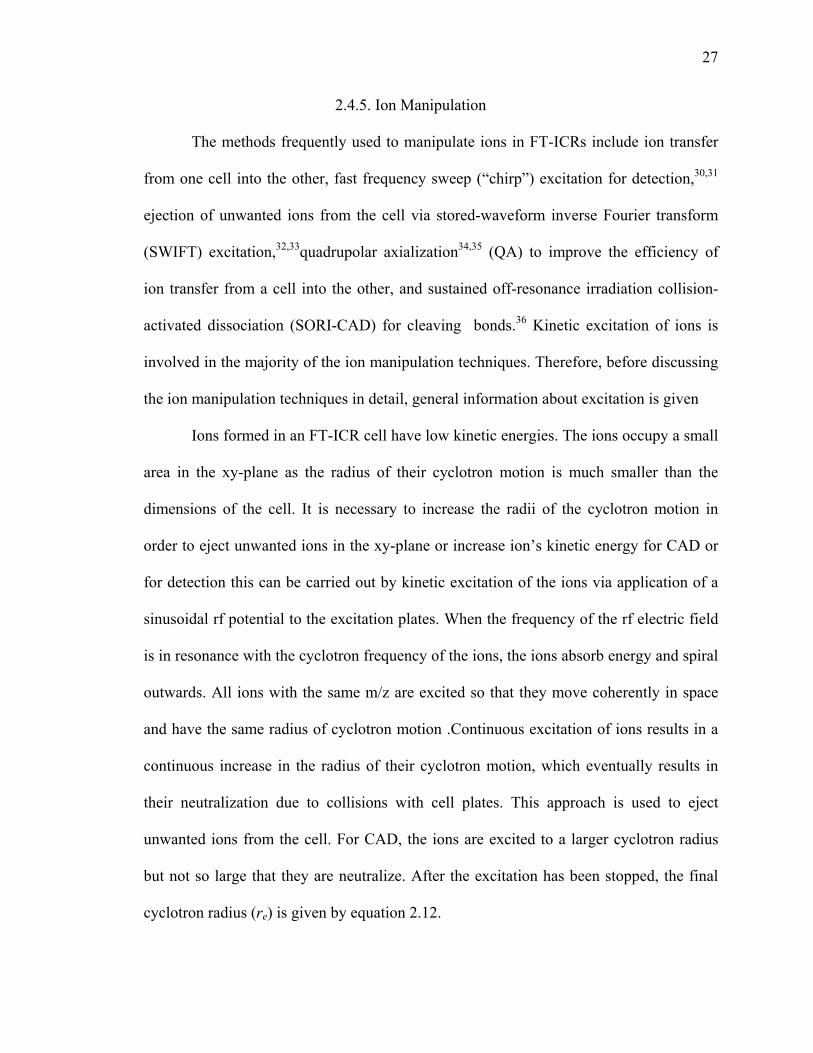
Ions formed in an FT-ICR cell have low kinetic energies. The ions occupy a small
area in the xy-plane as the radius of their cyclotron motion is much smaller than the
dimensions of the cell. It is necessary to increase the radii of the cyclotron motion in
order to eject unwanted ions in the xy-plane or increase ion’s kinetic energy for CAD or
for detection this can be carried out by kinetic excitation of the ions via application of a
sinusoidal rf potential to the excitation plates. When the frequency of the rf electric field
is in resonance with the cyclotron frequency of the ions, the ions absorb energy and spiral
outwards. All ions with the same m/z are excited so that they move coherently in space
and have the same radius of cyclotron motion .Continuous excitation of ions results in a
continuous increase in the radius of their cyclotron motion, which eventually results in
their neutralization due to collisions with cell plates. This approach is used to eject
unwanted ions from the cell. For CAD, the ions are excited to a larger cyclotron radius
but not so large that they are neutralize. After the excitation has been stopped, the final
cyclotron radius (re) is given by equation 2.12.
28
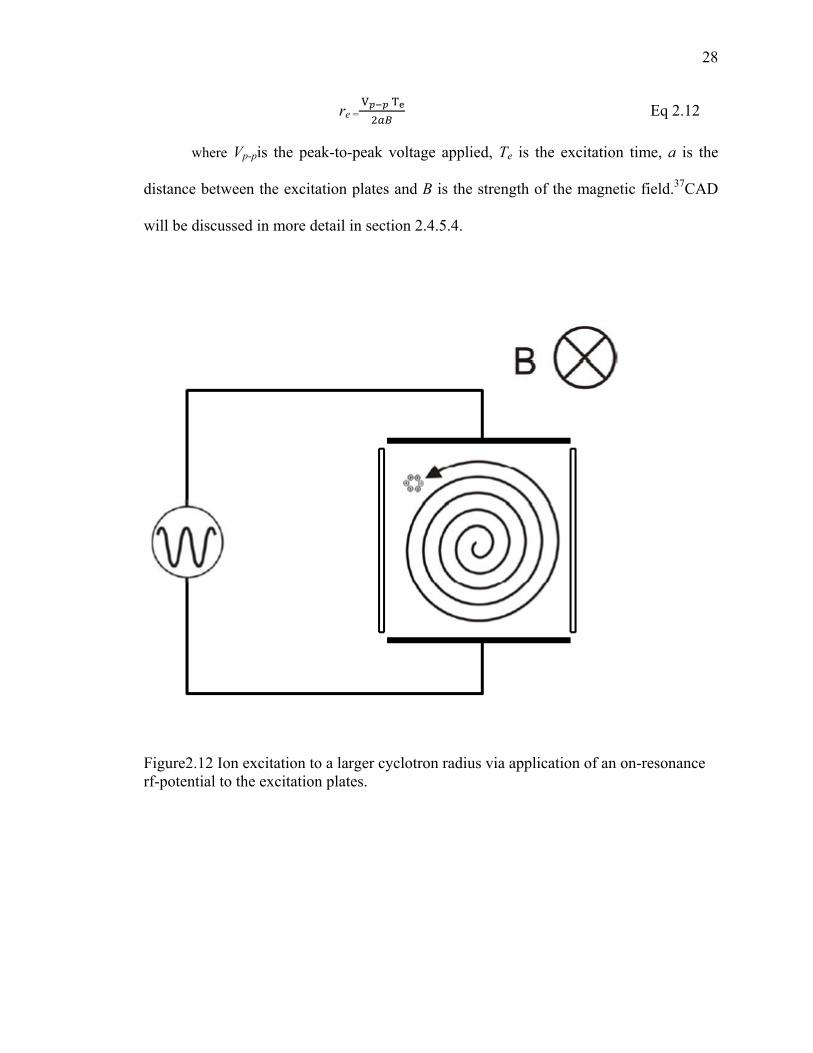
re =
Eq 2.12
where Vp-pis the peak-to-peak voltage applied, Te is the excitation time, a is the
distance between the excitation plates and B is the strength of the magnetic field.37CAD
will be discussed in more detail in section 2.4.5.4.
Figure2.12 Ion excitation to a larger cyclotron radius via application of an on-resonance rf-potential to the excitation plates.

29
2.4.5.1 Ion Transfer
Ion transfer from one cell into another can be achieved by utilizing the trapping
motion and grounding the conductance limit while maintaining a repulsive potential (±
2V) on the terminal trapping plates. Protonated, deuterated or methylated precursors were
transferred by grounding the conductance limit for 100-250 µs. Prior to transfer, the
receiving side of the dual-cell was cleaned by removing all ions by changing the trapping
voltage from +2.0 V to -3.5 V for 15 ms. Transferred ions gain some extra kinetic energy
during the transfer process. This energy was reduced by collisions with the neutral
molecule present in the receiving cell. Excess internal energy of the ions was dissipated
by giving them time (1 s) to undergo IR emission.38
Ion transfer is hindered by large radii of cyclotron or magnetron motion. If the radii are
greater than the radius of the hole in the conductance limit (1 mm), this causes the ions to
collide with the conductance limit plate and get neutralized. Quadrupolar axialization41,42
technique was applied to overcome this problem. This technique is discussed in detail in
section 2.4.5.3.
2.4.5.2 SWIFT Excitation and Frequency-sweep
Formation of the ionized radical precursor was always accompanied by generation
of unwanted ions. After ion transfer into the other cell, some unwanted ions were usually
observed in the other cell. Removal of the unwanted ions was performed by SWIFT
excitation of only the unwanted ions until they hit the cell plates and got neutralized.
Chirp is a fast frequency-sweep typically employed to kinetically excite ions of a
wide mass range for detection or ejection. Chirp is also used to eject unwanted ions in

30
some case; this method is quick, simple and less costly on ion abundance compared to
SWIFT. However, this method suffers from non-uniform ion excitation resulting from the
instability in the magnitude of the rf potential. All the ions are not excited to the same
cyclotron radius. This irregularity may affect signal intensity. Further, it may result in
ejection of the ions of interest instead of unwanted ions. This problem can be avoided by
the usage of SWIFT.
SWIFT excitation does not suffer from the non uniformity observed with chirp
excitation. In SWIFT, an inverse Fourier-transform of a predefined frequency-domain
excitation waveform is applied to produce a time-domain excitation waveform. This
SWIFT excitation can be used to simultaneously detect ions or eject all unwanted ions
with specific cyclotron frequencies from the cell. This method allows for the selective
isolation of an ion with a desired m/z without the problems associated with frequency-
sweep excitation. SWIFT was used for the isolation of charged radicals after generation
while chirp was used for ion detection after the ion-molecule reactions.
2.4.5.3. Quadrupolar Axialization(QA)
Quadrupolar excitation was accomplished by applying an rf-potential of opposite
phases to the detection plates and the excitation plates (Figure 2.15), which generated a
quadrupolar electric field instead of a dipolar electric field. Ions collided with a collision
gas (helium) that was introduced at a high pressure(~ 1 x 10⁻⁵ torr) upon quadrupolar
excitation. The collisions made the ions relax back into the center of the cell as their
motion was collisionally dampened and their cyclotron radii were reduced.

31
Quadrupolar axialization can be employed to overcome inefficient ion transfer from
one cell into the other by converting ions’ magnetron motion into cyclotron motion. The
QA process uses quadrupolar excitation of ions and a collision gas to axialize ions into
the center of the cell. QA converts magnetron motion to cyclotron motion. Since the
radius of the cyclotron motion decreases faster than the radius of the magnetron motion
increases upon collisions, ions can be brought back into the center of the cell for efficient
transfer through the 2-mm hole in the conductance limit.
Figure 2.13. The electrical configuration for quadrupolar excitation (source cell) and dipolar excitation (analyzer cell)

32
Figure 2.14. Simulation of ion trajectories in an ICR cell during quadrupolar axialization.39 Adapted with permission from ref.39 (A) Projection of three-dimensional simultaneous periodic cyclotron, magnetron, and axial motions in the absence of collisional damping and electric excitation. (B) Cyclotron and axial motions dampened quickly while the radius of the magnetron motion grows at a lower rate with the addition of collisions. (C) Quadrupolar excitation interconverts magnetron and cyclotron motions and dampens the cyclotron radius to bring ions back into the center of cell. Copyright 1994 American Chemical Society.
Quadrupolar axialization is mass selective for ions with the cyclotron frequency equal to
the frequency of the applied quadrupolar rf pulse. All other ions undergo radial diffusion
due to collisions with neutral molecules, which increase the radii of their magnetron
motion.

33
2.4.5.4 Collision-activated Dissociation (CAD)
The generation of radical sites in the cations discussed above was achieved by
homolytically cleaving off substituents from the charged precursors. In order to do this,
an rf-pulse was applied to the excitation cell plates to kinetically excite ions of a specific
m/z ratio. Upon collisions with the argon target gas, the excited ion’s kinetic energy was
converted into internal energy, and when sufficient internal energy was accumulated into
the ion, fragmentation followed. The method is known as collision-activated
dissociation40 (CAD).
Kinetic excitation can be achieved by using an rf pulse with a frequency matching
the cyclotron frequency of the ions to be excited (on-resonance CAD). On-resonance
CAD in FT-ICR suffers from several drawbacks, such as signal loss due to ion scattering
caused by the formation of fragment ions away from the center of the cell. This reduces
the efficiency of detection of the fragment ions. Sustained off-resonance irradiation
collision-activated dissociation43,47 (SORI-CAD) allows collision-activated dissociation
without scattering losses. In SORI-CAD, the ion of interest is kinetically excited by
applying a long-duration excitation rf voltage to the excitation plates that is slightly off-
resonance from the cyclotron frequency of the ion of interest, causing the expansion and
a relaxation of the cyclotron orbit of the ion outwards and back into the center of the cell,
respectively. The kinetic energy that the ion gains is less than in the on-resonance process
so the ion remains in the center of the cell. The ion of interest undergoes multiple low-
energy collisions with argon resulting in a slower increase in the ion’s internal energy
than in on-resonance CAD. The ion usually dissociates via the lowest energy pathway
close to the center of the cell. In the studies discussed here, SORI-CAD was utilized to

34
generate the radical sites in ions. The number of SORI-CAD events needed to generate
the radical sites depended on the type of radical ions being generated, being one for
monoradicals, one or two for biradicals, and two or three for triradicals. The charged
precursor ions were subjected to off-resonance rf-excitation for 0.3-0.4 s at a frequency ±
1000 Hz off-resonance of their cyclotron frequency in the presence of argon as a target
gas that was introduced into the cell at a nominal pressure of ~ 1 x 10⁻⁵ torr. The
fragment ions were cooled for a minimum of 1 s via collisions with the neutral reagent
molecules present in that cell to reduce their kinetic energy and via IR emission to reduce
their internal energy before examining their ion/molecule reactions.
2.4.6. Ion Detection
Chirp (fast broadband frequency-sweep excitation) increases ions’ kinetic energy
and the radius of their cyclotron motion, as discussed above. As a result, ions with the
same m/z ratio will undergo cyclotron motion coherently as a packet of ions of different
m/z-ratios pass by the detection plates, they attract or repel electrons in the detection
plates through an external circuit that joins them, inducing a sinusoidal current. This
alternating current is called image current. The image current was converted into voltage,
amplified and digitized. Voltage signal was converted into frequency-domain by Fourier
transformation as it contains many sinusoidal signals of different frequencies and
amplitudes that correspond to the m/z ratios and abundances of the detected ions.
Which is ultimately converted into a mass spectrum by applying calibration formula
derived from equation 2.7. In the studies discussed here, ions of interest were excited for
detection by using chirp excitation with a bandwidth of 2.7 MHz and a sweep rate of

35
3,200 Hz µs-1.The obtained mass spectra were an average of five transients that were
obtained at an acquisition rate of 3333, 5333 or 8000 kHz. The number of data points
recorded ranged from 64 K to128 K.
The transients were subjected to Hanning41 apodization and one zero-fill,
employed to correct the baseline anomalies that result from an abrupt termination of the
time-domain signal. Zero fill involves addition of five zeroes to the transient signal to
increase the number of data points. The purpose of the application of apodization and
zero-fill waste improve the signal-to-noise ratio and enhance the appearance and
resolution the Fourier transformed data obtained.
Figure 2.15 Detection of Ions, an image current is produced on the detection plates, detected and converted to a mass spectrum.

36
2.5 Ion-molecule Reactions
Ion generation and isolation was followed by allowing the ions to undergo reactions
with a reagent for a variable time period in order to determine the reaction efficiency.
Ion gauge correction factor (IGCF) was measured for each reagent. This
measurement followed the sequence of ion generation, ion transfer from source cell into
the analyzer cell, ion isolation in the analyzer cell, and reaction with the neutral reagent
for various intervals of time. The obtained products were then excited and detected.
Ion-molecule reactions between radical ion and a reagent was examined by
transferring the protonated radicalprecursor into the clean analyzer cell where the ions
were cooled as described above, followed by (SORI-CAD) to generate the radical site(s).
The ions thus generated were isolated using (SWIFT) excitation pulses and allowed to
react with the reagents for selected time periods. The product ions were detected as
described above.
A background mass spectrum was also collected by using the same conditions but
by ejecting the radical ion from the cell before reaction. The background spectrum was
subtracted from the actual spectrum in order to eliminate interference from reactions
involving background ions.42 The branching ratios of the product ions and the reaction
efficiencies were determined using previously described literature methods as described
above.

37
2.5.1 Ion-Molecule Reaction Kinetics
As mentioned above, charged radicals were allowed to react with neutral reagents
for a variable time period, typically ranging from 0.005 up to 1000 s, in order to
determine reaction efficiencies The nominal pressure of the neutral reagent was typically
1.3 x 10⁻⁸ Torr, as measured by ionization gauges.
Ion-molecule reactions follow second-order kinetics when they are conducted in a
high-vacuum environment, as described by equation 2.13
Eq. 2.13.
where is the reaction time, ksec is the second-order reaction rate constant, [N] is the
concentration of the neutral reagent, and [I] is the concentration of the charged radical As
the concentration of the neutral reagent remains constant throughout the course of the
reaction, gas-phase ion-molecule reactions follow pseudo-first order kinetics, and
Equation 2.13 can be simplified to Equation 2.14,
Eq. 2.14.
wherein kobs is equal to ksec[N],which is experimentally obtained from the slope of a
semi-logarithmic plot of the relative abundance of the charged radical over time. The
value of the second-order reaction rate constant can be obtained by dividing kobs by the
concentration of the neutral reagent.
Eq. 2.15.

38
The concentration of the neutral reagent [N] was determined by measuring the
pressure of the neutral reagent (P) by an ionization gauge and by applying a conversion
factor 3.239 x 10¹⁶ (1 torr = 3.239 x 10¹⁶ molecules/cm3) to convert the measured
pressure of the neutral reagent into its concentration, as described in equation 2.16.
.
Eq. 2.16.
The sensitivity of the ion gauge towards a specific neutral molecule is affected by the
molecule’s polarizability. A correction factor C1 is needed to account for the different
polarizabilities of the neutral reagents studied in this research, as shown in Eq. 2.17
. .
Eq. 2.17.
where in α is the polarizability of the neutral reagent. Further, the ion gauges were
located about one meter from the cell The distance of the ion gauges from the cell and
their variable sensitivity toward the different neutral reagents studied affect the reading of
the neutral reagent’s pressure. A correction factor C2 is needed to account for the location
of the ion gauges. This correction factor was obtained by measuring the rate of an
exothermic electron transfer reaction between carbon disulfide radical cation and the
neutral reagent of interest, which is assumed to occur at the collision rate. The correction
factor obtained from this experiment is called the ion gauge correction factor. The
second-order reaction rate constant can be obtained by Equation 2.18
.
Eq. 2.18
Reaction efficiency is the fraction of collisions leading to a reaction, which is given by
Equation 2.19 below

39
Reaction Efficiency = x 100 % Eq. 2.19
where kcollision is the theoretical collision rate constant calculated using the parameterized
trajectory theory developed by Su and Chesnavich.43 The accuracy of the rate constant
measurements is estimated to be ±50% while the precision of the measurements is less
than ±10%. For the reactions that do not follow the pseudo-first order kinetics, reaction
rates were modelled using non-linear regression in SigmaPlot.
The branching ratios of the ionic primary products were obtained by dividing the
abundance of each primary product by the sum of the abundances of all primary products.
The primary products were distinguished from secondary products by their constant
relative abundances at short reaction times, and, in some cases, by isolation of the
product ion and examination of its reactivity.
2.5.2 Brauman Double-Well Potential Energy Surface
Brauman proposed the double-well potential energy model (Figure 2.16) in 1977
to explain variations in the rates of gas-phase ionic SN2 reactions.44 The two wells in the
double-well surface represent the reactant complex and the product complex, which are a
result of the ion-dipole and ion-induced dipole interactions between the ion and neutral
molecule. The rate of an ion-molecule reaction is predominantly determined by the
difference in the energy (∆E) between the total energy level of the system (separated
reactants) and the transition state. Even when the transition state energy is lower than the
total energy of the system, an ion-molecule reaction may occur at a lower rate than the
collision rate if dissociation of the reactant complex back to the reactants is entropically

40
more favored than the path leading over transition state because of the tighter
configuration of the transition state that the separated reactants. As the total energy of the
reaction system is conserved in the gas phase, the net reaction must be exothermic
Reactions in solution are strongly influenced by solvation effects (Figure 2.17). For
example, the energetic cost of replacing solvent molecules by reactant molecules lowers
reaction rates. In contrast, gas-phase reactions are free from solvation effects, except for
the formation of the reactant complex that involves solvation of the ionic reactant by the
neutral reactant.
Figure 2.16 Potential energy surfaces for ion-molecule reactions in solution and in the
gas phase

41
Figure 2.17 Brauman’s double-well potential energy surface showing the tightness of the transition state of a gas-phase ion-molecule reaction.
42
2.6 Molecular Orbital Calculations
In order to rationalize the ion-molecule reactions in these studies, chemical
calculations were performed by Dr. John Nash using the Gaussian 03 electronic structure
program suites. The vertical electron affinities of mono-, bi- and triradicals, single-triplet
gaps of biradicals, doublet-quartet gaps of triradicals, triradical stabilization enthalpies
and all potential energy surfaces for rearrangements, dehydrocarbon atom separations
(DAS) of some biradicals, potential energy surfaces and relative energies for transition
states of several biradicals, doublet-quartet gaps of triradicals, and triradical stabilization
energies reported in this thesis were calculated.45
The DAS values for the biradicals studied were calculated at the
UBLYP/ccpVDZ//UBLYP/cc-pVDZ level of theory. The S-T gaps for the biradicals
were calculated at the UBLYP/cc-pVDZ//UBLYP/cc-pVDZ or the RHF-
UCCSD(T)/cc42pVDZ//UBPW91/cc-pVDZ level of theory. The energy needed to reach
the transition state geometry (ΔE) for the biradicals was calculated at the RHF-
RCCSD(T)/ccpVTZ//UB3LYP/cc-pVTZ level of theory. The D-Q gaps for the
tetraradicals were calculated at the RHF-UCCSD(T)/cc-pVDZ//UBPW91/cc-pVDZ level
of theory. The proton affinities for the conjugate bases of the biradicals were calculated at
the RHF-UCCSD(T)/ccpVDZ//UBPW91/cc-pVDZ or the UBLYP/aug-cc-
pVDZ//UBLYP/cc-pVDZ level of theory. Electron affinities for biradicals, triradicals and
tetraradicals were calculated at the UBLYP/aug-cc-pVDZ//UBLYP/cc-pVDZ or the
UBLYP/aug-ccpVDZ//MCSCF(8,8)/cc-pVDZ level of theory. Triradical stabilization
energies were calculated at the BD(T)/cc-pVTZ//BPW91/cc-pVDZ level of theory.

43
2.7 Linear Quadrupole Ion Trap (LQIT) Mass Spectrometry
2.7.1. Introduction
LQIT mass spectrometry has received a great amount of attention recently
because of its versatility and extreme sensitivity. It has a much greater ion trapping
capacity and trapping efficiency than its precedent, the 3-D quadrupole ion trap (QIT).46
The LQIT mass spectrometer used for this dissertation is a Thermo Scientific LTQ with
a Thermo SurveyorTM MS plus HPLC system and also equipped with an atmospheric
pressure ionization (API) source. A Dell Optiplex workstation (Microsoft Windows XP)
running XCalibur 2.0.7 SP1 software was used for instrument control, data acquisition
and data processing. A Thermo Scientific LTQ FT Ultra, a hybrid consisting of a linear
quadrupole ion trap and a 7 Tesla Fourier-transform ion cyclotron resonance mass
spectrometer (LQIT/FT-ICR), was also employed to perform measurements at ultra-high
resolution when necessary.
Figures 2.20 and 2.21 show schematics of a LQIT mass spectrometer. It is divided
into three regions, atmospheric pressure ionization (API) stack, ion optics region, and
mass analyzer region, which houses the linear quadrupole ion trap. Each region had a
different operating pressure. The vacuum chamber containing the ion trap was maintained
at 0.5-1.0 x 10⁻⁵ Torr by the means of a Leybold TW220/150/15Striple-inlet turbo
molecular pump. The various inlets of the turbo pump serve to evacuate the initial and
intermediate vacuum chambers prior to the ion trap region down to 50 mTorr and
1mTorr, respectively. The pressure of API stack is ~ 1 Torr, as maintained by two
Edwards E2M30 rotary-vane mechanical pumps (650 L/min)The LQIT uses a set of four

44
quadrupole rods to confine ions radially and a static electrical potential applied to the end
parts of the quadrupole rods to confine the ions axially.47 The hyperbolic rods have been
cut into three segments of 12, 37, and 12 mm in length. The fundamental aspects of ion
generation, trapping, activation, ejection, isolation, and detection are discussed in detail
in the sections below.
Figure 2.18 Schematic of LQIT mass spectrometer with operational pressure for each region of the instrument indicated

45
Figure 2.19 Components of the API stack, ion optics, and mass analyzer
2.7.2 Ion Generation
In the LQIT used in this research, ions were generated in the API source via
atmospheric chemical ionization (APCI) or electrospray ionization (ESI). The ions then
entered the API stack, which is the interface between the ion source and the mass
analyzer. It consists of an ion transfer capillary, sweep cone, tube lens, and a skimmer
(Figure 2.21).48 The ions were drawn into themass spectrometer via a heated transfer
capillary. Ions are injected into the API stack due to the negative pressure gradient as
well as the change in the voltage between API stack (± 0-20V) and ion source (kV).
In these studies, APCI was used to ionize the analytes. The analyte solutions were
introduced into the APCI source by either direct injection using a syringe or T-infusion
with an HPLC system. APCI is a soft ionization that involves gas-phase ion-molecule
reactions for ionization of analyte molecules at atmospheric pressure (Figure 2.22). The
experiment involves passing a methanol/water solution containing the analyte through a
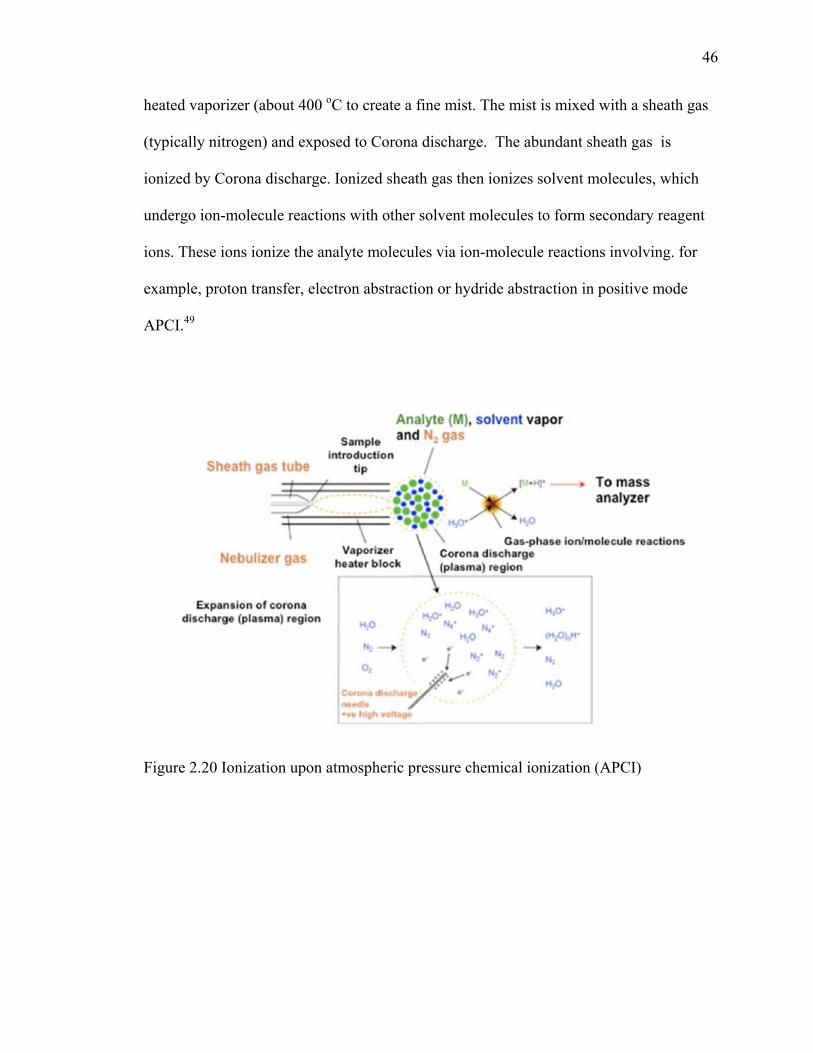
46
heated vaporizer (about 400 oC to create a fine mist. The mist is mixed with a sheath gas
(typically nitrogen) and exposed to Corona discharge. The abundant sheath gas is
ionized by Corona discharge. Ionized sheath gas then ionizes solvent molecules, which
undergo ion-molecule reactions with other solvent molecules to form secondary reagent
ions. These ions ionize the analyte molecules via ion-molecule reactions involving. for
example, proton transfer, electron abstraction or hydride abstraction in positive mode
APCI.49
Figure 2.20 Ionization upon atmospheric pressure chemical ionization (APCI)

47
2.7.3 Ion Transfer From Ion Source Into Trap
Ions were directed into the ion trap of LQIT by a series of ion optics. The ions
were injected into the atmospheric pressure ion source (API) region transported into the
skimmer cone by a negative pressure gradient as well as large drop in the voltage in the
front of the API stack (± 0-20 V) and the ion source (kV) (Figure 2.21). Ions were
focussed into the skimmer by application of a potential (typically 0 to ± 10 V; positive
for positive ions and negative for negative ions) to the tube lens. Multipoles Q00 and Q0
are two square quadropole assemblies which act as ion guides after the skimmer.
Figure 2.21 dc Offset voltages applied to the ion source, the API stack and the ion optics to aid in ion transmission in the axial direction. Illustration of the dc voltage gradient of the ion optics and the voltage applied to the gate lens (-72 V) that is used to accelerate ions into the ion trap

48
Multipole Q1 is a cylindrical octopole ion guide that focuses and transfers the ion
beam from multipole Q0 into the ion traps (Figure 2.21).
2.7.4 Ion Trapping
In LQIT, the ions are trapped by using rf and dc voltages applied to the
quadrupole rods of the ion trap. In radial direction (x-y plane), ions are trapped by a
quadrupolar rf field with a fixed frequency (1.2 MHz) and variable amplitude (0 to
10000 V) applied to the four hyperbolic rods consisting of the 2D ion trap. In axial
direction (z-direction), ions are trapped by applying a repulsive dc potential to the front
and the back sections of the 2D trap. A dc voltage of +20 V was applied to the front and
back sections of the trap and -14 V was applied to the center section of the trap in order
to axially trap positive ions.Polarity was reversed for trapping negative ions.

49
Figure 2.22 Quadrupoles that have the same rf voltage applied to opposite poles but 180oout-of-phase voltage applied between neighboring poles.

50
2.7.4.1 Radial Ion Motion
Ions’ radial motion (x-y plane) in the LQIT is confined by an rf-field that is
produced by applying rf-voltages to the four rods of the ion trap.50,51 Potentials (Φ0) are
produced when both dc and rf potentials are applied to the paired hyperbolic rods. The
dc voltage (with amplitude U) and rf voltage (having a peak-to-peak amplitude V), with
angular frequency ω, are applied to the rods.This can be represented by equation 2.20.
= ±(U-V cos ωt) Eq. 2.20
The potential in the x-y plane, , can be written as
=
Eq. 2.21
where r0 is the radius of the circle inscribed within the quadrupole rods. Therefore, ions
with mass m and charge z are subjected to the following forces F in the x and y plane:
= m Eq. 2.22
= m Eq. 2.23
where e is the elementary charge (1.6023 x 10⁻¹⁹ Coulombs). Rearrangement of equations
2.21-2.23 generate the following equations of ion motion in the x-y plane in the LQIT.

51
0 Eq. 2.24
0 Eq. 2.25
If the values of x and y are smaller than r0, ions will have a stable motion in the ion trap.
The equations 2.24 and 2.25 are similar to the general form of the Mathieu equation
(Equation 2.25):
2 2 0
Eq. 2.26
where a and q are referred to as the Mathieu stability parameters. Equations 2.27 and 2.28
are obtained by rearranging equations 2.23, 2.24 and 2.26
a = = - = Eq. 2.27
= = Eq. 2.28
Ions have stable trajectories when the values of aand qfall within an overlap region of
the Mathieu stability diagram Figure 2.25. In order to trap ions with a broad m/z range,
LQIT is usually operated at ax = 0 so that ions of many different m/z values are trapped
simultaneously. With ax = 0, larger ions have lower while the smaller ions have
higher values at a given rf potential, by increasing the rf amplitude V, the q values
increase. When q reaches 0.908, ions are ejected from the trap as their trajectories in the

52
x-y plane become unstable. Low-mass ions will be ejected first from the trap as the q
value is inversely proportional to the m/z value of the ion.
At a given rf potential, each ion has a specific secular frequency that can be
described as
Eq. 2.29
where ω is the angular frequency of the applied rf field and β is the Dehmelt
approximation for a q value less than 0.4. The value of β can be approximated as
Eq. 2.30
The maximum value of β is 1 (stable ions have a β value between 0 and 1).52,53 The
maximum secular frequency of an ion is one half of the angular frequency of the
rf potential applied to the rods. The secular frequency of an ion’s oscillation is
proportional to its q value. Therefore, since small ions have greater q values, they
oscillate at a higher frequency than large ions.
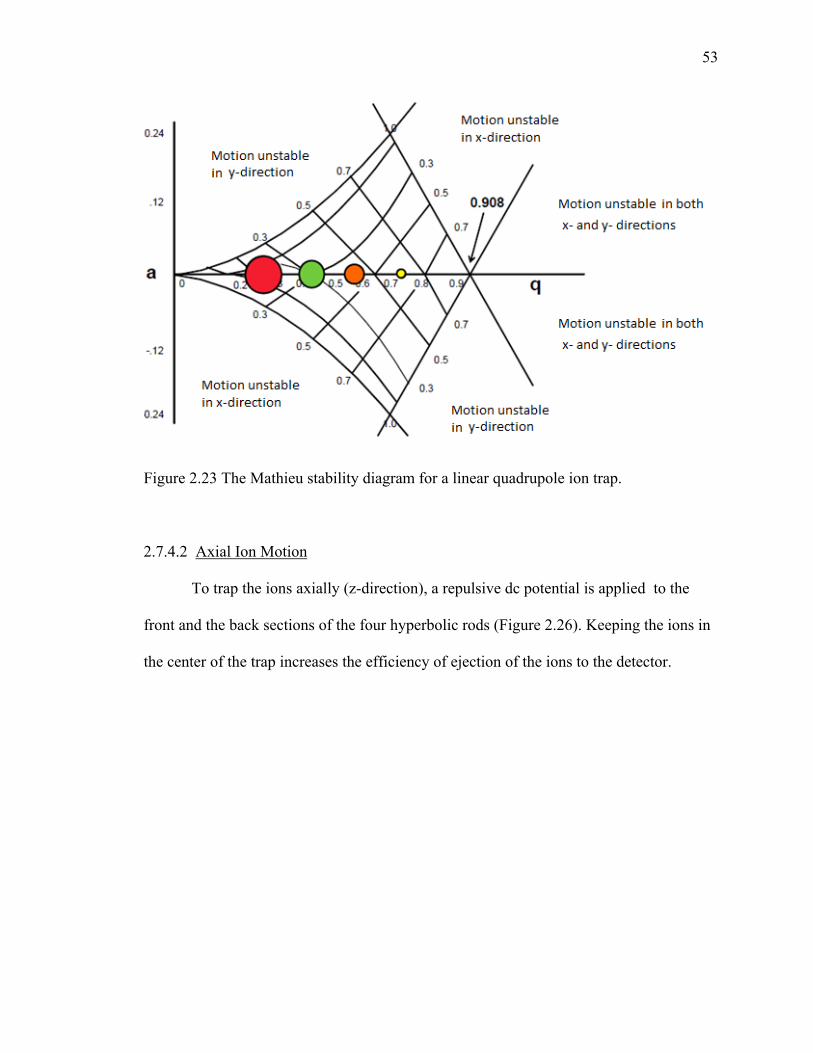
53
Figure 2.23 The Mathieu stability diagram for a linear quadrupole ion trap.
2.7.4.2 Axial Ion Motion
To trap the ions axially (z-direction), a repulsive dc potential is applied to the
front and the back sections of the four hyperbolic rods (Figure 2.26). Keeping the ions in
the center of the trap increases the efficiency of ejection of the ions to the detector.

54
Figure 2.24 Trapping of ions along the z-axis.
2.7.4.3 Helium Buffer Gas
The usage of helium as a buffer gas was important for trapping ions in the ion
trap. Ions gain a significant amount of kinetic energy during their transfer from the API
source into the ion trap. The use of helium as a buffer gas helped cool the ions via a
series of low-energy collisions as they entered the trap.54This improved both the
resolution and the sensitivity, as shown in Figure 2.27.

55
Figure 2.25 Use of helium as a buffer gas. Frictional collisions with helium concentrate the transferred ions into the center of the cell so that they can be trapped and detected more efficiently.55
2.7.5 Ion Ejection and Detection
LQIT requires mass-selective ejection of ions to the detective system. Ions can be
ejected from the trap by increasing the rf amplitude so that their q value increases up to
0.908 at which point the ions‘ trajectories become unstable and the ions are ejected from
the trap. This technique of ejecting ions out of the trap is called the “ mass selective
instability scan” or “q-scanning”.9 However, in order to achieve more efficent ejection of
ions, reduced space charge effects, and improved resolution, LQIT utilizes a method
known as “ resonance ejection” at a lower q value of 0.880was utilized, Resonant
ejection was performed via dipolar excitations of ions by the application of a small
supplemental rf to the x-rods of LQIT. The ions are ejected through slits in the x-rods
when the secular frequency of the ions is resonant with the frequency of the
supplemental rf potential.. The amplitude of the ions’ oscillations increases once they are

56
In resonance with the frequency of the supplementary rf potential and the ions
are quickly ejected out of the trap at q = 0.880. Resonant ejection allows ions to be
ejected as a tight ion packet, which improves mass resolution and minimizes ion
scaterring.10,56
Figure 2.26 Ions’ ejection with q-scanning vs resonant ejection
As the ions are ejected from the ion trap through the slits in the two x-rods, they
are directed towards the detection systems. The two detection systems consist of a
conversion dynode and an electron multiplier (Figure 2.29). A potential (± 15 kV) is
applied on the conversion dynodes to attract the positive or the negative ions as they are
ejected from the trap. Ejected ions hit the surface of the dynode and cause the ejection
of one or more electrons. The electrons are focussed by the curved surface of the dynode
and are accelerated towards an electron multiplier.The ion strikes the surface of a
conversion dynode and hit the surface of the dynode and cause the ejection of one or

57
more electrons. This happens multiple times inside the electron multiplier to create a
cascading effect producing a large measureable current which is proportional to the
number of ions ejected from the trap or the number of ions striking the curved surface of
the conversion dynode.

58
Figure 2.27 The ion detection system has two parts: 1) conversion dynode and 2) electron multiplier. Ions ejected through the X-rods are attracted to the conversion dynode and collide with its surface to make secondary particles that travel to the electron multiplier to eject many electrons that the initially produced electrical current is amplified

59
2.7.6 Ion Isolation and Activation
Ion isolation in the LQIT for tandem mass spectrometry experiments was
performed by ejecting all unwanted ions via dipolar (resonance) excitation. by the
application of an rf voltage to the x-rods for a short period of time (typically 30 ms)
covering frequencies between 5-500 kHz except for the frequency of the ion of interest.
The main rf amplitude was first ramped to place the ion of interest at a q value of 0.830
in order to efficiently eject the unwanted ions. In the LQIT, unit resolution could be
obtained up to approximately m/z 1500. For tandem mass spectrometric experiments
(MS/MS), the q value was usually set to 0.2
Figure 2.28 Graphical representation of the multi-frequency tailored waveform of variable amplitude for isolation of an ion.

60
2.7.6.1 CAD in the Ion Trap
Isolated ions can be subjected to collision- activated dissociation (CAD) in LQIT.
In LQIT, CAD is a slow heating method, which allows ions to undergo multiple low-
energy collision over a relatively long activation time. It was carried out by bringing the
ion of interest at a q value57 of 0.250 and then subjecting it to dipolar excitation. A
supplemental rf potential (~1V) at a secular frequency of the isolated ion was applied to
the x-rods for approximately 10 - 100 ms. During this time period, the isolated ions
undergo multiple collisions with helium, which convert the ions’ kinetic energy into
internal energy. The activated ions undergo unimolecular dissociation to form fragment
ions.

61
2.8 References 1Lawrence, E. O.; Livingston, M. S. Phys. Rev. 1932, 40, 19. 2Sommer, H.; Thomas, H.A.; Hipple, J.A. Phys. Rev. 1951, 82, 697. 3Comisarow, M.B.; Marshall, A.G. Chem. J. Mass Spectrom. 1996, 31, 588. 4Marshall, A. G.; Comisarow, M. B.;Parisod, G. J. Chem. Phys. 1979, 71, 4434. 5Beauchamp, J. L. Ann. Rev. Phys. Chem. 1971, 22, 527. 6Anders, L. R.; Beauchamp, J. L.; Dunbar, R. C.; Baldeschwieler, J. D.J. Chem. Phys. 1966, 45, 1062. 7Marshall, A.G.; Wang, T.C.L.; Ricca, T.L. J. Am. Chem. Soc. 1985, 107, 7893.
8Nelson, E. D.; Artau, A.; Price, J. M.; Tichy, S. E.; Jing, L. H.; Kenttämaa, H. I. J. Phys. Chem. A 2001, 105, 10155. 9Anders, L. R.; Beauchamp, J. L.; Dunbar, R. C.; Baldeschwieler, J. D.J. Chem. Phys.
1966, 45, 1062.
10Beauchamp, J. L. Annu. Rev. Phys. Chem.1971, 22, 527
11Ernst, R. R.; Anderson, W. A. Rev. Sci. Instrum. 1966, 37, 93. 12Comisarow, M. B.; Marshall, A. G. J. Mass Spectrom. 1996, 31, 581. 13Dunn, W. G.; Hooper, J. B. Anal. Lett. 1973, 6, 1. 14Carlin, T. J.; Freiser, B. S. Anal. Chem. 1983, 55, 571. 15Comisarow, M. B.; Marshall, A. G. Chem. Phys. Lett. 1974, 25, 282. 16Marshall, A. G.; Hendrickson, C. L.; Jackson, G. S. Mass. Spectrom. Rev. 1998, 17, 1. 17Amster,I. J. J. Mass Spectrom. 1996, 31, 1325.
18Hofstadler, S. A.; Laude, Jr., D. A. J. Am. Soc. Mass Spectrom. 1990, 1, 351. 19Honovich, J. P.; Markey, S. P. Int. J. Mass Spectrom. Ion Processes 1990, 101, 21.

62
20Marshall, A. G.; Hendrickson, C. L.; Jackson, G. S. Mass Spectrom. Rev. 1998, 17, 1. 21Cooper, H. J. In Practical Aspects of Trapped Ion Mass Spectrometry; March, R. E., Todd, J. F. J., Eds.; CRC Press: Boca Raton, 2010, p 122. 22Yates, B. F.; Bouma, W. J.; Radom, L. J. Am. Chem. Soc. 1984,106,5805. 23Yates, B. F.; Bouma, W. J.; Radom, L. Tetrahedron 1986, 42, 6225. 24Stirk K. M.; Kiminkinen, L. K. M., Kenttämaa, H. I. Chem. Rev. 1992, 92,1649. 25a) Chyall, L. J.; Kenttämaa, H. I. J. Am. Chem. Soc. 1994, 116, 3135; b) Smith, R. L.; Kenttämaa, H. I. J. Am. Chem. Soc. 1995, 117, 1393; c) Thoen, K. K.; Smith, R. L.; Nousiainen, J. J.; Nelson, E. D.; Kenttämaa, H. I. J. Am. Chem. Soc. 1996, 118, 8669; d) Thoen, K. K.; Kenttämaa, H. I. J. Am. Chem. Soc. 1997, 119, 3832; e) Thoen, K. K.; Kenttämaa, H. I. J. Am. Chem. Soc. 1999, 121, 800; f) Heidbrink, J. L.; Ramirez-Arizmendi, L. E.; Theon, K. K.; Guler, L. P.; Kenttämaa, H. I. J. Phys. Chem. A 2001, 105, 7875; g) Ramirez-Arizmendi, L. E.; Guler, L. P.; Ferra, J. J. Jr.; Thoen, K. K.; Kenttämaa, H. I. Int. J. Mass Spectrom. 2001, 210/211, 511; h) Ramirez-Arizmendi, L. E.; Heidbrink, J. L.; Guler, L. P.; Kenttämaa, H. I. J. Am. Chem. Soc. 2003, 125, 2272; i) Huang, Y.; Kenttämaa, H. I. J. Am. Chem. Soc. 2003, 125, 9878; j) Petucci, C.; Nyman, M.; Guler, L.; Kenttämaa, H. I. J. Am. Chem. Soc. 2002, 124, 4108; k) Nelson, E. D.; Artau, A.; Price, J. M.; Kenttämaa, H. I. J. Am. Chem. Soc. 2000, 122, 8781; l) Nelson, E. D.; Artau, A.; Price, J. M.; Tichy, S. E.; Jing, L.; Kenttämaa, H. I. J. Phys. Chem. A 2001, 105, 10155; m) Price, J. M.; Nizzi, K. R.; Campbell, J. L.; Kenttämaa, H. I. J. Am. Chem. Soc. 2003, 125, 131 26Dempster, A. J. Phys. Rev.1918, 11, 316
63
28Harrison, A. G. Chemical Ionization Mass Spectrometry; CRC Press: BocaRaton, 1992 29Dunn, W. G.; Hooper, J. B. Anal. Lett. 1973, 6, 1. 30Comisarow, M. B.; Marshall, A. G. Chem. Phys. Lett. 1974, 25, 489. 31a) Marshall, A. G.; Roe, D. C. J. Chem. Phys. 1980, 73, 1581; b) Wang, M.; Marshall, A. G. Int. J. Mass Spectrom. Ion Processes 1990, 100, 323. 32a)Marshall, A. G.; Wang, T. C. L.; Ricca, T. L. J. Am. Chem. Soc. 1985, 107, 7893. 33a) Chen, L.; Wang, T.-C. L.; Ricca, T. L.; Marshall, A. G. Anal. Chem. 1987, 59, 449; b) Marshall, A. G.; Wang, T.-C. L.; Chen, L.; Ricca, T. L. Am. Chem. Soc. Symp. Ser. 1987, 359, 21; c) Marshall, A. G.; Ricca, T. L.; Wang, T.-C. L. US Patent No. 4,761,5454, 1988; d) Guan, S. J. Chem. Phys. 1989, 91, 775.; e) Hearn, B. A.; Watson, C. H.; Baykut, G.; Eyler, J. R. Int. J. Mass Spectrom. Ion Processes 1990, 95, 299; f) Grosshans, P. B.; Marshall, A. G. Anal. Chem. 1991, 63, 2057; g) Guan, S.; Marshall, A. G. Int. J. Mass Spectrom. 1996, 157/158, 5. 34Guan, S.; Kim, H. S.; Marshall, A. G.; Wahl, M. C.; Wood, T. D.; Xiang, X. Chem. Rev. 1994, 94, 2161. 35a) Schweikhard, L.; Guan, S.; Marshall, A. G. Int. J. Mass Spectrom. Ion Processes 1992, 120, 71; b) Guan, S.; Xiang, X.; Marshall, A. G. Int. J. Mass Spectrom. Ion Process 1993, 124, 53; c) Guan, S.; Marshall, A. G. J. Chem. Phys. 1993, 98, 4486; d) Speir, J. P.; Gorman, G. S.; Pitsenberger, C. C.; Turner, C. A.; Wang, P. P.; Amster, I. J. Anal. Chem. 1993, 65, 1746; e) Chen, R.; Guan, S.; Marshall, A. G. J. Chem. Phys. 1994, 100, 2258; f) Guan, S.; Wahl, M. C.; Marshall, A. G. J. Chem. Phys. 1994, 100, 6137; g) Xiang, X.; Guan, S.; Marshall, A. G. J. Am. Soc. Mass Spectrom. 1994, 5, 238. h) Guan, S.; Marshall, A. G. Rapid Commun. Mass Spectrom. 1993, 7, 857. 36Gauthier, J. W.; Trautman, T. R.; Jacobson, D. B. Anal. Chim. Acta 1991, 246, 211.

64
37Marshall, A. G.; Verdun, F. R. Fourier Transforms in NMR, Optical, and Mass Spectrometry; Elsevier: New York, 1990. 38Dunbar, R. C. J. Chem. Phys. 1989, 90, 7369. 39Gorshkov, M. V.; Masselon, C. D.; Anderson, G. A.; Udseth, H. R.; Harkewicz, R.; Smith, R. D. J. Am. Soc. Mass Spectrom. 2001, 12, 1169. 40Cody, R. B.; Burnier, R. C.; Freiser, B. S. Anal. Chem. 1982, 54, 96. 41Goodner, K. L.; Milgram, K. E.; Williams, K. R.; Watson, C. H.; Eyler, J. R. J. Am. Soc. Mass Spectrom. 1998, 9, 1204 42Smith, R. L.; Kenttämaa, H. I.; J. Am. Chem. Soc.1995, 117, 1393-1396 43Su, T.; Chesnavich, W. J. J. Chem. Phys. 1982, 76, 5183. 44Olmstead, W. N.; Brauman, J. I. J. Am. Chem. Soc. 1977, 99, 4219. 45Nash, J. J.; Kenttämaa, H. I.; Cramer, C. J. J. Phys. Chem. A 2008, 112, 5542 46March, R. R. Quadrupole ion trap mass spectrometry; John & Wiley, 2005. 47Douglas, D. J., Frank, A. J., Mao, D. Mass Spectrom.Rev.2005,24, 1–29. 48Schwartz, J. C.; Senko, M. W.; Syka, J. E. P.J. Am. Soc. Mass Spectrom. 2002,13, 659. 49Herrera, L. C.; Grossert, J. S.; Ramaley, L. J. Am. Soc. Mass Spectrom. 2008, 19, 1926. 50March, R. E. Int. J. Mass Spectrom. Ion Processes 1992, 118/119, 71. 51(a)March, R. E. J. Mass Spectrom. 1997, 32, 351-369;(b)March, R. E. Mass Spectrom. Rev. 2009, 28, 961. 52 March, R. E. Quadrupole Ion Trap Mass Spectrometry; Wiley: Hoboken, N.J., 2005. 53Schwartz, J. C.; Senko, M. W.; Syka, J. E. P. J. Am. Soc. Mass Spectrom. 2002,13, 659.

65
54 Stafford Jr., G. C.; Kelley, P. E.; Syka, J. E. P.; Reynolds, W. E.; Todd, J. F. J. Int. J. Mass Spectrom. Ion Processes 1984, 60, 85. 55 Jinshan Gao, A. PhD. Dissertation, Purdue University, 2012. 56 Schwartz, J. C.; Syka, J. E. P.; Jardine, I. J. Am. Soc. Mass. Spectrom. 1991, 2, 198. 57 Louris, J. N.; Cooks, R. G.; Syka, J. E. P.; Kelley, P. E.; Stafford, G. C.; Todd, J.F. Anal. Chem.1987, 59, 1677.

66
CHAPTER 3: SYNTHESIS OF RADICAL PRECURSORS AND ASPHALTENE MODEL COMPOUNDS
3.1 Introduction
The successful generation of reactive intermediates in the gas phase depends on
the correct choice of their precursors. For example, the precursors chosen for aromatic
mono-, bi- and triradical studies have to fulfill at least two major requirements. As mass
spectrometry deals with ions, the precursors have to have a functional group which
allows their ionization via electron ionization or chemical ionization. The radical
precursors described in this thesis were generated from pyridine derivatives; thus, the
functional group that allows ionization in the basic nitrogen atom. Second, to generate
radical site(s) in the precursor molecules, they have to have atoms or groups that are
weakly bound to the carbon atoms of the phenyl ring. The chosen precursors were
substituted with iodine atoms and nitro groups, which are easily cleaved in FT-ICR mass
spectrometers by using sustained off-resonance irradiation collision-activated
dissociation (SORI-CAD).
The asphaltene fraction of crude oil contains the largest and most aromatic
molecules of petroleum and is commonly used as tar-mats on roads. Asphaltenes’
negative impact on pollution (due to their high sulfur content), fouling of catalysts,
formation of deposits during production and processing of crude oil, corrosion, and
formation of emulsions make asphaltenes problematic for the refining industry and

67
society at large.1Analysis of volatile pyrolysis products of asphaltenes has suggested that
a considerable fraction of the aromatic cores are made up of small aromatic systems (1-5
fused benzene rings) while the lengths of the aliphatic chains attached to the aromatic
cores range in size from 30 up to 40 carbon atoms.2 In order to test this proposal, I have
synthesized asphaltenes’ model compounds containing alkyl side chains of varying
lengths attached to aromatic cores with varying sizes.
The substituted pyridines and asphaltene model compounds that were synthesized
are shown in Figure 3.1. Experimental conditions of these synthetic reactions were not
carefully optimized to produce the maximum yield as the goal was just to get enough of
the pure desired product for its identification and mass spectrometry experiments, which
only requires a very small amounts of sample.

68
Figure 3.1. Synthesized radical precursors and asphaltene model compounds
Synthesis of 2,3,5-triiodopyridine (1) was accomplished via Sandmayer’s
reaction on 14by modifying a Parker and Read procedure3 (Scheme 3.1).

69
Scheme 3.1
2,3,6-Triiodopyridine was prepared using iodination of 3-aminopyridine 15via a
method described by Charrier et al.4 to generate 16 (Scheme 3.2). The modified
Sandmayer’s reaction of 16 yielded 2,3as confirmed by mass spectrometry, 1H NMR
Scheme 3.2
2,4,5-Triiodopyridine (3) was made in three steps. The first step was the
iodination of 17 by using a method described by Charrier et al. (Scheme 3.3),2which
resulted in the formation of three different products, 18, 19 and 20. 18was isolated
Scheme 3.3

70
using flash chromatography. The compound was characterized by1H NMR and mass
spectrometry. 18 was subjected to a modified Sandmayer’s reaction in order to convert
the amino group to an iodo group3 (Scheme 3.4) to yield 21. 21 was converted to 3 by
halogen exchange of the chlorine atom to iodine atom by using a procedure described by
Bissember etal. by using a microwave reactor3(Scheme 3.5). The formation of 3 was
confirmed by mass spectrometry and 1H NMR.
Scheme 3.4
Scheme 3.5
Synthesis of 4 was carried out by the halogen exchange reaction described by
Bissember etal.5(Scheme 3.6).

71
Scheme 3.6
Compounds5 and 7 were synthesized by iodination of 23 via a method described
by Charrier et al.4 (Scheme 3.7).
Scheme 3.7
6 was synthesized using a procedure reported by Le Bas, Marie-Delphine et
al.6(Scheme 3.8). Ozone was supplied by an ozonator. After reaction, the product
mixture was brought up to room temperature and heated at 50oC for 30 min, followed
by acidification with 37% HCl to pH 1. 6 was recrystallized with water.
N
NH2
Cl
23
2.8 eq, I2, 2.8eq AgSO4
1h, RTN
NH2
Cl
7
I
N
NH2
Cl
5
I
Cl ClCl
I
+

72
Scheme 3.8
Scheme 3.9

73
Compounds 10, 11, 12, 13, 14,and 15 were synthesized with a procedure
reported by Bullock etal.7 as shown in Scheme 3.9. Compound 12was synthesized by
using 28 and 1-hexyne as the starting material whereas 13 was synthesized by using 28
and 1-dodecyne as the starting material. Compounds 14 and 15 were synthesized using
29 and 1-hexyne and 29 and 1-dodecyne, respectively, as the starting material.
Figure 3.2 Precursors for 12, 13, 14, and 15
3.2 Synthetic Procedures
The synthesis of each compound is described in detail below. All reactions were
performed under an argon atmosphere if needed. Solvent was purified and/or predried if
needed. All reagents were used as received. Commercially available chemicals were
purchased from either Sigma-Aldrich Chemical Company (Milwaukee, WI), Alfa Aesar
(Ward Hill, MA), or Acros Organics (Pittsburgh, PA). Analytical thin-layer
chromatography (TLC) was used to monitor the reactions. Visualization was
accomplished with UV light (254 nm). 1H NMR spectra were acquired on either Varian
Inova (at 300 MHz) or a Bruker ARX (at 400 MHz) and chemical shifts are reported
relative to the residual solvent peak. 13C NMR spectra were acquired on a Varian Inova
(at 75 MHz) or a Bruker ARX (at 100 MHz) and chemical shifts are reported in ppm

74
relative to the residual solvent peak. In reporting spectral data the format (δ) chemical
shift (multiplicity, J values in Hz, integration) was used with the following abbreviations:
s = singlet, d = doublet, t = triplet, q = quartet, m = multiplet. Infrared spectra were
recorded on a Perkin-Elmer Model 2000 FTIR using KBr plates (thin film).Peaks are
reported in wavenumbers (cm–1). The m/z values of the peaks observed in the high
resolution mass spectra were acquired on a Thermo Scientific 7 Tesla LQIT/FT-ICR
mass spectrometer.
3.2.1. 4-Amino-2-chloro-5-iodopyridine
To a stirred solution of iodine (14.574 mmol, 3.698 g) in EtOH (25mL) was
added AgSO4 (14.574 mmol, 4.533 g) and the reaction mixture was stirred for 10
minutes. 4-Amino-2-chloropyridine (5.205 mmol, 750 mg) was added slowly over a
period of 10 minutes. Reaction mixture was stirred at room temperature for 3 hours. TLC
analysis indicated the complete conversion of starting material to products. The reaction
mixture was passed through celite and the resulting filtrate was washed with 3 x 50 mL
of 10% NaHCO3 solution and it was extracted with 3 x 50 mL dichloromethane. Organic
layer was washed with 50 mL of brine solution, dried over MgSO4, filtered and
evaporated under reduced pressure. The product was purified by silica gel
chromatography by using EtOAc/hexane (2:8) as eluent to afford 4-amino-2-chloro-5-

75
iodo-pyridine as a brown precipitate:1H NMR (400 MHz, CDCl3): δ 7.87, 6.46 (s, 1H),
5.02 (broad, NH2).
3.2.2 2-Chloro-4,5-diiodopyridine
4-Amino-2-chloro-5-iodopyridine was cooled to -10 oC using ice/MeOH bath and 10 mL
of already cooled 2M H2SO4 was added to the reaction mixture. Solution of NaNO2
(1.019 mmol, 70 mg) in 2 mL of deionized water was cooled and added into the reaction
mixture and it was stirred for 30 minutes at room temperature. A solution of KI (7.0578
mmol, 1.171 g) in 5 ml deionized water was added to the reaction mixture. The reaction
mixture was stirred at room temperature for 45 minutes and then heated at 80oC for 1hr.
TLC showed the complete conversion of starting material into product. Reaction mixture
was cooled using ice/ MeOH bath and it was neutralized by adding 20 mL of 20%
Na2CO3 solution drop wise until the pH of the reaction mixture reached 7. The product
was extracted with 3 x 50 mL of CH2Cl2, dried over Na2SO4 and solvent was evaporated
with the help of rotary evaporator. The product was purified by silica gel chromatography
using EtOAc/ hexanes (2:8) as eluent to obtain 2-chloro-4,5-diiodopyridine as a white
flaky powder : 1H NMR (400 MHz, CDCl3): δ 8.67, 7.88 (s, 1H).

76
3.2.3 2,4,5-Triiodopyridine
Acetyl chloride (0.4098 mmol, 112.7 µL) was added to a mechanically stirred suspension
of 2-chloro-4,5-diiopyridine (0.2732 mmol, 100 mg) and sodium iodide (2.732 mmol,
409.51 mg) in 2 mL of acetonitrile. The reaction mixture was heated for 3h at 80 oC in
the microwave reactor and then cooled and washed with 5 mL of 10% K2CO3 solution
and 5 mL of 5% sodium sulfite solution. Aqueous layer was extracted with 3 x 10 mL
of CH2Cl2 , organic layers were combined, dried over Na2SO4 and the solvent evaporated
with the help of rotovap. The product was purified by silica gel chromatography using
EtOAc/hexanes (1:1) as eluent to obtain 2,4,5-triiodopyridine as a white flaky powder: 1H
NMR (400 MHz, CDCl3): δ 8.38, 7.90 (s, 1H).

77
3.2.4 3-Amino-2,6-triiodopyridine
To a stirred solution of 17 in 30 mL of ethanol, iodine (9.52 mmol, 2.416 g) and silver
sulfate (9.52 mmol, 2.97g) and the reaction mixture was stirred for 10 minutes. 3-
Aminopyridine (3.4 mmol, 320mg) was added slowly over a period of 10 minutes.
Reaction mixture was stirred at room temperature for three hours. TLC analysis indicated
the complete conversion of starting material to products. The reaction mixture was
passed through celite and the resulting filtrate was washed with 3 x 50 mL of 10%
NaHCO3 solution and it was extracted with 3 x 50 mL dichloromethane. Organic layer
was washed with 50 mL of brine solution, dried over MgSO4, filtered and the solvent
evaporated under reduced pressure. The product was purified by silica gel
chromatography using EtOAc/ hexanes (2:8) as eluent to afford 3-amino-2,6-
diiodopyridine as a yellow precipitate.

78
3.2.5 2,3,6-Triiodopyridine
3-Amino-2,6-diiodopyridine was cooled to -10 oC using ice/MeOH bath and 10 mL of
already cooled 2M H2SO4 was added to reaction mixture. Solution of NaNO2 (3.469
mmol, 239.3 mg) in 2 mL of deionized water was cooled and added into the reaction
mixture and it was stirred for 30 minutes at room temperature, followed by addition of a
solution of KI (10.404 mmol, 1.727 g) in 5 ml deionized water. Reaction mixture was
stirred at room temperature for 45 minutes and then heated at 80oC for 1hr. TLC showed
the complete conversion of starting material into products. Reaction mixture was cooled
using ice/ MeOH bath and it was neutralized by adding 20 mL of 20% Na2CO3 solution
dropwise untill the pHof the reaction mixture reached 7. The product was extracted with
3 x 50 mL of CH2Cl2, dried over Na2SO4 and solvent was evaporated with the help of
rotary evaporator. The product was purified by silica gel chromatography using
EtOAc/hexanes (2:8) as eluent to obtain 2,3,6-triiodopyridine as a bright yellow powder.
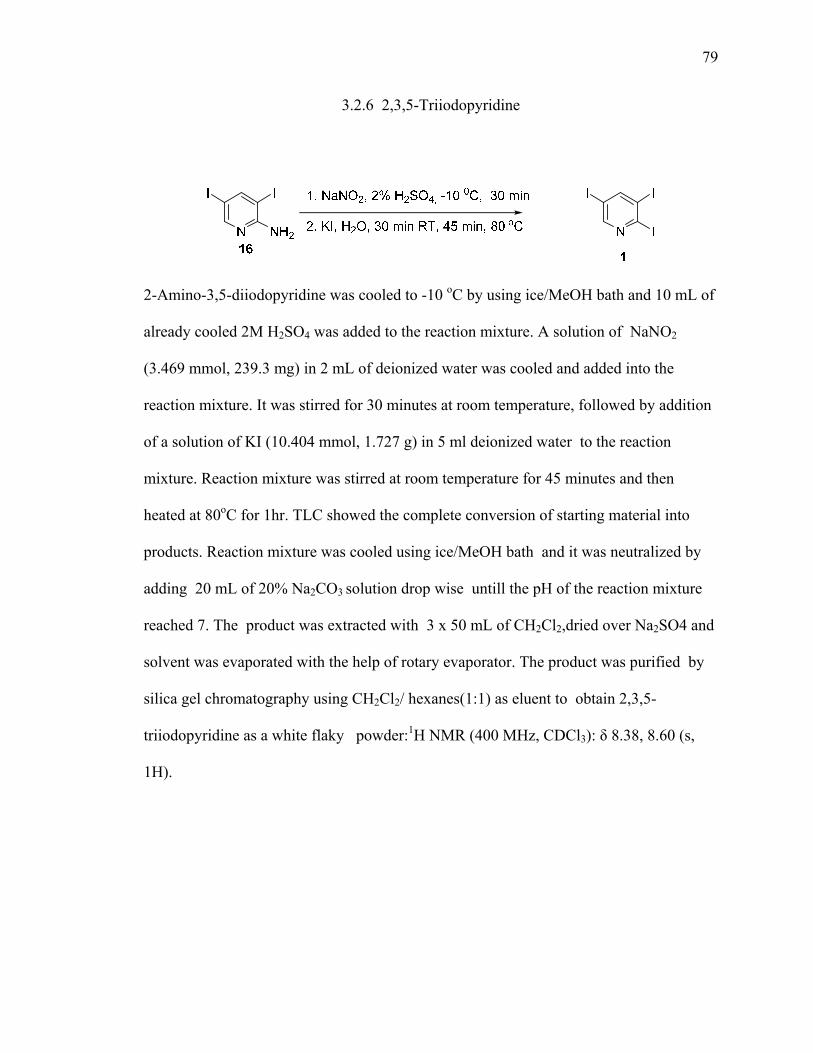
79
3.2.6 2,3,5-Triiodopyridine
2-Amino-3,5-diiodopyridine was cooled to -10 oC by using ice/MeOH bath and 10 mL of
already cooled 2M H2SO4 was added to the reaction mixture. A solution of NaNO2
(3.469 mmol, 239.3 mg) in 2 mL of deionized water was cooled and added into the
reaction mixture. It was stirred for 30 minutes at room temperature, followed by addition
of a solution of KI (10.404 mmol, 1.727 g) in 5 ml deionized water to the reaction
mixture. Reaction mixture was stirred at room temperature for 45 minutes and then
heated at 80oC for 1hr. TLC showed the complete conversion of starting material into
products. Reaction mixture was cooled using ice/MeOH bath and it was neutralized by
adding 20 mL of 20% Na2CO3 solution drop wise untill the pH of the reaction mixture
reached 7. The product was extracted with 3 x 50 mL of CH2Cl2,dried over Na2SO4 and
solvent was evaporated with the help of rotary evaporator. The product was purified by
silica gel chromatography using CH2Cl2/ hexanes(1:1) as eluent to obtain 2,3,5-
triiodopyridine as a white flaky powder:1H NMR (400 MHz, CDCl3): δ 8.38, 8.60 (s,
1H).

80
Figure 3.3 1H NMR of Compound 1

81
Figure 3.4 crystal structure of Compound 2

82
Figure 3.5 1H NMR of compound 3

83
Figure 3.6 13C NMR of compound 3

84
Figure 3.7 1H NMR of compound 21

85
Figure 3.8 1H NMR of compound 18
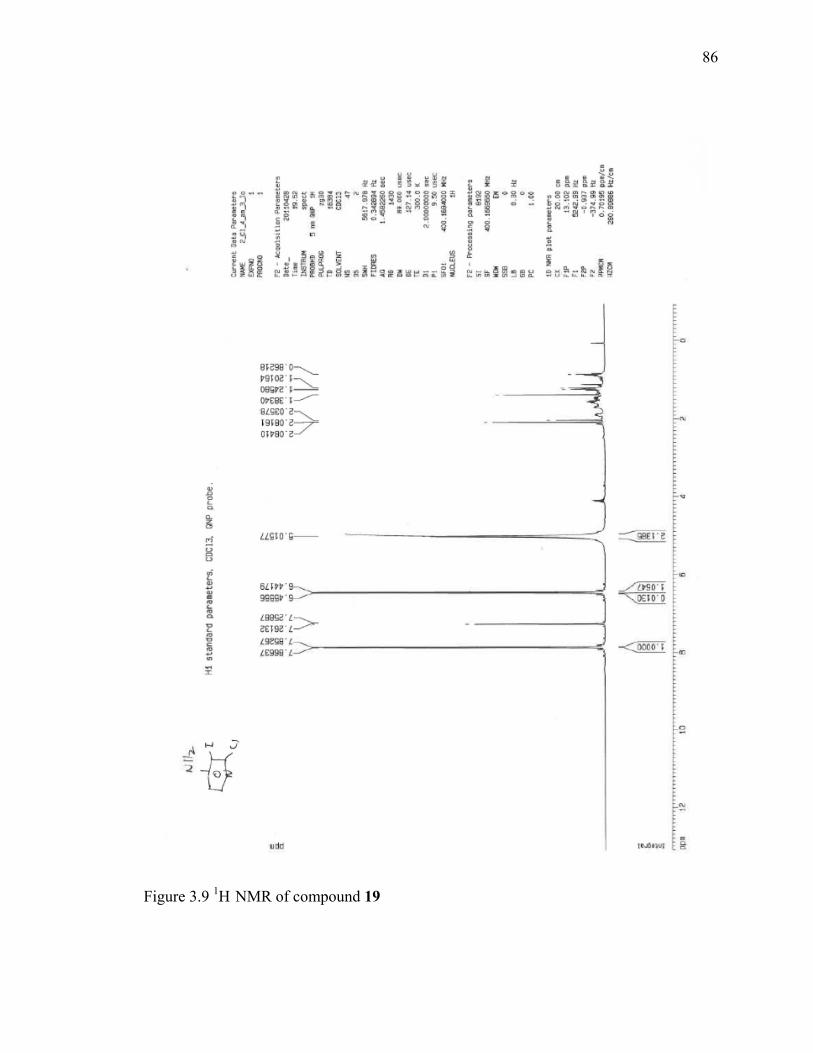
86
Figure 3.9 1H NMR of compound 19
87
3.4 References 1Mullins, O. C.; Sheu, E. Y.; Hammami, A.; Marshall, A. G. Asphaltenes, Heavy Oils, and Petroleomics; Springer: New York, 2007. 2 Calemma, V.;. Rausa, R,; D’Antona, P,; Montanari,L.;.Energy Fuels.1998, 12, 422. 3 Parker, R. E.; Read, T. O. J. Chem. Soc. 1962, 3149 4Charrier, N.; Demont, E.; Dunsdon, R.; Maile, G.; Naylor, A.; O’Brien, A.; Redshaw, S.; Theobald, P.; Vesey, D.; Walter, D. Synth. 2006, 20, 3467. 5 Bissember, A. C .; Banwell, M. G. J. Org. Chem. 2009, 74, 4893. 6Guéret, C; Perrio, C; Lasne, M; Barré, L. Synth.2001, 16, 2495.
7Bullock, J. E; Carmieli, R; Mickley, S. M., Vura-Weis, J; Wasielewski, M, R.J. Am. Chem.Soc. 2009, 131, 11919.

88
CHAPTER 4 CHARACTERIZATION OF THE REACTIVITY OF CHARGED σ,σ,σ-TRIRADICALS
4.1 Introduction
Aromatic organic molecules with unpaired electrons on σ-orbitals plays an
important role in the fields of organic synthesis, organic magnets, and biological activity
of organic compounds.3 Reactive intermediates with three formally unpaired electrons are
known as triradicals. They can be defined as species with three electrons distributed in
three degenerated based on Salem’s definition of biradicals from the electronic structure
point of view.1 Several studies have been published on σ-type carbon-centered aromatic
mono- and biradicals2,3.However, very little is known about the reactivity of analogous
σ,σ,σ-triradicals, due the difficulty in studying such highly reactive species
experimentally.4,5,6
Figure 4.1 Tridehydrobenzenes as well as the triradicals studied, tridehydropyridinium and substituted tridehydropyridinium cations
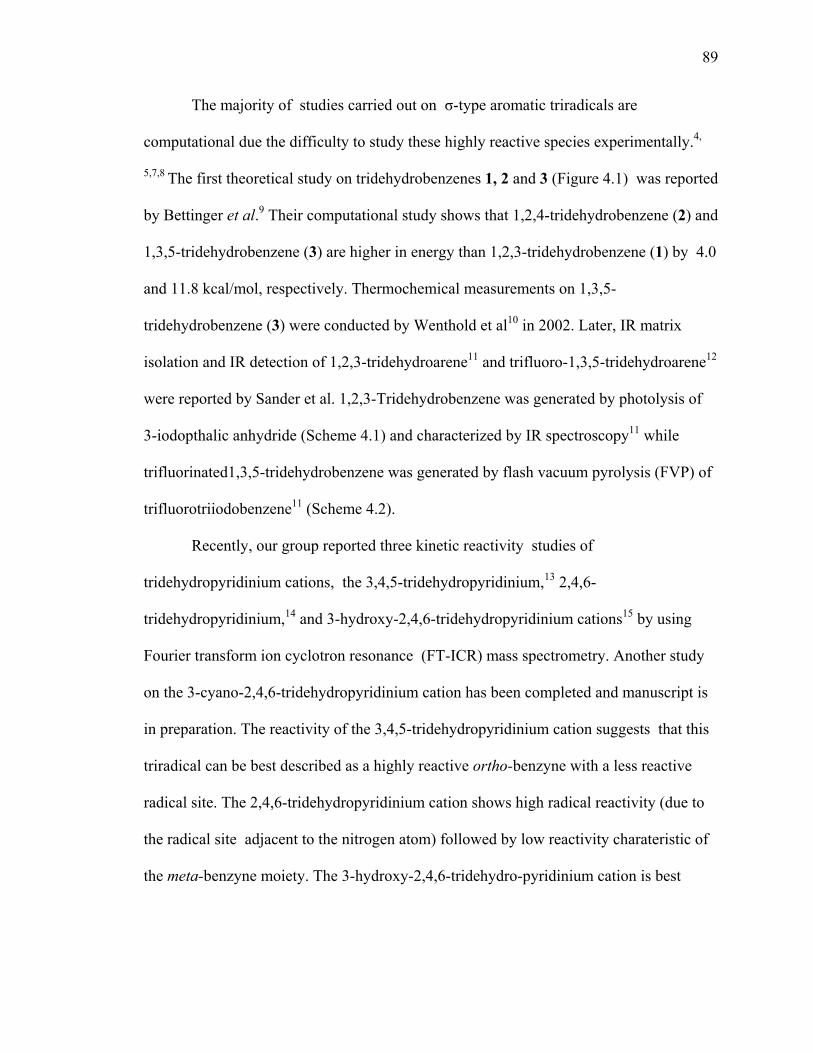
89
The majority of studies carried out on σ-type aromatic triradicals are
computational due the difficulty to study these highly reactive species experimentally.4,
5,7,8 The first theoretical study on tridehydrobenzenes 1, 2 and 3 (Figure 4.1) was reported
by Bettinger et al.9 Their computational study shows that 1,2,4-tridehydrobenzene (2) and
1,3,5-tridehydrobenzene (3) are higher in energy than 1,2,3-tridehydrobenzene (1) by 4.0
and 11.8 kcal/mol, respectively. Thermochemical measurements on 1,3,5-
tridehydrobenzene (3) were conducted by Wenthold et al10 in 2002. Later, IR matrix
isolation and IR detection of 1,2,3-tridehydroarene11 and trifluoro-1,3,5-tridehydroarene12
were reported by Sander et al. 1,2,3-Tridehydrobenzene was generated by photolysis of
3-iodopthalic anhydride (Scheme 4.1) and characterized by IR spectroscopy11 while
trifluorinated1,3,5-tridehydrobenzene was generated by flash vacuum pyrolysis (FVP) of
trifluorotriiodobenzene11 (Scheme 4.2).
Recently, our group reported three kinetic reactivity studies of
tridehydropyridinium cations, the 3,4,5-tridehydropyridinium,13 2,4,6-
tridehydropyridinium,14 and 3-hydroxy-2,4,6-tridehydropyridinium cations15 by using
Fourier transform ion cyclotron resonance (FT-ICR) mass spectrometry. Another study
on the 3-cyano-2,4,6-tridehydropyridinium cation has been completed and manuscript is
in preparation. The reactivity of the 3,4,5-tridehydropyridinium cation suggests that this
triradical can be best described as a highly reactive ortho-benzyne with a less reactive
radical site. The 2,4,6-tridehydropyridinium cation shows high radical reactivity (due to
the radical site adjacent to the nitrogen atom) followed by low reactivity charateristic of
the meta-benzyne moiety. The 3-hydroxy-2,4,6-tridehydro-pyridinium cation is best

90
viewed as a reactive monoradical with a chemically inert meta-benzyne moiety due to the
presence of the methoxy group adjacent to both meta-benzyne radical sites.
In order to improve the knowledge of triradicals and their reactivity controlling
factors, reactivity of the 2,4,5-tridehydropyridinium (9), 2,3,5-tridehydropyridinium (10),
and 2,3,6-tridehydropyridinium 11 cations (Figure 4.1) was studied, as discussed in this
chapter.
Scheme 4.1
Scheme 4.2
4.2 Generation of Triradicals
In this dissertation, triradicals 9, 10, and 11 (Figure 4.2) were generated using
methodology developed in the Kenttämaa labs, as discussed in Chapter 2, in an FT-ICR
mass spectrometer from synthesized precursors (described in Chapter 3). In general, all

91
the triradical precursors were protonated or deuterated via CI in the source cell and
transferred into the analyzer cell. The radical sites were generated by performing SORI-
CAD to induce homolytic cleavage of C-I bonds to yield triradicals 9,10 and 11.
Figure 4.2 Generation of isomeric tridehydropyridinium cations in the FT-ICR
4.3 Possible Factors Controlling the Reactivity of Triradicals
An important goal for reactivity studies of σ, σ, σ-triradicals is to determine the
factors controlling the reactivity of this type of triradicals. The reactivity of polar
monoradicals is controlled by the electron affinity (EA) of the radical site and hydrogen
bonding interactions in the transition state. In addition to these two factors, the reactivity

92
of related biradicals is controlled by singlet-triplet energy splitting16 (S-T gap; the energy
difference between the lowest energy singlet state and the lowest energy triplet state;
Figure 4.3, and, in the case of meta-benzynes, by dehydrocarbon atom separation17
(DAS).
Figure 4.3 Illustration for the influence of singlet-triplet gap (S-T gap) on the radical reactivity of biradicals.
All the above factors may be affected by substitution. In order to understand the
reactivity of the triradicals, some of these factors should be considered.
4.3.1 Electron Affinities
The vertical electron affinity at the radical site, which influences the polarity of
the transition states of mono- and biradicals’ reactions, has been shown to affect their

93
reactivity. Hence, this parameter should also influence the reactivities of the
tridehydropyridinium cations.
The electron affinities (EA) of the tridehydropyridinium cations are very different
from the EAs of the related tridehydrobenzenes (Figure 4.4). The incorporation of the
NH+ group into the tridehydrobenzene significantly increases the EAs. The reactivity of
monoradicals is often proportional to their EAs. High EA results in faster reactions. The
effect of EA on the reactivity of triradicals 9, 10 and 11 will be discussed in next
sections.
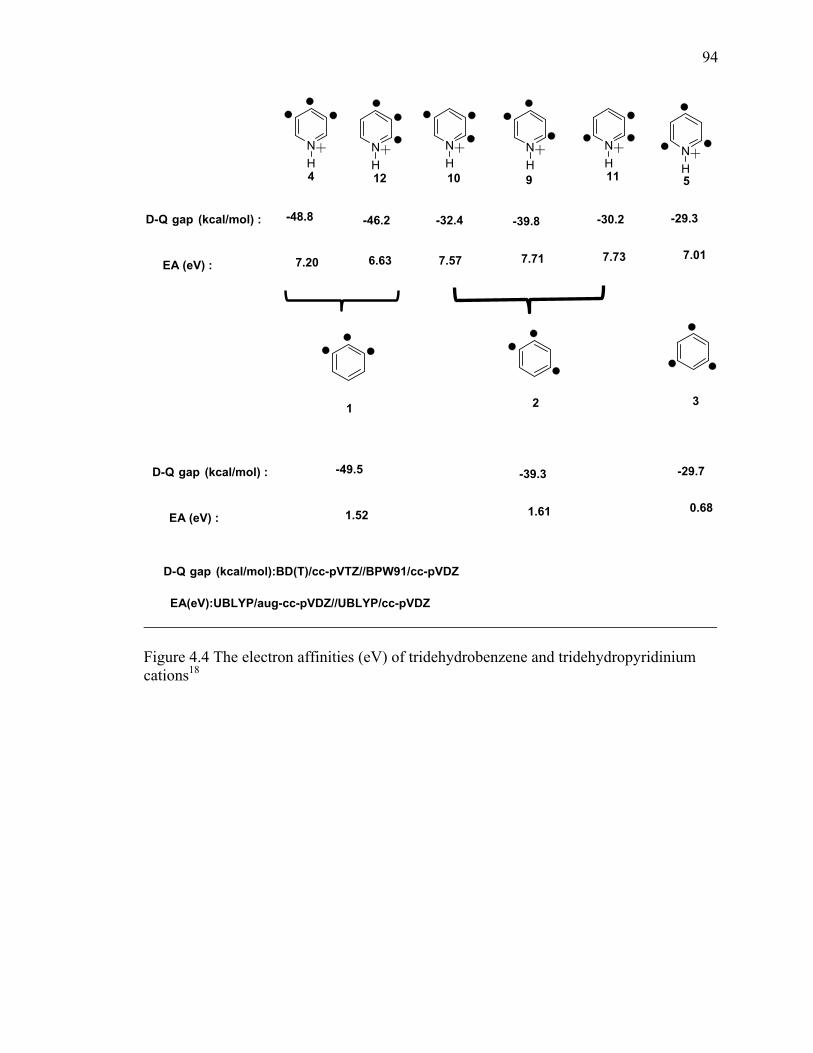
94
Figure 4.4 The electron affinities (eV) of tridehydrobenzene and tridehydropyridinium cations18
N
HN
H
N
H
N
H
N
H
1 2 3
4 510 9 11
N
H12
D-Q gap (kcal/mol) : -48.8 -46.2 -32.4 -39.8 -30.2 -29.3
EA (eV) : 7.20 6.63 7.57 7.71 7.73 7.01
D-Q gap (kcal/mol) : -49.5 -39.3 -29.7
EA (eV) : 1.52 1.61 0.68
D-Q gap (kcal/mol):BD(T)/cc-pVTZ//BPW91/cc-pVDZ
EA(eV):UBLYP/aug-cc-pVDZ//UBLYP/cc-pVDZ

95
Figure 4.5 Doublet and quartet states of σ,σ,σ-triradicals.
4.3.2 Hydrogen Bonding Interactions in Transition States
Hydrogen bonding interactions in transition states may affect the reactivity of
triradicals if a radical site or sites are near a group capable of hydrogen bonding. In non-
substituted tridehydropyridinium cations, the NH+ group may form a hydrogen bond.
Therefore, the reactivity of all the triradicals studied (4-12; Figure 4.1) except 4 toward
THF may be affected by hydrogen bonding.

96
4.3.3 Dehydrocarbon Atom Separation (DAS)
The tridehydropyridinium cations 9 and 11 discussed in this Chapter have their
radical sites in meta-position relative to each other. DAS has been shown to influence the
reactivity of meta-benzynes17and hence it should also be considered as a possible factor
for controlling the reactivity of triradicals.
4.3.4 Triradical Stabilization Energies (TSEs)
The reactivity of tridehydropyridinium cations revealed that the three radical sites
are not equally reactive Scheme 4.3. This is due to non-equal coupling between the
radical sites. TSEs provide a measure for the strength of interactions between each
radical site and the remaining biradical moiety in the triradical.17 The TSEs correspond
to the enthalpy changes for isodesmic hydrogen atom transfers from the pyridinium
cation to the tridehydropyridinium cation to produce a mono- and a biradical cation. The
TSE values provide a direct indication of stabilization (TSE > 0) or destabilization (TSE
< 0) involved when all the three radical sites are present in the same molecule. TSE
values of the doublet states of the triradicals were calculated by Dr. John Nash at the
BD(T)/cc-pVTZ//BPW91/cc-pVDZ level of theory and are shown in Schemes 4.3 – 4.5.

97
Scheme 4.3
Based on Scheme 4.3, TSEs determined for 9 show that ortho-benzyne (C4-C5)
interactions dominate, while the meta-interaction between the dehydrocarbon atoms C2-
C4 is relatively weak. This is indicated by the finding that the TSE associated with the
separation of the radical site at C2 to produce 15 and 13 is very small (0.2 kcal/mol),
whereas the TSEs associated with the separation of either C4 or C5 radical site to
produce 17 and 18 or 16 and 14, respectively, are much higher due to proximity of the
radical site to the NH+ group.

98
Scheme 4.4
In triradical 10, the ortho-interaction (bottom ) is stronger than the meta-
interaction (top) and dominates Scheme 4.4. The difference between the two lowest TSEs
is only 3.5 kcal/mol. However, the meta-interaction between the dehydrocarbon atoms C3
and C5 of 10 appears to be somewhat stronger than the meta-interaction between C4 and
C2 of 9. The low TSE associated with the radical site C2 of 10 is not only due to the
strong meta-interaction but also due to the proximity of the ortho-benzyne group to the
NH+ group.

99
N
H
+
N
H11
N
H21
N
H13
N
H20
N
H14
N
H17
13.4 kcal/mol
-0.9 kcal/mol
-18.1 kcal/molN
H13
Scheme 4.5
Like for triradical 10, the ortho-benzyne (C2- C3) interaction dominates in 11 as
the C2-C323 bond length is nearly the same for both tridehydropyridinium cations10, and
11.The relatively long calculated dehydrocarbon atom separation between C2-C623
suggests that the radical site at C6 does not interact very strongly with the ortho-benzyne
moiety.
4.4 Observed Reactivity
The chemical behavior of the σ,σ,σ-triradicals 4- 8 has been previously studied
in our research group.19,20,21 In this section, results of studies on the reactivity of novel
tridehydropyridinium cations that are isomers of 4 and 5, σ,σ,σ-2,4,5-
tridehydropyridinium (9) cation toward cyclohexane, tetrahydrofuran, allyl iodide, and
dimethyl disulfide are reported and compared to the reactivities of 4 - 8.
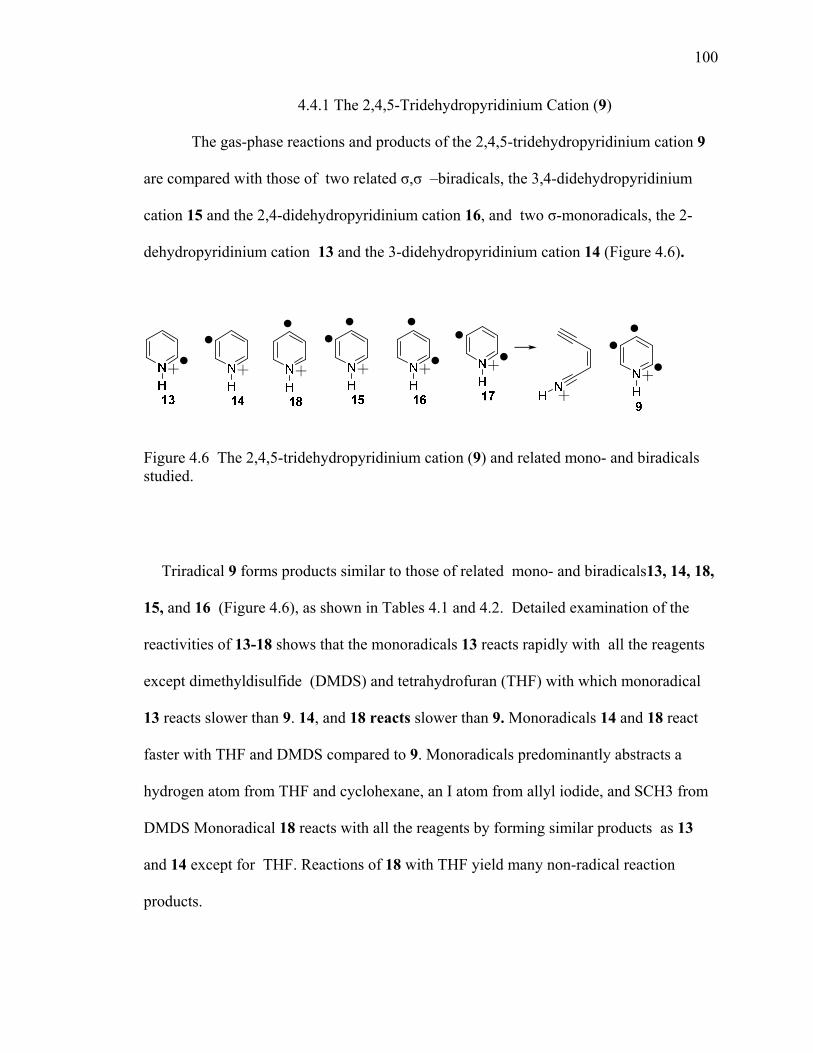
100
4.4.1 The 2,4,5-Tridehydropyridinium Cation (9)
The gas-phase reactions and products of the 2,4,5-tridehydropyridinium cation 9
are compared with those of two related σ,σ –biradicals, the 3,4-didehydropyridinium
cation 15 and the 2,4-didehydropyridinium cation 16, and two σ-monoradicals, the 2-
dehydropyridinium cation 13 and the 3-didehydropyridinium cation 14 (Figure 4.6).
Figure 4.6 The 2,4,5-tridehydropyridinium cation (9) and related mono- and biradicals studied.
Triradical 9 forms products similar to those of related mono- and biradicals13, 14, 18,
15, and 16 (Figure 4.6), as shown in Tables 4.1 and 4.2. Detailed examination of the
reactivities of 13-18 shows that the monoradicals 13 reacts rapidly with all the reagents
except dimethyldisulfide (DMDS) and tetrahydrofuran (THF) with which monoradical
13 reacts slower than 9. 14, and 18 reacts slower than 9. Monoradicals 14 and 18 react
faster with THF and DMDS compared to 9. Monoradicals predominantly abstracts a
hydrogen atom from THF and cyclohexane, an I atom from allyl iodide, and SCH3 from
DMDS Monoradical 18 reacts with all the reagents by forming similar products as 13
and 14 except for THF. Reactions of 18 with THF yield many non-radical reaction
products.

101
Table 4.1 Observed reactions, branching ratios for the primary products, and reaction efficiencies for reactions of monoradicals related to 9with cyclohexane, tetrahydrofuran, allyl iodide and dimethyl disulfide in FT-ICR mass spectrometer
13 14 18 9 S-T (D-Q)b
Gap (kcal/mol) EA (eV)
-
6.59
-
6.08
-
5.84
-39.8
7.71
H abs 100%
Eff. = 40%
H abs 100%
Eff. = 21%
H abs 100%
Eff. = 14%
H abs 100%
Eff. = 23%
H abs 77% 2xH+C4H5 abs 15% 2 x H abs 8% (2°) H abs Eff. = 0.4%
H abs 100%
Eff. = 76%
H abs 100%
Eff. = 38%
H abs 80% CH2 abs 8% C2H3 abs 6% CHO abs 3% C2H3O abs 2%
Eff. = 28%
H abs 100%
Eff. = 47%
H+ Transfer 39% C2H30 abs 23% D+ Transfer 12% H abs 07% Hydride- Abs 07% CH20 abs 05% C2H5 abs 03% m/z 85 04%
Eff. = 53%
I abs 84%Allyl abs16% Eff. = 69%
I abs 90% Allyl abs 10% Eff. = 57%
I abs 92% Allyl abs 8% Eff. = 53%
I abs 90% Allyl abs 10 % Eff. =63%
Allyl abs 66% I abs 18% (2°) Allyl-H abs H+ trns 9% CH2 abs 7% Eff. = 47%
SCH3 abs 94% H abs 5% SSCH3 abs 1% Eff. = 79%
SCH3abs100% Eff. = 77%
SCH3 abs 100% Eff. = 75%
SCH3 abs 90% H abs 10% Eff. = 100%
electron abs 81% (20SCH3 abstraction) H+ Transfer 09% SCH3 Abs 10%
Eff.= 91%
[a] abs. = abstraction, trans. = transfer, UI = unreactive isomer,secondary products are reported as (2º) in italics and are listed under the primary products that yield them. Eff.= efficiency. [b] ] D-Q splittings were calculated at the RHF-UCCSD(T)/cc-pVTZ//UBPW91/cc-pVDZ level of theory. [c] EAs were calculated at the RHF-UCCSD(T)/aug-cc-pVTZ//UB3LYP/cc-pVTZ level of theory.

102
Scheme 4.6
The reactions that occur by nonradical mechanisms for 18 are abstraction of
CHO from THF; this is due to the possibility of forming ionized carbene resonance
structure for 18. The unpaired electron in σ-orbital and the positive charge in the π-
system (Scheme 4.6) facilitate nucleophilic addition of THF to the π-system at the most
electron deficient carbon22 (C4). 13 is more reactive than 14 and 18 towards all the
reagents. This may be due to the greater electron affinity of the monoradical 13 and also
its ability to form a hydrogen bond in TS.
Biradical 16 a decreased radical reactivity when compared to triradical 9 for all
the reagents. Biradical 15 has lower radical reactivity than 9 for all the reagents except
cyclohexane. The lower reactivity of 15 and 16 may be due to their large S-T gaps. The
S-T gaps of 15 and 16 are -32.5 and -20.0 kcal/mol, respectively (BD(T)/cc-
pVDZ//UBPW91/cc-pVDZ). 17 does not exists in the radical form as it be generated
without rearrangement to an azaenediyne
Scheme 4.7 .
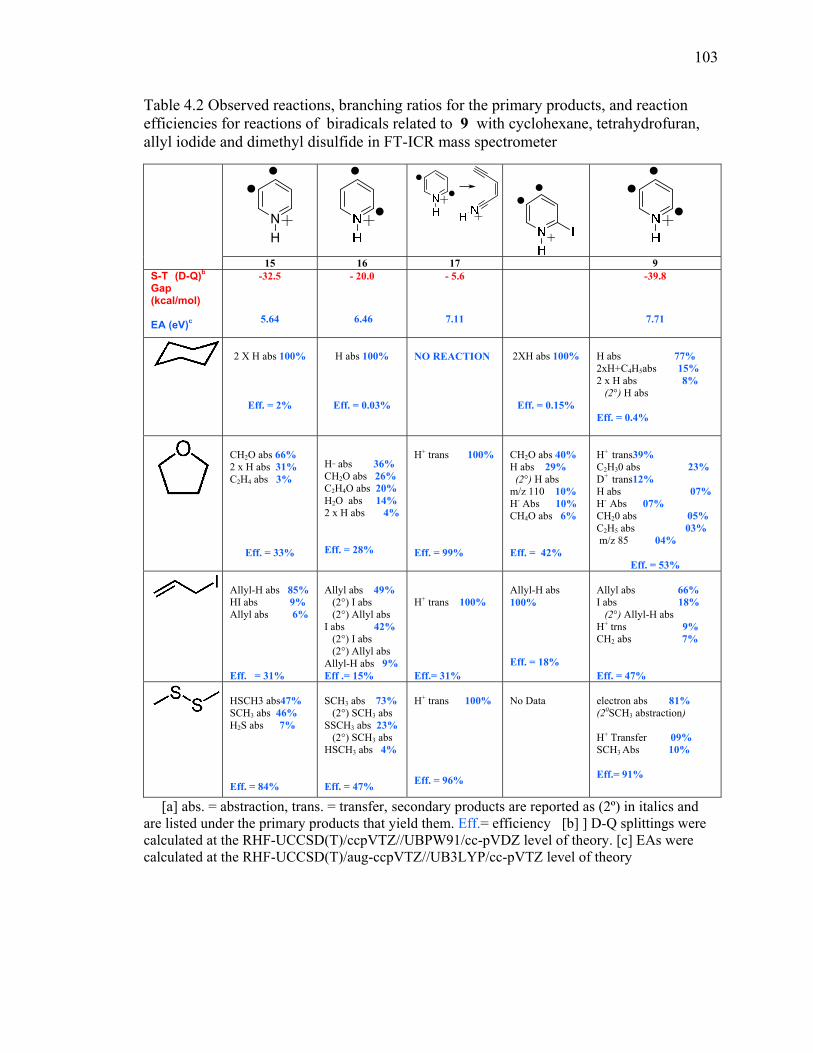
103
Table 4.2 Observed reactions, branching ratios for the primary products, and reaction efficiencies for reactions of biradicals related to 9 with cyclohexane, tetrahydrofuran, allyl iodide and dimethyl disulfide in FT-ICR mass spectrometer
N
H
15 16 17 9 S-T (D-Q)b
Gap (kcal/mol) EA (eV)c
-32.5
5.64
- 20.0
6.46
- 5.6
7.11
-39.8
7.71
2 X H abs 100%
Eff. = 2%
H abs 100%
Eff. = 0.03%
NO REACTION
2XH abs 100%
Eff. = 0.15%
H abs 77% 2xH+C4H5abs 15% 2 x H abs 8% (2°) H abs Eff. = 0.4%
CH2O abs 66% 2 x H abs 31% C2H4 abs 3%
Eff. = 33%
H_ abs 36% CH2O abs 26% C2H4O abs 20% H2O abs 14% 2 x H abs 4% Eff. = 28%
H+ trans 100% Eff. = 99%
CH2O abs 40% H abs 29% (2°) H abs m/z 110 10% H- Abs 10% CH4O abs 6% Eff. = 42%
H+ trans39% C2H30 abs 23% D+ trans12% H abs 07% H- Abs 07% CH20 abs 05% C2H5 abs 03% m/z 85 04%
Eff. = 53%
Allyl-H abs 85% HI abs 9% Allyl abs 6% Eff. = 31%
Allyl abs 49% (2°) I abs (2°) Allyl abs I abs 42% (2°) I abs (2°) Allyl abs Allyl-H abs 9% Eff .= 15%
H+ trans 100% Eff.= 31%
Allyl-H abs 100% Eff. = 18%
Allyl abs 66% I abs 18% (2°) Allyl-H abs H+ trns 9% CH2 abs 7% Eff. = 47%
HSCH3 abs47% SCH3 abs 46% H2S abs 7% Eff. = 84%
SCH3 abs 73% (2°) SCH3 abs SSCH3 abs 23% (2°) SCH3 abs HSCH3 abs 4% Eff. = 47%
H+ trans 100%
Eff. = 96%
No Data
electron abs 81% (20SCH3 abstraction) H+ Transfer 09% SCH3 Abs 10%
Eff.= 91%
[a] abs. = abstraction, trans. = transfer, secondary products are reported as (2º) in italics and
are listed under the primary products that yield them. Eff.= efficiency [b] ] D-Q splittings were calculated at the RHF-UCCSD(T)/ccpVTZ//UBPW91/cc-pVDZ level of theory. [c] EAs were calculated at the RHF-UCCSD(T)/aug-ccpVTZ//UB3LYP/cc-pVTZ level of theory

104
Biradical 16 abstracts two hydrogen atoms from cyclohexane, two iodine atoms
and an allyl group from allyl iodide, and two SCH3 groups from DMDS, which indicates
the presence of two radical sites. 16 also abstracts H2O, CH2O, C2H4O, and two
hydrogen atoms from THF. 15 behaves as an activated electrophilic alkyne and readily
undergoes nonradical reactions with nucleophiles such as CH2O abstraction from THF
(Table 4.2). These non radical reactions do not require the uncoupling of the radical
sites in transition states, and therefore their efficiencies do not depend on the magnitude
of the S-T gap. 15 abstracts two hydrogen atoms from THF, as well as CH2O and C2H4s,
and it reacts very slowly with cyclohexane by abstracting two hydrogen atoms.
Triradical 9 transfers a proton to THF, allyl iodide and DMDS, which suggests
that it is more acidic than 13, 14, 15, 16, 17, and 18. This is supported by the PA
calculated for the conjugate base of 13, 14, 15, 16, 17, 18, and 9 (210.2, 216.5, 207.1,
207.4, 206.4, 217.7, and 199.4 kcal/mol, respectively; UBLYP/aug-cc-
pVDZ//UBLYP/cc-pVDZ), respectively. The reactivity of 9 reveals the presence of three
radical sites as it abstracts three hydrogen atoms from cyclohexane. 9 abstracts an iodine
atom, secondary allyl-H, and an allyl group from allyl iodide which suggests that it has
three radical sites.
Scheme 4.8

105
N
H
I
N
H9 H-I
N
H
H
Allyl-H abstraction Allyl abstraction
- I
Scheme 4.9
All the radical sites of 9 are not equally reactive. During the reaction of 9 with
allyl iodide first iodine atom abstraction takes place at C2 position to generate 4,5-
didehydro-2-iodopyridinium cation followed by secondary allyl-H abstraction by the
remaining ortho-benzyne moiety (Scheme 4.8). Abstraction of allyl group from allyl
iodide by 9 is a major reaction (Scheme 4,9).The efficieny of the reaction of 4,5-
didehydro-2-iodopyridinium cation with allyl iodide lies in between that of biradicals 16
and 15. It reacts with higher efficiency than 16 and lower efficiency than 15. The reaction
of 4,5-didehydro-2-iodopyridinium cation with allyl iodide is abstraction of allyl-H
group (table 4.2). Addition of iodine atom to 15 does not influence the reactivity of the
biradical. 2-Iodo-4,5-didehydropyridinium cation abstracts two hydrogen atoms from
cyclohexane confirming the presence of two radical sites . It abstracts exclusively allyl-H
group from allyl iodide and CH2O from THF and hydrogen atom followed by
abstraction of a second hydrogen atom. Abstraction of an allyl-H group from allyl iodide
and CH2O group from THF are examples of non radical reactions and their observation
suggests that the biradical is an ortho-benzyne.

106
The TSEs determined for triradical 9 (Scheme 4.3) indicate that the ortho-
benzyne (C4-C5) interaction dominates for the triradical, while the meta-benzyne
interaction (C2-C4) is relatively weak. Hence, the triradical is expected to undergo facile
radical reactions, like mono radical 13. The triradical 9 is calculated to have a doublet
ground state (D-Q gap: -39.8 kcal/mol; BD(T)/cc-pVTZ//BPW91/cc-pVDZ), which
might explain the lower reactivity of 9 with cyclohexane when compared to related
mono- and biradicals.
Scheme 4.10

107
Monoradical 27 formed during the first SORI-CAD event abstracts one
hydrogen atom from cyclohexane, allyl iodide, and THF (Scheme 4.10). The efficiencies
of the reaction of 27 with cyclohexane, allyliodide and THF are quite similar the
efficiencies of 14 (Table 4.1). While the biradical28 formed after two SORI-CAD events
abstracts two hydrogen atoms from cyclohexane and allyl-H group exclusively from allyl
iodide. Abstraction of allyl-H group is a major reaction for an ortho-benzyne (Table
4.2).Based on the efficiencies of the reactions of 28 with cyclohexane and allyl iodide,
the biradical formed might be 2-Iodo-4,5-didehydropyridinium cation (Scheme
4.11)
Scheme 4.11
The triradical 9 behaves as if it contains a reactive monoradical site like in 13
and a much less reactive ortho-benzyne moiety like that in 15. It behaves as a reactive
monoradical due to the presence of the radical site next to the nitrogen atom. The large
108
EA of 9 makes electron abstraction the main reaction with DMDS. While the second
major reaction is proton transfer due the similar proton affinity of the conjugate base of 9
and DMDS ( 199.4 and 194.9 kcal/mol, respectively), The SCH3 group abstraction from
DMDS is likely to occur at C2 position of the triradical 9. Due to similar proton affinities
of THF and the conjugate base of 9 (196.5 and 199.4 kcal/mol , respectively) there is a
considerable amount of proton transfer from 9 to THF. Initial hydride abstraction by 9
from THF followed by a proton transfer from the ion of m/z 71 formed by the hydride
abstraction by 9 to THF to form ion of m/z 73. Due to the high EA of 9 and high hydride
affinity a very small amount of hydride abstraction. C2H3O abstraction from THF is
likely to occur at C4. Nucleophilic attack of the oxygen atom in tetrahydrofuran at the
most electron deficient carbon atom in 9 (C4; which is due, in part, to an ionized
carbene-type resonance structure that permits greater charge delocalization away from the
nitrogen atom23). This step is expected to occur much faster for triradical 9 than for
monoradical 18 because the presence of adjacent radical site in 9 increases the
electrophilicity of C4 which is not the case with CH2O abstraction.

109
4.5 References 1Salem, L.; Rowland, C. Angew. Chem. Int. Ed. Engl. 1972, 11, 92. 2 Winkler, M.; Wenk, H. H.; Sander, W. Arynes. In Reactive Intermediate Chemistry; Moss, R. A.; Platz, M. S.; Jones, M. J. Eds.; Wiley: Hoboken, 2004. 3 Nicolau, K. C.; Dai, W. M. Angew. Chem. Int. Ed. Engl. 1991, 30, 1387. 4 Krylov, A. I. J. Phys. Chem. A 2005, 109, 10638. 5 Krylov, A. I. Acc. Chem. Res. 2006, 39, 83. 6 Nguyen, H. M. T.; Höltzl, T.; Gopakumar, G.; Veszprémi, T.; Peeters, J.; Nguyen, M. T. Chem. Phys. 2005, 316, 125. 7 Koziol, L.; Winkler, M.; Houk, K. N.; Venkataramani, S.; Sander, W.; Krylov, A.
I. J. Phys. Chem. A 2007, 111, 5071.
8 Manohar, P. U.; Koziol, L.; Krylov, A. I. J. Phys. Chem. A 2009, 113, 2591. 9 Bettinger, H. F.; Schleyer, P. v. R.; Schaefer, III, H. F. J. Am. Chem. Soc. 1999, 121, 2829. 10 Lardin, H. F.; Nash, J. J.; Wenthold, P. G. J. Am. Chem. Soc. 2002, 124, 12612. 11Venkataramani, S.; Winkler, M.; Sander, W. Angew. Chem. Int. Ed. 2005, 44, 6306. 12Venkataramani, S.; Winkler, M.; Sander, W. Angew. Chem. Int. Ed. 2007, 46, 4888. 13Jankiewicz, B. J.; Reece, J. N.; Vinueza, N. R.; Nash, J. J.; Kenttämaa, H. I. Angew. Chem. Int. Ed. 2008, 47, 9860. 14Jankiewicz, B. J.; Adeuya, A.; Yurkovich, M. J.; Vinueza, N. R.; Gardner, S. J.; Zhou, M.; Nash, J. J.; Kenttämaa, H. I. Angew. Chem. Int. Ed. 2007, 46, 9198. 15Jankiewicz, B. J.; Vinueza, N. R.; Reece, J. N.; Lee, Y. C.; Williams, P.; Nash, J.J.; Kenttämaa, H. I. Chem. Eur. J. 2012, 18, 969. 16Nash, J. J.; Nizzi, K. E.; Adeuya, A.; Yurkovich, M. J.; Cramer, C. J.; Kenttämaa, H. I. J. Am. Chem. Soc. 2005, 127, 5760. 17Nash, J. J.; Nizzi, K. E.; Adeuya, A.; Yurkovich, M. J.; Cramer, C. J.; Kenttämaa, H. I. J. Am. Chem. Soc. 2005, 127, 5760.

110
18Nash, J. J.; Kenttämaa, H .I.; Cramer, C. J. J. Phys. Chem. A 2008, 112, 5542. 19Jankiewicz, B.J.; Reece, J.N.; Vinueza, N.R.; Nash, J.J.; Kenttämaa, H.I. Angew. Chem. Int. Ed. 2008, 47, 9860. 20Jankiewicz, B.J.; Adeuya, A.; Yurkovich, M.J.; Vinueza, N.R.; Gardner III, S.J.; Zhou, M.; Nash, J.J.; Kenttämaa, H.I. Angew. Chem. Int. Ed. 2007, 46, 9198 21Jankiewicz, B.J.; Vinueza, N.R.; Reece, J.N.; Lee, Y.C.; Williams, P.; Nash, J.J.; Kenttӓmaa H.I., Chem. Eur. J. 2012, 18, 969. 22Jankiewicz, B.J.; Gao. J,; Reece, J.N.;Vinueza, N.R.; Narra, P.; Nash, J.J.; Kenttӓmaa H.I., Phys. Chem. A 2012, 116, 3089. 23Nash, J. J.; Kenttämaa, H. I.; Cramer, C. J. J. Phys. Chem. A 2008, 112, 5542.
111
CHAPTER 5: DEVELOPMENT OF A NOVEL ATMOSPHERIC PRESSURE CHEMICAL
IONIZATION (APCI) METHOD USING PRIOR TREATMENT WITH PALLADIUM CHLORIDE FOR IDENTIFICATION OF LIGNIN DEGRADATION PRODUCTS
CONTAINING THE 3-PHENYLALLYL ALCOHOL MOIETY
5.1 Introduction
Lignin is one of the most abundant natural aromatic polymers.1 It is considered as
a potential source of chemicals and energy.2 Degradation of lignin by existing methods
leads to very complex mixtures. Consequently, analysis of lignin conversion products is
a challenging task. However, this is necessary in order to rationally design methods to
convert these mixtures to fuels or useful chemicals. Tandem mass spectrometry (MS/MS)
is the only method that can quickly provide molecular level information on complex
mixtures, such as lignin conversion products. 3,4
The ideal mass spectrometric evaporation/ionization method for complex
mixtures is expected to cause no fragmentation while producing abundant ions that can
be used to extract molecular weight (MW) information and that contain the unchanged
structure of the analyte molecules. Development of such methods for the analysis of
lignin degradation products may be accomplished by studying lignin model compounds
that contain functionalities expected to be in degraded lignin. Earlier characterization of
hydrothermolytically degraded poplar by using GC-MS and HPLC and of milled spruce
lignin samples pyrolysed and analyzed by using pyrolysis-GC-MS has suggested the
112
presence of molecules with the 3-phenylallyl alcohol moiety.5,6 Herein, I report a positive
ion atmospheric pressure chemical ionization (APCI) method combined with palladium
chloride (PdCl2) treatment is reported for ionization and identification of compounds
containing the 3-phenylallyl alcohol moiety in lignin degradation product mixtures.
Linear quadrupole ion trap (LQIT) mass spectrometry was used in this research because
of its ability to trap ions efficiently for long periods of time.
5.2 Experimental Conditions
5.2.1 Materials
Isoeugenol, eugenol, 2-methoxy-4-propylphenol, guaiacol, guaiacyl propanol,
methyl ester of stearic acid, cholestrol, and 3-phenyl-2-propyn-1-ol, 2-octenol, Cinnamyl
alcohol, 4-methoxycinnamyl alcohol, (E)-3-phenyl-but-2-en-1-ol, 2-methyl-3-
phenylprop-2-ene-1-ol, and (E)-2-methyl-4-phenylbut-3-ene-2-ol (all greater than 98%
purity) were purchased from Sigma-Aldrich (St. Louis, MO). Guaiacylglycerol-β-
guaiacyl ether (98% purity from TCI America; Portland, OR), sinapyl alcohol, coniferyl
alcohol (98% purity), and palladium(II)chloride were purchased from Alfa-Aesar (Ward
Hill, MA). High performance liquid chromatography-mass spectrometry (HPLC/MS)
grade water and methanol were purchased from Fisher Scientific (Pittsburgh, PA). All
chemicals were used without further purification.

113
5.2.2 Sample Preparation
1mM stock solutions of model compounds were prepared in HPLC grade 50/50
methanol/water. Each model compound solution was studied before and after treating it
with various equivalents (from 1 up to 10) of PdCl2. Solid PdCl2 was added into 2 ml of
each model compound solution followed by sonication for various time intervals (from 1
up to 30 minutes) and filtration through cotton wool to keep excess PdCl2 from entering
the LQIT.
3.2.3 Instrumentation
All the experiments were performed using a ThermoScientific LTQ linear
quadrupole ion trap (LQIT). The sample solution flow rate into the LQIT was maintained
at 10 µL/min and this solution was T-infused with HPLC grade 50/50 methanol/water at
100 µL/min flow rate before introduction into the APCI source positive mode. Typical
APCI conditions were: positive ion detection, sheath gas (N2) flow, 20 (arbitrary units),
auxiliary gas flow, 5 (arbitrary units), and capillary temperature, 275 °C. Voltages for the
ion optics were optimized for each analyte by using the tune feature of the LTQ Tune
Plus interface. In order to probe the mechanism of action of PdCl2, the structures of some
ionized model compounds were examined using collision-activated dissociation (CAD).

114
5.3 Results and Discussion
Palladium has a strong affinity for carbon-carbon double bonds. It is known to
form π-complexes with carbon-carbon double bonds, which can lead to vinylic and
allyllic C-H bond activation wherein the activated C-H bond becomes susceptible to
nucleophilic addition reactions.7,8 The strong affinity of Pd to carbon-carbon double
bonds inspired this examination of the efficacy of palladium salts as a dopant in APCI
for the identification of lignin degradation products that contain carbon-carbon double
bonds. Hence, the solutions of various model compounds (Figures 5.1 and 5.2) were
sonicated with PdCl2 prior to introduction into the APCI source of a mass spectrometer.
Figure 5.1 Model compounds containing the 3-phenylallyl alcohol moiety

115
Figure 5.2 Model compounds without 3-phenylallyl alcohol moiety
Solutions of some of the model compounds containing a double bond formed an
orange-red color upon sonication with PdCl2. However, solutions of those model
compounds that contain the 3-phenylallyl alcohol moiety developed a significant
brownish orange color along with the precipitation of black elemental palladium. The
brown color was also observed for model compounds containing carbon-carbon double
bonds but no hydroxyl group on prolonged treatment with PdCl2 whereas no color change
was observed for model compounds with no carbon-carbon double bonds, which
indicates that carbon-carbon double bonds are required for the color change. The color
change is likely an indication of the formation of a π-palladium complex with the model
compounds containing carbon-carbon double bonds in the sample solutions.9 The

116
sonicated sample solutions were filtered before introducing them into mass spectrometer
The filtrate thus obtained was yellowish green in color.
Based on the results obtained for the PdCl2 treated sample solutions, a reaction
had taken place between PdCl2 and the analytes containing carbon-carbon double bonds
in solution. In order to explore the influence of PdCl2 treatment on positive mode APCI,
solutions of model compounds 1 and 2, both containing the 3-phenylallyl alcohol
moiety, were sonicated from 1up to 10 minutes with PdCl2 and APCI mass spectra were
measured for the samples before and after this treatment. Before the treatment, only
(M+H-H2O)+ ions were observed but after the treatment, both (M-H)+ ions and (M+H-
H2O)+ ions were observed (Figure 5.3).

117
Figure 5.3 Positive mode APCI mass spectra of a) coniferyl alcohol (1) (MW 180 Da), and b) coniferyl alcohol sonicated with PdCl2.
As the sonication time was increased in a stepwise manner from 1 up to 10
minutes, an increase in the abundance of the (M-H)+ ion and a simultaneous decrease in
the abundance of the (M+H-H2O)+ ion was observed. For samples sonicated for 10
minutes, the (M-H) + ion was exclusively observed in the mass spectra. In order to test
the effect of a sonication time longer than 10 minutes, a solution of compound 2 was
sonicated with PdCl2 for 20 minutes before analysis. The mass spectrum collected shows
(M+H-H2O)+ and (M+H-H2O-CH2O)+ ions along with the (M-H)+ ion (Figure 5.4),
which indicates that the primary products formed upon treatment with PdCl2 in solution
may have undergone secondary reactions on prolonged sonication. Based on these

118
observations, a sonication time of 10 minutes with PdCl2 was used to prepare samples for
the additional mass spectral analysis discussed below.
Figure 5.4 Positive mode APCI mass spectrum measured after treating compound 2 for 20 minutes with PdCl2.
In order to test the effect of the amount of PdCl2 on analysis, coniferyl alcohol solutions
were treated with various equivalents of PdCl2. The sample solutions that were treated for
10 minutes with less than 10 equivalents of PdCl2 generated both (M-H)+ ions and
(M+H-H2O)+ ions upon APCI. Treatment of the sample solutions with 10 equivalents of
PdCl2 for 10 minutes primarily produced (M-H)+ ions upon APCI. Hence, these
conditions were used in the following experiments.

119
The above results suggest that the observation of increasing amounts of (M-H)+
ions and decreasing amounts of (M+H-H2O)+ ions upon APCI when the sonication time
of the two analytes containing the 3-phenylallyl alcohol functionality was increased is
due to more complete oxidation of the allyl alcohol to the corresponding aldehyde. The
aldehyde gets protonated upon APCI to produce an ion with m/z ratio equal to that of the
(M-H)+ ions of the precursor allyl alcohol. On the other hand, when the allyl alcohol gets
protonated upon APCI, it readily loses H2O to produce the (M+H-H2O)+ ions. This
proposal is supported by literature as oxidation of an alcohol to the corresponding
carbonyl compound by Pd(II) has been reported, leading to a black precipitate of
Pd(0).10,12
In order to probe the above hypothesis, CAD of the (M-H)+ ion formed for
compund 1 after PdCl2 treatment was compared to CAD of protonated authentic 4-
hydroxy-3-methoxycinnamaldehyde, the expected product aldehyde. The CAD spectra
were found to be identical, which supports the proposal that the (M-H)+ ion is protonated
4-hydroxy-3-methoxycinnamaldehyde.
In order to figure out how general the above observation is, several additional
model compounds were studied (Figures 5.1 and 5.2). All the model compounds
containing the 3-phenylallyl alcohol moiety (1-6) generated abundant (M-H)+ ions upon
APCI after treating the sample solutions with PdCl2 (Figure 5.5). Compounds 14 and 15
(Figure 5.2) are structurally similar to compounds 1-6 except for the absence of the
hydroxyl group on the alkyl chain. When 14 and 15 were not treated with PdCl2,
predominant (M+H)+ ion (Figure 5.5) was observed in the mass spectrum upon APCI.
When these compounds were treated with PdCl2, no (M-H)+ ions were observed, in

120
agreement with above suggestion that the hydroxyl group must be present in the analyte
for the oxidation to take place in solution. (M-H+H2O)+ and (M-H+CH3OH)+ ions were
formed upon APCI for PdCl2 treated 14 and 15. The reason for this is currently unknown.
Compounds 5 and 6, in which one olefinic hydrogen was replaced by a methyl group,
yielded abundant (M-H)+ ions when using PdCl2 but required a longer sonication time of
20 minutes (Figure 5.6).
Figure 5.5 Positive mode APCI mass spectra of a) isoeugenol (15) (MW 164 Da) and b) isoeugenol sonicated with PdCl2

121
Figure 5.6. Positive mode APCI mass spectrum of a) compound 5 sonicated for 10 minutes with PdCl2, b) compound 5 sonicated for 20 minutes with PdCl2, c) compound 6 sonicated for 10 minutes with PdCl2, and d) compound 6 sonicated for 20 minutes with PdCl2.
The mass spectra measured with and without PdCl2 treatment for compound 7,
in which both allylic hydrogens have been replaced by methyl groups, are identical
(Figure 5.3) and show the exclusive formation of the (M+H-H2O)+ ions. This finding
supports the above proposal that oxidation of the allyl alcohol moiety of these analytes
occurs in solution upon sonication with Pd(II). A possible mechanism for the oxidation
of the allyl alcohol moiety to an aldehyde is shown in Scheme 5.1.
a
b
c
d

122
Scheme 5.1. A possible mechanism for the oxidation of compounds containing the 3-phenylallyl alcohol moiety
Figure 5.7 Positive mode APCI mass spectra of (E)-2-methyl-4-phenylbut-3-en-2-ol (7) (a) before and (b) after 10 minute sonication with 10 equivalents of PdCl2 Compound 10 (methyl stearate) formed a protonated molecule upon traditional
a
b
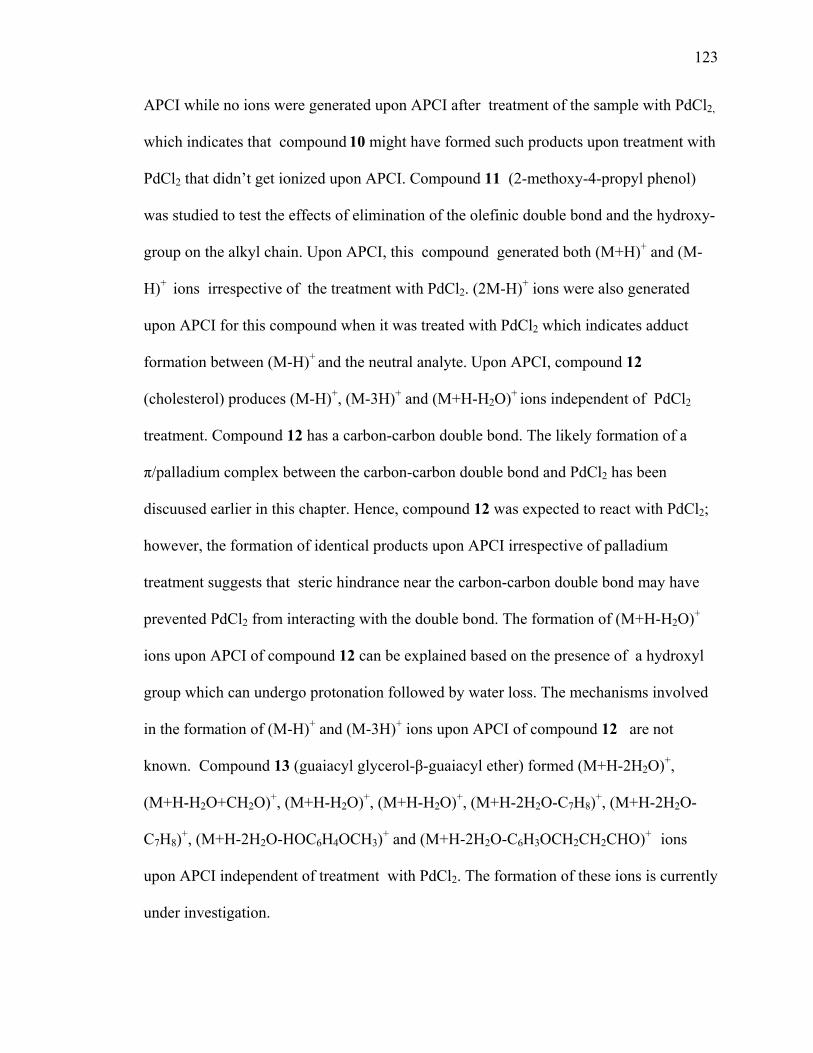
123
APCI while no ions were generated upon APCI after treatment of the sample with PdCl2,
which indicates that compound 10 might have formed such products upon treatment with
PdCl2 that didn’t get ionized upon APCI. Compound 11 (2-methoxy-4-propyl phenol)
was studied to test the effects of elimination of the olefinic double bond and the hydroxy-
group on the alkyl chain. Upon APCI, this compound generated both (M+H)+ and (M-
H)+ ions irrespective of the treatment with PdCl2. (2M-H)+ ions were also generated
upon APCI for this compound when it was treated with PdCl2 which indicates adduct
formation between (M-H)+ and the neutral analyte. Upon APCI, compound 12
(cholesterol) produces (M-H)+, (M-3H)+ and (M+H-H2O)+ ions independent of PdCl2
treatment. Compound 12 has a carbon-carbon double bond. The likely formation of a
π/palladium complex between the carbon-carbon double bond and PdCl2 has been
discuused earlier in this chapter. Hence, compound 12 was expected to react with PdCl2;
however, the formation of identical products upon APCI irrespective of palladium
treatment suggests that steric hindrance near the carbon-carbon double bond may have
prevented PdCl2 from interacting with the double bond. The formation of (M+H-H2O)+
ions upon APCI of compound 12 can be explained based on the presence of a hydroxyl
group which can undergo protonation followed by water loss. The mechanisms involved
in the formation of (M-H)+ and (M-3H)+ ions upon APCI of compound 12 are not
known. Compound 13 (guaiacyl glycerol-β-guaiacyl ether) formed (M+H-2H2O)+,
(M+H-H2O+CH2O)+, (M+H-H2O)+, (M+H-H2O)+, (M+H-2H2O-C7H8)+, (M+H-2H2O-
C7H8)+, (M+H-2H2O-HOC6H4OCH3)
+ and (M+H-2H2O-C6H3OCH2CH2CHO)+ ions
upon APCI independent of treatment with PdCl2. The formation of these ions is currently
under investigation.

124
Compound 16 (guaiacol) doesn’t produce any signal with traditional APCI.
However minor (M+H-H2O)+ and (M+H-H2O+CH3OH)+ ions were observed after
treatment with PdCl2.The reasons for the formation of above ions are unkown.
Compound 17 (3-phenyl-2-propyn-1-ol) with a carbon-carbon triple bond produced
(M+CH3)+, (M+H)+, (M+CH3-CH2O)+ and (M+H+CH3OH)+ ions upon traditional APCI.
When treated with PdCl2, (2M-H)+, (2M-H+CH3)+, (dimer-3H)+, (dimer-H + CH2O)+,
(trimer-3H)+, and (dimer-H+CH3-CO)+ were observed upon APCI. Formation of these
products is not understood at this time.
Compound 8 (trans-2-octenol) was studied in order to assess the role of the
benzene ring in the formation of (M-H)+ ions upon APCI after treating samples with
PdCl2. This compound formed (M+H-H2O)+ ions upon APCI when not treated with
PdCl2 and (M-H+CH3OH)+ ions (Figure 5.8) upon APCI after being treated with PdCl2.
This result indicates that benzene ring is not required for the oxidation.

125
Figure 5.8. Positive mode APCI mass spectrum of trans-2-octenol (8) (MW 128 Da) (a) before and (b) after sonication with PdCl2 .
The feasibility of the above method in identifying the 3-phenylallyl alcohol
moiety in molecules in complex mixtures was assessed by studying a real degraded lignin
sample provided by Dr. Joseph J. Bozell, University of Tennessee. The APCI mass
spectra measured for this sample with and without PdCl2 were identical (Figure 5.8),
which indicates the absence of any major components with the 3-phenylallyl alcohol
moiety in the sample. The degraded lignin sample was spiked with a 100 µL of 1mM
solution of compound 1 and / or compound 4 (these model compounds contain the 3-
a
b

126
phenylallyl alcohol moiety) and mass spectra were collected before and after treatment
with PdCl2. Upon APCI, compounds 1 and 4 produced (M+H-H2O)+ ions before treating
the mixture with PdCl2 while after treating with PdCl2, (M-H)+ ions were produced for 1
and 4 (Figures 5.9, 5.10 and 5.11). These observations suggest that the presence of
degradation products containing the 3-phenylallyl alcohol moiety at 1mM concentrations
can be detected upon APCI by using PdCl2 pretreatment.
Figure 5.9. Positive mode APCI mass spectra of a degraded lignin sample (a) without and (b) with PdCl2 treatment.
a
b

127
Figure 5.10. Positive mode APCI mass spectra of a degraded lignin sample spiked with coniferyl alcohol (1) (a) before and (b) after treatment with PdCl2.
a
b
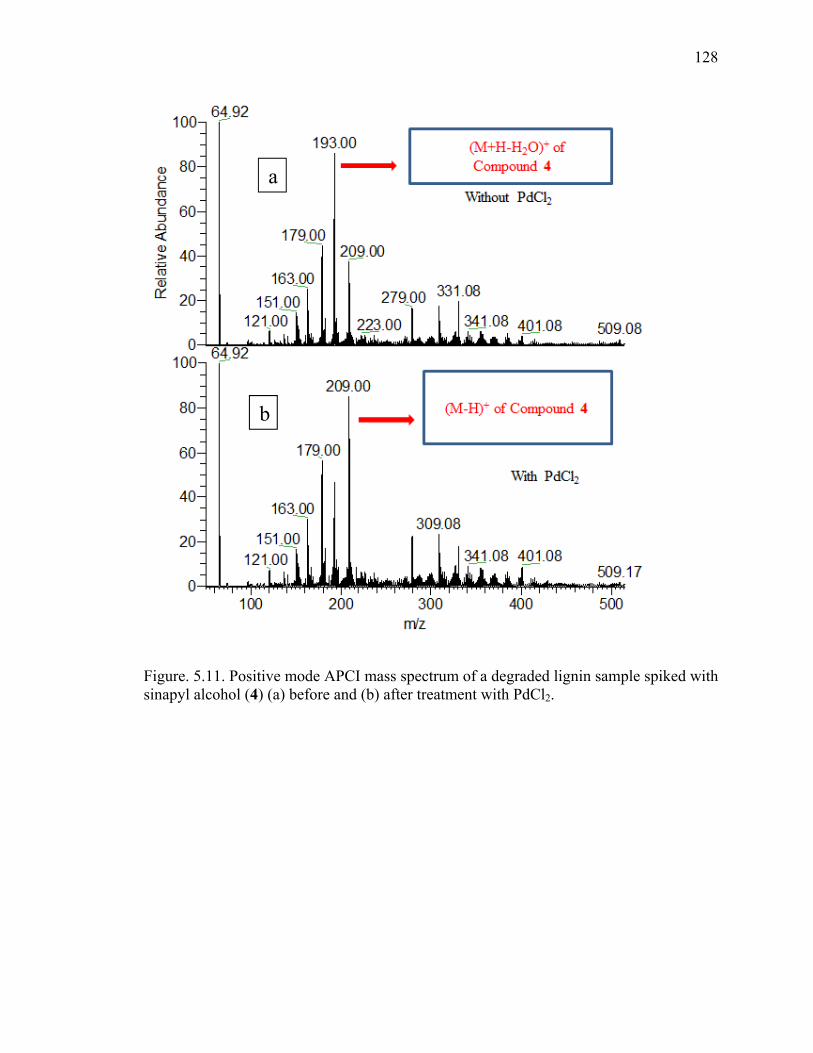
128
Figure. 5.11. Positive mode APCI mass spectrum of a degraded lignin sample spiked with sinapyl alcohol (4) (a) before and (b) after treatment with PdCl2.
a
b

129
Figure 5.12. Positive mode APCI mass spectrum for a degraded lignin sample spiked with sinapyl alcohol (4) and coniferyl alcohol (1) (a) before and (b) after treatment with PdCl2.
a
b

130
5.4 Conclusions
Sonication with PdCl2 was found to cause oxidation of compounds containing the
3-phenylallyl alcohol moiety. PdCl2 forms a π-complex with the model compounds
containg carbon-carbon double bonds, followed by β-hydride abstraction by palladium
and oxidation of the alcohol moiety. Support for this mechanism is provided by the
observation that model compounds containing carbon-carbon double bonds developed a
significant yellowish green color along with deposition of black precipitate upon
sonication with PdCl2 The color signifies the formation of a π- complex6 and the black
precipitate is due to reduction of Pd(II) to Pd(0) during oxidation of the alcohol to the
carbonyl moiety.7 Upon APCI, the oxidized compounds produced an abundant
protonated molecule with an m/z-value identical to that of (M-H)+ ions of the original
allyl alcohol with no fragmentation.The model compounds containing a carbon-carbon
double bond but no hydroxy groups on the alkyl chain predominantly displayed (M-
H+H2O)+ ions upon APCI. These ions are formed by protonation of the allyl alcohol
moiety followed by the loss of H2O. Compounds with methyl substitution on the olefinic
double bond are not oxidized by PdCl2, in agreement with above discussion.To assess the
viability of PdCl2 pre-treatment combined with APCI mass spectrometric analysis for the
detection of the 3-phenylallyl alcohol moiety in real degraded lignin mixtures, one such
sample was tested. The APCI mass spectra measured for the pre-treated and untreated
mixture were found to be identical, which suggested the absence of compounds with the
3-phenylallyl alcohol moeity in the sample studied. When the degraded lignin sample
was spiked by known amounts of coniferyl and sinapyl alcohols and exposed to the PdCl2
treatment, APCI revealed formation of abundant (M-H)+ ions. Hence, detection of

131
compounds with the 3-phenylallyl alcohol moiety was possible in this mixture of lignin
degradation products, which indicates that the lignin sample examined did not contain
large amounts of those compounds.

132
5.5 References 1 Lora, J. H.; Glasser, W.G. J. Polym. Environ. 2002, 10, 39-48. 2 Brebu, M.; Vasile, C. Cellulose Chem. Technol. 2010, 44,353-363. 3 Samantha, R.; Alessandra, D. T.; Nicoletta, S.; Francesco, D.A. Mass Spec. Rev. 2004, 23, 87- 126. 4 Haupert, L. J.; Owen, B. C.; Marcum, C. L.; Jarrell, T.M.; Pulliam, C. J.; Amundson, L.M.; Narra, P.; Aqueel, M.S.; Parsell,T.; Mahdi M. A.; Kenttämaa, H.I. Fuel 2012, 95, 634-641. 5 Pecina, R.; Burtscher, E.; Bonn, G.; Bobleter, O.; Fresenius, Z. Anal. Chem. 1986,325,461- 465. 6 Saiz-Jimenez; C.; de Leeuw, J.W. Org. Geochem. 1986, 10, 869-876. 7 Chrisope, D.R.; Beak, P. J. Am. Chem. Soc. 1986, 108, 334-335. 8 Engelin, C. J.; Fristrup, P. Molecule 2011, 16, 951-969. 9 Schultz, R. G.; US Patent 3,446,825, 1969.

133
CHAPTER 6: A CAD STUDY ON IONIZED MODEL COMPOUNDS OF ASPHALTENES
6.1 Introduction
The asphaltene fraction of crude oil contains the largest and most aromatic
molecules of petroleum and is commonly used as tar-mats on roads. Asphaltenes
represent a constituent of crude oil that is insoluble in n-heptane but soluble in
toluene.1,2Asphaltenes’ negative impact on pollution (due to their high sulfur content),
fouling of catalysts, formation of deposits during production and processing of crude oil,
corrosion,and formation of emulsions make asphaltenes problematic for the refining
industry and society at large.3-6Asphaltenes are of growing importance in the oil industry
due to the depletion of light crude oil reserves, leading to a shift towards heavier reserves
that are rich with asphlatenes.4,5,6. Asphaltenes are generally thought to contain one or
more aromatic cores with alkyl chains attached to them. Analysis of volatile pyrolysis
products of asphaltenes has suggested that a considerable fraction of the aromatic cores
are made up of small aromatic systems (1-5 fused benzene rings) while the lengths of the
aliphatic chains attached to the aromatic cores range in size up to 40 carbon atoms.7 In
order to test this proposal, we have synthesized asphaltenes’ model compounds
containing alkyl side chains of varying lengths attached to aromatic cores with varying
sizes. The fragmentation behavior of ions derived from these model compounds was

134
studied by collision-activated dissociation (CAD) and compared to fragmentation
reactions of ions derived from asphaltenes. These studies yielded information about the
influence of the aromatic core size and alkyl side chain length on the fragmentation
behavior of molecular ions of molecules related to asphaltenes.
6.2 Experimental
The asphaltene model compounds were synthesized using known literature
procedures. The model compounds were dissolved in carbon disulfide. Carbon disulfide
(>99.9%) was purchased from Sigma Aldrich (St.Louis, MO) and used without
purification.Tandem mass spectrometry experiments were performed using a Finnigan
LTQ linear quadrupole ion trap (LQIT) mass spectrometer. Asphaltene model
compounds were dissolvedin CS2and introduced into the APCI source via direct infusion
at 30 μL per minute from a Hamilton 500 μL syringe by using the instrument’s
integrated syringe pump. Molecular ions were generated and selected ions with m/z
values of 50 - 750 were isolated with an isolation width of two m/z-units and subjected to
CAD. The collision energy for CAD was controlled via the instrument’s software and it
was varied from 35 up to 50 (arbitrary units) to vary the extent of fragmentation.
Geometries and zero-point energies for the bond dissociation energies of 9-
ethylanthracene and ethylbenzene were calculated by James Riedeman at the B3LYP/6-
31G(d,p) level of theory using the Gaussian 09 suite of programs.8Frequency
calculations were performed to verify stationary points as minima. Bond dissociation
energies were calculated as the difference between the energy of the dissociated and
undissociated molecular ion

135
MCHCHMBDE EEEH )(
33 ][ Eq. 6.1
whereM = ethylbenzene or 9-ethylanthracene.
6.3 Results and Discussion
A total of eight asphaltene model compounds containing alkyl side chains of varying
lengths and aromatic cores with different sizes (Figure 6.1) were synthesized using
modified literature methods9 and studied via APCI/CAD tandem mass spectrometry. The
model compounds 1-8 were ionized using positive mode APCI with CS2 dopant to
generate stable molecular ions that were subjected to CAD. MS2 studies were carried out
on all the model compounds (Table 6.1).

136
Figure 6.1 Asphaltene model compounds studied

137
Table 6.1 MS2spectraa,b measured for asphaltene model compounds ionized by (+) APCI/CS2 and subjected to CAD Analyte( MW) MS(m/z) MS2CAD fragments
(m/z) [branching ratioc]
hexylbenzene (1)
162 [M ] 147 [05%] 134 [06%] 133 [32%] 120 [05%] 119 [11%] 105 [11%] 92 [30%]
246 [M ] 231 [13%] 217 [02%] 203 [02%] 189 [02%] 175 [11%] 161 [03%] 148 [09%] 133 [19%] 119 [02%] 92 [12%] 91 [03%]
212 [M ] 183 [16%] 142 [84%]
296 [M ] 263 [29%] 183 [18%] 142 [53%]
262 [M ] 191 [94%] 178 [06%]

138
Table 6.1, continued. Analyte( MW) MS(m/z) MS2CAD fragments
(m/z) [branching ratio]
9-dodecylanthracene (6)
346 [M ] 191 [92%] 178 [08%]
1-hexylpyrene (7)
386 [M ] 215 [100%]
1-dodecylpyrene (8)
370 [M ] 215 [100%]
Collision energy: a 20(arbitrary units), bActivationq = 0.5, cbranching ratios only include fragmentsionswith a relative abundance 5 % or higher relativeto the base peak.

139
6.3.1 Hexylbenzene (1) and Dodecylbenzene (2)
Figure 6.2 CAD mass spectrum of the molecular ion of hexylbenzene(1)
Molecular ion of hexylbenze (1) showspredominantly five major losses, C2H5, C3H7,
C4H9, C5H11 and CH3 loss. Ethyl loss and formation of anion of m/z 92 are dominant due
to the involment of a favorable 6-membered transition state in their formation. Formation
of the ion of m/z 92 (C7H8+●) is explained by McLafferty rearrangement of the
hexylbenzene molecularion (Scheme 6.1).

140
Scheme 6.1 Formation of ion of m/z 92.
Figure 6.3 CAD mass spectrum of the molecular ion of dodecylbenzene(2)
Molecular ion of dodecylbenzene (2) shows the cleavage of methyl, ethyl, propyl,
butyl, pentyl, hexyl, heptyl,octyl,nonyl and decyl groups. It also shows predominant

141
formation of radical cations of m/z 92 and 148. The formation of the ion of m/z 92 likely
occurs as shown in Scheme 6.2.
Scheme 6.2 Mechanism for the formation of ions of m/z 92.

142
6.3.2 Hexylnaphthalene (3) and Dodecylnaphthalene (4)
Figure 6.4 CAD mass spectrum of the molecular ion of hexylnaphthalene (3)
CAD of the molecular ion of hexylnaphthalene (3) undergoes predominantly two
cleavages. One of them leads to the loss of an ethyl group (fragment ion of m/z 183). The
major fragmentation leads to formation of a radical cation of m/z 142 (Figure 6.3) via
McLafferty rearrangement as shown in Scheme 6.3.

143
Scheme 6.3 Mechanism for the formation of ion of m/z 142 from the molecular ion of hexylnaphthalene 3.
Figure 6.5CAD mass spectrum of molecular ion of dodecylnaphthalene (4)
CAD of themolecular ion of dodecylnaphthalene 4 results in cleavage of an octyl
group to yield an ion of m/z 183 and a benzylic cleavage to yield an ion of m/z 142, just

144
like the molecular ion of 3. Formation of the ion of m/z 142 can be explained as shown in
Scheme 6.3.The mechanism of formation of the ion of m/z 263 is unknown.
6.3.3 9-Hexylanthracene(5)and9-Dodecylanthracene (6)
Figure 6.6 CAD mass spectrum of the molecular ion of 9-hexylanthracene (5)
Molecular ion of 9-hexylanthracene (5) shows a predominantα-cleavageinvolving
the loss of a pentyl group.It also forms an ion of m/z 178 via the cleavage of a hexyl
group. This fragmentation is substantially slower than the α–cleavage.

145
Figure 6.7 CAD mass spectrum of the molecular ion of 9-dodecylanthracene (6)
CAD mass spectrum of themolecular ion of dodecylanthracene (6) reveals the
same fragmentations as for the molecular ion of 5

146
Figure 6.8 CAD mass spectrum of the molecular ion hexylpyrene (7)
6.3.4 Hexylpyrene (7) and Dodecylpyrene (8)
Upon CAD, themolecular ion of hexylpyrene (7)exclusively shows a benzylic
bond cleavage to form the ion of m/z 215.

147
Figure 6.9 CAD mass spectrum of the molecular ion dodecylpyrene(8)

148
Ionized dodecylpyrene (8) exclusively undergoes α-cleavage, it doesn’t form any
otherfragments.
Figure 6.10 Comparison of theCAD massspectra of themolecular ions of (a) hexylbenzene, (b)hexylnaphthalene, (c)hexylanthracene,and(d)hexylpyrene

149
Figure 6.11 Comparison of theCAD massspectra of themolecular ions of (a) dodecylbenzene, (b)dodecylnaphthalene, (c) 9-dodecylanthracene,and (d)dodecylpyrene
Comparative CAD studies of themolecular ions of hexyl group containing aromatic
compounds (Figure 6.10) and dodecyl group containing aromatic compounds (Figure
6.11) reveals that as the aromatic core size increases the extent of α-cleavages increases.
This is likelydue to the more extensive delocalization of the π-electrons in the

150
largeraromaticring system.Aromatic systems with hexyl or dodecyl side chains appear to
have decreased fragmentation barriers The fragmentation pathways were found to be
similar for both dodecyl and otheralkyl side chain containing aromatic systems. Once the
dodecyl side chain losses a hexyl group, it behaves as hexyl aromatic (Figures
6.10,and6.11).
6.3.5 Bond Dissociation Energies for Ethylbenzene and 9-Ethylanthracene
Figure 6.12 Calculated enthalpies for benzylic cleavages in the molecular ions of 9-ethylanthracene (top) and ethyl benzene (bottom).
In order to investigate above fragmentations further, the enthalpies for benzylic
cleavages in the molecular ions ofethylbenzene and 9-ethylanthracene were calculated at
the B3LYP/6-31G(d,p) level of theory (Figure 6.9). Bond dissociation energies for the
benzylic C—C bonds would be expected to be lower for the larger ring systems ifsince
the McLafferty rearrangement is not a favorable pathway for these ions. However, the
bond dissociation energy for the benzylic C—C bond for the molecular ion of9-
∆ 50.4
∆ 39.2

151
ethylanthracene was found to be 11 kcal mol-1 higher than for the molecular ion
ofethylbenzene. A plausible explanation for this behavior is that the extent of
delocalization experienced by the unpaired electron is greater for the larger ring systems.
This makes the McLafferty rearrangement a less likely pathway for anthracene when
compared to smaller ring systems such as benzene
6.4 Conclusions
Ionized hexylpyrene7 and dodecylpyrene 8 exclusively undergobenzylic bond
cleavages whereas ionizeds9-hexylanthracene 5 and 9-dodecylanthracene
6undergoalsoadditional fragmentations. Ionized hexylnaphthalene3 and
dodecylnaphthalene4 also undergo benzylic bond cleavages but the extent of this
cleavage is decreased and they also form otherfragment ionsas well. Molecular ions of
hexylbenzene1 and dodecylbenzene2 undergo intramolecular reaction with the aromatic
core to produce odd electron fragment ions. As the core size increases from benzene to
pyrene, the extent of the α-cleavage increases. The possible reason for this is that the
radical and charge sites are much more delocalized in a pyrene than in benzene system.
The presence of different alkyl side chainsin the aromatic ringsystem does not affect the
fragmentation pattern of the molecular ions of the alkyl aromatic compounds.

152
6.5 References 1 Buckley, J.S.Fuel Sci. Tech. Internat. 1996, 14, 55. 2Sirota, E.B. Energy Fuels 2005, 19, 1290. 3 Mullins, O. C.; Sheu, E. Y.; Hammami, A.; Marshall, A. G. Asphaltenes, Heavy Oils, and Petroleomics; Springer: New York, 2007.
4Ancheyta, J.; Betancourt, G.; Centeno, G.; Marroquin, G.; Alonso, F.; Garciafigueroa, E. Energy Fuels,2002, 16, 1438–1443. . 5Ancheyta, J.; Betancourt, G.; Marroquin, G.; Centeno, G.; Castaneda, L. C.; Alonso, F.; Munoz, J. A.; Gomez, M. T.; Rayo, P. Appl.Catal. A, 2002, 233, 159. 6Ancheyta, J.; Betancourt-Rivera, G.; Marroquin-Sanchez, G.;Perez-Arellano, A. M.; Maity, S. K.; Cortez, T.; del Rio-Soto, R. Energy Fuels2001, 15, 120. 7Calemma, V.;RausaR’Antona, P. D.;MontanariL. Energy Fuels 1998, 12, 422. 8Frisch, M. J.; Trucks, G. W.; Schlegel, H. B.; Scuseria, G. E.; Robb, M. A.; Cheeseman, J. R.; Scalmani, G.; Barone, V.; Mennucci, B.; Petersson, G. A.; Nakatsuji, H.; Caricato, M.; Li, X.; Hratchian, H. P.; Izmaylov, A. F.; Bloino, J.; Zheng, G.; Sonnenberg, J. L.; Hada, M.; Ehara, M.; Toyota, K.; Fukuda, R.; Hasegawa, J.; Ishida, M.; Nakajima, T.; Honda, Y.; Kitao, O.; Nakai, H.; Vreven, T.; J. A. Montgomery, J.; Peralta, J. E.; Ogliaro, F.; Bearpark, M.; Heyd, J. J.; Brothers, E.; Kudin, K. N.; Staroverov, V. N.; Keith, T.; Kobayashi, R.; Normand, J.; Raghavachari, K.; Rendell, A.; Burant, J. C.; Iyengar, S. S.; Tomasi, J.; Cossi, M.; Rega, N.; Millam, J. M.; Klene, M.; Knox, J. E.; Cross, J. B.; Bakken, V.; Adamo, C.; Jaramillo, J.; Gomperts, R.; Stratmann, R. E.; Yazyev, O.; Austin, A. J.; Cammi, R.; Pomelli, C.; Ochterski, J. W.; Martin, R. L.; Morokuma, K.; Zakrzewski, V. G.; Voth, G. A.; Salvador, P.; Dannenberg, J. J.; Dapprich, S.; Daniels, A. D.; Farkas, O.; Foresman, J. B.; Ortiz, J. V.; Cioslowski, J.; Fox, D. J.; Revision C.01 ed.; Gaussian Inc.: Wallingford CT, 2010.
9Bullock, J. E.; Carmieli, R.; Mickley, S. M.;Vura-Weis, J.; Wasielewski, M, R. J. Am. Chem. Soc. 2009, 131, 11919.

VITA

153
VITA
Mohammad Sabir Aqueel was born on March 5, 1983 in Hyderabad, India. His
elementary school and high school years were spent in Hyderabad. He was passionate
about pursuing a career in medicine hence opted biological sciences and physical
sciences as major subjects. But as he grew older he felt inclined towards the field of
scientific research especially in the field of chemistry, He joined Osmania University,
India to Pursue his Bachelors of Science(B.Sc.) with Chemistry, Zoology and Computer
Applications as major subjects. He later pursued an MS in chemistry from Western
Illinois University, Macomb, IL. While at Western Illinois University he carried out
research in the field of medicinal chemistry with prime focus on mycobacterium
tuberculosis under the guidance of Dr. Ashish K. Pathak. It was while at Western Illinois
University he wanted to hone his analytical research capabilities that intrigued him to
apply to Purdue University where the most excellent analytical research is carried. he
joined department of chemistry at Purdue University in 2008 to pursue his PhD in
analytical chemistry. Sabir joined Professor Hilkka I. Kenttämaa’s research group, where
her everlasting interest in research fascinated him. He worked very hard on the gas-phase
reactivity studies of tridehydropyridinium cations, method development, development of
ionization method for hydrocarbons. He was granted the Doctor of Philosophy degree in
chemistry from Purdue in December, 2014.

PUBLICATIONS

DOI: 10.1002/chem.201103628
Reactivity of the 4,5-Didehydroisoquinolinium Cation
Nelson R. Vinueza,[a] Enada F. Archibold,[a] Bartłomiej J. Jankiewicz,[a, b]
Vanessa A. Gallardo,[a] Steven C. Habicht,[a] Mohammad Sabir Aqueel,[a]
John J. Nash,[a] and Hilkka I. Kentt�maa*[a]
Introduction
Didehydroarenes and their derivatives are reaction inter-mediates that have been known for more than 60 years.[1]
Two decades of studies have identified the crucial role of di-dehydroarenes in the biological action of certain antitumorantibiotics, which has led to a renewed interest in the prop-erties of these aromatic carbon-centered s,s-biradicals.[2]
However, condensed-phase studies of organic biradicals arechallenging due to the difficulty in generating them cleanlyin solution. In fact, condensed-phase studies have led to anin-depth understanding of the chemical behavior of onlyone of the didehydroarenes, 1,2-didehydrobenzene (ortho-benzyne) and its derivatives.[1] Many of the issues that com-plicate the studies of highly reactive species in condensedphases are less problematic in the gas phase. One way tostudy reaction intermediates in the gas phase involves thewell-known distonic ion approach[3] wherein a chemicallyinert charged group is attached to the reactive intermediateof interest so that it can be manipulated in a mass spectrom-
eter. Previous studies carried out by using this approachhave demonstrated that the reactivity of charged 1,2-didehy-droarenes in the gas phase is analogous to that reported fortheir neutral analogs in solution.[4] A comparison of the re-activity[3a,b,5] of charged 1,2-didehydroarenes to that of 1,3-didehydroarenes in the gas phase has revealed drastic differ-ences that partially reflect the differences in their singlet–triplet gaps (DEST). The magnitude of DEST for singlet birad-icals is thought to affect their ability to undergo radical reac-tions due to the requirement for partial uncoupling of thebiradical electrons in the transition state.[6] Consequently,a higher DEST is expected to lead to higher barriers andslower radical reactions. Indeed, 1,2-didehydroarenes (withlarge DEST) have been found to react like activated alkynesand rapidly undergo nucleophilic or electrophilic additionreactions rather than radical reactions.[4,5b] However, gas-eous 1,3-didehydroarenes (often with just slightly lowerDEST than 1,2-didehydroarenes) have been demonstrated toundergo both radical and nonradical reactions, dependingon their dehydrocarbon atom separation.[5a] A greater dehy-drocarbon atom separation facilitates radical reactions for1,3-didehydroarenes. Didehydroarenes with more than oneheavy atom between the dehydrocarbon atoms (and lowerDEST), such as the 4,6-didehydroisoquinolinium cation, havebeen demonstrated to react exclusively via radical mecha-nisms.[7]
The 1,8-didehydronaphthalene (1) has been a focus of at-tention for some time. Based on the computational studiesof Squires and Cramer,[8] the 1,8-isomer is an especially in-teresting 1,3-didehydroarene since the lowest lying singletand triplet states are calculated to be nearly degenerate(DEST=�0.9 kcalmol�1) due to the parallel orientation ofthe formally singly occupied nonbonding molecular orbitals.
Abstract: The chemical properties ofa 1,8-didehydronaphthalene derivative,the 4,5-didehydroisoquinoliniumcation, were examined in the gas phasein a dual-cell Fourier-transform ion cy-clotron resonance (FT-ICR) mass spec-trometer. This is an interesting biradi-cal because it has two radical sites inclose proximity, yet their coupling isvery weak. In fact, the biradical is cal-culated to have approximately degener-
ate singlet and triplet states. This birad-ical was found to exclusively undergoradical reactions, as opposed to otherrelated biradicals with nearby radicalsites. The first bond formation occurs
at the radical site in the 4-position, fol-lowed by that in the 5-position. Theproximity of the radical sites leads toreactions that have not been observedfor related mono- or biradicals. Inter-estingly, some ortho-benzynes havebeen found to yield similar products.Since ortho-benzynes do not react viaradical mechanisms, these productsmust be especially favorable thermody-namically.
Keywords: biradicals · didehydro-naphthalene · FT-ICR · ion–mole-cule reactions · reactive intermedi-ates
[a] Dr. N. R. Vinueza, E. F. Archibold, Dr. B. J. Jankiewicz,V. A. Gallardo, Dr. S. C. Habicht, M. S. Aqueel, Dr. J. J. Nash,Prof. H. I. Kentt�maaDepartment of Chemistry, Purdue University560 Oval Drive, West Lafayette, IN 47907-2084 (USA)Fax: (+1)765-494-0359E-mail : [email protected]
[b] Dr. B. J. JankiewiczCurrent Address: Institute of OptoelectronicsMilitary University of TechnologyGen. Sylwestra Kaliskiego 2, 00-908 Warsaw (Poland)
Supporting information for this article is available on the WWWunder http://dx.doi.org/10.1002/chem.201103628.
� 2012 Wiley-VCH Verlag GmbH&Co. KGaA, Weinheim Chem. Eur. J. 2012, 18, 8692 – 86988692
154

This didehydroarene represents a rare case wherein the cou-pling between the biradical electrons is very weak eventhough the radical sites are spatially close. These character-istics should result in interesting chemical properties. Previ-ous experimental work on this biradical in solution by Reesand Storr[9] revealed that it abstracts two hydrogen atomsfrom cyclohexane and undergoes 1,2-addition to benzeneand to olefins. Later, Nakayama et al.[10] examined the reac-tion of 1 with carbon disulfide (Scheme 1) since aryl radicals
were known to add to this reagent.[11] Indeed, 1 was foundto add to a sulfur atom to yield several products. Two ofthese products, the naphtho ACHTUNGTRENNUNG[1,8-bc]thiete (3) and thenaphthoACHTUNGTRENNUNG[1,8-bc]thiophen-2-thione (4), provided evidence forthe formation of a 1,5-biradical intermediate (2).
Following this work, de Luca et al.[12] examined the reac-tion of 1 with diphenyl disulfide (Scheme 2) and identifiedbenzo[kl]thioxanthene (6), 1-naphthylphenylsulfide (7) andnaphthoACHTUNGTRENNUNG[1, 8-bc]thiete (3) as the final products. All theseproducts were thought to be formed via a radical intermedi-ate (5) produced by the attack of 1 on the sulfur atom of thediphenyl disulfide.
Herein, we report a kinetic reactivity study on a positivelycharged analog of 1,8-didehydronaphthalene, the 4,5-dide-hydroisoquinolinium cation (8) (Figure 1). Its reactivity iscompared to that of two related monoradicals (4-dehydroi-soquinolinium cation[7] 9 and 5-dehydroisoquinoliniumcation[7] 10) (Figure 1) and two isomeric biradicals, the unre-
ported 1-isoquinolyl cation 11 and the previously reported4,6-didehydroisoquinolinium cation[7] 12 (Table 1, Figure 1).The 4,5-didehydroisoquinolinium cation (8) is calculated tohave nearly degenerate low-lying singlet and triplet states(DEST=�0.6 kcalmol�1).
Results and Discussion
The five positively charged radicals (8–12) studied in the gasphase in an FT-ICR mass spectrometer are shown inFigure 1. Their reactivity toward four reagents was investi-gated. The biradical of interest, 8, was found to yield similarproduct ions as the two related monoradicals (9 and 10 inTable 1), but also many additional product ions not observedfor these monoradicals. The latter products represent a com-bination of most of the product ions observed for biradicals11 and 12, in addition to some novel product ions. This find-ing was unexpected due to the structural differences be-tween these three biradicals and the drastically different re-activities of 11 (a 1,2-didehydroarene with a large DEST of�29.0 kcalmol�1 calculated[13] at the RHF-UCCSD(T)/cc-pVTZ//UBPW91/cc-pVDZ level of theory) and 12 (a 1,4-di-dehydroarene with a small calculated DEST; �0.7 kcalmol�1).
Both monoradicals 9 and 10 react predominantly by ab-straction of a hydrogen atom from tetrahydrofuran (THF),an iodine atom from allyl iodide (AI), a SCH3 group fromdimethyl disulfide (DMDS), and CN and HCN groups fromtert-butyl isocyanide (tBuNC), as expected[3a,5b] (Table 1).Monoradical 9 is more reactive than monoradical 10. Thiscan be explained by its higher electrophilicity,[14] which canbe quantified by using the calculated vertical electron affini-ty (EA; the energy released upon attachment of an electronto a radical site). The vertical EAs of 9 and 10 are calculat-ed to be 5.72 eV and 5.04 eV, respectively.[14a,15]
Biradical 12, which has two carbon atoms between theradical sites, yields reaction products analogous to those ob-tained for the related monoradical 9 and the unrelatedmono ACHTUNGTRENNUNGradical 10. For example, 12 reacts by the abstraction ofone (or two) hydrogen atoms from THF, two SCH3 groupsfrom DMDS, two CN groups from tBuNC, and two iodineatoms from AI. These reactions indicate that 12 reacts viatypical radical pathways. However, the addition of a secondradical site to monoradical 9 to generate biradical 12 resultsin a decrease in the reactivity, in spite of an increase in theEA. Biradical 12 likely reacts from both the singlet ground
Scheme 1. Reaction of biradical 1 with carbon disulfide.
Scheme 2. Reaction of biradical 1 with diphenyl disulfide.
Figure 1. The dehydro- and didehydroisoquinolinium cations studied.
Chem. Eur. J. 2012, 18, 8692 – 8698 � 2012 Wiley-VCH Verlag GmbH&Co. KGaA, Weinheim www.chemeurj.org 8693
FULL PAPER
155

state and the lowest-energy triplet state. The interaction(albeit weak) between the two biradical electrons in the sin-glet state of 12 may explain the reduced reactivity comparedto 9. However, 12 reacts at higher efficiencies than mono-radical 10, likely due to its much higher EA (5.99 eV;Table 1) than that of 10 (5.04 eV).[14,15]
Biradical 12, with a calculated DEST of �0.8 kcalmol�1
(Table 1), is an excellent biradical to compare with 8 (calcu-lated[14,15] EA 5.93 eV and DEST of �0.6 kcalmol�1) due totheir similar EA and DEST, and because 12 is thought toreact entirely via radical pathways.[7] Most of the reactionsof 12 were observed for 8 (e.g., two consecutive hydrogenatom abstractions from THF, two consecutive iodine atomabstractions from AI, two consecutive SCH3 group abstrac-tions from DMDS, and two consecutive CN group abstrac-tions from tBuNC), thus indicating that 8 also reacts via rad-ical mechanisms. However, a number of reactions were ob-
served for 8 that were not observed for 12 (e.g., CH2O ab-straction from THF, H2C=C=CH2 abstraction from AI, andSCH2 abstraction from DMDS), suggesting that the closeproximity of the two radical sites in 8 makes alternative re-action pathways possible. In spite of these additional reac-tion pathways, the reaction efficiencies of 8 and 12 are gen-erally similar. This finding suggests, as discussed above for12, that 8 reacts from both the singlet ground state and thelowest-energy triplet state. To better understand the effectsof two radical sites in close proximity, the reactivity of birad-ical 11 was examined.
Biradical 11, where the radical sites are on adjacentcarbon and nitrogen atoms, reacts faster than biradicals 8and 12 with almost all the reagents studied (Table 1), and itsreaction products differ drastically from those observed for12. This is likely due to the large DEST for 11 (Table 1). Thestrong through-space interaction between the formally un-
Table 1. Reaction efficiencies[a] and product branching ratios[b] for reactions of radicals 8–12 with various reagents.
H abs[c] 100% I absC3H5 (allyl) abs
94%6%
SCH3 abs 100% CN absHCN abs
96%4%
EA[d]=5.72 eV Efficiency=39% Efficiency=71% Efficiency=73% Efficiency=84%
H abs 100% I absC3H5 abs
98%2%
SCH3 abs 100% CN absHCN abs
94%6%
EA=5.04 eV Efficiency=8% Efficiency=36% Efficiency=48% Efficiency=63%
2�H absH abs(28) H absCH2O absH2O absC2H4 absH� absC3H3 absC2H4O absC3H6 abs
40%14%
25%6%6%5%2%1%1%
I abs(28) I abs(28) C3H5 absC3H4 (allene) abs
58%
42%
SCH3 abs(28) SCH3 absSCH2 absHSCH3 abs
51%
31%18%
HCN absCN abs(28) CN abs(28) HCN abs(28) addition
70%30%
EA=5.93 eVDEST
[e]=�0.6 kcalmol�1Efficiency=27%[f] Efficiency=42%[g] Efficiency=62%[h] Efficiency=55%[i]
H abs(28) H abs
100% I abs(28) I abs(28) C3H5 absC3H5 abs
92%
8%
SCH3 abs(28) SCH3 abs
100% CN abs(28) CN abs(28) HCN absHCN abs
88%
12%EA=5.99 eV
DEST[e]=�0.8 kcal mol-1
Efficiency=26% Efficiency=57% Efficiency=59% Efficiency=94%
CH2O absH2O abs
61%39%
additionC3H4 absC3H5 abs
72%21%6%
HSCH3 abs(28) SCH2 absSCH2 abs
92%
8%
HCN abs(28) C4H8 absC4H9 abs(28) H+ transfer
83%
17%
EA=6.35 eVDEST=�29.0 kcalmol�1
Efficiency=88% Efficiency=60%[j] Efficiency=54%[k] Efficiency[l]=106%
[a] Reaction efficiencies are reported as kreaction/kcollision�100. [b] Primary products� branching ratios; secondary products are noted as (28) and are listedunder the primary products that produce them. [c] abs=abstraction. [d] Calculated vertical electron affinities (EA) for 8, 9, 10, and 12 from reference[14]. [e] DEST calculated at the CASPT2/cc-pVDZ//MCSCF ACHTUNGTRENNUNG(12,12)//cc-pVDZ level of theory; reference [14b]. Note that a negative value means that thesinglet state lies energetically below the triplet state. [f] From non-linear curve fit (least squares non-linear fit of the pseudo-first-order plot), 25% of thereactant ion population is unreactive. [g] Same as [f] but 47%. [h] Same as [f] but 43%. [i] Same as [f] but 13%. [j] Same as [f] but 6%. [k] Same as [f]but 9%. [l] The absolute values of the measured efficiencies are estimated to be accurate only within �50%, but the precision is much better (�10%).
www.chemeurj.org � 2012 Wiley-VCH Verlag GmbH&Co. KGaA, Weinheim Chem. Eur. J. 2012, 18, 8692 – 86988694
H. I. Kentt�maa et al.
156
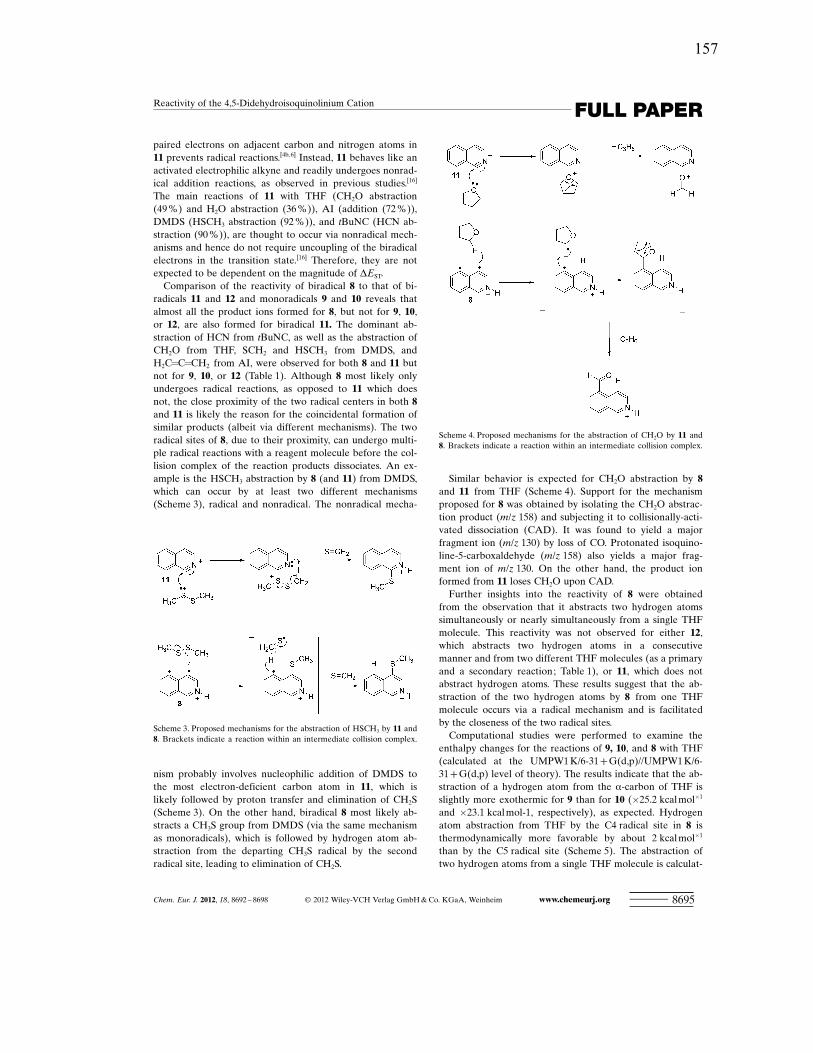
paired electrons on adjacent carbon and nitrogen atoms in11 prevents radical reactions.[4b,6] Instead, 11 behaves like anactivated electrophilic alkyne and readily undergoes nonrad-ical addition reactions, as observed in previous studies.[16]
The main reactions of 11 with THF (CH2O abstraction(49%) and H2O abstraction (36%)), AI (addition (72%)),DMDS (HSCH3 abstraction (92%)), and tBuNC (HCN ab-straction (90%)), are thought to occur via nonradical mech-anisms and hence do not require uncoupling of the biradicalelectrons in the transition state.[16] Therefore, they are notexpected to be dependent on the magnitude of DEST.
Comparison of the reactivity of biradical 8 to that of bi-ACHTUNGTRENNUNGradicals 11 and 12 and monoradicals 9 and 10 reveals thatalmost all the product ions formed for 8, but not for 9, 10,or 12, are also formed for biradical 11. The dominant ab-straction of HCN from tBuNC, as well as the abstraction ofCH2O from THF, SCH2 and HSCH3 from DMDS, andH2C=C=CH2 from AI, were observed for both 8 and 11 butnot for 9, 10, or 12 (Table 1). Although 8 most likely onlyundergoes radical reactions, as opposed to 11 which doesnot, the close proximity of the two radical centers in both 8and 11 is likely the reason for the coincidental formation ofsimilar products (albeit via different mechanisms). The tworadical sites of 8, due to their proximity, can undergo multi-ple radical reactions with a reagent molecule before the col-lision complex of the reaction products dissociates. An ex-ample is the HSCH3 abstraction by 8 (and 11) from DMDS,which can occur by at least two different mechanisms(Scheme 3), radical and nonradical. The nonradical mecha-
nism probably involves nucleophilic addition of DMDS tothe most electron-deficient carbon atom in 11, which islikely followed by proton transfer and elimination of CH2S(Scheme 3). On the other hand, biradical 8 most likely ab-stracts a CH3S group from DMDS (via the same mechanismas monoradicals), which is followed by hydrogen atom ab-straction from the departing CH3S radical by the secondradical site, leading to elimination of CH2S.
Similar behavior is expected for CH2O abstraction by 8and 11 from THF (Scheme 4). Support for the mechanismproposed for 8 was obtained by isolating the CH2O abstrac-tion product (m/z 158) and subjecting it to collisionally-acti-vated dissociation (CAD). It was found to yield a majorfragment ion (m/z 130) by loss of CO. Protonated isoquino-line-5-carboxaldehyde (m/z 158) also yields a major frag-ment ion of m/z 130. On the other hand, the product ionformed from 11 loses CH2O upon CAD.
Further insights into the reactivity of 8 were obtainedfrom the observation that it abstracts two hydrogen atomssimultaneously or nearly simultaneously from a single THFmolecule. This reactivity was not observed for either 12,which abstracts two hydrogen atoms in a consecutivemanner and from two different THF molecules (as a primaryand a secondary reaction; Table 1), or 11, which does notabstract hydrogen atoms. These results suggest that the ab-straction of the two hydrogen atoms by 8 from one THFmolecule occurs via a radical mechanism and is facilitatedby the closeness of the two radical sites.
Computational studies were performed to examine theenthalpy changes for the reactions of 9, 10, and 8 with THF(calculated at the UMPW1K/6-31+G ACHTUNGTRENNUNG(d,p)//UMPW1K/6-31+G ACHTUNGTRENNUNG(d,p) level of theory). The results indicate that the ab-straction of a hydrogen atom from the a-carbon of THF isslightly more exothermic for 9 than for 10 (�25.2 kcalmol�1
and �23.1 kcalmol-1, respectively), as expected. Hydrogenatom abstraction from THF by the C4 radical site in 8 isthermodynamically more favorable by about 2 kcalmol�1
than by the C5 radical site (Scheme 5). The abstraction oftwo hydrogen atoms from a single THF molecule is calculat-
Scheme 3. Proposed mechanisms for the abstraction of HSCH3 by 11 and8. Brackets indicate a reaction within an intermediate collision complex.
Scheme 4. Proposed mechanisms for the abstraction of CH2O by 11 and8. Brackets indicate a reaction within an intermediate collision complex.
Chem. Eur. J. 2012, 18, 8692 – 8698 � 2012 Wiley-VCH Verlag GmbH&Co. KGaA, Weinheim www.chemeurj.org 8695
FULL PAPERReactivity of the 4,5-Didehydroisoquinolinium Cation
157
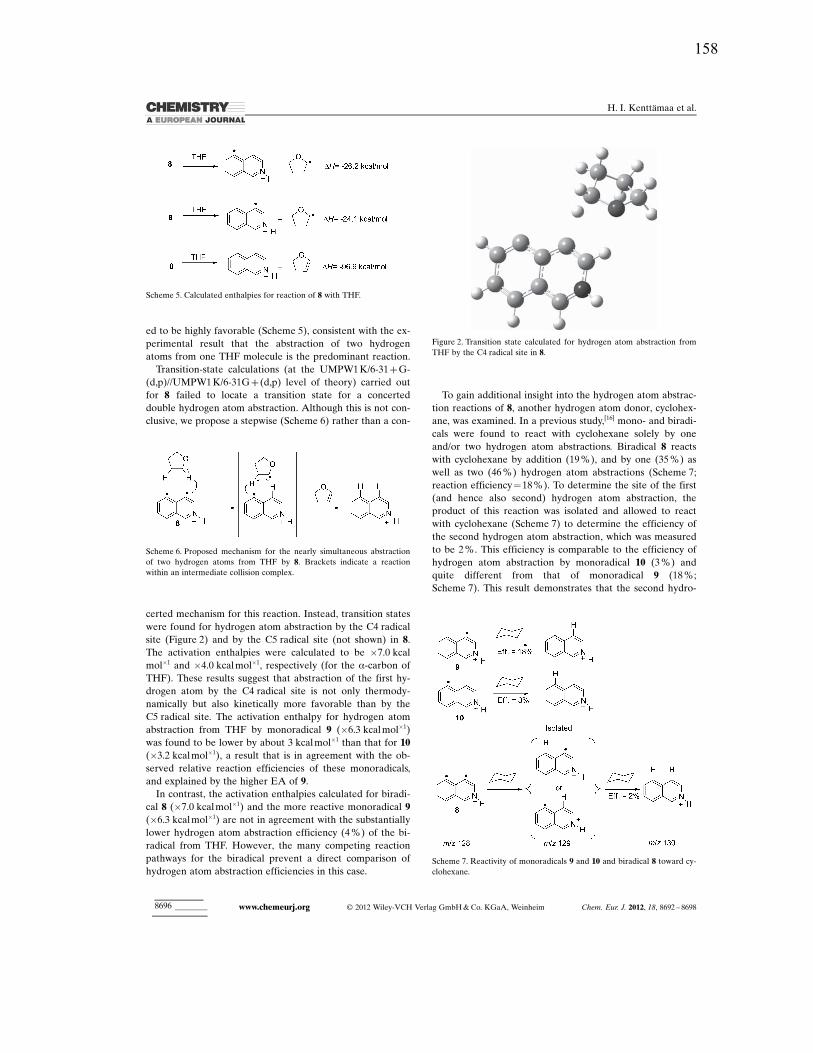
ed to be highly favorable (Scheme 5), consistent with the ex-perimental result that the abstraction of two hydrogenatoms from one THF molecule is the predominant reaction.
Transition-state calculations (at the UMPW1K/6-31+G-ACHTUNGTRENNUNG(d,p)//UMPW1K/6-31G+ (d,p) level of theory) carried outfor 8 failed to locate a transition state for a concerteddouble hydrogen atom abstraction. Although this is not con-clusive, we propose a stepwise (Scheme 6) rather than a con-
certed mechanism for this reaction. Instead, transition stateswere found for hydrogen atom abstraction by the C4 radicalsite (Figure 2) and by the C5 radical site (not shown) in 8.The activation enthalpies were calculated to be �7.0 kcalmol�1 and �4.0 kcalmol�1, respectively (for the a-carbon ofTHF). These results suggest that abstraction of the first hy-drogen atom by the C4 radical site is not only thermody-namically but also kinetically more favorable than by theC5 radical site. The activation enthalpy for hydrogen atomabstraction from THF by monoradical 9 (�6.3 kcalmol�1)was found to be lower by about 3 kcalmol�1 than that for 10(�3.2 kcalmol�1), a result that is in agreement with the ob-served relative reaction efficiencies of these monoradicals,and explained by the higher EA of 9.
In contrast, the activation enthalpies calculated for biradi-cal 8 (�7.0 kcalmol�1) and the more reactive monoradical 9(�6.3 kcalmol�1) are not in agreement with the substantiallylower hydrogen atom abstraction efficiency (4%) of the bi-ACHTUNGTRENNUNGradical from THF. However, the many competing reactionpathways for the biradical prevent a direct comparison ofhydrogen atom abstraction efficiencies in this case.
To gain additional insight into the hydrogen atom abstrac-tion reactions of 8, another hydrogen atom donor, cyclohex-ane, was examined. In a previous study,[16] mono- and biradi-cals were found to react with cyclohexane solely by oneand/or two hydrogen atom abstractions. Biradical 8 reactswith cyclohexane by addition (19%), and by one (35%) aswell as two (46%) hydrogen atom abstractions (Scheme 7;reaction efficiency=18%). To determine the site of the first(and hence also second) hydrogen atom abstraction, theproduct of this reaction was isolated and allowed to reactwith cyclohexane (Scheme 7) to determine the efficiency ofthe second hydrogen atom abstraction, which was measuredto be 2%. This efficiency is comparable to the efficiency ofhydrogen atom abstraction by monoradical 10 (3%) andquite different from that of monoradical 9 (18%;Scheme 7). This result demonstrates that the second hydro-
Scheme 5. Calculated enthalpies for reaction of 8 with THF.
Scheme 6. Proposed mechanism for the nearly simultaneous abstractionof two hydrogen atoms from THF by 8. Brackets indicate a reactionwithin an intermediate collision complex.
Figure 2. Transition state calculated for hydrogen atom abstraction fromTHF by the C4 radical site in 8.
Scheme 7. Reactivity of monoradicals 9 and 10 and biradical 8 toward cy-clohexane.
www.chemeurj.org � 2012 Wiley-VCH Verlag GmbH&Co. KGaA, Weinheim Chem. Eur. J. 2012, 18, 8692 – 86988696
H. I. Kentt�maa et al.
158

gen atom is abstracted by the radical site at C5 after abstrac-tion of the first hydrogen atom by the radical site at C4 of 8(in agreement with the transition-state calculations discussedabove). Hence, the reactions of 8 with THF, DMDS, and AIare also likely initiated by atom or group abstraction by theradical site at C4.
The CN group differs from the above groups in beinghighly electron withdrawing. Thus, CN abstraction fromtBuNC may take place at C5 in 8, which is less electron defi-cient than C4. However, based on the observation thatmono ACHTUNGTRENNUNGradical 9 reacts more efficiently with this reagent than10, it is concluded that the first CN abstraction likely occursat radical site C4 in 8 (Table 1).
Conclusion
Examination of the gas-phase reactions of biradical 8 withTHF, AI, DMDS, and tBuNC indicates that this biradicalreacts solely by radical pathways, and that the productsformed in these reactions are similar to those of relatedmonoradicals 9 and 10 and biradical 12. The abstraction oftwo hydrogen atoms from a single THF molecule is calculat-ed to be quite favorable, consistent with the experimentalresults. The experimental and theoretical studies indicatethat the first bond formation occurs at C4, followed by C5.The proximity of the two radical sites in 8 also leads to radi-cal reactions that were not observed for the monoradicals 9and 10 or biradical 12. Reactions similar to those observedfor 8 were also observed for 11 although the reactions of 11involve nonradical mechanisms.
Experimental Section
All experiments were carried out in a Finnigan FTMS 2001 dual-cell FT-ICR mass spectrometer. The mono- and biradicals 8–12 (Table 1) weregenerated by using previously reported methods.[5b,17] The ionized precur-sors were then transferred from one cell into the other, followed by sus-tained off-resonance irradiated collision-activated dissociation[18] (SORI-CAD) to homolytically cleave C�I and/or C�NO2 bonds of the protonat-ed precursors (for an example, see Scheme 8). The (bi)radicals 8–12 wereisolated and allowed to react with tetrahydrofuran (THF), allyl iodide(AI), dimethyl disulfide (DMDS) and tert-butyl isocyanide (tBuNC) forvarying periods of time. The second-order reaction rate constants (kexp)and reaction efficiencies (kreaction/kcoll) were determined as described in
the literature.[3b,19] The absolute values are estimated to be accurate onlywithin �50%, but the relative values are much more accurate (�10%).The product branching ratios were determined by dividing the abundanceof each primary reaction product ion by the sum of all primary reactionproduct abundances. Isoquinoline-5-carboxaldehyde and the precursorfor monoradical 10, 5-nitroisoquinoline, were purchased from Sigma–Al-drich and used without further purification. The precursor for monoradi-cal 9, 4-iodoisoquinoline, was synthesized by a known method.[20] Theprecursor for biradical 8, 4-iodo-5-nitroisoquinoline, was synthesized forthe first time by using the reaction conditions described by Grubbset al.[21] for 4-iodoisoquinoline. The structure was verified by x-ray crys-tallography. The precursors for biradical 12, 4,6-dinitroisoquinoline,[22]
and biradical 11, 1-iodoisoquinoline,[23] were synthesized by known meth-ods.
Molecular orbital calculations were carried out with the Gaussian 03[24]
and Molpro[25] electronic structure program suites.
Supporting Information : (1) Cartesian coordinates, electronic and zero-point vibrational energies, 298 K thermal contributions and derived en-thalpies. (2) Synthesis procedure for 4-iodo-5-nitroisoquinoline and its X-ray structure. (3) Full references [24] and [25].
Acknowledgements
This material is based upon work supported by the National ScienceFoundation under Grant No. 103762.
[1] a) C. Wittig, Naturwissenschaften 1942, 30, 696–703; b) W. Sander,Acc. Chem. Res. 1999, 32, 669–676.
[2] K. C. Nicolaou, W. M. Dai, Angew. Chem. Int. Ed. Engl. 1991, 30,1387–1430.
[3] a) E. D. Nelson, A. Artau, J. M. Price, H. I. Kentt�maa, J. Am.Chem. Soc. 2000, 122, 8781–8782; b) E. D. Nelson, A. Artau, J. M.Price, S. E. Tichy, L. Jing, H. I. Kentt�maa, J. Chem. Phys. A 2002,106, 9767–9775; c) C. J. Petzold, E. D. Nelson, H. H. Lardin, H. I.Kentt�maa, J. Chem. Phys. A 2002, 106, 9767–9775; d) S. E. Tichy,K. K. Thoen, J. M. Price, J. J. Ferra, C. J. Petucci, H. I. Kentt�maa, J.Org. Chem. 2001, 66, 2726–2733.
[4] a) A. T. Bowne, T. A. Christopher, R. H. Levin, Tetrahedron Lett.1976, 17, 4111–4114; b) R. G. Miller, M. Stiles, J. Am. Chem. Soc.1963, 85, 1798–1800; c) C. Witting, Angew. Chem. 1965, 77, 752–759; Angew. Chem. Int. Ed. Engl. 1965, 4, 731–737.<
[5] a) J. J. Nash, K. E. Nizzi, A. A. Adeuya, M. J. Yurkovich, C. C.Cramer, H. I. Kentt�maa, J. Am. Chem. Soc. 2005, 127, 5760–5761;b) K. K. Thoen, H. I. Kentt�maa, J. Am. Chem. Soc. 1999, 121, 800–805.
[6] a) C. F. Logan, P. Chen, J. Am. Chem. Soc. 1996, 118, 2113–2114;b) C. J. Cramer, J. Am. Chem. Soc. 1998, 120, 6261–6269; c) J. Hoff-ner, M. J. Schottelius, D. Feichtinger, P. Chen, J. Am. Chem. Soc.1998, 120, 376–385.
[7] F. S. Amegayibor, J. J. Nash, H. I. Kentt�maa, J. Am. Chem. Soc.2003, 125, 14256–14257.
[8] R. R. Squires, C. J. Cramer, J. Phys. Chem. A 1998, 102, 9072–9081.[9] C. W. Rees, R. C. Storr, Chem. Commun (London) 1965, 193–194.
[10] J. Nakayama, S. Dan, M. Hoshino, J. Chem. Soc., Perkin Trans.1 1981, 413–414.
[11] B. Benati, P. C. Montevecchi, J. Org. Chem. 1976, 41, 2639–2640.[12] G. de Luca, G. Renzi, A. Pizzabiocca, Tetrahedron Lett. 1983, 24,
821–824.[13] At this level of theory, the singlet ground state is 1A’. However,
there is a triplet state of 3A“ symmetry (DEST=�29.0 kcalmol�1)that lies below the triplet state of 3A� symmetry (DEST=�60.3 kcalmol�1).
[14] a) J. J. Nash, H. I. Kentt�maa, C. J. Cramer, J. Phys. Chem. A 2006,110, 10309–10315; b) J. J. Nash, H. I. Kentt�maa, C. J. Cramer, J.Phys. Chem. A 2005, 109, 10348–10356.
Scheme 8. Generation of biradical 8 from protonated 4-iodo-5-nitroiso-quinoline and biradical 11 from protonated 1-iodoisoquinoline by SORI-CAD.
Chem. Eur. J. 2012, 18, 8692 – 8698 � 2012 Wiley-VCH Verlag GmbH&Co. KGaA, Weinheim www.chemeurj.org 8697
FULL PAPERReactivity of the 4,5-Didehydroisoquinolinium Cation
159
[15] Note that, for these calculations, we are computing the EA of theradical site[s] , not the EA of the molecule.
[16] B. J. Jankiewicz, J. N. Reece, N. R. Vinueza, J. J. Nash, H. I. Kentt�-maa, Angew. Chem. 2008, 120, 10008–10013; Angew. Chem. Int. Ed.2008, 47, 9860–9865.
[17] J. M. Price, H. I. Kentt�maa, J. Phys. Chem. A 2003, 107, 8985–8995.
[18] J. W. Gauthier, T. R. Trautman, D. B. Jacobson, Anal. Chim. Acta1991, 246, 211–225.
[19] a) T. Su, W. J. Chesnavich, J. Chem. Phys. B 1982, 76, 5183–5185;b) J. L. Heidbrink, L. E. Ramirez-Arizmendi, K. K. Thoen, J. J.Ferra, H. I. Kentt�maa, J. Phys. Chem. A 2001, 105, 7875–7884;c) L. Jing, L. Guler, J. J. Nash, H. I. Kentt�maa, J. Am. Soc. MassSpectrom. 2004, 15, 913–919; d) R. Li, R. Smith, H. I. Kentt�maa, J.Am. Chem. Soc. 1996, 118, 5056–5061; e) C. Petucci, M. Nyman, L.Guler, H. I. Kentt�maa, J. Am. Chem. Soc. 2002, 124, 4108–4115;f) R. Smith, K. K. Thoen, K. M. Stirk, H. I. Kentt�maa, Int. J. MassSpectrom. Ion Processes 1997, 165/166, 315–325; g) K. K. Thoen,R. L. Smith, J. J. Nousiainen, E. D. Nelson, H. I. Kentt�maa, J. Am.Chem. Soc. 1996, 118, 8669–8676.
[20] J. A. Zoltewicz, N. M. Maier, S. Lavieri, I. Ghiviriga, K. A. Abboud,W. M. F. Fabian, Tetrahedron 1997, 53, 5379–5388.
[21] R. A. Grubbs, M. M. Lewis, C. Owens-Vance, E. K. Arrington, A. K.Jassen, R. B. Mailman, D. E. Nichols, Bioorg. Med. Chem. 2004, 12,1403–1412.
[22] R. A. Henry, A. T. Nielsen, D. W. Moore, J. Org. Chem. 1972, 37,3206–3209.
[23] C. Wolf, G. E. Tumambac, C. N. Villalobos, Synlett 2003, 12, 1801–1804.
[24] Gaussian 98 (Revision A.11.3), M. J. Frisch, G. W. Trucks, H. B.Schlegel, G. E. Scuseria, M. A. Robb, J. R. Cheeseman, V. G. Zakr-zewski, J. A. Montgomery, Jr., R. E. Stratmann, J. C. Burant, S. Dap-prich, J. M. Millam, A. D. Daniels, K. N. Kudin, M. C. Strain, O.Farkas, J. Tomasi, V. Barone, M. Cossi, R. Cammi, B. Mennucci, C.Pomelli, C. Adamo, S. Clifford, J. Ochterski, G. A. Petersson, P. Y.Ayala, Q. Cui, K. Morokuma, P. Salvador, J. J. Dannenberg, D. K.Malick, A. D. Rabuck, K. Raghavachari, J. B. Foresman, J. Cioslow-ski, J. V. Ortiz, A. G. Baboul, B. B. Stefanov, G. Liu, A. Liashenko,P. Piskorz, I. Komaromi, R. Gomperts, R. L. Martin, D. J. Fox, T.Keith, M. A. Al-Laham, C. Y. Peng, A. Nanayakkara, M. Challa-combe, P. M. W. Gill, B. Johnson, W. Chen, M. W. Wong, J. L.Andres, C. Gonzalez, M. Head-Gordon, E. S. Replogle, J. A. Pople,Gaussian, Inc., Pittsburgh PA, 2001.
[25] H.-J. Werner et al. MOLPRO, version 2008.1, a package of ab initioprograms. (for a complete reference, see the Supporting Informa-tion).
Received: November 18, 2011Revised: March 19, 2012
Published online: June 12, 2012
www.chemeurj.org � 2012 Wiley-VCH Verlag GmbH&Co. KGaA, Weinheim Chem. Eur. J. 2012, 18, 8692 – 86988698
H. I. Kentt�maa et al.
160
Characterization of model compounds of processed lignin and the lignomeby using atmospheric pressure ionization tandem mass spectrometry
Laura J. Haupert ⇑, Benjamin C. Owen, Christopher L. Marcum, Tiffany M. Jarrell, Christopher J. Pulliam,Lucas M. Amundson, Padmaja Narra, Mohammad Sabir Aqueel, Trenton H. Parsell, Mahdi M. Abu-Omar,Hilkka I. KenttämaaDepartment of Chemistry, Purdue University, Brown Building, 560 Oval Drive, West Lafayette, IN 47907, United States
a r t i c l e i n f o
Article history:Received 23 October 2011Received in revised form 3 December 2011Accepted 7 December 2011Available online 21 December 2011
Keywords:Mass spectrometryBiomassAtmospheric pressure ionizationLignome
a b s t r a c t
In the search for alternatives to fossil fuel and the valuable chemicals now derived from crude oil, ligno-cellulosic biomass has attracted wide interest. Degradation of the cellulose and lignin components of thebiomass results in complex mixtures. Hence, the ability to identify the products of processed celluloseand lignin is important. Unfortunately, mass spectrometric analysis of processed lignin (and the lignomein general) is hindered by poor ion generation and/or extensive fragmentation upon ionization. Afterexamination of several different ionization approaches, we demonstrate here that ionization of modelcompounds of lignin degradation products and lignome by using positive ion mode electrospray ioniza-tion (ESI) doped with sodium chloride results in the formation of abundant adduct ions, [M + Na]+, withno accompanying fragmentation. Hence, this approach allows for the determination of the molecularweights of lignin degradation products (and lignome) directly in mixtures. However, no structural infor-mation can be obtained by examining collision-activated dissociation of the sodiated molecules. Hence, adifferent ionization method was identified. Doping negative ion mode ESI with hydroxide ions (fromNaOH) yields only one type of an ion per analyte, the deprotonated analyte, without fragmentation. Valu-able structural information can be obtained for these anions by subjecting them to multiple consecutiveion isolation and collision-activated dissociation (CAD) steps (up to MS7). This methodology significantlyimproves the information that can be obtained by mass spectrometric analysis for lignin degradationproducts and lignome.
� 2011 Elsevier Ltd. All rights reserved.
1. Introduction
The development of methods for the conversion of biomass tobiofuels and other high-value organic molecules is becomingincreasingly important in the efforts for finding renewable alterna-tives to fossil fuels [1–7]. Lignin is an important component of lig-nocellulosic biomass. It is a biopolymer consisting of aromaticrings with various oxygen functionalities, and hence could providea means of obtaining aromatic materials currently derived solelyfrom petroleum [4,6–9]. Indeed, various degradation methods arebeing explored to convert lignin into smaller molecules, and cata-lytic pathways are developed to remove excess oxygen from thesemolecules in order to increase their energy density and syntheticvalue [6–11]. However, the biggest challenge right now is thestructural elucidation of these molecules.
Tandem mass spectrometry (MSn) is the only analytical methodthat can be used for the molecular-level characterization of un-
known components of complex mixtures without time-consumingisolation and purification [12–14]. However, the situation is com-plicated by the fact that different mixtures may require differenttandem mass spectrometric approaches since all currently usedevaporation, ionization and structural elucidation methods havelimitations. Hence, any new type of a mixture requires the carefultesting of existing methods by using model compounds, and possi-bly the development of a different or completely new approach. Insome cases, several methods should be used to examine differentaspects of the mixtures.
Although tandem mass spectrometry has been explored for thecharacterization of lignin degradation products and the lignome(defined [15] as the ensemble of all phenolic compounds for whichthe biosynthesis is coregulated with lignin biosynthesis and theirderivatives, as well as the lignin oligomers), none of these studieshave focused on the first and the most important stage of a tandemmass spectrometry experiment [15–25], efficient evaporation andionization of all the mixture components without associated frag-mentation. For the analysis of complex mixtures, this stage shouldgenerate only one ion per analyte, and the m/z-value of the ion
0016-2361/$ - see front matter � 2011 Elsevier Ltd. All rights reserved.doi:10.1016/j.fuel.2011.12.015
⇑ Corresponding author. Tel.: +1 765 494 7040; fax: +1 765 494 0239.E-mail address: [email protected] (L.J. Haupert).
Fuel 95 (2012) 634–641
Contents lists available at SciVerse ScienceDirect
Fuel
journal homepage: www.elsevier .com/locate / fuel
161
should provide MW information for the analyte. This is where thecommonly used ionization methods, including the traditional anduniversal electron ionization (EI) method, fail. Although EI hasthe benefit that it ionizes all organic molecules in a mixture, itcauses so substantial fragmentation for many of them that no sta-ble molecular ion is formed. This prevents the assignment ofmolecular weights for the mixture components. It also unnecessar-ily complicates mass spectra obtained for already complex mix-tures [26–28].
The common atmospheric pressure ionization (API) methodsalso fail [29,30]. Electrospray ionization (ESI) mass spectrometryhas been tested for its suitability for molecular weight determina-tion and structural characterization of the lignome. Positive ionmode ESI (methanol/water solvent with ammonium acetate dop-ant) of di- and polylignols leads to the formation of many simpleadduct ions, including ammoniated, sodiated and/or potassiatedanalyte ions, as well as protonated analyte molecules, in the sameexperiment [16,31,32]. Hence, this method is not suitable for anal-ysis of complex mixtures. The usefulness of negative ion mode ESImass spectrometry (with ammonia-doped analyte solutions) hasbeen probed by using five model compounds. This approach ledto ionization of the analytes via deprotonation. However, manyof the deprotonated analytes were found to fragment spontane-ously. For example, deprotonated vanillyl alcohol fragments by lossof water. Adduct formation was also observed [18,33]. The forma-tion of multiple types of ions for each analyte complicates the anal-ysis of mixtures.
Mass spectrometry using atmospheric pressure chemical ioni-zation (APCI) has also been explored for the characterization ofthe lignome. Upon negative ion mode APCI (2:1 chloroform/meth-anol solvents), an abundant deprotonated analyte (the [M–H]� ion)as well as fragment ions, including [M–H–CO]�, [M–H–CO2]�, [M–H–CH3]� and [M–H–CH2O]�, were produced for the di- and polylig-nols studied [19]. Positive ion mode APCI (2:1 chloroform/metha-nol solvents) yielded a protonated molecule, [M + H]+, andfragment ions, including [M–H–CH2O]+, [M–H–CO2H]+, [M–H–HCO2H]+, for the same di- and polylignols [19]. Generally, it is evi-dent based on the literature that although APCI provides for effi-cient ionization of model compounds, it frequently inducesfragmentation, rendering traditional APCI useless for the analysisof the mixtures generated upon degradation of lignin [19,34].
To address the above issues, we have carried out a systematicexamination of the APCI and ESI methods in both positive and neg-ative ion mode, natively as well as in the presence of selected do-pants, for their viability as effective evaporation and ionizationmethods for lignin degradation products and lignome. Simplemodel compounds, as well as two monolignols (sinapyl alcoholand coniferyl alcohol) and two dimers, were examined. The valueof structural information obtained by MSn for the ions formed bythe most powerful ionization method was also explored by usinga commercial linear quadrupole ion trap (LQIT) mass spectrometer.
2. Experimental section
2.1. Materials
Guaiacol (98% purity), eugenol (99% purity), isoeugenol (98%purity), 2-methoxy-4-propylphenol (98% purity), sinapyl alcohol(80% purity), vanillin (99% purity) and vanillyl alcohol (98% purity)were obtained from Sigma–Aldrich (St. Louis, Mo, USA). Guaiacyl-glycerol-b-guaiacylether (99% purity) and 2-methoxy-4-methyl-phenol (98% purity) were purchased from TCI America (Portland,OR, USA). 3,4-Dimethoxytoluene (99% purity) was obtained fromTCI (Tokyo, Japan). Coniferyl alcohol (98% purity) was obtainedfrom Alfa Aesar (Ward Hill, MA, USA). High-performance liquid
chromatography–mass spectrometry grade water and methanolwere purchased from Fisher Scientific (Pittsburgh, PA, USA). Allchemicals were used as received without further purification. Gua-iacylglycerol-b-syringylether was synthesized using a previouslypublished procedure [35].
2.2. Methods
All experiments were carried out using a Thermo Scientific lin-ear quadrupole ion trap mass spectrometer (LQIT) equipped witheither an ESI or APCI source. The LQIT was operated using theLTQ Tune Plus interface and Xcalibur 2.0 software. The internalnominal pressure of the LQIT was maintained at about0.6 � 10�5 Torr, as read by an ion gauge.
To standardize the mass spectrometric analysis of model com-pounds, stock solutions were prepared for all analytes with a finalconcentration of 1 mM in 50/50 (v/v) methanol/water. For sodiumchloride dopant experiments, 5% sodium chloride (NaCl) watersolution was doped into the analyte solution (100 ll per 1 mL ofanalyte solution). For ESI experiments carried out in the negativeion mode, 1% sodium hydroxide solution was doped into the ana-lyte solution (15 ll of NaOH per 1 mL of analyte solution) to makea solution with a final pH of 11.
The solutions were introduced into the instrument by using asyringe drive (15 ll/min) and combined via a tee connector withHPLC eluent, 50/50 (v/v) methanol/water, delivered at a rate of200 ll/min by a Finnigan Surveyor MS Pump Plus to facilitate a sta-ble spray. The resulting mixture was introduced into either the ESIor the APCI source. ESI conditions were 3.5–4 kV spray voltage,sheath and auxiliary gas (N2) flow of 20 and 10 (arbitrary units),and a heated ion transfer capillary/mass spectrometer inlet tem-perature of 275 �C. APCI conditions were a discharge current of5.0 lA, vaporizer temperature of 400 �C, sheath and auxiliary gas(N2) flow of 30 and 20 (arbitrary units), and a heated ion transfercapillary/mass spectrometer inlet temperature of 250 �C. All DCvoltages and offsets for the ion optics were optimized utilizingthe tune feature of the LTQ Tune Plus interface. This mass spec-trometer has a high mass limit of 4000 for z = 1.
In collision-activated dissociation (CAD) experiments, the ad-vanced scan features of the LTQ Tune Plus interface were used toisolate the ions by using an m/z window of 2 units. At a q valueof 0.25, the ions were subjected to CAD by using helium as the col-lision gas for an activation time of 30 ms. ‘‘Normalized collisionenergies’’ were varied from 20–40%. All of the fragment ionsformed were subjected to subsequent isolation and CAD events un-til no further fragmentation products were observed. Xcalibur 2.0software was used for processing all data produced. All mass spec-tra acquired were an average of at least 20 spectra. All non-isotopemass spectral peaks that had at least a 5% relative abundance werereported for both full MS acquisitions and CAD experiments.
3. Results and discussion
In order to identify the most suitable atmospheric pressure ion-ization method(s) for the tandemmass spectrometric characteriza-tion of complex mixtures related to lignin degradation productsand lignome, a set of model compounds was subjected to positiveand negative ion mode APCI and ESI under traditional as well asnovel conditions. Each method is discussed separately below.
3.1. Positive and negative ion mode traditional APCI
Five compounds that are part of lignome and also related toexpected lignin degradation products were studied (Table 1). Onlytwo of these compounds, guaiacol and eugenol, formed an
L.J. Haupert et al. / Fuel 95 (2012) 634–641 635
162

abundant protonated molecule upon ionization via traditional po-sitive ion mode APCI (methanol/water solvent), as desired. In sharpcontrast, vanillyl alcohol and coniferyl alcohol formed exclusively[M + H–H2O]+ fragment ions, thus leading to the loss of molecularweight information. The facile loss of water from these protonatedmolecules is expected due to their allylic and benzylic hydroxylfunctionalities that after protonation lose water to generate reso-nance stabilized carbocations. Guaiacol and eugenol do not containthese functionalities. However, the dimer, guaiacylglyerol-b-guai-acylether, contains a benzylic hydroxyl group. Hence, this dimer,like the structurally similar vanillyl and coniferyl alcohols, easilyloses water from the benzylic hydroxyl functionality, thus formingthe [M + H–H2O]+ ion. However, the two most abundant fragmentions are [M + H–2H2O]+ and [M + H–H2O–CH2O]+ (Table 1). Thesefragment ions arise by loss of water ([M + H–2H2O]+) or formalde-hyde ([M + H–H2O–CH2O]+) from the initially formed water elimi-nation product ([M + H–H2O]+), likely from the hydroxymethylgroup.
The five model compounds were also studied using traditionalnegative mode APCI ionization (methanol and water as solvents).All five compounds gave poor ion signals under these conditions,which is indicative of the only weakly acidic phenolic moieties inthese molecules. Although an [M–H]� ion was produced for thesecompounds (Table 1), also fragment ions were formed in all casesexcept one. The lack in sensitivity and the observed fragmentationmakes this a poor ionization method for the characterization of lig-nin degradation products and lignome.
3.2. Positive and negative ion mode traditional ESI
The five model compounds were also studied by using ESI in thepositive ion mode (methanol/water solvents) (Table 1). Guaiacolwas the only analyte to form an [M + H]+ ion in significant abun-dance. Vanillyl and coniferyl alcohols both formed predominantly
[M + H–H2O]+ fragment ions. The dimer, guaiacylglycerol-b-guai-acylether, formed a sodiated ion upon ionization. Since sodium ispresent in trace amounts in almost all solutions and is not regu-lated in most LC grade solvents [36], the formation of this adductis not surprising. Finally, eugenol produced no signal after beingsubjected to ESI. Since the model compounds produced differenttypes of ions or no ions at all, this method is not amenable forthe analysis of complex mixtures containing these types ofanalytes.
The same model compounds were also exposed to negativemode ESI (methanol/water solvents). Guaiacol and guaiacylglycer-ol-b-guaiacylether yielded a poor or no ion signal, while vanillyland coniferyl alcohols produced an abundant [M–H]� ion. Eugenolalso produced an [M–H]� ion; however, fragmentation was alsoobserved for this compound. Although this method is the mostpromising API approach tested, it still produced too many differention types, necessitating the exploration of other methods.
3.3. Positive ion mode ESI with sodium chloride dopant
As the traditional ESI approach was not successful, and, basedon the literature [16,31,32], the use of ammonium acetate dopantmade the situation even worst, we considered other possible do-pants. The observation of an abundant sodium cation adduct forthe dimer upon positive ion mode ESI inspired the investigationof sodium cation doped analyte solutions for the facilitated pro-duction of sodium adduct ions upon positive ion mode ESI. Table 2shows twelve compounds that were studied using NaCl dopant,and the ions these compounds produced upon ESI in sodium dopedsolutions. An abundant adduct ion [M + Na]+ was formed for eachof the compounds studied. No fragment ions were observed, likelybecause the loss of water was prevented by the use of the sodiumcation for ionization instead of the proton. Vanillyl alcohol alsoproduced a sodiated dimer with 15% relative abundance, which ap-
Table 1Ions (with their relative abundances and likely compositions) formed from five model compounds upon traditional positive and negative ion mode APCI and ESI (methanol/watersolvents).
Compound (MW) APCI (+) (m/z) APCI (�) (m/z) ESI (+) (m/z) ESI (�) (m/z)Relative abundance Relative abundance Relative abundance Relative abundance
Guaiacol (124) [M + H]+ (125) 100% Poor signal [M + H]+ (125) 100% Poor signal[M–H]� (123) 100% [M–H]� (123) 100%
Vanillyl alcohol (154) [M + H–H2O]+ (137) 100% Poor signal [M + H–H2O]+ (137) 100% [M–H]� (153) 100%[M–H]� (153) 100%
Eugenol (164) [M + H]+ (125) 100% Poor signal No Signal Poor signal[M–H]� (163) 100% [M–H]� (163) 100%[M–H–CH3]� (148) 15%
Coniferyl alcohol (180) [M + H–H2O]+ (163) 100% Poor signal [M + H–H2O]+ (163) 100% [M–H]� (179) 100%[M–H –H2O–H] � (160) 41%[M–H–H2O]� (161) 31%[M–H]� (179) 100%
Guaiacylglycerol-b-guaiacylether (320) [M + H–H2O]+ (303) 40% Poor signal [2 M + Na]+ (663) 15% Poor signal[M + H–2H2O]+(285) 95% [M–H]� (319) 100% [M + Na]+ (343) 100% [2 M–H]� (639)
27%[M–H]� (319) 100%[M + H–H2O–CH2O]+ (273) 97% [M–H–H2O–CH2O]�
(271) 47%m/z 285-C6H3OCH3 (m/z 179) 20%m/z 285-HOC6H2OCH3 (m/z 163) 25%m/z 285-HOC6H4OCH3 (m/z 161) 20%m/z 273-HOC6H4OCH3 (m/z 149) 30%m/z 285-HOC6H3(OCH3)CCH (m/z 137) 16%
636 L.J. Haupert et al. / Fuel 95 (2012) 634–641
163

pears to reflect the presence of a hydroxymethyl functionality inthis molecule, the only simple model compound that contains one.
The above results demonstrate that positive ion mode ESI usingNaCl dopant is effective at exclusively producing sodium cation ad-
ducts, with no associated fragmentation, for lignomic moleculeswith different types of structures and different oxygen-containingfunctionalities. This method facilitates the determination of themolecular weights of unknown lignin degradation products. How-
Table 2Ions (with their relative abundances) formed from several model compounds upon positive ion mode ESI by using sodium chloride dopedanalyte solution.
Compound (NaCl) Structure Ionic products, relative abundance%
Simple model compoundsGuaiacol (124)
[M + Na]+ (147) 100%
2-Methoxy-4-methylphenol (138) [M + Na]+ (161) 100%
Vanillin (152) [M + Na]+ (175) 100%
3,4-Dimethoxytoluene (152) [M + Na]+ (175) 100%
Vanillyl alcohol (154) [M + Na]+ (177) 100%[2 M + Na]+ (331) 15%
Eugenol (164) [M + Na]+ (187) 100%
Isoeugenol (164)[M + Na]+ (187) 100%m/z 349 13%
2-Methoxy-4-propylphenol (166) [M + Na]+ (189) 100%
MonolignolsConiferyl alcohol (180)
[M + Na]+ (203) 100%
Sinapyl alcohol (210) [M + Na]+ (223) 100%
DimersGuaiacylglycerol-b-guaiacylether (320)
[M + Na]+ (343) 100%
Guaiacylglycerol-b-syringylether (350) [M + Na]+ (373) 100%
L.J. Haupert et al. / Fuel 95 (2012) 634–641 637
164

ever, structural information is also necessary. Unfortunately, whenthe sodiated adduct ions were subjected to CAD, no fragmentationwas observed. Thus, while this ionization method allows for the
determination of the molecular weights of unknown molecules inmixtures formed upon degradation of lignin and in the lignome,structural information cannot be obtained by this approach.
Table 3Ions (with their abundances) formed from model compounds upon negative ion mode ESI by using sodium hydroxide doped analytesolutions.
Compound (NaOH) Structure Products, relative abundance%
Model compoundsGuaiacol (124)
[M–H]� (123) 100%
2-Methoxy-4-methylphenol (138) [M–H]� (137) 100%
Vanillin (152) [M–H]� (152) 100%
3,4-Dimethoxytoluene (152) No signal
Vanillyl alcohol (154) [M–H]� (153) 100%
Eugenol (164) [M–H]� (163) 100%
Isoeugenol (164) [M–H]� (163) 100%
2-Methoxy-4-propylphenol (166) [M–H]� (165) 100%
MonolignolsConiferyl alcohol (180) [M–H]� (179) 100%
Sinapyl alcohol (210) [M–H]� (209) 100%
DimersGuaiacylglycerol-b-guaiacylether (320) [M–H]� (319) 100%
Guaiacylglycerol-b-syringylether (350) [M–H]� (349) 100%
638 L.J. Haupert et al. / Fuel 95 (2012) 634–641
165

3.4. Negative ion mode ESI with sodium hydroxide dopant
The basification of lignin model compound solutions for en-hanced analysis by negative ion mode ESI has been studied previ-ously by using 50/50 methanol/water solutions of vanillyl alcohol,syringic acid, pyromellitic acid, 4-hydroxy-a-[(2-methoxyphen-oxy)methyl]-benzenemethanol, and guaiacylglycerol-b-guaiacyle-ther spiked by ammonia (to a final concentration of 2.5%ammonia) [18,33]. The conclusion of this study was that all theanalytes yielded predominantly the [M–H]� ion. However, onlyone mass spectrum was published, that measured for vanillyl alco-hol, and it showed fragmentation. Hence, these experiments wererepeated in our laboratories by using the published method. Inaddition to the [M–H]� ion, abundant fragment and adduct ionswere observed over a range of m/z 50–200. To eliminate these un-wanted ions, other basic dopants were explored.
The final, and most successful, approach investigated was dop-ing analyte solutions with NaOH for negative ion mode ESI massspectrometry. This dopant should enhance the concentration ofdeprotonated analyte molecules in solution, thus facilitating theformation of gas-phase negative ions. Each of the twelve analytesstudied, with one exception, exclusively produced the deproto-nated molecule [M–H]�, without any associated fragmentation(Table 3). Hence, this method allows for molecular weight informa-tion to be obtained for all but one of the model compounds studied,while eliminating the undesired ions formed when using ammoniadoped analyte solutions. No signal was observed for 3,4-dime-thoxytoluene, as expected, as it does not contain acidic hydrogens.Thus, this method is dependent on the presence of an acidic hydro-gen in the analyte. However, this should not be a serious limitationsince nearly all of the compounds expected to be formed upon deg-radation of lignin and found in the lignome have at least one acidichydrogen [15,31]. However, as the sodium cation adduct in posi-tive ion mode ESI was also formed for nonacidic analytes (Table 2),this method can be used to verify that all analytes have beenionized.
In order to examine the performance of the above method forthe analysis of a mixtures, an artificial mixture was prepared, con-
taining equimolar amounts of guaiacol (MW = 124 Da), 2-meth-oxy-4-methylphenol (MW = 138 Da), vanillin (MW = 152 Da),vanillyl alcohol (MW = 154 Da), eugenol (MW = 164 Da), isoeuge-nol (MW = 164 Da), 2-methoxy-4-propylphenol (MW = 166 Da),coniferyl alcohol (MW = 180 Da), sinapyl alcohol (MW = 210 Da),guaiacylglycerol-b-guaiacylether (MW = 320 Da) and guaiacylgly-erol-B-syringylether (MW = 350 Da), dissolved in 50/50 (v/v)methanol/water and doped with sodium hydroxide. When thismixture was subjected to negative ion mode ESI, the [M–H]� ionwas formed for each mixture component, and these ions had sim-ilar abundances (Fig. 1). Hence, this mass spectrometric methodionizes the eleven different mixture components at a similar effi-ciency to yield only one product ion per analyte without any obvi-ous bias or fragmentation. This finding suggests that this ionizationmethod is suitable for the characterization of lignin degradationproduct mixtures and the lignome.
Finally, the lower limit of detection of the above method wastested for vanillin, and found to be 10�6 M solution or 0.76 lg/ml. This number compares well with those obtained for other massspectrometric methods. For example, 10�6–10�7 M solution hasbeen reported as the detection limit for LIAD/ESI mass spectromet-ric analysis of hemoglobin [36].
3.5. CAD/MSn of negative ions
In order to investigate the nature of the structural informationthat can be obtained from the deprotonated molecules, collision-activated dissociation (CAD) tandem mass spectrometric analyses(CAD-MSn) were performed on the isolated [M–H]� ions generatedfrom four of the model compounds (Table 4). In contrast to similarearlier studies that were limited to only two stages of mass spec-trometry and a single CAD event (MS2) [15,17,18,20], in this study,multiple successive ion isolation and CAD experiments were per-formed until no further fragmentation was observed. In the caseof sinapyl alcohol, tandem mass spectrometry experiments up toMS7 were performed, allowing for the identification of all function-alities in this multifunctional molecule. The analytes are discussedin detail below.
100 150 200 250 300 350 400m/z
0
10
20
30
40
50
60
70
80
90
100
Rel
ativ
e Ab
unda
nce
163
151319
137 179 349209
O
HO
OH
HOO
O
153123
165
HO
OHO
O
HO
O H
O
HO
O
HO
O
HO
O
HO
O OH
HOO
OH
HO
O
O
OH
O
HO
OH
HOO
O
O
+
Fig. 1. Negative mode ESI mass spectrum obtained for an equimolar mixture of guaiacol (MW = 124 Da), 2-methoxy-4-methylphenol (MW = 138 Da), vanillin (MW = 152 Da),vanillyl alcohol (MW = 154 Da), eugenol (MW = 164 Da), isoeugenol (MW = 164 Da), 2-methoxy-4-propylphenol (MW = 166 Da), coniferyl alcohol (MW = 180 Da), sinapylalcohol (MW = 210 Da), guaiacylglycerol-b-guaiacylether (MW = 320 Da) and guaiacylglycerol-b-syringylether (MW = 350 Da) dissolved in 50/50 (v/v) methanol/water anddoped with sodium hydroxide.
L.J. Haupert et al. / Fuel 95 (2012) 634–641 639
166

Eugenol and isoeugenol are isomers that cannot be differenti-ated by mass measurement alone. However, CAD may allow thedistinction between these isomers. When subjected to CAD, depro-tonated eugenol loses a methyl radical, which is indicative of thepresence of a methoxy group. The second CAD event resulted inthe loss of a hydrogen atom, likely from the benzylic carbon inthe alkyl chain. Deprotonated isoeugenol also fragments by a facileloss of a methyl radical from its methoxy group. However, the sec-ond CAD event resulted in no further fragmentation. This distinctdifference in the MS3 mass spectra allows for the differentiationof the isomers and demonstrates the power of multi-stage tandemmass spectrometry for the identification of unknown compoundsin complex mixtures.
Deprotonated sinapyl alcohol fragments by loss of water fromthe allylic hydroxyl moiety, followed by consecutive losses oftwo methyl radicals from the two methoxy groups, and finallythree CO molecules from the three oxygen atoms bound to the aro-matic ring. From the characteristic losses of neutral fragmentsupon CAD, all the functionalities present in sinapyl alcohol canbe identified. A thorough investigation of these fragmentationreactions will be submitted for publication in the near future.
4. Conclusions
The need for a mass spectrometric method that can efficientlyevaporate and ionize lignin degradation products and lignomehas been a much ignored problem. Though efforts have been madeto structurally characterize various ionized model compounds anddegradation products, little attention has been given to the effi-cient and unbiased ionization of all mixture components withoutfragmentation. Based on the results presented here, the traditionalpositive and negative ion mode APCI and ESI are not appropriateionization methods for the comprehensive analysis of lignin degra-dation products and the lignome. However, by using appropriatedopants, both positive and negative ion mode ESI allow the molec-ular weight determination of unknown molecules related to lig-nome. Though typically not an ideal dopant ion in an ESI spraydue to its lack of volatility, sodium ions are shown to efficiently at-tach to a variety of model compounds, including one with no acidicfunctionalities, and facilitate determination of their molecular
weights. A disadvantage of using sodium ions for ionization ofthe analytes is the lack of structural information upon exposureof the sodiated analytes to CAD. On the other hand, the [M–H]�
ions generated in negative ion mode ESI by using NaOH dopantfor acidic analytes readily fragment upon CAD to yield structurallyinformative fragmentation products. The lower limit of detectionfor NaOH dopant was determined to be 10�6 M solution or0.76 lg/ml, which compares well with those obtained for othermass spectrometric methods.
Further, the efforts herein have demonstrated that negative ionmode ESI with NaOH dopant can be used to efficiently ionize allcomponents of a mixture containing several lignin degradationproduct model compounds (all acidic) that are vastly different intheir functionalities, with no significant bias or fragmentationupon ionization. However, in order to make sure that any nonacidiccompounds are detected, positive ion mode ESI using NaCl dopantshould also be used. The ability to determine the products of lignindegradation will have a significant effect on the search for a viablereplacement for fossil fuel and the valuable chemicals that are, todate, only gained from this resource.
Acknowledgments
This work was supported as part of the Center for Direct Cata-lytic Conversion of Biomass to Biofuels (C3Bio), an Energy FrontierResearch Center funded by the US Department of Energy, Office ofScience, Office of Basic Energy Sciences under Award Number DE-SC0000997.
References
[1] Hamelinck CN, van Hooijdonk G, Faaij APC. Biomass Bioenergy2005;28:384–410.
[2] Ragauskas AJ, Williams CK, Davison BH, Britovesk JC, Echert CA, Frederick JrWJ, et al. Science 2006;311:484–9.
[3] Mohan D, Pittman Jr CU, Steele PH. Energy Fuels 2006;20:848–89.[4] Zakzeski J, Bruijnincx PCA, Jongerius AL, Weckhuysen BM. Chem Rev
2010:3552–99.[5] Chang MCY. Chem Biol 2007;11:677–84.[6] Weng JK, Li X, Bonawitz ND. Curr Opin Biotechnol 2008;19:166–72.[7] Hisano H, Nandakumar R, Wang ZY. In Vitro Cell Dev Bio-Plant
2009;45:306–13.[8] Li X, Weng JK, Chapple C. Plant J 2008;54:569–81.
Table 4CAD multi-stage tandem mass spectra for some of the negative ions listed in Table 3.
Compound (m/z of [M–H]�) MS2 fragmentations(product ions’ m/z)relative abundance
MS3 fragmentations(product ions’ m/z)relative abundance
MS4 fragmentations(product ions’ m/z)relative abundance
MS5 fragmentations(product ions’ m/z)relative abundance
MS6 fragmentations(product ions’ m/z)relative abundance
MS7 fragmentations(product ions’ m/z)relative abundance
Vanillyl alcohol (153) 153-CH3 (138) 52% 138-H2O (120) 100% 120 + H2O (138) 20% No furtherfragmentationobserved
153-H2O (135) 100% 135-CH3 (120) 100% 120-CO (92) 100%120-CO (92) 100%
Eugenol (163) 163-CH3 (148) 100% 148-H (147) 100% No furtherfragmentationobserved
Isoeugenol (163) 163-CH3 (148) 100% No furtherfragmentationobserved
Sinapyl alcohol (209) 209-CH3 (194) 100% 194-CH3 (179) 100% 179-CO (151) 100% 151-H2O (133) 100%209-H2O (191) 35% 191-CH3 (176) 100% 176-CH3 (161) 100% 151-CH2O (121) 100% 121-CO (93) 100% 105-CO (77) 100%209-H2O–CH3 (176)12%
176-CH3 (161) 100% 161-CO (133) 100% 161-CO (133) 100% 133-CO (105) 100%161–2CO (105) 75% 133-CO (105) 100% 133-2CO (77) 47%
133–2CO (77) 19%105-CO (77) 100%
640 L.J. Haupert et al. / Fuel 95 (2012) 634–641
167

[9] Cherubini F, Stromman AH. Energy Fuels 2010;24:2657–66.[10] Hasegawa I, Inoue Y, Muranaka Y, Yasukawa T, Mae K. Energy Fuels
2011;25:791–6.[11] Hanson SK, Baker RT, Gordon JC, Scott BL, Thorn DL. Inorg Chem
2010;49:5611–8.[12] Amy JW, Baitinger WE, Cooks RG. J Am Soc Mass Spectrom 1990;1:119–28.[13] Cooks RG, Busch KL, Glish GL. Science 1983;222:273–91.[14] McLafferty FW. Int J Mass Spectrom 2001;212:81–7.[15] Morreel K, Kim H, Lu F, Dima O, Akiyama T, Vanholme R, et al. Anal Chem
2010;82:8095–105.[16] Angelis FD, Tullio AD, Reale S, Spreti N. In: Gelpi E, editor. Advances in mass
spectrometry, vol. 15. West Sussex: John Wiley & Sons Ltd.; 2002. p. 903–4.[17] Önnerud H, Palmblad M, Gellerstedt G. Hlzforschung 2003;57:37–43.[18] Evtuguin DV, Amado FML. Macromol Biosci 2003;3:339–43.[19] Banoub JH, Delmas M. J Mass Spectrom 2003;28:900–3.[20] Banoub JH, Benjelloun-Mlayah B, Ziarelli F, Joly N, Delmas M. Rapid Commun
Mass Spectrom 2007;21:2867–88.[21] Morreel K, Dima O, Kim H, Lu F, Niculaes C, Vanholme R, et al. Plant Physiol
2010;153:1464–78.[22] Hugo Meyermans, Kris Morreel, Catherine Lapierre, Brigitte Pollet, Andre De
Bruyn, Roger Busson, et al. J Biol Chem 2000;275:36899–909.[23] Cappiello A, De Simoni E, Fiorucci C, Mangani F, Palma P, Trufelli H, et al.
Environ Sci Technol 2003;37:1229–40.
[24] Hess Thomas F, Renn Timothy S, Watts RJ, Paszczynski AJ. Analyst2003;128:156–60.
[25] Flamini Riccardo, Vedova Antonio Dalla, Cancian Davide, Panighel A, RossoMD. J Mass Spectrom 2007;42:641–6.
[26] Hoffmann Ed, Stroobant V. Mass spectrometry principles andapplications. England: West Sussex; 2007.
[27] Watson JT, Sparkman OD. Introduction to mass spectrometry,instrumentation, applications and strategies for datainterpretation. England: West Sussex; 2008.
[28] Skoog DA, Holler FJ, Crouch SR. Principles of instrumentalanalysis. CA: Belmont; 2007.
[29] Duan PG, Fu MK, Pinkston DS, Habicht SC, Kenttämaa HIJ. Am Chem Soc2007;129:9266.
[30] Kostiainen R, Kauppila TJJ. Chromatogr A 2009;1216:685–99.[31] Reale S, Di Tullio A, Spreti N, De Angelis F. Mass Spectrom Rev
2004;23:87–126.[32] Angelis FD, Nicoletti R, Dpreti N, Veri F. Angw Chem Int Ed 1999;38:1283–5.[33] Evtuguin DV, Domingues P, Amado FL, Neto CP, Correia AJF. Holzforschung
1999;53:525–8.[34] Raghuraman A, Tiwari V, Thakkar JN, Gunnarsson GT, Shukla D, Hindle M, et al.
Biomacromolecules 2005;6:2822–32.[35] Kawai S, Okita K, Sugishita K, Tanaka A, Ohashi H. J Wood Sci 1999;45:440–3.[36] Cheng SC, Cheng TL, Chang HC, Shiea J. Anal Chem 2009;81:868–74.
L.J. Haupert et al. / Fuel 95 (2012) 634–641 641
168