Reactivity of Liquid and Semisolid Secondary Organic ... · Reactivity of Liquid and Semisolid...
11
Reactivity of Liquid and Semisolid Secondary Organic Carbon with Chloride and Nitrate in Atmospheric Aerosols Bingbing Wang,* ,† Rachel E. O’Brien, ‡,§ Stephen T. Kelly, ‡ John E. Shilling, ∥ Ryan C. Moffet, § Mary K. Gilles, ‡ and Alexander Laskin* ,† † Environmental Molecular Sciences Laboratory, Pacific Northwest National Laboratory, Richland, Washington 99354 United States ‡ Chemical Sciences Division, Lawrence Berkeley National Laboratory, Berkeley, California 94720, United States § Department of Chemistry, University of the Pacific, Stockton, California 95211, United States ∥ Atmospheric Sciences and Global Change Division, Pacific Northwest National Laboratory, Richland, Washington 99354, United States * S Supporting Information ABSTRACT: Constituents of secondary organic carbon (SOC) in atmospheric aerosols are often mixed with inorganic components and compose a significant mass fraction of fine particulate matter in the atmosphere. Interactions between SOC and other condensed-phase species are not well understood. Here, we investigate the reactions of liquid-like and semisolid SOC from ozonolysis of limonene (LSOC) and α-pinene (PSOC) with NaCl using a set of complementary microspectroscopic analyses. These reactions result in chloride depletion in the condensed phase, release of gaseous HCl, and formation of organic salts. The reactions attributed to acid displacement by SOC acidic components are driven by the high volatility of HCl. Similar reactions can take place in SOC/NaNO 3 particles. The results show that an increase in SOC mass fraction in the internally mixed SOC/NaCl particles leads to higher chloride depletion. Glass transition temperatures and viscosity of PSOC were estimated for atmospherically relevant conditions. Data show that the reaction extent depends on SOC composition, particle phase state and viscosity, mixing state, temperature, relative humidity (RH), and reaction time. LSOC shows slightly higher potential to deplete chloride than PSOC. Higher particle viscosity at low temperatures and RH can hinder these acid displacement reactions. Formation of organic salts from these overlooked reactions can alter particle physiochemical properties and may affect their reactivity and ability to act as cloud condensation and ice nuclei. The release and potential recycling of HCl and HNO 3 from reacted aerosol particles may have important implications for atmospheric chemistry. 1. INTRODUCTION Atmospheric aerosol particles play important roles in atmospheric chemistry, global radiation budget, hydrological cycle, climate, and health. 1−4 Particles affect radiation directly by scattering and absorbing radiation and indirectly through aerosol−cloud interactions by acting as cloud condensation and ice nuclei. 5−9 They can also alter atmospheric gas and condensed phase species through various multiphase reactions. SOC originating from oxidation of anthropogenic and biogenic volatile organic compounds represent a significant portion of fine particle mass. 10−12 Recent studies showed that SOC can adopt liquid, semisolid (viscous), and solid phase states depending on the composition and ambient conditions. 13,14 Physical properties, interactions with water vapor, gas-particle partitioning, and reactivity of SOC in aerosol particles may strongly depend on its phase state and viscosity. 6,13−33 Effects of phase states on the SOC reactivity with other atmospheric constituents are poorly understood. To date, few studies have investigated the effects of particle phase on gas-particle uptake of NO 3 ,O 3 , and NH 3 . 15,18,21,25,27,34 To our knowledge, there are no studies that examine the reactivity of SOC with condensed-phase species as a function of particle phase states. Here, we investigate the reactivity of SOC with chloride and nitrate and its dependence on SOC phase state and viscosity, particle mixing state, temperature, RH, and reaction time. The glass transition temperature, T g , is the transition point between liquid/semisolid and solid states. T g can be used as a representative temperature below which SOC is in an amorphous solid state and above which SOC adopts a semisolid or liquid state. 18,35−37 For organic particles, various factors can affect T g including molecular weight of organics, oxidation level (O/C ratio), mixing state, and water content. 6,18 In equilibrium, RH is equal to the water activity (a w ) and determines the water content of particles. Water (T g of 136 K) can serve as a plasticizer in particles and reduce the T g of Special Issue: Mario Molina Festschrift Received: October 13, 2014 Revised: November 10, 2014 Published: November 11, 2014 Article pubs.acs.org/JPCA © 2014 American Chemical Society 4498 dx.doi.org/10.1021/jp510336q | J. Phys. Chem. A 2015, 119, 4498−4508
Transcript of Reactivity of Liquid and Semisolid Secondary Organic ... · Reactivity of Liquid and Semisolid...

Reactivity of Liquid and Semisolid Secondary Organic Carbon withChloride and Nitrate in Atmospheric AerosolsBingbing Wang,*,† Rachel E. O’Brien,‡,§ Stephen T. Kelly,‡ John E. Shilling,∥ Ryan C. Moffet,§
Mary K. Gilles,‡ and Alexander Laskin*,†
†Environmental Molecular Sciences Laboratory, Pacific Northwest National Laboratory, Richland, Washington 99354 United States‡Chemical Sciences Division, Lawrence Berkeley National Laboratory, Berkeley, California 94720, United States§Department of Chemistry, University of the Pacific, Stockton, California 95211, United States∥Atmospheric Sciences and Global Change Division, Pacific Northwest National Laboratory, Richland, Washington 99354, UnitedStates
*S Supporting Information
ABSTRACT: Constituents of secondary organic carbon (SOC) in atmosphericaerosols are often mixed with inorganic components and compose a significantmass fraction of fine particulate matter in the atmosphere. Interactions betweenSOC and other condensed-phase species are not well understood. Here, weinvestigate the reactions of liquid-like and semisolid SOC from ozonolysis oflimonene (LSOC) and α-pinene (PSOC) with NaCl using a set ofcomplementary microspectroscopic analyses. These reactions result in chloridedepletion in the condensed phase, release of gaseous HCl, and formation oforganic salts. The reactions attributed to acid displacement by SOC acidiccomponents are driven by the high volatility of HCl. Similar reactions can takeplace in SOC/NaNO3 particles. The results show that an increase in SOC massfraction in the internally mixed SOC/NaCl particles leads to higher chloridedepletion. Glass transition temperatures and viscosity of PSOC were estimated foratmospherically relevant conditions. Data show that the reaction extent dependson SOC composition, particle phase state and viscosity, mixing state, temperature, relative humidity (RH), and reaction time.LSOC shows slightly higher potential to deplete chloride than PSOC. Higher particle viscosity at low temperatures and RH canhinder these acid displacement reactions. Formation of organic salts from these overlooked reactions can alter particlephysiochemical properties and may affect their reactivity and ability to act as cloud condensation and ice nuclei. The release andpotential recycling of HCl and HNO3 from reacted aerosol particles may have important implications for atmospheric chemistry.
1. INTRODUCTION
Atmospheric aerosol particles play important roles inatmospheric chemistry, global radiation budget, hydrologicalcycle, climate, and health.1−4 Particles affect radiation directlyby scattering and absorbing radiation and indirectly throughaerosol−cloud interactions by acting as cloud condensation andice nuclei.5−9 They can also alter atmospheric gas andcondensed phase species through various multiphase reactions.SOC originating from oxidation of anthropogenic and biogenicvolatile organic compounds represent a significant portion offine particle mass.10−12 Recent studies showed that SOC canadopt liquid, semisolid (viscous), and solid phase statesdepending on the composition and ambient conditions.13,14
Physical properties, interactions with water vapor, gas-particlepartitioning, and reactivity of SOC in aerosol particles maystrongly depend on its phase state and viscosity.6,13−33 Effectsof phase states on the SOC reactivity with other atmosphericconstituents are poorly understood. To date, few studies haveinvestigated the effects of particle phase on gas-particle uptakeof NO3, O3, and NH3.
15,18,21,25,27,34 To our knowledge, there
are no studies that examine the reactivity of SOC withcondensed-phase species as a function of particle phase states.Here, we investigate the reactivity of SOC with chloride andnitrate and its dependence on SOC phase state and viscosity,particle mixing state, temperature, RH, and reaction time.The glass transition temperature, Tg, is the transition point
between liquid/semisolid and solid states. Tg can be used as arepresentative temperature below which SOC is in anamorphous solid state and above which SOC adopts asemisolid or liquid state.18,35−37 For organic particles, variousfactors can affect Tg including molecular weight of organics,oxidation level (O/C ratio), mixing state, and water content.6,18
In equilibrium, RH is equal to the water activity (aw) anddetermines the water content of particles. Water (Tg of 136 K)can serve as a plasticizer in particles and reduce the Tg of
Special Issue: Mario Molina Festschrift
Received: October 13, 2014Revised: November 10, 2014Published: November 11, 2014
Article
pubs.acs.org/JPCA
© 2014 American Chemical Society 4498 dx.doi.org/10.1021/jp510336q | J. Phys. Chem. A 2015, 119, 4498−4508

particles with organic components.13,38 As such, organicparticles with higher water content have lower Tg. Thus, RHis an important factor for determining the physical state ofparticles. Dynamic viscosity (η) can be used to characterize anddistinguish between liquid (η < 102 Pa s), semisolid (∼102−1012 Pa s), and solid states (>1012 Pa s).18 η can also be usedto estimate the diffusion coefficient of organic species or otherspecies within atmospheric particles.18
There is increasing evidence that organic acids can react withinorganic particles through multiphase gas-particle39−42 andaqueous reactions.43−49 Recently, we reported that condensed-phase water-soluble organic acids (noted as HA(org) herein)can efficiently react with chloride and nitrate particles resultingin organic salt formation and release of gaseous HCl andHNO3, a conclusion inferred from both field and laboratorystudies.43−47,50,51 Gaseous HCl or HNO3 is released fromaerosolized internally mixed HA(org)/inorganic particles as aresult of acid displacement through similar reaction mecha-nisms R1 and R2. These reactions are driven by the highervolatility of gas phase HCl and HNO3 products compared tothe volatility of HA(org).43−47,50,51 Reducing particle watercontent (decreasing RH) increases HCl and HNO3 concen-trations in aqueous particles. This will partition more HCl andHNO3 into the gas phase and shift the equilibrium of reactionsR1 and R2 to the right. Thus, the kinetics of these reactions canbe greatly enhanced when particles undergo dehydration/hydration cycles.
+ ↔ + ↑NaCl HA(org) NaA(org) HCl(aq) (aq,g) (aq,s) (aq,g) (R1)
+ ↔ + ↑NaNO HA(org) NaA(org) HNO3(aq) (aq,g) (aq,s) 3(aq,g)
(R2)
Here, NaA(org) denotes the corresponding salts of HA(org).HA(org) may originate both from primary emissions andsecondary organic formation. To better understand interactionsbetween HA(org) and inorganic components of atmosphericparticles, a systematic investigation was conducted on thereactions of SOC with NaCl and NaNO3 using a set ofcomplementary microspectroscopy techniques. The analysesinclude computer controlled scanning electron microscopy withenergy dispersive X-ray analysis (CCSEM/EDX), scanningtransmission X-ray microscopy with near edge X-ray absorptionfine structure spectroscopy (STXM/NEXAFS), and Fouriertransform infrared microspectroscopy (micro-FTIR). Theseanalyses provide comprehensive information on changes inparticle morphology, elemental composition, mixing state, andchemical bonding due to the reactions discussed above. Tg andη as a function of temperature and RH for PSOC wereestimated to provide further insights into the reactionmechanisms and the controlling factors. The results show a
significant effect of particle phase state and viscosity on SOCreactivity and that the reactions are also affected by SOCcomposition and reaction time.
2. EXPERIMENTAL METHODS
2.1. Sample Preparation. Figure 1 provides a graphicsummary of particle samples used in this study and theirpreparation methods.
First Set of Samples (Figure 1A). Particles were generatedfrom mixed aqueous solutions of secondary organic carbon(SOC) and NaCl (or NaNO3) at different mass ratios.Solutions with a total concentration of 0.2 g/L were used.Limonene SOC (LSOC) and α-pinene SOC (PSOC) weregenerated by dry ozonolysis of the corresponding precursor inan inflatable Teflon reaction chamber. The chamber was firstfilled with 400 L air and approximately 1 ppm of O3 at roomtemperature and RH < 5%. Then a 10 μL mixture containing75% (in volume) cyclohexane and 25% of D-limonene or α-pinene was injected in the chamber. Additional details on SOCgeneration are published elsewhere.52 After 40 min of reactiontime, SOC was collected on aluminum foil substrates, and theSOC was dissolved in deionized water (resistivity ≥18MΩ·cm).NaNO3 (>99%), NaCl (>99%), cyclohexane, D-limonene, andα-pinene (>98%) were obtained from Sigma-Aldrich. Aqueousparticles were first nebulized from solutions and thendehydrated by passing through a diffusion dryer. The RH atthe end of the dryer was <35% at ∼295 K. After the diffusiondryer, the particles were collected onto substrates prearrangedon the seventh and eighth stages (cutoff size, D50 = 0.56 and0.32 μm) of a Multi-Orifice Uniform Deposition Impactor(MOUDI; model 110-R, MSP, Inc.). Samples were collectedonto grid-supported carbon-filmed grids (Copper 400 meshgrids coated with Carbon Type-B films, Ted Pella, Inc.) forCCSEM/EDX and STXM/NEXAFS analysis, and onto Si3N4windows (100 nm thickness, Silson Ltd.) for micro-FTIRanalysis.
The Second Set of Samples (Figure 1B). Particles of NaClcoated with either LSOC or PSOC (thereafter referred as“SOC-coated particles”) were generated by condensing SOConto size selected NaCl seeding particles (∼100 nm) from theozonolysis of corresponding precursor at dry condition (<5%)in continuous flow environmental chamber at Pacific North-west National Laboratory (PNNL).53,54 The particles were thencollected onto the substrates by MOUDI as described above.The temperature inside the chamber was maintained at 292 and295 K for LSOC and PSOC generation, respectively. Particlesize distributions were measured using Scanning MobilityParticle Sizer (SMPS, TSI 3936) and a Condensation ParticleCounter (CPC, TSI 3775).
Figure 1. Summary of the investigated particle samples: (A) internally mixed SOC/NaCl particles at 1:1, 4:1, 8:1, and 16:1 mass ratios, andinternally mixed SOC/NaNO3 particles at 4:1 mass ratio; (B) SOC-coated NaCl particles generated in PNNL chamber; (C) SOC-coated NaClparticles exposed to various RH (>95%, 80%, and 65%) at 295 and 272 K. Investigated SOC including LSOC and PSOC. See the text for moredetails.
The Journal of Physical Chemistry A Article
dx.doi.org/10.1021/jp510336q | J. Phys. Chem. A 2015, 119, 4498−45084499
The Third Set of Samples (Figure 1C). NaCl particles coatedwith SOC were exposed to various RH (>95%, 80%, and 65%)at 295 and 272 K for 8−25 h. The setup for exposureexperiments is shown in Supporting Information (SI) FigureS1. Particle samples were exposed to humidified N2 gasgenerated by mixing a dry N2 flow and a water vapor saturatedN2 flow. The RH was adjusted by changing the dry and watervapor saturated N2 flow rates.55 Sample temperature wascontrolled by the water bath. A minimum of three independentsamples were analyzed for each particle composition. Over 60000 individual particles were analyzed by CCSEM/EDX.Except where specifically discussed later, generally particleswere dehydrated prior to analysis.2.2. CCSEM/EDX Analysis and X-ray Mapping. The
scanning electron microscope (SEM) (Quanta 3D model, FEI,Inc.) combined with an EDAX X-ray spectrometer and a Si(Li)detector with a 10 mm2 active area and an ATW2 window6,56
was used to determine the size, morphology, and elementalcomposition of individual particles. Particles collected on thethin carbon-film substrates were identified and imaged using amixed TE/BSE signal. Then, the X-ray spectrum for eachidentified particle was acquired at an acceleration voltage of 20kV and a beam current of 430 pA for 10 s. Elementalcompositions and equivalent circle diameters of individualparticles were determined from the recorded X-ray spectra andimages, respectively. Particle composition is reported in termsof atomic fractions and their ratios. More details on CCSEM/EDX analysis and X-ray mapping of individual particle arereported elsewhere.57,58
2.3. Micro-FTIR analysis. This analysis was used to identifythe functional groups in particle samples. Detailed descriptionof the micro-FTIR apparatus are reported elsewhere.59,60
Briefly, the micro-FTIR setup consists of a Bruker A590 IRoptical microscope, a Bruker IFS66/S FTIR spectrometer, anda mercury−cadmium−telluride detector. Particle samplescollected on a SiNx window were placed into a sealedenvironmental sample stage attached to the optical microscope.The sample stage allows the IR beam to pass through theparticle sample. The IR beam was positioned to pass throughthe particle sample by moving the sample within the stage. Allspectra were acquired in transmission mode by coadding 512scans between 500 and 4000 cm−1 with 4 cm−1 spectralresolution. Background spectra were collected using a separateparticle-free SiNx “reference” window. For each sample, fivebackground spectra were averaged and used as a referencespectrum. For the particle samples, an average of 15 spectra wasused for further data analysis. All spectra were acquired using a0.3 mm aperture at 295 ± 0.5 K under dry conditions (RH<10%). All sample spectra represent an ensemble of severalhundreds of particles.2.4. STXM/NEXAFS Analysis. STXM utilizes a focused soft
X-ray beam generated from the synchrotron light source toprobe functional groups within individual particles. By rasterscanning the sample at fixed photon energy, images areobtained. Spatially resolved X-ray spectra are measured as afunction of photon energy over the sample area. Particle mixingstate and the chemical composition of individual particles at∼35 nm size resolution can be identified by analyzing therecorded spectra. A recent review provides an overview of theapplication of this technique to atmospheric aerosols61 andtechnical details on STXM are published elsewhere.61−64
STXM/NEXAFS measurements were conducted at beamline
11.0.2 of the Advanced Light Source in Lawrence BerkeleyNational Laboratory.
2.5. Nano-DESI/HRMS. LSOC and PSOC samples wereanalyzed using a LTQ-Orbitrap high resolution massspectrometer (Thermo Electron, Bremen, Germany) equippedwith a custom built Nanospray Desorption ElectrosprayIonization Source (nano-DESI).65,66 The mass spectrometerwas operated in the positive-ion mode with a resolving powerof 100 000 at m/z 400. Analysis of the LSOC and PSOCsamples deposited on the PTFE membranes was performed bybringing the sample in contact with the nano-DESI probe. Massspectra were subsequently obtained by averaging the signal overthe time window during which the nano-DESI probe was incontact with the SOC sample. HRMS data were analyzed asdescribed in previous studies.67,68
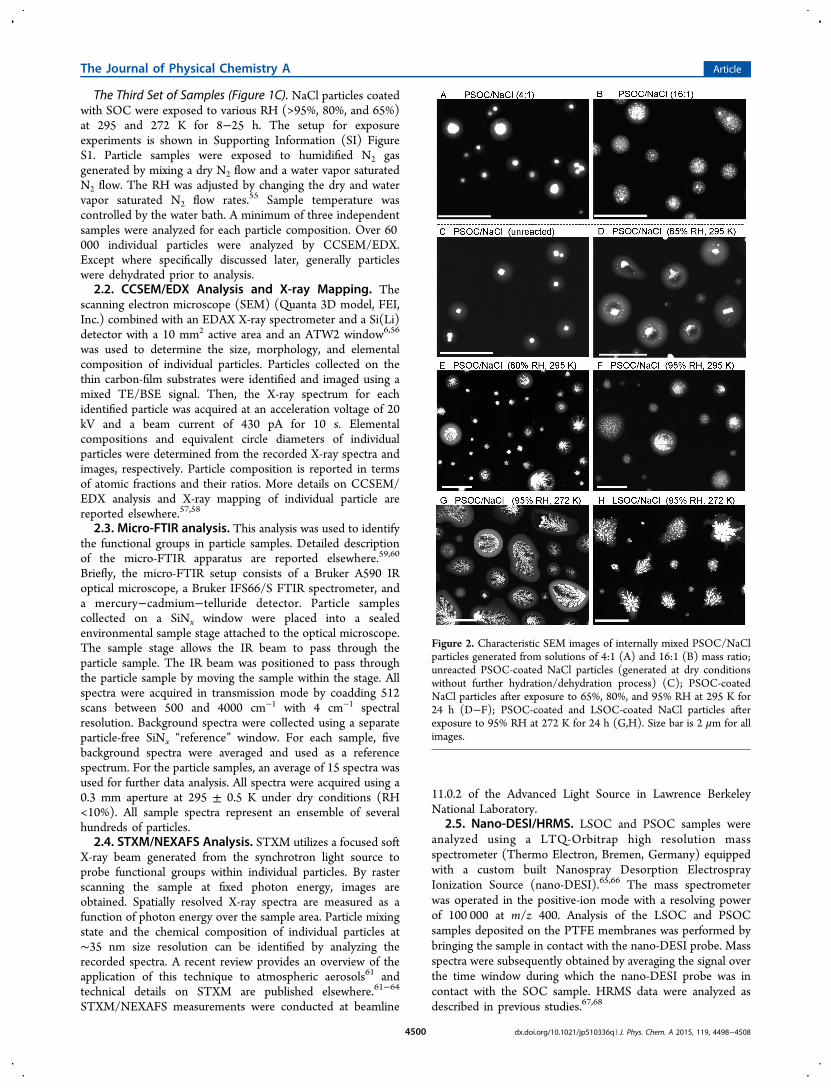
Figure 2. Characteristic SEM images of internally mixed PSOC/NaClparticles generated from solutions of 4:1 (A) and 16:1 (B) mass ratio;unreacted PSOC-coated NaCl particles (generated at dry conditionswithout further hydration/dehydration process) (C); PSOC-coatedNaCl particles after exposure to 65%, 80%, and 95% RH at 295 K for24 h (D−F); PSOC-coated and LSOC-coated NaCl particles afterexposure to 95% RH at 272 K for 24 h (G,H). Size bar is 2 μm for allimages.
The Journal of Physical Chemistry A Article
dx.doi.org/10.1021/jp510336q | J. Phys. Chem. A 2015, 119, 4498−45084500

3. RESULTS AND DISCUSSION
3.1. Reactions of SOC with NaCl and NaNO3. For thefirst set of experiments, the effect of SOC fraction on thereaction extent was investigated. Internally mixed particles weregenerated by nebulizing the solutions at different SOC/NaClmass ratios and then dehydrated before analysis. Figures 2A,Band S2 show typical SEM images for these dehydrated particles.Na-containing components (brighter part of the particlesshown in SEM images) are mixtures of NaCl and sodiumorganic salts (see later discussion on the organic saltformation). Particle morphology demonstrates the mixingstate of Na-containing components and SOC after dehydration.At lower SOC fractions, NaCl remains relatively intact. Withincreasing SOC fractions, particle morphology changesdramatically, indicating substantial reaction between NaCland SOC and that the particle composition changes afterreaction. Figures 3A,D show Cl/Na atomic ratios in internallymixed SOC/NaCl particles determined by CCSEM/EDXanalysis. Cl/Na ratios decrease from ∼0.95 to 0.3 as LSOC/NaCl and PSOC/NaCl mass ratios (in the original solutions)increase from 1:1 to 16:1. Chloride depletion is due to aciddisplacement by organic acid in SOC through reaction R1 andresults in the evaporation of HCl after dehydration. HigherSOC content provides more HA(org) to displace HCl andresults in greater chloride depletion. In general, at the samemass ratios, LSOC depletes chloride more effectively thanPSOC. This is consistent with LSOC having a relatively higherorganic acid content than PSOC (SI text and Figure S3). Inaddition, chloride depletion by LSOC is higher in smallerparticles, while chloride depletion due to PSOC exhibits nosignificant size dependence.
For the second set of experiments, the reactions of particleswith core/shell structures were investigated. Crystalline NaClparticles were coated with SOC in an environmental chamberunder dry conditions and then collected on substrates(thereafter referred to as “SOC-coated particles”). Multipleparticle samples were separately exposed to 65%, 80%, and 95%RH at 295 and 272 K for 24 h and then dehydrated prior toanalysis. SEM images of Figure 2C−H and Figure S2 show thatthe morphology for these reacted and dehydrated particles isdramatically changed by exposure to the different RH andtemperatures. These variations in particle morphology indicatedifferent extents of interactions/reactions. For PSOC-coatedparticles, the inclusions change from cubic shapes (unreactedNaCl cores, Figure 2C), to relatively intact (65% RH, Figure2D), and to distinct fractal structures (80% RH, Figure 2E; 95%RH, Figure 2F,G). Similar trends in morphological changeswere observed for LSOC-coated particles (Figures 2H and S2).Significant chloride depletion by LSOC and PSOC (up to 80%with Cl/Na ratio of ∼0.2) was observed (Figure 3B,C,E,F).Within the experimental uncertainties, temperature and RHdependences were observed for the chloride depletion byPSOC, but not for LSOC. PSOC-coated particles exposed tohigher RH before dehydration and analysis have enhancedchloride depletion. Smaller particles have higher chloridedepletion.The time dependence of the reactions was also examined.
PSOC-coated particles were exposed to water vapor at 95% RHand 295 K for 8, 16, and 25 h and then dehydrated prior toanalysis. Size and reaction time dependences for chloridedepletion by PSOC were observed as shown in Figure 4.Greater depletion was observed for smaller particles and forlonger reaction times. Cl/Na ratios down to 0.8, 0.5, and 0.25were measured when particles were exposed for 8, 16, and 25 h,
Figure 3. Mean Cl/Na atomic ratios for LSOC/NaCl (A,B,C) and PSOC/NaCl (D,E,F) particles determined by CCSEM/EDX analysis. Panels Aand D are for particles generated from solutions with mass ratios (SOC:NaCl) at 1:1 (gray), 4:1 (cyan), 8:1 (brown), and 16:1 (black); Panels B, C,E, and F are for SOC-coated NaCl particles after exposure to water vapor at 95% (green), 80% (orange), and 65% RH (blue) at 295 K (B,E) and 272K (C,F) for 24 h, respectively. Reference Cl/Na data for pure NaCl particles are shown in panels A and D (open squares). Dashed lines indicate thenominal Cl/Na = 1 ratio if no chloride depletion occurs. Representative uncertainties (one standard deviation) are shown in each panel.Uncertainties for other data sets (omitted for clarity) are similar to the representative uncertainties.
The Journal of Physical Chemistry A Article
dx.doi.org/10.1021/jp510336q | J. Phys. Chem. A 2015, 119, 4498−45084501

respectively. For 8 h exposure times, the fractal-like inclusionswere observed within the central part of the individual particles.For longer exposures, 16 and 25 h, the fractal-like inclusionswere distributed throughout the particles, indicating moreextensive reaction as compared to particles with shorterexposures (i.e., 8 h).For most of the investigated particles including those
exposed to RH higher than 80%, the inclusions are oftenlocated in the particle center after dehydration. You et al.(2014) showed that liquid−liquid phase separation wastypically observed in organic/inorganic particles includingorganic/NaCl mixtures when the O:C of organic species isless than 0.5.69 Based on the nano-DESI/HRMS analysis, theestimated average O:C ratio for LSOC and PSOC in this studyis 0.46 and 0.37, respectively. Thus, liquid−liquid phaseseparation most likely also occurred for the particles upondrying. The inorganic core and organic shell might then act as atemplate for the observed structure after efflorescence. Inaddition, the dendritic morphology of NaCl or organic sodiumsalt inclusions is likely a result of slow crystallization in theviscous particles upon dehydration. This is consistent withincreasing viscosity of SOC at lower RH, as will be discussed ina later section.
Figure 5A−C shows elemental maps of the reacted PSOC-coated particles. For the reacted particles, particle shells contain
substantial amounts of Na with nearly complete chloridedepletion, whereas the fractal-like inclusions are not as depletedin chloride, as indicated by the corresponding X-ray spectrashown in Figure 5G. This indicates that the particle shells mostlikely consist of SOC and sodium organic salts. This finding iscorroborated by STXM and micro-FTIR analyses, as will bediscussed later. Similar observations were also found in thereacted LSOC-coated particles (Figure S4). Figure 5D−F andFigure S5 illustrate aged sea salt particles collected during theCarbonaceous Aerosols and Radiative Effects Study (CARES)in Central California, where a significant fraction (∼60%−70%)of chloride depletion was attributed to acid displacement byorganic acids.43 The total chloride depletion in the organiccoating of these particles, without the presence of sulfate ornitrate, indicates the reactions between sea salt and organicmaterials (Figure S5). In comparison, SOC (which contains
Figure 4. Time dependence of chloride depletion by PSOC. (A) SEMimage for PSOC-coated NaCl particles before exposure to water vapor.(B,C,D) SEM images for particles after 8 (B), 16 (C), and 25 (D)hour reaction times. (E) Mean atomic ratios of Cl/Na as a function ofparticle size for PSOC-coated NaCl particles exposed to 95% RH at295 K for 8, 16, and 25 h. Dashed lines indicate the nominal Cl/Naratio of 1 if no chloride depletion occurs. Representative uncertainties(one standard deviation) are shown. Size bar is 3 μm for all the images.
Figure 5. SEM images and elemental (Na and Cl) mapping for PSOC-coated NaCl particles exposed to 95% RH at 272 K (A−C) and for atypical ambient particle collected during the CARES campaign (D−F).Panel G shows the spectra for the shell (between red and blue circlesin SEM image) and inclusion (inside blue circle) of a reacted PSOC/NaCl particle. Panel H shows the spectra for the coating (blue box)and inclusion (red box) of the ambient aged sea salt particle. All X-rayintensities are normalized to the intensity of Na peak. Size bar is 2 μmfor all images.
The Journal of Physical Chemistry A Article
dx.doi.org/10.1021/jp510336q | J. Phys. Chem. A 2015, 119, 4498−45084502

organic acids) can react with NaCl and results in morphologiesand chloride depletion similar to that observed in theatmospheric aged particles with secondary organic coatings.3.2. STXM and Micro-FTIR Characterization. STXM/
NEXAFS analysis provided imaging of sodium and carbonchemical bonding and mixing states of individual particles.62,70
Figure 6A−C shows characteristic carbon K-edge maps of the
COOH functional group (organic, green area) and inorganicmaterial (blue area) for unreacted and reacted PSOC-coatedNaCl particles. The morphology and mixing state of differentcomponents are consistent with SEM/EDX analysis. TheSTXM/NEXAFS measurements indicate the presence of asmall amount of Na and reduced Cl in the organic coating,before and after reaction, and are also consistent with SEM/EDX analysis. Figure 6D,E show the Na K-edge NEXAFSspectra for the NaCl inclusions (blue areas in Figure 6A,C) inunreacted and reacted particles, respectively. The shift of the1087.3 eV peak to 1088.1 eV is attributed to a reduction in theNa−Cl bond length.70 Removing Cl from the particles (organicmatrix) via reaction may introduce defects into the NaClinclusions and reduce the Na−Cl average bond length since theionic radius of Cl− is larger than that of Na+.Formation of NaA(org) salts was apparent in micro-FTIR
spectra acquired over large ensembles of reacted SOC/NaClparticles. Figure 6F shows spectra corresponding to the reacted
PSOC-coated NaCl particles plotted along with the referencespectrum of pure PSOC. A common feature of carboxylic acids(−COOH functional group at ∼1710 cm−1) is prominent in allthe spectra. PSOC/NaCl particles reacted at 4:1 and 16:1 massratios display a new strong feature characteristic of carboxylate(COONa) at ∼1580 and ∼1585 cm−1, respectively. The redshift for the higher PSOC/Na mass ratios indicates strongerinteractions between PSOC and the NaCl/HA(org) salt.Similar results were also obtained for LSOC/NaCl particles(Figure S6). To investigate the reaction between SOC andNaNO3, SOC/NaNO3 particles generated from solutions wereanalyzed by micro-FTIR after dehydration. Figure 6G showthat SOC/NaNO3 particles have a characteristic carboxylatepeak at ∼1585 cm−1, indicating the reaction between organicacids and NaNO3 and the formation of organic salts duringdehydration processes.
3.3. Effects of SOC Viscosity on Its Reactivity. Previousstudies showed that PSOC may adopt liquid, semisolid, andsolid states22,27,33 which could affect the uptake of reactive gasessuch as NH3.
25 To better understand the role of particle phasestates on the reactivity of SOC with chloride and nitrate, Tg forPSOC as a function of RH, Tg(RH), was estimated based onthe methods presented in previous studies6,13 using thefollowing equations:
=× + ×
+T
m T m
m
T
km
k
gw g,w org
w
g ,org
GT
org
GT (1)
κρρ
= = +
−⎛⎝⎜⎜
⎞⎠⎟⎟
RHa
m
m1001 w
w orgorg
org
w
1
(2)
where mi, ρi, and Tg,i are the mass fraction, density, and glasstransition temperature of the pure component, respectively; thesubscripts “w” and “org” refer to water and organic materials,respectively; kGT is the Gordon−Tayler constant for the specificorganic material representing the interaction between water andorganic solute; and korg is the hygroscopicity parameter of theorganic component. Based on eqs 1 and 2, Tg(RH) can beexpressed as
=× + ×
+T RH
T k f RH T
k f RH( )
( )
( )gg,w GT g,org
GT (3)
where
κ
ρ
ρ= = −
f RHm
mRH
RH( )
100 1org
w org
org
w (4)
First, with the assumption of PSOC adopting solid state at293 ± 1 K and 35 ± 5% RH,22 the Tg,org for pure PSOC wasestimated as 310 ± 15 K ranging from 295 to 328 K. kGT, κorg,ρorg, ρw of 2.5 ± 1.0,6,13,36,71 0.1 ± 0.04,72,73 1.4 ± 0.2 g cm−3,53,and 1.0 g cm−3 were used, respectively. The estimated Tg of 310± 15 K at 0% RH for PSOC is close to the upper value of 328± 13 K predicted by Berkemeier et al.28 Then, Tg(RH) wasderived using eq 3 and constrained by Tg,org of 310 K (at 0%RH) and Tg,w of 136 K (at 100% RH). Here we assume that awdoes not change significantly for constant solution compositionwith decreasing temperature.74 Figure 7A shows T−RH phasediagrams for PSOC. The black line shows Tg(RH) for PSOCwith Tg,org, kGT, κorg, ρorg, of 310 K, 3.5, 0.1, and 1.4 g cm−3,respectively. Tg(RH) reported here should be treated as an
Figure 6. Representative compositional mappings of unreacted (A)and reacted (B,C) PSOC/NaCl particles determined by STXM/NEXAFS using carbon K-edge spectra. Inorganic and organiccomponents are indicated in blue and green, respectively. (D,E) NaK-edge NEXAFS spectra for inclusions in unreacted and reactedPSOC/NaCl particles with reference spectrum of pure NaCl. Micro-FTIR spectra for PSOC/NaCl particles at 4:1 (cyan) and 16:1 (red)mass ratios (F) and LSOC/NaNO3 (cyan) and PSOC/NaNO3 (red)particles at 4:1 mass ratio (G). Reference FTIR spectra are shown forLSOC (dash lines), PSOC (dash lines), and NaNO3 (black line).
The Journal of Physical Chemistry A Article
dx.doi.org/10.1021/jp510336q | J. Phys. Chem. A 2015, 119, 4498−45084503

upper limit. Abramson et al., (2013) estimated the PSOCviscosity to be higher than 108 Pa s based on the evaporationexperiments at dry condition and room temperature.Based on the Tg(RH) estimated above, the temperature
dependence of viscosity for PSOC was calculated by theWilliams−Landel−Ferry equation:75,76
η η= +− −
+ −T
T T RH
T T RHlog( ( , RH)) log( )
17.44( ( ))
51.6 ( )Tg
gg
(5)
where η(T,RH) is the viscosity at T and RH, and ηTg of 1012 Pa
s is the viscosity at the glass transition points, Tg(RH). Theconstant η value of 102, 104, and 108 Pa s for PSOC are alsoshown in Figure 7A. To validate this approach, the estimated ηfor PSOC in this study are compared to experimentally
determined η by Renbaum−Wolff et al.22 at 293−295 K. Asshown in Figure 8, the estimated η here are in consistent with
the measured η by Renbaum−Wolff et al.22 Alternatively, onecan calculate Tg reversely using the Williams−Landel−Ferryequation (eq 5) from the measured η. As shown in Figure 7, itis consistent with Tg(RH) estimated here using eqs 3 and 4.Figure 7A and Table 1 show the estimated Tg and η of PSOCunder a range of RH and temperature pertinent to this study.Tg of PSOC decreases from 254.8 K at 65% RH to 166.3 K at95% RH. η of PSOC changes from ∼4.0 × 10⁻¹ (95% RH) to3.0 × 104 Pa s (65% RH) and from ∼1.9 × 10° (95% RH) to4.4 × 107 Pa s (65% RH) at 295 and 272 K, respectively. Underour experimental conditions, when the PSOC-coated NaClparticles were exposed to water vapor PSOC was either liquid(η < 102 Pa s) or semisolid (102 Pa s < η < 1012 Pa s).Estimated viscosity values were used to calculate the self-
diffusion coefficient (Dorg) and e-folding time of equilibration(τe) for PSOC molecular transport or mixing within particles.Dorg of organic species within a liquid or semisolid particle(organic matrix) can be calculated using the Stokes−Einsteinequation: Dorg = kBT/(6παη), where kB is the Boltzmannconstant, T is the temperature, α is the estimated PSOCmolecular radius of ∼0.38 nm,22 and η is the viscosity of theparticle derived in this study. τe showing the time of mass-transport or mixing by molecular diffusion within the particlescan be estimated according to τe = dp
2/4π2D, where dp is theparticle diameter and D is the diffusion coefficient of themolecule.18 Table 1 lists the Dorg for PSOC at the investigatedexperimental conditions. The τe for transport or mixing ofPSOC within a particle of 2 μm in diameter are also listed inTable 1.Dorg of 1.20 × 10⁻²⁰ and 2.46 × 10⁻¹⁷ m2 s−1 with
corresponding τe of 2344 and 1.1 h were estimated for PSOC at65% RH at 272 and 295 K, respectively. Characteristic τe forparticles reacted at higher RH conditions are less than 0.2 h.Diffusion coefficients for small molecules (such as H2O andHCl) are often several orders of magnitude higher than self-diffusion of PSOC within a semisolid organic matrix.16,37 Forexample, DH2O ranges from 10−17 to 10−8 m2 s−1 in glassy and
Figure 7. (A) Estimated η of PSOC as a function of temperature andRH. Dashed lines indicate η of 102 (green), 104 (brown), and 108
(blue) Pa s. Solid squares indicate η at temperature and RH values ofthis study, where PSOC is estimated to be in liquid-like (light green)and semisolid (light blue) states. Black line indicates the Tg (RH) ofPSOC (η = 1012 Pa s). Circles indicate the estimated Tg of PSOCderived from the reported η at ∼293 K by Renbaum-Woff et al.22 andassuming Tg of 293 K at 30% RH (open diamond). (B) Cl/Na ratiosreported in Figure 3E,F for reacted PSOC/NaCl particles as a functionof η for PSOC at 295 K (diamonds) and 272 K (triangles), at 65%(blue), 80% (orange), and 95% RH (green). Dashed and solid linesindicate η of pure water and solids (at η = 1012 Pa s), respectively.Gray, tan, and cyan areas indicate the temperature and RH conditionswhen PSOC is in solid (η > 1012 Pa s), semisolid (102 Pa s < η < 1012
Pa s), and liquid-like (η < 102 Pa s) states, respectively.
Figure 8. Comparison of estimated viscosity from this study withmeasured viscosity by Renbaum-Wolff et al.22 Circles and trianglesindicate the mean and upper limit of viscosity measured by Renbaum-Wolff et al.22 using “bead-mobility” (circle, at >70%RH) and “poke-flow” (triangles, at <70% RH) techniques, respectively. Solid anddashed lines indicate 1:1 and 2 orders of magnitude differences,respectively.
The Journal of Physical Chemistry A Article
dx.doi.org/10.1021/jp510336q | J. Phys. Chem. A 2015, 119, 4498−45084504

liquid organic matrix with aw higher than 0.2.36,37,77−79 Sincethe experiments were performed at a specific RH for 24 h above272 K, the diffusion of H2O/HCl is not expected to be thefactor limiting the reaction. However, self-diffusion of PSOCmay hinder the reaction with NaCl for particles with initialcore(NaCl)/shell(PSOC) structures. Figure 7B shows that Cl/Na ratios for reacted PSOC/NaCl particles (Figure 3E,F)increase at higher viscosities (i.e., > 102 Pa s) indicating lesschloride depletion. Thus, particle viscosity may have significanteffects on the acid displacement reaction. For example, nochloride depletion was observed at 272 K and 65% RH when ηis 4.4 × 10⁷ Pa s, whereas at 295 K and 95% RH when η is 0.4Pa s chloride was significantly depleted. Currently, no data areavailable for accurate estimates of Tg(RH) for LSOC. Since theoxidation state of LSOC is somewhat higher than PSOC (SItext) and LSOC is more hygroscopic, Tg(RH) of LSOC is likelylower than PSOC at high RH13. Therefore, LSOC may be lessviscous than PSOC under the investigated conditions and self-diffusion of LSOC would have less effect on the reaction. Thus,the Cl/Na ratios reported for LSOC/NaCl particles did notexhibit a strong RH dependence (Figure 3). It is worth notingthat the limited water content available in the particles is also acritical factor controlling the reaction at lower RH.For particles that are in a liquid-like state, the relatively short
τe shows that the reaction should not be hindered by thediffusion of PSOC, water, or HCl (Table 1). While thisindicates that chloride depletion by PSOC should be time-independent during the time scale of our experiments at highRH conditions, we observed higher chloride depletion forlonger reaction times at 295 K and 95% RH (Figure 4). Oneexplanation is that the reaction may also be controlled by theslowly evolving content of hydrolyzed PSOC material. This islikely a result of low acid dissociation constants of HA(org)present in fresh PSOC that do not produce enough protons tocomplete reaction R1. As PSOC interacts with water itsconstituents are slowly hydrolyzed to produce smalleracids27,80,81 that continue to dissociate during the course ofthe experiments (24 h) providing more protons for thereaction. Further studies on the reaction kinetics are needed.
4. SUMMARY AND IMPLICATIONS
This work shows that condensed-phase SOC from ozonolysisof limonene and α-pinene reacts with NaCl in aerosol particlesthrough acid displacement by organic acids. This reaction isdriven by the volatile HCl product degassing from aerosolparticles resulting in the release of gaseous HCl and formationof organic salts. Substantial chloride depletion and particlemorphology changes were observed for SOC/NaCl particles atvarious atmospherically relevant conditions. The reactions areexpected to hold for organic acids produced from other majortypes of biogenic and anthropogenic SOC precursors as well asother inorganic species. Analogous reactions are expected in
mixed SOC/NaNO3 particles based on the pilot FTIR datapresented here (Figure 6F) and in our previous work wherereactions R2 of selected HA(org)/NaNO3 and HA(org)/Ca(NO3)2 mixed particles were reported.44 We showed thatlow molecular weight water-soluble carboxylic acids can depletenitrate through similar reactions.44 Similar reactions were alsoreported for internally mixed particles containing calcitecomponents of mineral dust and condensed phase organicacids.48 The release of HCl and HNO3 from these reactions canaffect their gas-particle partitioning and react with otheratmospheric constituents, such as mineral dust. Potentialrecycling of HCl and HNO3 may alter the related atmosphericchemistry, for example, the continental and marine nitrylchloride formation.82 Formation of organic salts, likely with lowvolatility and reduced solubility,44,50 could change thepartitioning of organic acids in gas and condensed phase andthus affect the formation and atmospheric evolution of SOC.The resulting organic salts can contribute to a significantfraction of particle mass and may change particle composition,hygroscopicity,46,47,51 CCN activity,50,83 reactivity, opticalproperties, and ice nucleation ability.84
Glass transition temperatures and viscosity of PSOC as afunction of temperature and RH were estimated. Depending onreaction time and particle size, self-diffusion of PSOC withinhighly viscous or semisolid particles can hinder the reactionextent at low temperatures and RH. The phase state of not onlySOC but also inorganics such as metastable viscous brines ofNaNO3 and Ca(NO3)2 at low RH44,59 can affect the reactions.The results indicate that reaction of SOC with NaCl is adynamic process, and its extent is influenced by SOCcomposition, phase state and viscosity, temperature, RH, andparticle size. The estimated glass transition temperatures andviscosity for SOC can also be used to determine the diffusivitiesof water, oxidants, or organic molecules that in turn willinfluence water uptake, SOC formation, and heterogeneousreactions within or on the particle surfaces at atmosphericallyrelevant temperature and humidity. Further experimental andmodeling studies are needed on the reactivity of SOC fromdifferent precursors, reaction kinetics, other controlling factorson these reactions, and potential atmospheric impacts.
■ ASSOCIATED CONTENT
*S Supporting InformationSupporting Information includes the following materials:estimates of the SOC/NaCl mass ratios for the investigatedparticles and estimates of average O/C ratio of SOC;schematics of the setup for water vapor exposure experiments;additional SEM images, X-ray mapping, and micro-FTIRspectra of particles. This material is available free of chargevia the Internet at http://pubs.acs.org.
Table 1. Estimates of Glass Transition Temperature (Tg), Viscosity (η), Self-Diffusion Coefficient (Dorg), and e-Folding Time ofEquilibration (τe, for particles of 2 μm in diameter) for PSOC at the Investigated Experimental Conditions
η (Pa s) Dorg (m2 s−1) τe (hour)
RH (%) Tg (K) 295 K 272 K 295 K 272 K 295 K 272 K
65 254.8 3.0 × 10⁴ 4.4 × 10⁷ 2.46 × 10⁻¹⁷ 1.20 × 10⁻²⁰ 1.1 234480 223.0 8.0 × 101 3.2 × 10³ 8.20 × 10⁻¹⁵ 1.64 × 10⁻¹⁶ ∼0a 0.295 166.3 4.0 × 10⁻¹ 1.9 × 100 1.60 × 10⁻¹² 2.74 × 10⁻¹³ ∼0a ∼0a
aThe τe is less than 1 min.
The Journal of Physical Chemistry A Article
dx.doi.org/10.1021/jp510336q | J. Phys. Chem. A 2015, 119, 4498−45084505

■ AUTHOR INFORMATIONCorresponding Authors*E-mail: [email protected] (B.W.).*E-mail: [email protected] (A.L.).NotesThe authors declare no competing financial interest.
■ ACKNOWLEDGMENTSB.W., A.L., and J.E.S. acknowledge support from the ChemicalImaging Initiative of the Laboratory Directed Research andDevelopment program at Pacific Northwest National Labo-ratory (PNNL). The CCSEM/EDX, micro-FTIR, and nano-DESI/HRMS analyses were performed at EnvironmentalMolecular Sciences Laboratory, a national scientific user facilitysponsored by OBER at PNNL. PNNL is operated by the U.S.Department of Energy by Battelle Memorial Institute undercontract DE-AC06-76RL0. STXM/NEXAFS analysis at beam-line 11.0.2 of the Advanced Light Source at Lawrence BerkeleyNational Laboratory is supported by the Director, Office ofScience, Office of Basic Energy Sciences of the U.S.Department of Energy under Contract No. DE-AC02-05CH11231. M.K.G., S.T.K., and Beamline 11.0.2 alsoacknowledge support from the Office of Basic Energy SciencesDivision of Chemical Sciences, Geosciences, and Biosciences bythe Condensed Phase and Interfacial Molecular SciencesProgram of the U.S. Department of Energy. Sample collectionduring CARES field study and postdoctoral support for REOwere provided by the Atmospheric System Research (ASR)Program sponsored by the U.S. Department of Energy (DOE),Office of Science, Office of Biological and EnvironmentalResearch (OBER).
■ REFERENCES(1) Ramanathan, V.; Crutzen, P. J.; Kiehl, J. T.; Rosenfeld, D.Aerosols, Climate, and the Hydrological Cycle. Science 2001, 294,2119−2124.(2) Forster, P.; Ramaswamy, V.; Artaxo, P.; Berntsen, T.; Betts, R.Climate Change 2007: The Physical Science Basis; Contribution ofWorking Group I to the Fourth Assessment Report of theIntergovernmental Panel on Climate Change; Cambridge UniversityPress: Cambridge, New York, 2007.(3) Poschl, U. Atmospheric Aerosols: Composition, Transformation,Climate and Health Effects. Angew. Chem., Int. Ed. 2005, 44, 7520−7540.(4) Rosenfeld, D. Suppression of Rain and Snow by Urban andIndustrial Air Pollution. Science 2000, 287, 1793−1796.(5) Baker, M. B. Cloud Microphysics and Climate. Science 1997, 276,1072−1078.(6) Wang, B.; Lambe, A. T.; Massoli, P.; Onasch, T. B.; Davidovits,P.; Worsnop, D. R.; Knopf, D. A. The Deposition Ice Nucleation andImmersion Freezing Potential of Amorphous Secondary OrganicAerosol: Pathways for Ice and Mixed-Phase Cloud Formation. J.Geophys. Res.: Atmos. 2012, 117, D16209.(7) Hoose, C.; Mohler, O. Heterogeneous Ice Nucleation onAtmospheric Aerosols: A Review of Results from LaboratoryExperiments. Atmos. Chem. Phys. 2012, 12, 9817−9854.(8) Knopf, D. A.; Wang, B.; Laskin, A.; Moffet, R. C.; Gilles, M. K.Heterogeneous Nucleation of Ice on Anthropogenic Organic ParticlesCollected in Mexico City. Geophys. Res. Lett. 2010, 37, L11803.(9) Poschl, U.; Martin, S. T.; Sinha, B.; Chen, Q.; Gunthe, S. S.;Huffman, J. A.; Borrmann, S.; Farmer, D. K.; Garland, R. M.; Helas,G.; et al. Rainforest aerosols as biogenic nuclei of clouds andprecipitation in the Amazon. Science 2010, 329, 1513−1516.(10) Zhang, Q.; Jimenez, J. L.; Canagaratna, M. R.; Allan, J. D.; Coe,H.; Ulbrich, I.; Alfarra, M. R.; Takami, A.; Middlebrook, A. M.; Sun, Y.
L.; et al. Ubiquity and dominance of oxygenated species in organicaerosols in anthropogenically-influenced Northern Hemispheremidlatitudes. Geophys. Res. Lett. 2007, 34, L13801.(11) Jimenez, J. L.; Canagaratna, M. R.; Donahue, N. M.; Prevot, A.S. H.; Zhang, Q.; Kroll, J. H.; DeCarlo, P. F.; Allan, J. D.; Coe, H.; Ng,N. L.; et al. Evolution of organic aerosols in the atmosphere. Science2009, 326, 1525−1529.(12) Kanakidou, M.; Seinfeld, J. H.; Pandis, S. N.; Barnes, I.;Dentener, F. J.; Facchini, M. C.; Van Dingenen, R.; Ervens, B.; Nenes,A.; Nielsen, C. J.; et al. Organic aerosol and global climate modelling:A review. Atmos. Chem. Phys. 2005, 5, 1053−1123.(13) Koop, T.; Bookhold, J.; Shiraiwa, M.; Poschl, U. GlassTransition and Phase State of Organic Compounds: Dependency onMolecular Properties and Implications for Secondary Organic Aerosolsin the Atmosphere. Phys. Chem. Chem. Phys. 2011, 13, 19238−19255.(14) Virtanen, A.; Joutsensaari, J.; Koop, T.; Kannosto, J.; Yli-Pirilae,P.; Leskinen, J.; Maekelae, J. M.; Holopainen, J. K.; Poeschl, U.;Kulmala, M.; et al. An amorphous solid state of biogenic secondaryorganic aerosol particles. Nature 2010, 467, 824−827.(15) Zhou, S.; Shiraiwa, M.; McWhinney, R. D.; Poschl, U.; Abbatt, J.P. D. Kinetic Limitations in Gas-Particle Reactions Arising from SlowDiffusion in Secondary Organic Aerosol. Faraday Discuss. 2013, 165,391−406.(16) Shiraiwa, M.; Zuend, A.; Bertram, A. K.; Seinfeld, J. H. Gas-Particle Partitioning of Atmospheric Aerosols: Interplay of PhysicalState, Non-Ideal Mixing and Morphology. Phys. Chem. Chem. Phys.2013, 15, 11441−11453.(17) Shiraiwa, M.; Yee, L. D.; Schilling, K. A.; Loza, C. L.; Craven, J.S.; Zuend, A.; Ziemann, P. J.; Seinfeld, J. H. Size DistributionDynamics Reveal Particle-Phase Chemistry in Organic AerosolFormation. Proc. Natl. Acad. Sci. U.S.A. 2013, 110, 11746−11750.(18) Shiraiwa, M.; Ammann, M.; Koop, T.; Poschl, U. Gas Uptakeand Chemical Aging of Semisolid Organic Aerosol Particles. Proc. Natl.Acad. Sci. U.S.A. 2011, 108, 11003−11008.(19) Pajunoja, A.; Malila, J.; Hao, L. Q.; Joutsensaari, J.; Lehtinen, K.E. J.; Virtanen, A. Estimating the Viscosity Range of SOA ParticlesBased on Their Coalescence Time. Aerosol. Sci. Technol. 2014, 48, I−IV.(20) Vaden, T. D.; Imre, D.; Beranek, J.; Shrivastava, M.; Zelenyuk,A. Evaporation Kinetics and Phase of Laboratory and AmbientSecondary Organic Aerosol. Proc. Natl. Acad. Sci. U.S.A. 2011, 108,2190−2195.(21) Perraud, V.; Bruns, E. A.; Ezell, M. J.; Johnson, S. N.; Yu, Y.;Alexander, M. L.; Zelenyuk, A.; Imre, D.; Chang, W. L.; Dabdub, D.;et al. Nonequilibrium atmospheric secondary organic aerosolformation and growth. Proc. Natl. Acad. Sci. U.S.A. 2012, 109,2836−2841.(22) Renbaum-Wolff, L.; Grayson, J. W.; Bateman, A. P.; Kuwata, M.;Sellier, M.; Murray, B. J.; Shilling, J. E.; Martin, S. T.; Bertram, A. K.Viscosity of α-Pinene Secondary Organic Material and Implications forParticle Growth and Reactivity. Proc. Natl. Acad. Sci. U.S.A. 2013, 110,8014−8019.(23) Cappa, C. D.; Wilson, K. R. Evolution of Organic Aerosol MassSpectra Upon Heating: Implications for OA Phase and PartitioningBehavior. Atmos. Chem. Phys. 2011, 11, 1895−1911.(24) Abramson, E.; Imre, D.; Beranek, J.; Wilson, J.; Zelenyuk, A.Experimental Determination of Chemical Diffusion within SecondaryOrganic Aerosol Particles. Phys. Chem. Chem. Phys. 2013, 15, 2983−2991.(25) Kuwata, M.; Martin, S. T. Phase of Atmospheric SecondaryOrganic Material Affects Its Reactivity. Proc. Natl. Acad. Sci. U.S.A.2012, 109, 17354−17359.(26) Loza, C. L.; Coggon, M. M.; Nguyen, T. B.; Zuend, A.; Flagan,R. C.; Seinfeld, J. H. On the Mixing and Evaporation of SecondaryOrganic Aerosol Components. Environ. Sci. Technol. 2013, 47, 6173−6180.(27) Kidd, C.; Perraud, V.; Wingen, L. M.; Finlayson-Pitts, B. J.Integrating Phase and Composition of Secondary Organic Aerosol
The Journal of Physical Chemistry A Article
dx.doi.org/10.1021/jp510336q | J. Phys. Chem. A 2015, 119, 4498−45084506

from the Ozonolysis of α-Pinene. Proc. Natl. Acad. Sci. U.S.A. 2014,111, 7552−7557.(28) Berkemeier, T.; Shiraiwa, M.; Poschl, U.; Koop, T. Competitionbetween Water Uptake and Ice Nucleation by Glassy Organic AerosolParticles. Atmos. Chem. Phys. Discuss. 2014, 14, 16451−16492.(29) Adler, G.; Koop, T.; Haspel, C.; Taraniuk, I.; Moise, T.; Koren,I.; Heiblum, R. H.; Rudich, Y. Formation of Highly Porous AerosolParticles by Atmospheric Freeze-Drying in Ice Clouds. Proc. Natl.Acad. Sci. U.S.A. 2013, 110, 20414−20419.(30) You, Y.; Renbaum-Wolff, L.; Carreras-Sospedra, M.; Hanna, S.J.; Hiranuma, N.; Kamal, S.; Smith, M. L.; Zhang, X.; Weber, R. J.;Shilling, J. E.; et al. Images reveal that atmospheric particles canundergo liquid−liquid phase separations. Proc. Natl. Acad. Sci. U.S.A.2012, 109, 13188−13193.(31) O’Brien, R. E.; Neu, A.; Epstein, S. A.; MacMillan, A. C.; Wang,B.; Kelly, S. T.; Nizkorodov, S. A.; Laskin, A.; Moffet, R. C.; Gilles, M.K. Physical Properties of Ambient and Laboratory-GeneratedSecondary Organic Aerosol. Geophys. Res. Lett. 2014, 2014GL060219.(32) Lignell, H.; Hinks, M. L.; Nizkorodov, S. A. Exploring MatrixEffects on Photochemistry of Organic Aerosols. Proc. Natl. Acad. Sci.U.S.A. 2014, 111, 13780−13785.(33) Saukko, E.; Lambe, A. T.; Massoli, P.; Koop, T.; Wright, J. P.;Croasdale, D. R.; Pedernera, D. A.; Onasch, T. B.; Laaksonen, A.;Davidovits, P.; et al. Humidity-dependent phase state of SOA particlesfrom biogenic and anthropogenic precursors. Atmos. Chem. Phys. 2012,12, 7517−7529.(34) Shiraiwa, M.; Poschl, U.; Knopf, D. A. Multiphase ChemicalKinetics of NO3 Radicals Reacting with Organic Aerosol Componentsfrom Biomass Burning. Environ. Sci. Technol. 2012, 46, 6630−6636.(35) Debenedetti, P. G.; Stillinger, F. H. Supercooled Liquids and theGlass Transition. Nature 2001, 410, 259−267.(36) Zobrist, B.; Marcolli, C.; Pedernera, D. A.; Koop, T. DoAtmospheric Aerosols Form Glasses? Atmos. Chem. Phys. 2008, 8,5221−5244.(37) Zobrist, B.; Soonsin, V.; Luo, B. P.; Krieger, U. K.; Marcolli, C.;Peter, T.; Koop, T. Ultra-Slow Water Diffusion in Aqueous SucroseGlasses. Phys. Chem. Chem. Phys. 2011, 13, 3514−3526.(38) Mikhailov, E.; Vlasenko, S.; Martin, S. T.; Koop, T.; Poschl, U.Amorphous and Crystalline Aerosol Particles Interacting with WaterVapor: Conceptual Framework and Experimental Evidence forRestructuring, Phase Transitions and Kinetic Limitations. Atmos.Chem. Phys. 2009, 9, 9491−9522.(39) Tong, S. R.; Wu, L. Y.; Ge, M. F.; Wang, W. G.; Pu, Z. F.Heterogeneous Chemistry of Monocarboxylic Acids on α-Al2O3 atDifferent Relative Humidities. Atmos. Chem. Phys. 2010, 10, 7561−7574.(40) Usher, C. R.; Michel, A. E.; Grassian, V. H. Reactions onMineral Dust. Chem. Rev. 2003, 103, 4883−4939.(41) Shilling, J. E.; Connelly, B. M.; Tolbert, M. A. Uptake of SmallOxygenated Organic Molecules onto Ammonium Nitrate under UpperTropospheric Conditions. J. Phys. Chem. A 2006, 110, 6687−6695.(42) Wu, L.-Y.; Tong, S.-R.; Zhou, L.; Wang, W.-G.; Ge, M.-F.Synergistic Effects between SO2 and HCOOH on α-Fe2O3. J. Phys.Chem. A 2013, 117, 3972−3979.(43) Laskin, A.; Moffet, R. C.; Gilles, M. K.; Fast, J. D.; Zaveri, R. A.;Wang, B. B.; Nigge, P.; Shutthanandan, J. Tropospheric Chemistry ofInternally Mixed Sea Salt and Organic Particles: Surprising Reactivityof NaCl with Weak Organic Acids. J. Geophys. Res.: Atmos. 2012, 117,D15302.(44) Wang, B.; Laskin, A. Reactions between Water-Soluble OrganicAcids and Nitrates in Atmospheric Aerosols: Recycling of Nitric Acidand Formation of Organic Salts. J. Geophys. Res.: Atmos. 2014, 119,3335−3351.(45) Kerminen, V. M.; Teinila, K.; Hillamo, R.; Pakkanen, T.Substitution of Chloride in Sea-Salt Particles by Inorganic and OrganicAnions. J. Aerosol. Sci. 1998, 29, 929−942.(46) Ghorai, S.; Wang, B.; Tivanski, A.; Laskin, A. HygroscopicProperties of Internally Mixed Particles Composed of Nacl and Water-Soluble Organic Acids. Environ. Sci. Technol. 2014, 48, 2234−2241.
(47) Ma, Q.; Ma, J.; Liu, C.; Lai, C.; He, H. Laboratory Study on theHygroscopic Behavior of External and Internal C2−C4 DicarboxylicAcid−NaCl Mixtures. Environ. Sci. Technol. 2013, 47, 10381−10388.(48) Laskina, O.; Young, M. A.; Kleiber, P. D.; Grassian, V. H.Infrared Extinction Spectroscopy and Micro-Raman Spectroscopy ofSelect Components of Mineral Dust Mixed with Organic Compounds.J. Geophys. Res.: Atmos. 2013, 118, 6593−6606.(49) Ervens, B.; Turpin, B. J.; Weber, R. J. Secondary OrganicAerosol Formation in Cloud Droplets and Aqueous Particles(aqSOA): A Review of Laboratory, Field and Model Studies. Atmos.Chem. Phys. 2011, 11, 11069−11102.(50) Drozd, G.; Woo, J.; Hakkinen, S. A. K.; Nenes, A.; McNeill, V.F. Inorganic Salts Interact with Oxalic Acid in Submicron Particles toForm Material with Low Hygroscopicity and Volatility. Atmos. Chem.Phys. 2014, 14, 5205−5215.(51) Beardsley, R.; Jang, M.; Ori, B.; Im, Y.; Delcomyn, C. A.;Witherspoon, N. Role of Sea Salt Aerosols in the Formation ofAromatic Secondary Organic Aerosol: Yields and HygroscopicProperties. Environ. Chem. 2013, 10, 167−177.(52) Bateman, A. P.; Nizkorodov, S. A.; Laskin, J.; Laskin, A. Time-Resolved Molecular Characterization of Limonene/Ozone AerosolUsing High-Resolution Electrospray Ionization Mass Spectrometry.Phys. Chem. Chem. Phys. 2009, 11, 7931−7942.(53) Shilling, J. E.; Chen, Q.; King, S. M.; Rosenoern, T.; Kroll, J. H.;Worsnop, D. R.; McKinney, K. A.; Martin, S. T. Particle Mass Yield inSecondary Organic Aerosol Formed by the Dark Ozonolysis of α-Pinene. Atmos. Chem. Phys. 2008, 8, 2073−2088.(54) Liu, S.; Shilling, J. E.; Song, C.; Hiranuma, N.; Zaveri, R. A.;Russell, L. M. Hydrolysis of Organonitrate Functional Groups inAerosol Particles. Aerosol. Sci. Technol. 2012, 46, 1359−1369.(55) Wang, B.; Knopf, D. A. Heterogeneous Ice Nucleation onParticles Composed of Humic-Like Substances Impacted by O3. J.Geophys. Res.: Atmos. 2011, 116, D03205.(56) Laskin, A.; Moffet, R. C.; Gilles, M. K.; Fast, J. D.; Zaveri, R. A.;Wang, B. B.; Nigge, P.; Shutthanandan, J. Tropospheric Chemistry ofInternally Mixed Sea Salt and Organic Particles: Surprising Reactivityof NaCl with Weak Organic Acids. J. Geophys. Res.: Atmos. 2012, 117,D15302.(57) Laskin, A., Electron Beam Analysis and Microscopy ofIndividual Particles. In Fundamentals and Applications in AerosolSpectroscopy; Signorell, R., Reid, J., Eds.; Taylor and Francis Books,Inc.: Boca Raton, FL, 2010; pp 463−491.(58) Laskin, A.; Cowin, J. P.; Iedema, M. J. Analysis of IndividualEnvironmental Particles Using Modern Methods of ElectronMicroscopy and X-ray Microanalysis. J. Electron Spectrosc. Relat.Phenom. 2006, 150, 260−274.(59) Liu, Y.; Yang, Z.; Desyaterik, Y.; Gassman, P. L.; Wang, H.;Laskin, A. Hygroscopic Behavior of Substrate-Deposited ParticlesStudied by Micro-FTIR Spectroscopy and Complementary Methodsof Particle Analysis. Anal. Chem. 2008, 80, 633−642.(60) Cain, J. P.; Gassman, P. L.; Wang, H.; Laskin, A. Micro-FTIRStudy of Soot Chemical Composition-Evidence of Aliphatic Hydro-carbons on Nascent Soot Surfaces. Phys. Chem. Chem. Phys. 2010, 12,5206−5218.(61) Moffet, R. C.; Tivanski, A. V.; Gilles, M. K. Scanning X-rayTransmission Microscopy: Applications in Atmospheric AerosolResearch. In Fundamentals and Applications in Aerosol Spectroscopy;Signorell, R., Reid, J. P., Eds.; Taylor and Francis Books, Inc: BocaRaton, FL, 2010; pp 419−462.(62) Moffet, R. C.; Henn, T.; Laskin, A.; Gilles, M. K. AutomatedChemical Analysis of Internally Mixed Aerosol Particles Using X-raySpectromicroscopy at the Carbon K-Edge. Anal. Chem. 2010, 82,7906−7914.(63) Moffet, R. C.; Rodel, T. C.; Kelly, S. T.; Yu, X. Y.; Carroll, G. T.;Fast, J.; Zaveri, R. A.; Laskin, A.; Gilles, M. K. Spectro-MicroscopicMeasurements of Carbonaceous Aerosol Aging in Central California.Atmos. Chem. Phys. 2013, 13, 10445−10459.(64) Kelly, S. T.; Nigge, P.; Prakash, S.; Laskin, A.; Wang, B.;Tyliszczak, T.; Leone, S. R.; Gilles, M. K. An Environmental Sample
The Journal of Physical Chemistry A Article
dx.doi.org/10.1021/jp510336q | J. Phys. Chem. A 2015, 119, 4498−45084507

Chamber for Reliable Scanning Transmission X-ray MicroscopyMeasurements under Water Vapor. Rev. Sci. Instrum. 2013, 84, 073708.(65) Roach, P. J.; Laskin, J.; Laskin, A. Molecular Characterization ofOrganic Aerosols Using Nanospray-Desorption/Electrospray Ioniza-tion-Mass Spectrometry. Anal. Chem. 2010, 82, 7979−7986.(66) Roach, P. J.; Laskin, J.; Laskin, A. Nanospray DesorptionElectrospray Ionization: An Ambient Method for Liquid-ExtractionSurface Sampling in Mass Spectrometry. Analyst 2010, 135, 2233−2236.(67) Roach, P. J.; Laskin, J.; Laskin, A. Higher-Order Mass DefectAnalysis for Mass Spectra of Complex Organic Mixtures. Anal. Chem.2011, 83, 4924−4929.(68) Nizkorodov, S. A.; Laskin, J.; Laskin, A. Molecular Chemistry ofOrganic Aerosols through the Application of High Resolution MassSpectrometry. Phys. Chem. Chem. Phys. 2011, 13, 3612−3629.(69) You, Y.; Smith, M. L.; Song, M.; Martin, S. T.; Bertram, A. K.Liquid−Liquid Phase Separation in Atmospherically Relevant ParticlesConsisting of Organic Species and Inorganic Salts. Int. Rev. Phys. Chem.2014, 33, 43−77.(70) Riedler, M.; de Castro, A. R. B.; Kolmakov, A.; Lofken, J. O.;Nowak, C.; Soldatov, A. V.; Wark, A.; Yalovega, G.; Moller, T. Na 1sPhotoabsorption of Free and Deposited NaCl Clusters: Developmentof Bond Length with Cluster Size. Phys. Rev. B 2001, 64, 245419.(71) Dette, H. P.; Qi, M.; Schroder, D. C.; Godt, A.; Koop, T. Glass-Forming Properties of 3-Methylbutane-1,2,3-Tricarboxylic Acid and ItsMixtures with Water and Pinonic Acid. J. Phys. Chem. A 2014, 118,7024−7033.(72) Petters, M. D.; Wex, H.; Carrico, C. M.; Hallbauer, E.; Massling,A.; McMeeking, G. R.; Poulain, L.; Wu, Z.; Kreidenweis, S. M.;Stratmann, F. Towards Closing the Gap between Hygroscopic Growthand Activation for Secondary Organic Aerosol − Part 2: TheoreticalApproaches. Atmos. Chem. Phys. 2009, 9, 3999−4009.(73) Frosch, M.; Bilde, M.; DeCarlo, P. F.; Juranyi, Z.; Tritscher, T.;Dommen, J.; Donahue, N. M.; Gysel, M.; Weingartner, E.;Baltensperger, U. Relating Cloud Condensation Nuclei Activity andOxidation Level of α-Pinene Secondary Organic Aerosols. J. Geophys.Res.: Atmos. 2011, 116, D22212.(74) Koop, T.; Luo, B. P.; Tsias, A.; Peter, T. Water Activity as theDeterminant for Homogeneous Ice Nucleation in Aqueous Solutions.Nature 2000, 406, 611−614.(75) Williams, M. L.; Landel, R. F.; Ferry, J. D. The TemperatureDependence of Relaxation Mechanisms in Amorphous Polymers andOther Glass-Forming Liquids. J. Am. Chem. Soc. 1955, 77, 3701−3707.(76) Schill, G. P.; Tolbert, M. A. Heterogeneous Ice Nucleation onPhase-Separated Organic-Sulfate Particles: Effect of Liquid vs. GlassyCoatings. Atmos. Chem. Phys. 2013, 13, 4681−4695.(77) Power, R. M.; Simpson, S. H.; Reid, J. P.; Hudson, A. J. TheTransition from Liquid to Solid-like Behaviour in Ultrahigh ViscosityAerosol Particles. Chem. Sci. 2013, 4, 2597−2604.(78) Bones, D. L.; Reid, J. P.; Lienhard, D. M.; Krieger, U. K.Comparing the Mechanism of Water Condensation and Evaporationin Glassy Aerosol. Proc. Natl. Acad. Sci. U.S.A. 2012, 109, 11613−11618.(79) Price, H. C.; Murray, B. J.; Mattsson, J.; O’Sullivan, D.; Wilson,T. W.; Baustian, K. J.; Benning, L. G. Quantifying Water Diffusion inHigh-Viscosity and Glassy Aqueous Solutions Using a Raman IsotopeTracer Method. Atmos. Chem. Phys. 2014, 14, 3817−3830.(80) Johnson, D.; Marston, G. The Gas-Phase Ozonolysis ofUnsaturated Volatile Organic Compounds in the Troposphere.Chem. Soc. Rev. 2008, 37, 699−716.(81) Yasmeen, F.; Vermeylen, R.; Szmigielski, R.; Iinuma, Y.; Boge,O.; Herrmann, H.; Maenhaut, W.; Claeys, M. Terpenylic Acid andRelated Compounds: Precursors for Dimers in Secondary OrganicAerosol from the Ozonolysis of α- and β-Pinene. Atmos. Chem. Phys.2010, 10, 9383−9392.(82) Thornton, J. A.; Kercher, J. P.; Riedel, T. P.; Wagner, N. L.;Cozic, J.; Holloway, J. S.; Dube, W. P.; Wolfe, G. M.; Quinn, P. K.;Middlebrook, A. M.; et al. A large atomic chlorine source inferred from
mid-continental reactive nitrogen chemistry. Nature 2010, 464, 271−274.(83) Wu, Z. J.; Nowak, A.; Poulain, L.; Herrmann, H.; Wiedensohler,A. Hygroscopic Behavior of Atmospherically Relevant Water-SolubleCarboxylic Salts and Their Influence on the Water Uptake ofAmmonium Sulfate. Atmos. Chem. Phys. 2011, 11, 12617−12626.(84) Knopf, D. A.; Alpert, P. A.; Wang, B.; O’Brien, R. E.; Kelly, S.T.; Laskin, A.; Gilles, M. K.; Moffet, R. C. Microspectroscopic Imagingand Characterization of Individually Identified Ice Nucleating Particlesfrom a Case Field Study. J. Geophys. Res.: Atmos. 2014, 119, 10,365−10,381.
The Journal of Physical Chemistry A Article
dx.doi.org/10.1021/jp510336q | J. Phys. Chem. A 2015, 119, 4498−45084508