REACTION KINETICS AND MASS TRANSFER...
194
Transcript of REACTION KINETICS AND MASS TRANSFER...


1
REACTION KINETICS AND MASS TRANSFER STUDIES IN SELECTIVE LEACHING OF LOW-GRADE
CALCAREOUS PHOSPHATE ROCK
A thesis submitted
To
BAHAUDDIN ZAKARIYA UNIVERSTY, MULTAN
in
Fulfillment of requirements for the degree
of
DOCTOR OF PHILOSOPHY
in
CHEMISTRY
by
MUHAMMAD ASHRAF
DEPARTMENT OF CHEMISTRY
BAHAUDDIN ZAKARIYA UNIVERSITY
MULTAN, PAKISTAN
2010

2
DEDICATED TO
My wife
and
Elder brother Ch. Jahan Khan

3
DECLARATION I hereby declare that the work described in this thesis was carried out by under the supervision of Prof. Dr. Zafar Iqbal Zafar and Prof. Dr. Tariq Mehmod Ansari at the Department of Chemistry, Bahauddin Zakariya University, Multan, for the degree of Doctor of Philosophy in Chemistry. I also hereby declare that the substance of this thesis has neither been submitted elsewhere nor is being concurrently submitted for any other degree. I further declare that the work embodied in this is the result of my own research and where work of any other investigator has been used, that has been duly acknowledged.
Muhammad Ashraf
4
CERTIFICATE
It is certified that the work contained in this thesis has been carried out under our supervision and is approved for submission in fulfillment of the requirement for the degree of Doctor of Philosophy in the subject of chemistry. 1. Prof. Dr. Zafar Iqbal Zafar 2. Prof. Dr. Tariq Mehmod Ansari Department of Chemistry Department of Chemistry Bahauddin Zakariya University, Bahauddin Zakariya University, Multan, Pakistan Multan, Pakistan

5
ACKNOWLEDGEMENTS
All praises be to ALMIGHTY ALLAH (SWT), who bestowed man with intelligence,
knowledge and sight to observe and ponder. Peace and blessing of Allah (SWT) be upon the Holy
Prophet MUHAMMAD (SAW), who exhorted his followers to seek knowledge from cradle to
grave.
I feel great pleasure in expressing my sincere gratitude and profound thanks to my research
Supervisor, Prof. Dr. Zafar Iqbal Zafar, Department of Chemistry, Bahauddin Zakariya
University, Multan for his kind guidance and full cooperation throughout the research work. I am
also thankful to my second Supervisor Prof. Dr. Tariq Mahmood Ansari, Department of
Chemistry, Bahauddin Zakariya University, Multan, for his guidance and thought provoking
discussions during these studies. I am also grateful to Prof. Dr. Humayun Pervez, Ex- Chairman
Department of Chemistry, Bahauddin Zakariya University, Multan for providing the research
facilities. I am obliged to express my thanks to Prof. Dr Shahida B. Niazi, Dean of Faculty
Science & Agriculture, who encouraged and facilitated the whole PhD study registration process.
I feel greatly obliged to Prof. Dr. Muhammad Arif (Chairman Department of Chemistry)
and Prof. Dr. Muhammad Aslam Malana, Department of Chemistry, Bahauddin Zakariya
University, Multan for their help and valuable guidance during the research work. I am also
thankful to all the other teachers of Department of Chemistry, Bahauddin Zakariya University,
Multan for their continuous support. I am thankful to the Department of Chemistry, Bahauddin
Zakariya University, Multan for providing me the research facilities, Pak-Arab Fertilizer and
NFC Institute of Chemical Engineering and Technological Centre, Khanewal Road, Multan, for
help in sample crushing, grinding and sieving.
I would like to express my gratitude for Prof. Dr. Muhammad Shakirullah Khan, Institute of
Chemical Sciences, University of Peshawar, for his cooperation in providing the facilities for
instrumental analysis, P. C. S. I. R. laboratories, Lahore is gratefully acknowledged for

6
providing the facilities of thermal analysis. I am thankful to Kohistan Engineering Ltd,
Abbot Abad, for their help in collection of phosphate ore samples. I am also thankful to
the Hazara Phosphate Fertilizers for their help to complete this research work.
I am highly obliged to my elder brother (Gen) Dr. Ahmad Khan and his wife Razia
Ahmed for their moral support and encouragement during the higher education. I feel
myself lucky enough to find very sincere friends, like Sajjad Hussain, Zahoor Ahmed,
Muhammad Saleem, Muhammad Shafi, Nazar, Ajmal and Javeed, who were eager to
listen about my success.
Many thanks to the staff of the laboratories of Inorganic, Organic, Physical and
Analytical Chemistry, Shafi Dogar, Ajmal, Riaz, Ishfaq, Yousaf, Ashraf, Akram, Riaz
Mettela and Javeed, who arranged all the requirements whenever I needed.
I also acknowledge the prayers and well wishes of my elders, Asghar Ali Jalli, Rana
Sajjad Hussain, who encouraged me all the time during the research work. I am very
grateful to my college Principal and all the Colleagues whose moral support encouraged
me to complete the research work. I also gratefully acknowledge the pleasant feelings of
my family, brothers, sisters and my children, Ali, Fizza and Ghana, who also felt my
absence during the research work, as I could not spare time for them. Concluding this
work, I feel pleasure that I may spend much time with them in future.
Muhammad Ashraf

7
LIST OF CONTENTS Page No
DEDICATION 1
DECLARATION 2
CERTIFICATE 3
ACKNOWLEDGEMENT 4
CONTANTS 6
LIST OF TABLES 9
LIST OF FIGURES 11
ABSTRACT 15
CHAPTER NO 1 17
1. INTRODUCTION 17
1.1 Flotation Method 19
1.1.1 Siliceous Ores 20
1.1.2 Dolomite Ores 22
1.1.3 Highly Selective Collectors for Apatite in Igneous Ores 24
1.1.4 Depressants for Apatite in Sedimentary Ores 25
1.1.5 Selective Collectors for Carbonates in Sedimentary Ores 26
1.2 Other Flotation Separation Techniques 27
1.3 Magnetic separation Techniques 31
1.4 Calcination Method 32
1.5 Electrostatic Upgrading 35
1.6 Bioleaching of phosphate ores 36
1.7 Partial Acidulation of phosphate ores 37

8
1.7.1 Run-of-Pile (ROP) Process for PAPR 38
1.7.2 Single-Step Acidulation/Granulation (SSAG) Process 39
1.8 Direct Application of Phosphate Rock 40
1.9 Dissolution and Selective Leaching 41
CHAPTER 2 47
2. Chemistry of the Leaching Process 47
CHAPTER 3 52
3. Material and Methods 52
3.1 Sample Collection 53
3.2 Size reduction and sieving 59
3.3 Sample Preparation for Analysis 63
3.4 Selective Leaching with Lactic Acid 69
3.5 Experimental Procedure 75
3.6 CHAMICALS USED 77
3.7 Instrumental Techniques Used for Analysis 78
3.7.1 Atomic Absorption Spectrophotometer 78
3.7.2 Absorption Mode 78
3.7.3 Emission Mode 78
3.7.4 Chemical Interference 80
3.7.5 Calibration of Atomic Absorption Spectrophotometer 81
3.8 Scanning Electron Microscopy 83
3.8.1 Energy Dispersive X-ray Analysis 83
CHAPTER 4 86
4. Results and Discussion 86

9
4.1 Effect of Reaction Time on the Leaching Process at Different 86
Temperatures
4.2 Effect of Reaction Temperature on Dissolution 93
4.3 Effect of Acid Concentration on P2O5 and CO2 Contents 93
4.4 Effect of Liquid/Solid Ratio on P2O5 and CO2 Contents 94
4.5 Leaching with Lactic acid 108
4.5.1 Effect of Acid Concentration on the Conversion 108
4.5.2 Effect of Liquid-Solid Ratio on the Conversion 109
4.5.3 Effect of Particle Size on the Conversion 110
4.5.4 Effect of Temperature on the Conversion 110
4.5.5 Effect of Reaction Time on P2O5 and CO2 Contents 111
4.6 Kinetic Analysis 139
4.6.1 Leaching with Succinic Acid 139
4.6.2 Leaching with Lactic Acid 151
CHAPTER 5 163
5.1 Recovery of Spent Acid and Economy of Process 163
5.2 Routes for the Acid Recovery 163
(a) Use of Ion Exchange Resins 142
(b) Use of Hydrofluoric Acid 163
(c) Use of Fluorosilicic Acid 164
(d) Use of Sulphuric acid 164
5.3 Economy of the Process 167
Conclusions 169

10
References 172
APPENDIX A 189
Appendix B 189
PUBLISHED WORK 191

11
LIST OF TABLES Page No.
Table 3.2.1 Mesh size, average size, weight fraction and Weight percent 59
Table 3.2.2 Average size, mass fractions and cumulative mass fraction 61
Table 3.3.1 Analysis of the rock samples 64
Table 3.4.1 Analysis of the rock samples 70
Table 4.1.1 Effect of reaction time on leaching of calcareous 87
(XB %) material at various temperatures
Table 4.2.1 Effect of temperature on selective leaching 96
(XB %) of calcareous material at various acid concentrations
Table 4.3.1 Effect of acid concentration on P2O5 and CO2 Contents. 102
Table 4.4.1 Effect of liquid/solid ratio on P2O5 and CO2 105
contents using 8% acid concentration for 55 min at 55oC
Table 4.5.1 Effect of reaction time on the conversion 112
(XB %) of calcareous material at different acid concentrations
Table 4.5.2.1 Effect of Reaction Time on the Conversion of 118
calcareous material in the rock at Various Liquid/Solid Ratio
Table 4.5.3.1 Effect of reaction time on the conversion 124
using different size particles of the rock 103
Table 4.5.4 1 Effect of reaction time on the conversion 130
(XB) of calcareous material in the rock at various temperatures
Table 4.5.5.1 Effect of reaction time on P2O5 and CO2 contents 136
Table 4.6.1.1 The values of ln k and 1/T 147
Table 4.6.2.1 Effect of rpm on the conversion 153

12
Table 4.6.2.2 The values of the selected parameters and the reaction 160
periods calculated from Eq. (4.6.2.4) for these parameters

13
LIST OF FIGURES Page No
Fig 3.1.1 Phosphate rock deposit of Shahzad mines 53
Fig 3.1.2 Phosphate rock at Largrarian mines 54
Fig 3.1.3 Phosphate rock deposit mining at Shahzad mines 55
Fig 3.1.4 Phosphate rock deposit of Largrarian mines 56
Fig 3.1.5 Phosphate rock mining of Puttiann mines 57
Fig 3.1.6 Phosphate rock mining at Puttiann mines 58
Fig. 3.2.1 Average particle size and wt% of phosphate rock sample 60
Fig. 3.2.2 Average particle size and cumulative mass fraction of phosphate rock 62
Fig. 3.3.1 Effect of average particle size on P2O5 content 65
Fig. 3.3.2 Effect of average size of particle on AIR content 66
Fig. 3.3.3 Effect of average particle size on LOI content 67
Fig. 3.3.4 Effect of average particle size on CO2 content 68
Fig. 3.4.1 Effect of average particle size on P2O5 content 71
Fig. 3.4.2 Effect of average particle size on CO2 content 72
Fig. 3.4.3 Effect of average particle size on LOI content 73
Fig. 3.4.4 Effect of average particle size on AIR content 74
Fig.3.7.1 AAS Hitachi (A-1800) used for analysis 79
Fig.3.7.2 Correlation curve for calcium nitrate versus absorbance 82
Fig.3.8.1 SEM micrograph of the sample 84
Fig. 3.8.2 EDX spectrum of the sample 85
Fig. 4.1.1 Effect of reaction time on the conversion 88
(XB%) of calcareous material at 40oC

14
Fig.4.1.2 Effect of reaction time on the conversion 89
(XB%) of calcareous material at 50oC
Fig. 4.1.3 Effect of reaction time on the conversion 90
(XB%) of calcareous material at 60oC
Fig. 4.1.4 Effect of reaction time on the conversion 91
(XB%) of calcareous material at 70oC
Fig. 4.1.5 Effect of reaction time on the conversion 92
(XB%) of calcareous material at 80oC
Fig. 4.2.1 Effect of temperature on dissolution (XB) with 6% succinic acid 97
concentration and liquid/solid ratio 5:1 for 30 minutes
Fig. 4.2.2 Effect of temperature on dissolution (XB) with 7% succinic acid 98
concentration and liquid/solid ratio 5:1 for 30 minutes
Fig. 4.2.3 Effect of temperature on dissolution (XB) with 8% 99
succinic acid concentration and liquid/solid ratio 5:1 for 30 minutes
Fig. 4.2.4 Effect of temperature on dissolution (XB) with 9% succinic acid 100
concentration and liquid/solid ratio 5:1 for 30 minutes
Fig. 4.2.5 Effect of temperature on dissolution (XB) with 10% succinic acid
concentration and liquid/solid ratio 5:1 for 30 minutes 101
Fig. 4.3.1 Effect of acid concentration on P2O5 content with liquid/solid 103
ratio 7:1 for 55 minutes at 55oC
Fig. 4.3.2 Effect of acid concentration on CO2 content with L/S ratio 7:1 for 104
55 minutes at 55oC
Fig.4.4.1 Effect of liquid/solid ratio on P2O5 contents using acid 106

15
concentration 8% for 55 minutes at 55oC
Fig.4.4.2 Effect of liquid/solid ratio on CO2 contents using acid 107
concentration 8% for 55 minutes at 55oC
Fig. 4.5.1 Effect of reaction time on the conversion of calcareous material 113
with 5% lactic acid concentration
Fig. 4.5.2 Effect of reaction time on the conversion of calcareous material 114
with 6% lactic acid concentration
Fig. 4.5.3 Effect of reaction time on the conversion of calcareous material 115
with 7% lactic acid concentration
Fig. 4.5.4 Effect of reaction time on the conversion of calcareous material 116
with 8% lactic acid concentration
Fig. 4.5.5 Effect of reaction time on the conversion of calcareous material 117
with 9% lactic acid concentration
Fig.4.5.2.1 Effect of reaction time on conversion with liquid/solid ratio (L/S) 4:1 119
Fig. 4.5.2.2 Effect of reaction time on conversion with liquid/solid ratio (L/S) 5:1 120
Fig. 4.5.2.3 Effect of reaction time on conversion with liquid/solid ratio (L/S) 6:1 121
Fig. 4.5.2.4 Effect of reaction time on conversion with liquid/solid ratio (L/S) 7:1 122
Fig. 4.5.2.5 Effect of reaction time on conversion with liquid/solid ratio (L/S) 8:1 123
Fig. 4.5.3.1 Effect of reaction time on conversion for particle size 0.503 mm 125
Fig.4.5.3.2 Effect of reaction time on conversion for particle size 0.356 mm 126
Fig. 4.5.3.3 Effect of reaction time on conversion for particle size 0.2515 mm. 127
Fig. 4.5.3.4 Effect of reaction time on conversion for particle size 0.1775 mm 128
Fig. 4.5.3.5 Effect of reaction time on conversion for particle size 0.1255 mm 129

16
Fig. 4.5.4.1 Effect of reaction time on the conversion at 25oC 131
Fig. 4.5.4.2 Effect of reaction time on conversion at 35oC 132
Fig. 4.5.4.3 Effect of reaction time on the conversion at 45oC 133
Fig. 4.5.4.4 Effect of reaction time on the conversion at 55oC 134
Fig. 4.5.4.5 Effect of reaction time on the conversion at 65oC 135
Fig. 4.5.5.1 Effect of reaction time on P2O5 contents 137
Fig. 4.5.5.2 Effect of reaction time on CO2 contents 138
Fig. 4.6.1.1 Time versus 1-(1-XB)1/3 at 40 oC 141
Fig. 4.6.1.2 Time versus 1-(1-XB)1/3 at 50 oC 142
Fig. 4.6.1.3 Time versus 1-(1-XB)1/3 at 60oC 143
Fig. 4.6.1.4 Time versus 1-(1-XB)1/3 at 70oC. 144
Fig. 4.6.1.5 Time versus 1-(1-XB)1/3 at 80oC 145
Fig. 4.6.1.6 Arrhenius plot of ln k vs 1/T 148
Fig. 4.6.1.7 Agreement between experimental and calculated conversion values 150
Fig. 4.6.2.1 Effect of rpm on the conversion at specific reaction conditions 154
Fig. 4.6.2.2 Agreement between experimental and calculated conversion values 157
Fig. 5.2.1 Schematic diagram suggested for the recovery of spent acid 166

17
ABSTRACT
In the present thesis, the dilute solutions of succinic acid have been used to
investigate the selective leaching of calcareous material in low-grade phosphate rock. The
effective parameters on the dissolution rate are reaction temperature, particle size, acid
concentration and liquid-solid ratio. The results indicate that succinic acid can be used to
selectively dissolve the calcareous material in low-grade phosphate rock as it improves
the P2O5 content of the rock and makes it viable as a feed to an acidulation plant.
Using the known size particles of the sample, acid concentration and liquid-solid
ratio, the influence of different reaction temperatures has been studied in order to
elucidate the leaching kinetics of calcareous material in the rock. The results show that
the leaching rate of calcareous material increases with increasing temperature. A kinetic
model has been suggested to describe the selective leaching process of calcareous
material analyzing the kinetic data. The selective leaching curves have been evaluated in
order to check the validity of shrinking core models for liquid-solid systems. The
experimental data have been tested by graphical and statistical methods and it is found
that the leaching of calcareous material in the rock is controlled by the chemical reaction
i.e. tex RT/92.6463/1 1047.1)1(1 . The apparent activation energy of the dissolution
process has been found to be 64.92 kJ mol-1 over the reaction temperature range from 313
to 353 K. Such a value of activation energy indicates that the process is a chemically
controlled reaction and agrees with the values obtained in the similar research of fluid-
solid reaction systems. The agreement between the experimental conversion and the

18
values calculated from the suggested empirical equation has been tested, and which is
found to be very good.
For a comparison study, lactic acid has also been used to study the selective
leaching kinetics of calcareous phosphate rock. The effect of acid concentration,
liquid/solid ratio, particle size and temperature has been studied in order to expound the
leaching kinetics of calcareous material in the rock. It has been found that the leaching
rate of calcareous material increases with increasing the acid concentration, liquid/solid
ratio and temperature and decreasing particle size. A semi-empirical model has been
suggested to illustrate the selective dissolution of calcareous material analyzing the
experimental data. The selective leaching curves have been evaluated to test the validity
of kinetic models for liquid-solid systems. The kinetic data are analyzed by graphical and
statistical methods and it has been found that the dissolution of calcareous material in the
rock is controlled by chemical reaction i.e.
teDSLC RT/62.42954737.0627.1753.13/1 )/(1.19)1(1 .
The analysis of the obtained results reveals that the applicability of the suggested
model is good and it can work within a certain range for the choice of adjustable
parameter values depending on the degree of selective leaching. The results show that the
controlling step of the overall process of the heterogeneous reaction is a chemical change.
According to the analyzed results, it is recommended that the parameter values for the
optimum selective leaching rate are C = 8% v/v, L/S = 7 cm3g-1, T = 318 K, SS = 350
min-1 and D = 0.1255 mm.

19
CHAPTER NO 1
1. INTRODUCTION
Naturally occurring deposits of tricalcium phosphate which are generally
combined with Calcium fluoride CaCO3 (PO4)2.CaF2 are called phosphate rocks.
Compositions of these rocks varies from deposit to deposit, and are the most important
source for phosphate fertilizers and phosphorous-based chemicals, which are used to supply
food and feed for mankind and animals. There is no substitute of these phosphate rocks as a
raw material for the production of phosphate fertilizers in the world at this time. As the world
population continues to increase, so does the demand for phosphate day by day in the world
due to the consumption of high-grade phosphate rock deposits. The future demand of
phosphate for food and feed grade may be expected to be fulfilling from the low-grade
phosphate rock deposits as an alternative source for the production of phosphate fertilizers
and various phosphorus based chemicals in the world. On the other hand, a number of
deposits of the world need commercial exploitation regarding improvements in mining as
well as beneficiation technology.
In the past, some researches [1-12] have reviewed the status of phosphate rocks
and their beneficiation techniques and various methods. The total phosphate content, or
grade, of phosphate rock is commonly reported as phosphorous pentoxide, P2O5. It also may
be expressed as calcium phosphate, Ca3 (PO
4)
2, which has been referred to traditionally as
'bone phosphate of lime' (BPL), reminiscent of earlier times when animal bones were
consumed widely in fertilizer manufacture (%P2O
5 × 2.1853 = %BPL; %BPL × 0.4576 =
%P2O
5). Marketable phosphate rock, usually beneficiated or as a concentrate, ranges from

20
about 60 to 80% BPL (i.e. between 28 and 39% P2O
5); material that enters international trade
generally contains more than 65% BPL or 30% P2O
5 [8].
Prospects for supply and trade cannot reasonably be addressed without some
estimation of demand: the three go hand in hand in any commodity business, though their
relative importance may change. The demand for phosphate rock and prospects for industry
cannot be viewed in isolation from the prospects of the phosphate fertilizer sector as a whole.
Of the world's annual P2O5consumption of 33 000,000 t about 88% for fertilizers, 4% of
animal-feed grade and about 8% was used by manufacturing industry [7]. World
consumption of P2O5 for non-fertilizer uses was about 2 500, 000 t /year and, in addition,
about 500, 000 t/year of P2O5 equivalent was consumed as elemental phosphorus [9].
The bulk of the world's phosphate deposits that are located in sedimentary
horizons also contain considerable amount of carbonate impurities associated with apatite
matrix. Since these are also the most difficult type of deposit to treat, initial exploitation was
restrained to the limited number of deposits in which carbonate was so friable as to be largely
removable in a fine fraction. The increasing demand for phosphate and depletion of the more
amenable reserves, however, have steadily increased the pressure for treatment of these
difficult sedimentary phosphate-carbonate deposits and probably no other mineral processing
topic has attracted as much research in the past [6]. Most of the phosphate rocks are of
sedimentary origin with low-grade phosphate elements along with higher levels of various
impurities. The first challenge in phosphate industrial sector is the reduction of impurities
from low-grade phosphate rocks so that these rocks may be used for the production of
phosphate fertilizers to meet the increasing demand for phosphate and to cover the depletion
of more amenable reserves in the world [12].

21
Due to complex raw materials along with varying composition from source to
source, these phosphate rocks from different deposits may be expected to behave differently
in acidulation processes, which are the heart of all phosphate fertilizers industries. Phosphate
rocks are primarily composed of the apatite group in association with a wide assortment of
minerals, mainly fluorides, carbonates, clays, quartz, silicates and metal oxides. These
deposits fall naturally into two major classes (i) igneous origin; (ii) sedimentary origin. In
both of these major natural types of deposits a very important subdivision can be recognized
on the basis of whether the gangue is generally siliceous in character or the ore contains
considerable amount of such carbonate minerals as calcite and dolomite [6].
Due to the adverse effect of impurities [13, 14] in phosphoric acid production,
these impurities must be removed or reduced to the lowest possible levels. The beneficiation
method, which must be employed to achieve an efficient separation, may depend on the type
and nature of impurities present in phosphate rocks. For beneficiation of low-grade
phosphate rocks, a number of techniques may be described as follows:
1.1 Flotation Method
Separation technique for silica based and calcareous gangue material from low
grade phosphate rock by using different types of floating reagents (amine and fatty acids) is
called flotation. For over 50 years flotation has been the most commonly used method for
upgrading phosphate ores both of igneous and sedimentary origin [15-28]. In the former, the
phosphate occurs as high-grade crystalline apatite, and concentrate specifications frequently
call for grades as high as 37-38% P2O5. In sedimentary deposits, however, the phosphate may
be present in a wide variety of forms, ranging from unconsolidated bone fragments to quite

22
well crystallized secondary phosphate minerals. The actual phosphate content of these phases
is variable but generally lower than that of igneous apatite, and concentrate specifications are
similarly lower, 28-30% P2O5 being quite well recognized as a lower limit [6, 15].
1.1.1 Siliceous Ores
A large sedimentary deposit with high silica content was mined in Florida at the
rate of one third of the annual world phosphate production. In the beneficiation of Florida
phosphate rock, flotation plays a predominant role because it is the most economical way to
separate sand and other impurities contained in the matrix. Typically, the matrix is washed
and deslimed at 150 meshes. Material finer than 150 meshes is pumped to clay settling
ponds. An estimate of 20-30% of the phosphate (contained in the matrix) is lost in this way.
The rock coarser than 150 mesh can be screened into separate sizes (-31/4+14 mesh) which
may be high or low in phosphate content. Washed rock (-14 mesh+150 mesh) is sized into a
fine usually 35150 mesh, which are treated in separate circuits. A two-stage flotation
process is generally used in these circuits, where the feed is subjected to ‘rougher’ flotation
(fatty acids and fuel oils are used as collectors) to separate the phosphates from most of the
sand [15]. The rougher concentrate is scrubbed by sulphuric acid to remove the fatty acids
and oils. Scrubbed material is then subjected to ‘cleaner’ flotation (amine collectors are used)
to float the sand. This stage of flotation is sensitive to impurities in water, so fresh water is
used instead of recycled water; the fatty acid circuit uses recycled water from the clay ponds.
Flotation of phosphates from the fine feed (35 150 mesh) presents very few
difficulties and recoveries in excess of 90% are commonly achieved using conventional
mechanical cells. On the other hand, recovery of the coarse phosphate feed is more difficult

23
and flotation by itself normally yields recoveries of just 60% or even less. In the past,
hammer mills were used for size reduction of the coarse feed. However, due to high
maintenance costs and loss of phosphates as fines (generated during milling) their use has
been discontinued. The industry, however, has taken other approaches to avoid the problem
of low floatability of coarse particles. For example, the use of gravitational devices such as
spirals, tables, launders sluices and belt conveyors modified to perform a "skin flotation" of
the reagentized pulp. Although a variable degree of success is obtained with these methods,
they have to be normally supplemented by scavenger flotation. In addition, some of them
require excessive maintenance; have low capacity or high operating costs. So performance is
less than satisfactory, and in certain cases use has been discontinued.
The exact reasons that explain the low recoveries of coarse particles in
conventional flotation machines are not clear. There are various factors affecting the
behavior of such particles. For instance, the low floatability of large particles could be related
to the extra weight per unit surface area that has to be lifted to the surface (usually under
highly turbulent conditions) and then transferred and maintained in the froth layer. Factors
such as density of the solid, turbulence, stability and height of the froth layer, tenacity of the
particle-bubble attachment, depth of the water column, viscosity of the froth layer, and other
variables that can indirectly influence these factors, determine the floatability of coarse
particles.
Another important disadvantage of the existing beneficiation technology is its
inability to separate impurity minerals containing MgO. Florida phosphate ores contain low
levels of magnesium impurities. However, it is expected that the current deposits of lower
MgO content will be depleted in the next few years. Unfortunately, the future phosphate

24
reserves, located south of the present mining district, have a severe limitation in the form of
high MgO content and would require innovations in the beneficiation technology. The
difference in the consumption of reagents can be attributed to the fine size of the flotation
feed since desliming is done with 30-40 micron particles. Nevertheless, the flotation
separation of this ore is much simple (one stage-anionic flotation) because the high
phosphate content (30-31% P2O5) of Senegalese [15].
1.1.2 Dolomite Ores
Commercial phosphate rocks should not contain more than 8% carbonates (about
3.5% CO2) in order to be economical [16, 17]. The presence of free carbonates in the
phosphate rocks usually requires additional acidulent (sulphuric acid) during the manufacture
of phosphoric acid and super phosphates by the wet process. The carbon dioxide produced
during acidulation, causes more foaming and results in production of smaller size gypsum
crystals [16] that may blind the downstream phosphogypsum filters and a low quality
phosphoric acid is produced [16]. The carbon dioxide also contaminates the equipment and
pollutes the atmosphere. An antifoaming can be added, but if the CO2 content exceeds a
certain limit, it will have negative effects on the economy of the whole process [14].
In igneous ores, carbonate frequently occurs as calcite rather than as dolomite. In
some of these ores, it was found that apatite is somewhat more floatable than calcite [15].
Calcite and dolomite, both of these carbonate minerals tend to respond in a similar manner to
phosphate minerals when exposed to the fatty acid-type collectors that are traditionally used
for phosphate flotation. The consequences of the dilution of the phosphate concentrate by
them are, however, some what different: calcite will consume part of the sulfuric acid used
25
for super phosphate manufacture, but dolomite is more objectionable since magnesium in
quantity renders the phosphoric acid unacceptably viscous [6]. The froth flotation to remove
phosphate from the middling [18,19,20] has also been studied, but the phosphate values
could not be economically recovered from the fine fractions of the ore slurry.
The beneficiation of phosphate ores containing dolomitic impurities is
complicated because of the similarities in the chemical behavior of minerals present [21-24].
Much research has been carried out to try to reduce the calcium carbonate content of low-
grade phosphate rocks by flotation [21-23]. Hignett et al. [25] claimed that flotation could
work best on ores containing well-crystallized carbonates. When the ore contained soft and
chalky carbonates the flotation results were less satisfactory. This was the case for East
Mediterranean and North Africa ores where the carbonates crystals are intergrown in such a
way that the phosphate is not liberated by crushing until the size of the material is too fine for
flotation [26,27].
Research efforts to find details of the mechanism of interaction between ions in
the liquid phase and the solid surfaces involved are difficult due to the presence of impurities
[22]. A small level of some impurities in the ore has a marked effect on the surface properties
of calcite and apatite as well as the ionic reactions in the liquid phase. It appears like that a
CaO: P2O5 ratio in the flotation product must be less than 1.6 [28].
A number of depressants have been investigated [29-32] in order to increase the
selectivity of separation using the traditional collectors. Examples of these depressants
include: pearl starch (Brazil), HF, H2SiF6, sulfonates, tannin-based depressant "Totanim"
(South Africa), and starch-ethoxylated carbonic acid (USSR). All of these depressants are
used with the traditional fatty-acid collectors together with added hydrocarbons such as oily

26
gas-tars or kerosene. It is worth mentioning that, to obtain high flotation efficiency, favorable
froth modifications are produced by the use of such reagents as nonyl phenyl polyglycol
ether and ethoxylated alkyl phenol [1].
It is possible that gangue minerals, such as quartz and pyrite, can easily be
separated by flotation. However, the separation of calcite from collophane is a major problem
because; both of these minerals have similar flotation characteristics [30]. Flotation of
carbonate rich ores shows some difficulties because the fatty acids and their derivatives used
as flotation collectors have very poor selectivity for carbonates and phosphate minerals [24].
1.1.3 Highly Selective Collectors for Apatite in Igneous Ores
The emphasis in flotation research has changed from the use of depressants to the
use of more selective collectors, replacing the fatty acid-based reagents. For example,
amphoteric sarcosine has been used successfully in Finland [31] to float apatite from calcite.
Another collector, amino-carboxylic acid reagent (Lilaflot OS-100), has been developed in
Sweden and resulted in excellent separation of apatite from calcite, both in Sweden and
Russian ores. Warren Springs Laboratories (UK) have developed a new reagent of the
immino bis methylene phosphoric acid class, which has given good selectivity in floating
apatite from dolomite of igneous ores [32].

27
1.1.4 Depressants for Apatite in Sedimentary Ores
There is a natural selectivity margin favoring apatite in igneous phosphate-
carbonate ores, however, this is reversed and tends to operate in favour of carbonate
minerals. Consequently, when fatty acid flotation separation of sedimentary ores was
adopted, the search focused not on carbonate, but on possible phosphate depressant systems.
Examples include the use of orthophosphoric acid in the Karatou process [33, 34].
The published literature indicates that a pH of 6.0 is achieved by using 6.0 kg
H3PO4/ton of ore. A synthetic fatty acid (C10-C16) is added at a dose of 0.3 kg/ton. After
carbonate flotation, the pH is raised to 7.6-8 using 1.5 kg/ton of sodium hydroxide and tall oil
(1.7 kg/ton) is added to float phosphates, with sodium silicate at 0.5 kg/ton being used to
depress the silica. The reported data [33,34] indicate that only 75% of the phosphate can be
recovered at a grade of 28% P2O5 from a feed of 22.5% P2O5. In addition, the concentrate
contains 1.3% MgO which is higher than the requirements of a phosphoric acid plant (less
than 1.0%). Moreover, the cost of reagents is excessive to make the process economically
attractive.
Aluminum sulphate and Rochelle salt (sodium potassium tartrate)
(E.N.S.C.Nancy- O.C.P. Morocco Process) were used in this process; the selectivity of
dolomite separation was reported to be very good with over 80% phosphate recovery [29,
35]. However, the presence of clays was found to reduce the efficiency of separation due to
imperfect desliming. Thus, good desliming is a prerequisite to achieve the successful results.
The use of silicofluoride either as sodium salt or hydrofluosilic acid was also reported to be
effective as a depressant for phosphate minerals in their separation from the carbonates
gangue [36, 37]. Addition of alkyl phosphoric acids alone or in combination with HF was

28
found to be effective for apatite depressants as reported by TVA researchers [38, 39].
However, the process was found to be ineffective in processing undeslimed feeds or high
MgO ores, because high reagent doses were needed to achieve separation which rendered the
process uneconomic.
Water soluble salts of tripolyphosphates and hexametaphosphates were also used
by IMC's (International Minerals Company, U.S.A.) researchers to depress phosphate
minerals [40,41]. Dolomite was floated with the sodium salt of sulfonated oleic acid in the
pH range of 5.5 to 6.0. Even though this process has been tested on a pilot plant scale, IMC
does not prefer its commercial application rather than building a heavy media separation
plant. The reasons for not using the above-mentioned process are not known. Nevertheless,
one may speculate that the cost of reagents as well as the increase of phosphate concentration
in recycled water may depress apatite flotation in other circuits dealing with low MgO feeds.
Also, the presence of high levels of sodium ions in process water stored in clay settling ponds
could be an objectionable since this can lead to clay swelling.
1.1.5 Selective Collectors for Carbonates in Sedimentary Ores
Using novel collectors for igneous apatite-carbonate ores, much research work
has been carried out regarding the possible substitution of the traditional fatty acids. For
example, the reagents developed by French researchers [42,43] involving
alkalylaminopropionic and propionic acids showed good separation of MgO from Tunisian
ore. These are amphoteric reagents that are used to float dolomite first at pH 7 then at pH 5.0.
Even, though the types and rates of these reagents consumption are not reported. These types

29
of reagents are quite expensive. It would be worth testing their efficiency in separating
carbonate gangue from the other carbonatic deposits in the world.
In another process, the same workers suggested the bulk flotation of phosphate
and carbonate away from silica by using a phosphoric ester-fuel oil mixture under
moderately basic conditions. H2SO4 then depressed phosphate subsequently at pH 6.0 and
carbonate was refloated with a small addition of collector.
1.2 Other Flotation Separation Techniques
In the IMC process [42,43] in which dense media removes over size phosphate
pebbles by Dynawhrilpool to reject a dolomite-rich lighter fraction is followed by the
grinding of the sink pebbles and treatment by using flotation in conjunction with the original
fines. The classic two-stage flotation system was modified by addition of a third stage to float
phosphate by an amine-kerosene mixture at slightly acidic pH. The U.S. Bureau of Mines
process consists of scrubbing and desliming at 150-mesh to remove MgO-rich slimes. Fatty
acid-fuel oil was used to float apatite and dolomite at pH 9.5 followed by two or three cleaner
stages using sodium silicate as a dolomite depressant. The process did not show promising
results for removing dolomite to less than 1.0% MgO in the concentrates in all situations.
Some other researchers [44,45] studied two and three stages flotation techniques.
Moudgil et al. [44] carried out a process for separation of dolomite from south Florida
phosphate by first conditioning at pH 10.0 with a fatty acid, followed by reconditioning at a
pH around 4.0 using either HNO3 or H
2SO
4 as pH modifiers. The reconditioning pH and
collector concentrations were claimed to be important parameters for flotation selectivity.

30
The currently used commercial process of double flotation [48] is not enough
sufficient for reducing the dolomitic impurity level to less than 1.0 weight percent MgO in
the concentrate, as required by the phosphate industrial sector. Moudgil and Chanchani
[44,46] and Ince [47] carried out some fundamental studies in the development of two
processes to remove the dolomite impurities from apatite. Extension of these fundamental
studies to beneficiate the natural ores on a bench scale was also investigated [49]. However, a
systematic optimization of the major parameters has not been attempted and no guidelines
are available for processing such complex ores. Regarding three stage flotation scheme,
Zhong et al. [45] studied an optimization process for some variables using various chemicals
and flotation reagents.
At the University of Florida, some researchers [47,50,51] have investigated that
sodium chloride acts as an apatite depressant during flotation at acidic pH values with oleic
acid, while dolomite flotation is not affected. However, it was claimed that dolomite particles
larger than 48 meshes were difficult to float and they tended to remain in the sink fraction.
The trends observed during Hallimond cell tests of single and mixed minerals, were
confirmed with mixtures of minerals and a natural ore at bench scale level. At the bench
scale studies, the MgO content of the mineral mixture was reduced from 5 to 1% along with
90% recovery of P2O5 in the sink fraction. However, further testing on pilot scale may be
required to answer some important questions regarding the practicality of the process (e.g.
pH, reagent addition control within specified narrow ranges and the cost of the reagents). The
residual concentration of NaCl in the process water is also one of the considerable
parameters, which can cause environmental problems.

31
Another selective flotation technique for processing dolomitic and calcareous-
siliceous phosphate ores, without the use of a depressant, was developed by Hanna et al,
[52,53]. The process used standard flotation equipment and conventional fatty acid collectors
for carbonate/phosphate separation. It involved a unique procedure of applying conventional
fatty acids as collectors for selectively floating the carbonate minerals under slightly acidic
pH of 4-6. Reagent requirements for the process were modest, being of the order of about
1.5-1.75 kg/t (3.3-3.8 lb/t) oleic acid, 0.66 kg/t (1.3 lb/t) H2SO
4 and 0.5 kg/t (1.1 lb/t) sodium
silicate, for both carbonate and phosphate steps.
Another new method of flotation [32] involved the treatment of the ore
suspension with copper and zinc ions followed by addition of an alkali sulphide solution to
cover the surface of the apatite particles with copper sulphide and zinc sulphide which in turn
are floated by using xanthate type collectors. The economic feasibility of a flotation process
is highly depends on the amount and price of flotation reagents, flotation equipment and the
amount of water needed in the process. For grinding phosphate rock, the energy used was
about 25-35 MJ/ton and the process water needed was around 13 m3/ton while the average
values for ore flotation units were 62.5 MJ per tone and 5.3 m3 per tone for energy and used
water, respectively [54]. For flotation of high carbonate containing sedimentary phosphate
rocks, it has been a challenging need to find the reliable and economical methods. Due to the
changes in impurities, it appears like that each rock has been treated as a special case and
until a reliable and general method is devised accumulation of data and experience are
required.
Another significant development in phosphate flotation was the application of the
flotaire cell [55], which could process rock with larger particle sizes reducing the cost of

32
grinding. It also showed a more favorable grade-recovery relationship. Column flotation has
also received an increased interest [56-61], especially in cleaning flotation, so application to
phosphate flotation should be studied.

33
1.3 Magnetic Separation Techniques
The test work carried out by the USSR researchers indicated that the use of two-
stage dense medium cycloning operation could result in the production of a fine phosphate
sink product of an acceptable grade. It gave an intermediate-density product, which could be
combined with fines from dense medium separation requiring grinding and carbonate
flotation only.
Low-intensity magnetic separation technique was carried out to treat the igneous
apatite deposits (USSR), which contained higher amounts of ferromagnetic minerals, such as
magnetite or titanomagnetite. Latter on, such methods were also extended to the use of high-
intensity magnetic separation to affect the rejection of complex iron bearing silicate minerals
from various new development areas. Magnetic treatment of the +100 mesh fraction resulted
in non-magnetic apatite concentrates (less than 37% P2O5) fines (-100 mesh), which were
then treated by flotation method.
High-intensity magnetic separation results were found to be promising in
upgrading Egyptian ores containing dolomite, silica and significant amounts of pyrite,
organic and water-soluble alkali. After careful dry size reduction, the ore was wetted and
classified to remove fines reducing the alkali content. A low-temperature roast at 650oC
removed organics and converted the pyrites into magnetically separable oxides. Advantage
was then taken of the high sand temperatures to eliminate silica and carbonates in high-
intensity separations at 200 and 800oC. During cooling, the phosphate particles regained
moisture films and reached the surface much faster than the carbonates, thus allowing the
second separation. Pyrite was eliminated by induced-roll magnetic separation process.

34
The selective magnetic coating methods [62-66] were also used to treat the
carbonate-phosphate rocks. The principle (developed at Warren Spring Laboratory, U.K), of
the process was the selective adsorption of fine-grained magnetic material on to mineral
surfaces in a mixed pulp, which rendered the coated grains amenable to recover by
conventional high-intensity magnetic separation. The adsorption of fine particles on to
specific minerals in a pulp was established during the course of a research project concerned
with the phenomenon of slime coating in froth flotation [63].
It was claimed, for example, that at a pH of 8, hematite slimes would adsorb
selectively on to calcite in the presence of apatite, causing depression of the carbonate along
with an increase in apatite grade from 58 to 89% in the concentrate decreasing the overall
recovery of phosphate contents. The effects of pH and dispersants on the zeta-potentials of
calcite, dolomite and apatite were described elsewhere [64,65]. The control of various
parameters could lead to successful separations of such mixtures as phosphate-carbonate,
fluorite-quartz, metallic Pb-Cu [64], scheelite-calcite, slime cassiterite-quartz and mixed bulk
sulphides. By using a mineralogical-scale wet magnetic separator, after treatment at pH 11
with colloidal magnetite, a calcite-apatite mixture was separated at apatite recovery of 85.3%
and grade 99.3% [66,67].
1.4 Calcination Method
Calcination has been proposed in the past to treat carbonate bearing sedimentary
phosphate ores followed by slaking and rejection of the calcined oxide by desliming and
classification operations [68-79]. In the flash calcination method, thermal beneficiation was
carried out to see the effect of temperature, time and particle size for low-grade calcareous

35
phosphate rock. Under various parameter conditions the rock was heated and quenched
immediately. The concentrates obtained from the ore assaying 16% P2O
5 content after
desliming were enriched to a product containing 31-34% P2O
5 without using any expensive
chemicals or energy required in conventional flotation and calcination methods [69].
The high cost of energy required for calcination has always acted against the
implementation of such proposals. Depending on the efficiency of the process, calcination
may lead to almost complete disposal of the carbonates present in the phosphate rock.
However, three hours heating at 1000oC resulted in the decomposition of about 90% of the
calcareous and dolomitic gague materials depending on the size and nature of the raw
phosphate rock [69].
Beneficiation by calcination is one of the better-known processes. It is based on
the dissociation of the calcium carbonate gangue materials by thermal energy. In this case,
carbon dioxide is removed as a gas from the calcination kiln, while the calcium oxide and
most of the magnesium oxide are removed after quenching and desliming of the solids
leaving the kiln. By quenching the hot calcined rock in water, the major impurities usually
pass into the slime phase, which is then mechanically separated from the coarser high grade
'sand' concentrate fraction [70].
The essence of the calcination process may comprises crushing, sieving, washing (to reduce
clay and chlorides); classification, calcination at about 950oC, hydration of the lime,
separation of the lime, and finally further washing and drying [27,70]. Dust collection is
essential. On the other hand, calcination has the following disadvantages:

36
1. It may tend to decrease the solubility and reactivity of the calcined phosphate
rocks in the liquid phase of the acid reagent during the manufacture of phosphoric acid by the
wet process [71,72]. In other words, the calcined phosphate requires more retention time in
order to get the same solubility as that of non-calcined phosphate of the same grade. This
might be due to the changes in the chemical and physical nature of the phosphate rock,
caused by the high temperatures (above 900oC) used in the calcination process. It has been
found that chlorine, for example, is transformed after calcination into a much less soluble
form [73].
2. Calcination needs complete decomposition of the calcite and dolomite present
in the phosphate rock, otherwise hard unaltered particles of calcite and dolomite remaining
may dilute the phosphate contained in the concentrate, thus lowering the grade and increasing
potential acid consumption if the product were to be used for subsequent fertilizer
manufacture [70]. This means either more time will be needed for calcination at temperatures
between 900-950oC, or higher temperatures (that might cause sintering and fusion) would be
required. In the latter case, less slime may be formed and poorer rejection of impurities will
be attained resultantly.
3. The calcination and desliming processes usually result in concentration of silica
in the final concentrate product to more than the 3-4% desired for wet process phosphoric
acid [16]. The removal of the silica is essential and can add an extra cost to the process.
4. Upon hot quenching, the magnesium oxide may be transformed into an
insoluble magnesium hydroxide. The Mg content causes a number of problems during
fertilizer manufacturing [74].

37
5. Although repeated attrition, scrubbing and desliming processes result in higher
concentrate grades, the percent P2O5 recovery may decrease [70].
It is interesting to mention that China proposed a calcination plant using an
abundant supply of cheap coal. The interesting feature of the process was the proposed re-
conversion of the milk of lime and magnesium to solid carbonates by reaction with kiln gases
in a carbonation tower. The resulting solid carbonates were easily dumped reducing the
pollution caused by the tailings. Control of the pressure and CO2 concentration during the
carbonation stage was also permitted the production of a magnesium carbonate by-product
[75]. However, more research work may help to study the kinetics of calcination method
regarding various complex ores and more energy efficient processes [76,77] and advances in
the understanding of fluidized bed behavior [78,79] can also contribute to the
competitiveness of this method.
1.5 Electrostatic Upgrading
Phosphate beneficiation with electrostatic methods [80-85] is gaining in interest
especially in those areas characterized by water shortage where many important ores are
being mined. In these cases, upgrading of run-of-mine ore is often confined to dry
classification whereby the leaner fine fraction is rejected to waste deposits still containing a
considerable amount of phosphate matter. The process is based upon selective turbocharging
of the various mineral components followed by separation in a free-fall chamber. The main
features of the Turbocharger are represented by a reasonably high throughput capacity, a
good efficiency in the finest size range, considerable versatility, low energy consumption
even if heating is required, a modular arrangement and easy operation control, eventually
38
resulting in a relatively low cost of treatment per ton of ore. Results show that the
concentrates can be obtained with fairly good recoveries especially for the ore having
favorable liberation characteristics; and unfortunately the electrostatic separation of pyrite
from the phosphate phase is quite inefficient and thus the concentrate is polluted to a
significant extent [85].
1.6 Bioleaching of Phosphate Ores
The literature survey shows that various researchers [86-92] have studied the
bioleaching of low-grade phosphate rock. Due to a number of unit operations involved and a
relatively higher cost for production of phosphate fertilizers in phosphate industries,
biotechnology may be considered as an economical area in some cases of bioleaching
process. Since Winogradsky suggested the concept of autothrophy, various bioleaching
studies have been investigated [87]. Several microbial species may grow at extreme
conditions, including high acidity and low organic matter concentrations [88]. This
environment, through its high selectivity, may present a number of microbial species. The
predominating species present in these environments are those from the genus Thiobacillus,
especially T. ferrooxidans and T. thiooxidans [89]. Using ferrous iron, T. ferrooxidans may
reduce sulphur as an energy source and T. thiooxidans can only use sulphur-containing
compounds [90]. The presence of bacterial species, originally present in the pyritiferous
concentrate, was investigated using a 9K culture medium [91]. The microbiological
production of acid solutions from sulphide-containing minerals may be considered as an
equivalent technology to solubilize phosphate rocks for the production of phosphate
fertilizers in the fertilizer industrial sector [92]. The metabolic activity of these

39
microorganisms can be accelerated by a series of various factors that must be controlled to
achieve maximum biological action. Control of temperature, pH and the amount of oxygen
supplied, are the main required factors for the maintenance of an ideal leaching process;
otherwise the acid production may not be enough to convert the high phosphate content
soluble and neutralize the carbonate material present in the rocks [92].
Kokal [93] emphasized that mineralogical characterization is a significant factor
regarding the bioleaching of minerals. The low grade and poorly available sources of
phosphorus may be utilized using phosphate solublizaing bacteria. The solubelization of
phosphatic ores using microorganisms is a significant area of research regarding
biofertilization. T he literature indicates that the main bioleaching mechanism for solubilizing
calcium phosphate is related with the acidulation of the medium through biosynthesis and
production of various organic acids [94-101] as well as bioleaching due to being economical
and environmental considerations Delvasto, P.et al [102].
1.7 Partial Acidulation of Phosphate Ores
A fully acidulated phosphate rock is generally treated with the stoichiometric
amount of acid required to completely convert the insoluble phosphate mineral (apatite) to
the water-soluble form monocalcium phosphate monohydrate. On the other hand, a partially
acidulated [103-110] phosphate rock (PAPR), is generally treated with only a portion of the
stoichiometric amount of acid (expressed as a percentage, for example 50% PAPR).
The amount of water-soluble phosphate in a PAPR will therefore vary according
to the degree of acidulation, and a PAPR will contain a mixture of water- and citrate-soluble

40
phosphates [109]. The water-insoluble portion behaves according to the properties of the
source rock and may provide a residual phosphorus source that will gradually dissolve [108].
Partially acidulated phosphate rock has found a favorable response especially in
developing countries where, in recent years, use has increased. Sulphuric and phosphoric
acids are the most common acids used for partial acidulation. For economic reasons,
however, the use of sulphuric acid for acidulation is the more usual choice [109]. The
presence of iron and aluminum give rise to reaction products and decrease phosphate
availability [110]. Because of the unpredictable nature of the acidulation of phosphate rock,
mainly due to the complexity of the reaction and the influence of associated compounds in
the rock, it is necessary to conduct thorough test work on a rock if it is being considered for
partial acidulation, particularly since altering the process variables may significantly alter the
nature of the product. Two processes were expansively investigated for the manufacture of
sulphuric acid-based PAPR [108]: a run-of-pile process; and single-step
acidulation/granulation.
1.7.1 Run-of-Pile (ROP) Process for PAPR
The ROP process is the simpler of the two processes. In this process ground
phosphate rock, sulphuric acid and water (if needed) are fed continuously to a mixer, which
is usually of the pug mill type but may vary according to the properties of the feed rock.
Retention time in the mixer is relatively short, 30-60s, in order to avoid subsequent handling
problems, such as excessive agglomeration and caking of the material involved.
Continuous operation is generally preferable to batch operation, which has been
found to result both in unsatisfactory mixing between the acid and rock and in poor product

41
handling characteristics. It is possible to add other required materials to the mixer to either
improve the acidulation process or provide additional nutrients to the soil. It is necessary to
ventilate the mixer, den, and conveyor system and product storage area so that the fumes
(mainly fluorine gas) may be removed efficiently. These are than removed by scrubbing
system [108].
1.7.2 Single-Step Acidulation/Granulation (SSAG) Process
The single-step acidulation/granulation (SSAG) process is also easy and simple to
handle. The feeding system of materials to the process is similar to those for the run-of-pile
process (phosphate rock, acid and water) but include, additionally, recycled material - the
product screen undersize together with some product.
Depending upon the raw material and operating conditions the amount of recycle
in the feed is normally equal to a recycle/product ratio of about 2, which is generally found to
be enough to maintain acceptable granulation. Individual feeds are fed continuously and
directly to a granulator, which is usually of the rotary-drum type. The acid and water are
sprayed through separate inlets onto a rolling bed of phosphate rock in the granulator. The
amounts of acid and water are kept enough to achieve the required degree of acidulation and
granulation of the material involved. The residence time of the feed in the granulator is
usually in the range of 5 to 8 minutes. To maintain the granulation consistency, undersize
material, together with some product, may be recycled to the granulator. Exhaust gas from
the drier is first passed through a dust collector, in which most of the dust is removed, and
then through a wet scrubber to remove the remaining dust particles and any fluorine gas
[108].

42
1.8 Direct Application of Phosphate Rock
Direct use represents one of the simplest applications of phosphate rock to acid
soils. Technologically the method is very simple, after mining the ore is ground, screened
and applied directly to the soil without any further treatment generally. Finely ground
phosphate rock was successively used as a phosphate fertilizer for direct application to the
soil in many countries of the world [111-120], mainly where acid soils are characterized by a
high phosphorus fixation capacity due to the extreme phosphorus deficiency [111]. In the
acid soils the apatite dissolution conditions are favorable.
The choice of the binder can be important when the micronutrients are added to
the soil. Granulated product made with a soluble-salt binder break down and disperses in soil
to give a performance almost as effective as finely ground rock. However, considerable
variation in the apatite composition may be found in any one deposit, so extensive agronomic
analysis will be essential to assess a phosphate rock as a potential fertilizer for direct
application [112]. For agronomical effective the rock should be ground, typically to between
100 and 200 mesh (Tyler). The handling characteristics associated with this finely ground
dusty material can be improved by granulating the ground rock into larger separate particles
[112].
The International Fertilizer Development Center (IFDC), suggested a method to
granulate ground phosphate rock using a soluble salt binder. The results showed that the
process could further be improved in order to achieve a product with good mechanical
properties without losing its agronomic effectiveness [112,115]. The mini-granulation
process developed by IFDC was consisted of finely ground phosphate rock into spherical
granules using a binder. A number of binders were suggested, including soluble salts (such as

43
urea, potassium chloride, magnesium sulphate and magnesium chloride), mineral acids (such
as sulphuric acid or phosphoric acid) along with some organic materials [116]. Mini-granular
ground rock (48-150 mesh) was found to be promising regarding handling characteristics and
ensuring as effective a crop response as non-granular rock (-100 mesh). Larger granules (6-
14 mesh) did not show an improved effectiveness when incorporated into soil. However,
these granules were found to be considerably effective for surface application to grassland
[112,117].
Using a number of phosphate rock samples from South America, It was found that the
reactivity of a rock was dependent on the origin of the rock [119]. However, it is not simply
the origin of the rock that governs its reactivity, a number of associated fundamental factors
may also be involved significantly, including crystalline structure, amount of carbonate
present in the apatite matrix, association of other nutrients and physical properties such as
surface area, particle size and porosity [120].
1.9 Dissolution and Selective Leaching
A number of researchers studied acidulation and leaching of different phosphate
rocks [121-126]. Attempts to leach phosphate values directly from the low grade matrix,
thereby avoiding beneficiation losses, could result in phosphate extractions as high as 90%
when H2SO
4 was used as the leaching agent [121]. However, two disadvantages to this
approach were observed: crude acids produced by direct acidulation were not of enough
purity to be considered good fertilizer precursors [121,126], and the reaction of H2SO
4 with
the rock generated an insoluble residue of a very small average particle size, resulting in a
slow and difficult separation of the acid from the residue [121]. Performing a similar

44
approach, some other researchers acidulated the rock matrix in the presence of organic
solvents (non-aqueous), the organic compounds that could serve to remove hydrophilic
impurities in situ [127-131]. The results of these studies were found to be promising to
improve the acid purity but did not address the guidelines regarding the solid-liquid
separation problems. Warren Springs Laboratories, U.K, using H2SO
4 along with a careful
control of pH 3.0, suggested the selective leaching of carbonate impurities present in
phosphate rocks. The suggested process could be used to purify high-grade sedimentary ores
containing limited amounts of dolomite impurities. Although the process was technically
feasible, but any practical implementation could depend largely on the economic aspects of
the overall leaching process.
The dissolution study of various ores in inorganic acids has been investigated in
detail [132-137]. Liang et al. [135] used sulfuric acid to produce TiOSO4 and the results
showed that the acid concentration of 15.4 M could achieve an appreciable level of
dissolution of the ore. The results also indicated that the leaching kinetics could be described
by shrinking core model along with estimated activation energy of 72.6kJmol-1. The leaching
of hematite during the course of dissolution was also observed depending on the
concentration of the acid. At higher concentration of the acid the dissolution of iron was
found to be relatively low than the aluminum.
Ashraf et al. [136] used dilute phosphoric acid solution to study the chemical
kinetics of the reaction involved. Using unreacted core model, the results showed that the
value of mass transfer coefficient increased with an increase in particle radius. For example,
its value increased from 7.67 x10⁻⁶ to 8.07 x10⁻⁶ m/sec as the average size of the particle was
increased from 1.675 x10⁻⁴ to 16.55x10⁻⁴ m. However, the value of reaction rate constant did

45
not appear to be a strong function of the particle size as the change was found to be very
small.
Zafar et al. [137] used dilute hydrochloric acid solution to dissolve calcareous
material in low-grade phosphate rock. The results indicated that the acid concentration that
gave the promising dissolution level was found to depend on the liquid/solid (vol./wt. basis)
ratios used. It was found that the higher concentrations of the acid favor the dissolution of
more phosphate element rather than that of carbonates in the sample. The temperature
increased sharply during the first 8 minutes and then with a rapid fall it was found to be
constant after about 12 minutes of the dissolution time. The dilute hydrochloric acid could be
used to remove/reduce the calcareous material from low-grade phosphate rock as it rendered
P2O
5 content to marketable and industrially acceptable level. If higher/considerable amount
of phosphate is dissolved during the leaching of calcareous material, the milk of lime,
Ca(OH)2 can be used to easily recover the dissolved apatite by the controlling parameter of a
specified pH range of the recovery process [137].
For dissolution of various ores, the use of organic acids has been increased in the
recent past [138-148]. Abu-Eishah et al. [138], Sadeddin et al. [139] and Abu-Eishah et al.
[140] conducted the studies using dilute acetic acid solutions to leach out the carbonaceous
and dolomite gangue materials from the low-grade phosphate rocks. The published data did
not show any guidelines about the reaction kinetics of the leaching process. In the acetic acid
leaching process, a somewhat higher liquid/solid ratio was recommended to achieve the
desire grade phosphate rock. A higher liquid/solid ratio may result in a relatively lengthy
process including handling, filtration and regeneration of the used acid by using chemicals or
ion exchange reagents corresponding to the volume of the acetate solution from the leaching

46
process. To eliminate/reduce calcareous material from the low-grade phosphate rock, Zafar et
al. [141] used formic acid solution.. Using this technique, the P2O5% was easily raised by up
to 29% corresponding to a reduction of up to 69% in the calcium carbonate content at a
phosphate recovery of more than 73 wt%.
Economou and Vaimakis [142] used acetic acid to selectively leach the calcareous
material in low-grade phosphate rock from Epirus area (Greece) and the results suggested
that the dissolution process could take place in two steps. The first step was found to be
relatively fast attributing to the dissolution of freely available calcite and/or spaces on the ore
particles. While, in the second one the leaching results were found to depend on the presence
of calcite in the interspaces between phosphopeloids. Using dilute acetic acid solutions,
Economou et al. [143] investigated the mechanism of selective leaching of calcite in low-
grade phosphate ore, and the analysis of the results indicated the model equation of a double
exponential decay fitting the experimental data. The kinetic analysis results showed that the
controlling step of calcite dissolution in the low-grade phosphate rock was a chemical
change. On the basis of some assumptions, the experimental results also concluded that the
decomposition of carbonic acid (H2CO3) into carbon dioxide (CO2) and water (H2O) was
most likely to be the rate-controlling step of the overall mechanism. In another similar work
[144] based on the different pH regions, it was suggested that the mass transfer had a
significant role in the rate-determining step of the overall reaction. Depending on the pH
values, two different reaction mechanisms were claimed along with two different model
equations fitting the corresponding experimental data. However, it was again found that the
decomposition of carbonic acid (H2CO3) into carbon dioxide (CO2) and water (H2O) could be
the rate-controlling step of at least two pH regions, 3.96-4.95 and 4.95-5.50.

47
Fredd and Fogler [145] investigated the kinetics of calcite leaching in acetic acid
solutions. The analysis of the data showed that, below about pH 2.9, the dissolution of calcite
was affected by the transport of both reactants and products. However, above about pH 3.7,
the rate of leaching was controlled significantly by the kinetics of the surface reaction.
Demir et al. [148] and Oral et al. [150] investigated the leaching kinetics of
magnesite ores using citric and acetic acids respectively. The experimental data, in both of
the cases of leaching agents, indicated the leaching process as surface reaction control. Using
citric acid, the activation energy of the leaching process was found to be 61.35kJ mol-1. On
the other hand, the activation energy of the same process using acetic acid was reported to be
78.40 kJ mol-1. The reason for the gap of activation energy using these two organic acids was
not addressed. However, it may be attributed to the difference in chemical nature of these
acids or the type and nature of various chemical species present in the ore samples.
Organic acids may be used for the selective leaching of carbonaceous material in
low-grade phosphate rocks. Using organic acids, lower losses of phosphate element may be
expected in dissolution processes, as the leaching capability of organic acids is relatively
weak as compared to inorganic acids. Apatite reserves are located in the North East of the
country, e.g. Kakul, Lagarban, Oatkanala, Batkanala, East and South phosphorites. The P2O5
content of the rock varies from deposit to deposit depending on the type and nature of the
impurities. The rock of these areas contains an objectionable amount of calcareous material;
therefore, it can’t be used directly for acidulation processes unless its P2O5 content is
increased up to an industrially acceptable level. No proper guidelines are available in
literature regarding the selective leaching kinetics of calcareous phosphate rock using organic

48
acids. The present work aimed to study the possibility for using succinic acid to selectively
dissolve calcareous material in the low-grade calcareous phosphate rock.

49
CHAPTER 2
2. CHEMISTRY OF THE LEACHING PROCESS
Calcareous and dolomite impurities present in low-grade phosphate rock can be
reduced or removed by selective leaching process. The type and nature of impurities in low-
grade phosphate rock varies from deposit to deposit through out the world. The type and
level of impurities may vary with in the same deposit as well. Therefore, every phosphate
rock deposit may be considered as special case with respect to beneficiation technique and
technology. For selective dissolution of calcareous and dolomite minerals both the nature and
concentration of a leaching agent are the important factors so that the phosphate element
present in the rock should not be lost due to the decomposition by reaction with the leaching
agent.
As mentioned before the dissolution study of various ores in inorganic acids has
been investigated in detail. However, the studies concerning the solubility in organic acids
are quite limited. Only a few researchers have used dilute organic acids for the leaching of
carbonaceous and dolomite gangue materials in low-grade phosphate rocks. The literature
indicates that the use of organic acids is increased in the recent years. The dissolving ability
of organic acids is relatively weak, however, these weak acids show high selectivity and may
be used as leaching agents for low-grade calcareous phosphate rocks. On the other hand, in
scale up studies with inorganic acids, high CO2 pressure and froth forming produced due to
fast dissolution may lead to some risks. The organic acids may be a promising extracting
agent as the leaching is carried out at intermediate acidic conditions (pH 3-5) and the
degradation of these acids is biologically easy [152]. However, in the industrial processes at
50
relatively higher temperatures organic acids may cause a little corrosion effect [153]. The use
of organic acids at relatively high temperature may be limited because of low boiling
temperatures and their decomposition [148,150].
Calcareous gangue materials may be reduced by leaching the low-grade
phosphate rock with dilute organic acids such as citric acid, acetic acid, formic acid, succinic
acid, etc. depending on various conditions of the leaching process as well as nature and type
of the phosphate ores. Any strong acid when mixed with ground phosphate rocks will react
with the main constituents of the phosphate and change them to other compounds. Therefore,
strong organic acids cannot be used to selectively remove calcareous material in low-grade
phosphate rocks as they may dissolve the phosphate apatite along with the leaching of
calcareous materials. The strong acids may not react, for example, with pure calcium
carbonate due to the large polarity of O-H bond present in these acids. However, in dilute
solutions, water molecules can tend to decrease the effect of polarity of the O-H bond
resulting in selective leaching of calcareous material in the rock due to higher degree of
ionization. The selected leaching agent should not attack the phosphate element. After the
leaching process, the liquid phase should be easily separable for regeneration and recycling.
On this basis, dilute succinic acid is found to be one of the promising leaching
agents for this purpose. In this case, dilute succinic acid has been used to selectively leach the
carbonatic phosphate rock. The salts of succinic acid are, depending on temperature, soluble
in water and may be separated easily from the leached solid phosphate product by filtration.
These characteristics allow the succinic acid molecules to react with calcium carbonates, but
not with the tricalcium phosphate itself appreciably. The dilute acid may be less destructive if
some of the produced solution is added to the reaction solution, or recycled to the process.
51
No physical or chemical changes in the phosphate rock, or considerable losses of its
tricalcium phosphate content, have been observed under lower concentrations of succinic
acid about up to 6-9 %.
The reaction between succinic acid and calcium and/or magnesium carbonates can
be written as follows:
CaCO3+C4H6O4Ca (C4H4O4) +CO
2+H
2O (2.1)
MgCO3+C4H6O4Mg (C4H4O4) +CO
2+H
2O (2.2)
The CO2 is evolved as a gas, while the calcium and magnesium succinate by-
products are soluble in the leaching solution. Reaction (2.1) and (2.2) may include the
formation of instable carbonic acid, which is then after soon decomposed into CO2 and H
2O;
and reaction for the other impurities depending on the nature and composition of the raw
phosphate. These two main reactions represent in fact a lumping of a larger number of steps.
The simplest detailed mechanism necessary for the normal understanding of this system may
be given as follows:
(a) Ionization process of HOOCCH2CH2COOH may be described by the equation:
C4H6O42H++C4H4O4
2- (2.3)
(b) Diffusion of H+ ions through the liquid to the exposed surface of the rock particle.
(c) H+ ions attack on the particles of the calcareous and dolomitic gangue material in the
rock.
nH++CaCO
3H
2CO
3+(n-2)H
++Ca
2+ (2.4)
(n-2)H++MgCO
3H
2CO
3+ (n-4) H
++Mg
2+ (2.5)

52
The H+ ions taking part in these reactions may 'belong' to the succinic acid as well as to
the carbonic acid, which can be formed in the leach slurry.
(d) Ionization of H2CO
3: When carbon dioxide dissolves in water, most of it is present as
CO2 molecules rather than H
2CO
3 molecules. However, if a small amount of carbonic acid is
formed, the ionization, which is fast, process and can be described by the following
equations:
CO2+H
2OH
2CO
3 (2.6)
H2CO
3H
++HCO
3
-
(2.7)
H++HCO
3
-2H
++CO
3
2- (2.8)
2H++CO
3
2-CO
2+H2O (2.9)
(e) Diffusion of products from the reaction sites to the bulk of the liquid.
(f) Reaction between Ca2+
, Mg2+
and C4H4O42-
Ca2+
+C4H4O42-Ca (C4H4O4) (2.10)
Mg2+
+C4H4O42-Mg (C4H4O4) (2.11)
The formation of calcium and magnesium succinate will depend on the various factors,
such as concentration of the acid, reaction time, temperature, nature and grain size of the raw
phosphate rock used for the selective dissolution process. The selective leaching process can
be simplified using the following general equations:
MCO3(s) +H2Y (aq)MY(s/aq)+CO2+H2O (2.12)
M3 (PO4)2+3H2Y3MY(s/aq) +2H3PO4 (2.13)
Where M=Ca2+and/or Mg2+, Y=H2C4O42-(succinate)

53
The selectivity should be such that the second reaction does not take place, while
the first reaction goes to completion or equilibrium depending on solubility products
(Ksp=8.35, 7.46 for CaCO3 and MgCO3 respectively) and acidity constants for succinic acid
(pK1= 4.21, pK2=5.64 at 25 oC) and CO2 (pK1=6.35, pK2=10.33 for H2CO3). The values of
these constants will depend on the reaction temperature and the kinetics may control the
overall success of the leaching process. The CO2 produced during the reaction process can be
separated and under normal conditions the equilibrium for reaction (2.12) lies far to the right
and which may be considered as an irreversible reaction.
The thermodynamic calculations are important for deep understanding the
chemical nature of leaching and leaching reactions related to the environmental conditions
such as temperature, acid concentration, solid particle size and liquid/ solid ratio of the
leaching process. For these reactions, the quantitative analysis is given in chapter 4 under
result and discussion.
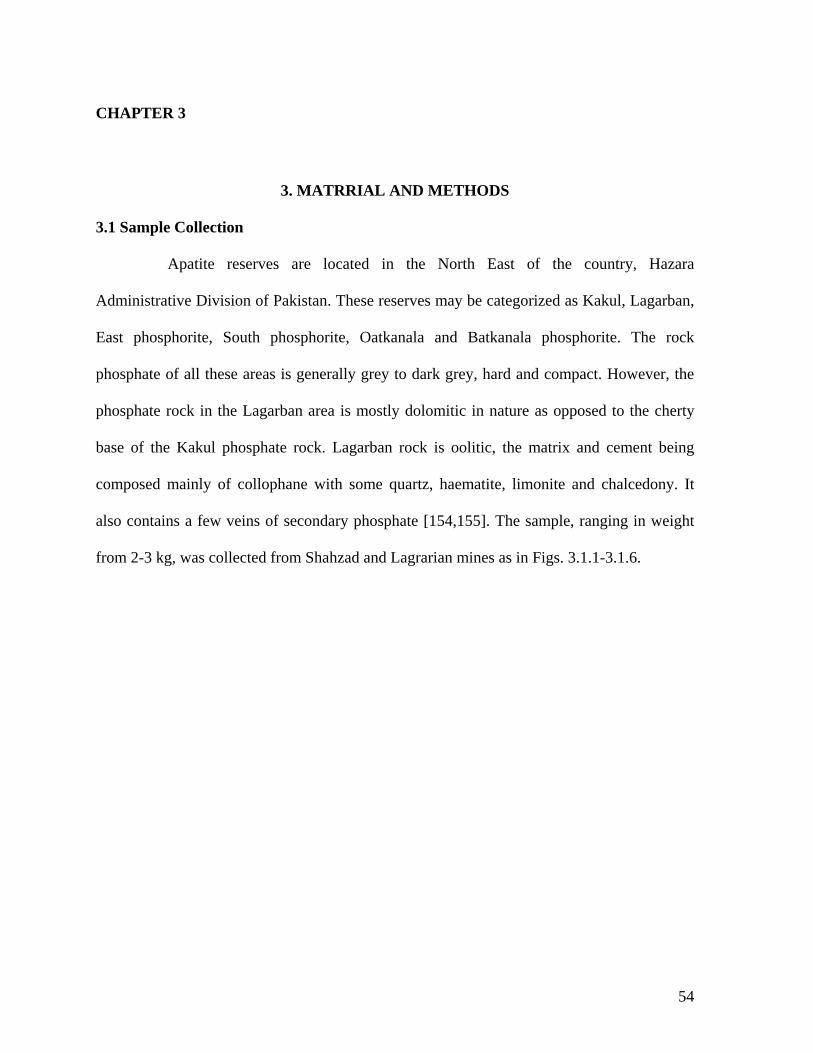
54
CHAPTER 3
3. MATRRIAL AND METHODS
3.1 Sample Collection
Apatite reserves are located in the North East of the country, Hazara
Administrative Division of Pakistan. These reserves may be categorized as Kakul, Lagarban,
East phosphorite, South phosphorite, Oatkanala and Batkanala phosphorite. The rock
phosphate of all these areas is generally grey to dark grey, hard and compact. However, the
phosphate rock in the Lagarban area is mostly dolomitic in nature as opposed to the cherty
base of the Kakul phosphate rock. Lagarban rock is oolitic, the matrix and cement being
composed mainly of collophane with some quartz, haematite, limonite and chalcedony. It
also contains a few veins of secondary phosphate [154,155]. The sample, ranging in weight
from 2-3 kg, was collected from Shahzad and Lagrarian mines as in Figs. 3.1.1-3.1.6.

55
Fig 3.1.1 Phosphate rock deposit of shahzad mines.

56
Fig 3.1.2 Phosphate rock mining at shahzad mines.

57
Fig 3.1.3 Phosphate rock deposit of Largrarian mines.

58
Fig 3.1.4 Phosphate rock mining at Largrarian mines.

59
Fig 3.1.5 Phosphate rock deposit of Puttiann mines.

60
Fig 3.1.6 Phosphate rock mining at Puttiann mines.

61
3.2 Size Reduction and Sieving
Phosphate ore collected from the above mentioned area was in the form of lumps
of different weights and grain size. The sample was crushed in jaw crusher to reduce the size.
After crushing, ball mill was used for further grinding to get fine particle sizes. Using U. S.
Tyler Standard Sieves, various size fractions of the sample were collected for analysis. The
fraction of each particle was separated, weighed and percentage of each weight fraction was
calculated as shown in Table 3.2.1 and Fig. 3.2.1. The analysis was also carried out regarding
average size, mass fractions and cumulative mass fraction as shown in Table 3.2.2 and Fig.
3.2.2.
Table 3.2.1 Mesh size, average size, weight fraction and weight percent.
Mesh
No
Size
(mm)
Average size
(mm)
Weight fraction Weight percent
-24+32 # 0.701+0.495 0.598 293.0 20.99
-32+42 # -0.495+0.351 0.423 263.8 18.91
-42+60 # -0.351+0.246 0.299 233.0 16.70
-60+80 # -0.246+0.175 0.210 189.0 13.54
-80+115 # -0.175+0.125 0.15 187.5 13.44
-115 # -0.125 0.125 229.0 16.41

62
12
13
14
15
16
17
18
19
20
21
22
0 0.1 0.2 0.3 0.4 0.5 0.6 0.7
Average size (mm)
Wt %
of r
ock
Fig. 3.2.1 Average particle size and wt% of phosphate rock sample

63
Table 3.2.2 Average size, mass fractions and cumulative mass fraction
Average size (mm) Mass fraction (wi/wt) umulative mass fraction.
0.598 0.210 0.21
0.423 0.189 0.40
0.299 0.167 0.57
0.210 0.136 0.70
0.15 0.134 0.84
0.125 0.165 1.00

64
0.1
0.2
0.3
0.4
0.5
0.6
0.7
0.8
0.9
1
1.1
0.1 0.2 0.3 0.4 0.5 0.6 0.7
Average size (mm)
Cum
ula
tive m
ass frac
tion
Fig. 3.2.2 Average particle size and cumulative mass fraction of phosphate rock

65
3.3 Sample Preparation for Analysis
5.0 gm sample of the ground phosphate rock was placed in an electric furnace at
about 110 oC to remove the moisture content before the further analysis of the sample. The
fire-clay crucible for electric furnace was washed, cleaned, preheated (to dry at 110oC), and
then cooled to the room temperature. These sample fractions were analyzed for the main
conditions, namely, P2O
5 content, acid insoluble residue (AIR), loss on ignition (LOI) and
CO2 content as shown in Table 3.3.1.
Acid insoluble Residue has been defined as the amount of the residue that
remained unreacted in the sample, after being treated with a standard HNO3/HCl solution and
ignited at 950C. The loss on ignition has been defined as the decrease in weight of the
sample after being ignited from 550 to 950C. It also refers to the amount of CO2 in the
sample, either before or after the leaching process. The dissolved fraction of the calcareous
material during the leaching process was calculated by using the following equation 3.3.1:
sampleoriginalincalciumofamountTotal
solutiontheincalciumofAmount exp (3.3.1)
And the recovery of P2O5 content was calculated by using the following equation 3.3.2.
100%
%covRe
52
5252
SampleOriginalinOPSampleOriginalofWt
SampleLeachedinOPSampleLeachedofWteryOP
(3.3.2)
Conventional [156,157] as well as instrumental analysis techniques such as
Scanning Electron Micrographs (SEM), Energy Dispersive X-ray Analysis (EDX) and
Atomic Absorption Spectrophotometer (AAS) have been used for analysis. The analysis of

66
the sample is given as shown in Table 3.3.1. The effect of average particle size on P2O5, AIR,
LOI and CO2 contents has been studied as shown in Figs. 3.3.1-3.3.4.
Table 3.3.1 Analysis of the rock samples
Sample (mesh) Size (mm) P2O5 (%) AIR (%) LOI (%) CO2 (%)
-24+32 -0.701+0.495 16.12 2.43 29.97 27.89
-32+42 -0.495+0.351 16.88 2.67 29.17 26.97
-42+60 -0.351+0.246 17.73 2.75 28.13 25.71
-60+80 -0.246+0.175 18.69 2.79 26.93 24.57
-80+115 -0.175+0.125 19.31 2.81 25.87 23.63

67
15.5
16
16.5
17
17.5
18
18.5
19
19.5
20
0.1 0.2 0.3 0.4 0.5 0.6 0.7
Average size (mm)
P2O
5%
Fig. 3.3.1 Effect of average particle size on P2O5 content

68
2.4
2.45
2.5
2.55
2.6
2.65
2.7
2.75
2.8
2.85
0.1 0.2 0.3 0.4 0.5 0.6 0.7
Average size (mm)
AIR
%
Fig. 3.3.2 Effect of average size of particle on AIR content

69
25.5
26
26.5
27
27.5
28
28.5
29
29.5
30
30.5
0.1 0.2 0.3 0.4 0.5 0.6 0.7
Average size (mm)
LOI%
Fig. 3.3.3 Effect of average particle size on LOI content

70
23
23.5
24
24.5
25
25.5
26
26.5
27
27.5
28
28.5
0.1 0.2 0.3 0.4 0.5 0.6 0.7
Average size (mm)
CO
2%
Fig. 3.3.4 Effect of average particle size on CO2 content

71
3.4 Selective Leaching with Lactic Acid
As mentioned before in chapter 3 that two different samples collected from
Shahzad and Lagrarian mines. To study the effect of lactic acid on the selective leaching of
calcareous material in low-grade phosphate rock the Lagrarian sample was used. It is also
known as Puttiann mine, which is present in Hazara Administrative Division (district Abbot
Abad). The sample was crushed and sieved for analysis. Various fractions of different
particle size were collected using US Tayler standard sieves for further analysis and kinetic
study as shown in Table 3.4.1. The effect of average particle size on P2O5, CO2, LOI and AIR
contents has also been given in Figs. 3.4.1-3.4.4.

72
Table 3.4.1 Analysis of the rock samples
Size (mm) P2O5% CO2% LOI% AIR%
0.503 15.89 28.29 30.74 2.13
0.356 16.23 27.75 30.12 2.29
0.2515 17.32 26.87 29.11 2.63
0.1775 19.67 24.67 26.83 2.87
0.1255 22.39 20.13 22.13 2.97

73
15
16
17
18
19
20
21
22
23
0.1 0.2 0.3 0.4 0.5 0.6
Average particle size (mm)
P2O
5%
Fig. 3.4.1 Effect of average particle size on P2O5 content

74
15
17
19
21
23
25
27
29
31
33
35
0.1 0.2 0.3 0.4 0.5 0.6
Average particle size (mm)
CO
2 %
Fig. 3.4.2 Effect of average particle size on CO2 content

75
20
22
24
26
28
30
32
0.1 0.2 0.3 0.4 0.5 0.6
Average particle size (mm)
LO
I%
Fig. 3.4.3 Effect of average particle size on LOI content

76
2
2.1
2.2
2.3
2.4
2.5
2.6
2.7
2.8
2.9
3
0.1 0.2 0.3 0.4 0.5 0.6
Average particle size (mm)
AIR
%
Fig. 3.4.4 Effect of average particle size on AIR content

77
3.5 Experimental Procedure
To study the reaction kinetic, the particle size fraction (-80+115# (-0.175+0.125
mm) was used in a well mixed spherical glass batch reactor (500 ml), which was equipped
with a mechanical stirrer having a digital controller unit and a constant temperature bath. For
each run, a specific concentration of succinic acid (8%) with liquid/solid (L/S) ratio of 7:1
was slowly fed into the reactor vessel containing 5.0 gm of the rock sample. After
completion of each reaction, the reaction vessel was immediately placed in an ice bath to stop
the reaction. The leach slurry was separated by filtration after the leaching process. The solid
and liquid phases were then weighed and analyzed. The Ca2+ content in the leach solution
was determined by (AAS) A-1800. Hitachi. The solid phase after the leaching process was
also analyzed by using calcinations method at 950C to confirm the results for the conversion
of calcareous material and degree of beneficiation of low-grade phosphate rock. The spent
succinic acid from the liquid phase (containing calcium succinate) was recovered by
sulphuric acid. After treating the calcium succinate with sulphuric acid, insoluble calcium
sulphate was separated from the recovered succinic acid by filtration as shown below.
Ca (C4H4O4)+H2SO4CaSO4+C4H6O4 (3.5.1)
To see the effect of different parameters (which were not studied in the case of
succinic acid leaching) i.e. effect of acid concentration, liquid/solid ratio and particle size,
and the sample with particle size fraction of -100+150 mesh (-0.147+0.104 mm) was treated
with lactic acid. Experimental procedure was adopted as mentioned before in the case of
succinic acid. A number of experiments were carried out by using different acid
concentration, liquid/solid ratio and various size particles of calcareous material at different
reaction temperatures with a constant stirring rate of 350 rpm.

78
For a number of reaction run, the reaction vessel was placed in an ice bath to stop
the reaction, after heating at different temperatures. The stop point of temperature may a little
bit different at various levels. However, small variation in the stop point of temperature is not
expected to influence the experimental results significantly.

79
3.6 CHAMICALS USED
Chemical Name Formula Mol Wt %age Purity Company
Ammonium
Molybdate
(NH4)2MoO4 1235.86g/mol Extra pure MERK
Succinic Acid C4H6O4 118g/mol 99.9% MERK
Sulphuric Acid H2SO4 98.08g/mol 97% Fluka Riedal
Nitric Acid HNO3 63.01g/mol 65% Riedal-ed Hasen
Hypochloric Acid HClO4 11.58 gm Extra pure BDH
Lactic Acid C3H6O3 90.08 gm 90% MERK
Ammonium
Hydroxide
NH4OH 35g/mol 35% MERK
Sodium Hydroxide NaOH 40g/mol 97% Fluka
Phenolphthalein C20H4O4 318.32 gm PH=8.3-10 Fluka
Calcium Nitrate Ca(NO3)2.4H2O 236.15g/mol Extra pure Fluka

80
3.7 INSTRUMENTAL TECHNIQUES USED FOR ANALYSIS
3.7.1 Atomic Absorption Spectrophotometer
In order to find out the concentration of calcium in the aqueous phase, an atomic
absorption spectrophotometer (AAS) A-1800 Hitachi (Fig. 3.8.1) was used to study mass
transfer and reaction kinetics in the present leaching process. Metals are estimated by the
atomic absorption spectrophotometer based on two different modes; 1 Absorption mode. 2.
Emission mode.
3.7.2 Absorption Mode
In absorption mode, the flame of the atomic absorption spectrophotometer
converts the incoming aerosol into atomic vapor, which can then absorb light from the
primary light source (the hollow cathode lamp). The amount of radiation absorbed by the
metal atoms is measured to find out the concentration of metal in the solution.
3.7.3 Emission Mode
This technique performs the flame to do two jobs; 1. The flame converts the
aerosol into an atomic vapor; 2. Thermally activated atoms are elevated to an excited
electronic state. These atoms emit radiation when they return to the ground state. The
instrument detects the radiation. Then the intensity of radiation is related to the concentration
of the element in solution.

81
Fig.3.7.1 AAS (A-1800) Hitachi used for analysis.
82
3.7.4 Chemical Interference
Chemical interference may affect the efficiency of production of neutral atoms in
the flame causing effects on both absorption and emission in a similar manner [158]. One of
the most general types of chemical interference is the formation of refractory compounds
with the test element, usually by an anion in the aspirated solution [159] resulting in a
decreased signal. For example, phosphate may react with calcium ion to produce calcium
phosphate in air-acetylene flame. In such a case, the determination of calcium cannot be
considered as a reliable measure due to the interference resulting in a decreased signal.
Adding an appropriate releasing agent may generally minimize chemical
inferences. These agents either compete for the interfering substance or displace it from the
test element. For example, a sufficiently high concentration (about 1% depending on the
actual phosphate levels) of strontium or lanthanum chloride may be added to the sample
solution to eliminate phosphate interference with calcium absorption. The strontium or
lanthanum will preferentially react with the phosphate and prevent its reaction with the
calcium or high concentration of EDTA may be added to form a chelate with the calcium and
prevent its reaction with phosphate. Because addition of an external reagent may sometimes
change the total composition, it should also be added to the standard solutions prepared for
the test metal. The use of high temperature flames can frequently eliminate chemical
interferences. Phosphate interference on calcium, for example, does not occur in the nitrous
oxide-acetylene flame [160].

83
3.7.5 Calibration of Atomic Absorption Spectrophotometer
The calibration curve procedure was adopted to determine the concentration of
the concerned element in the present work. This method is generally selected where
interferences are either absent or are fully controlled. A series of standard solutions of
calcium nitrate (standard solution for the calibration of the atomic absorption
spectrophotometer, analytical grade, supplied by B. D. H) in the range of 5 to 30 ppm were
prepared with distilled water. The atomic absorption spectrophotometer was calibrated using
these standard solutions and plot of metal concentration versus absorbance for each standard
was determined.
The calibration curve (Fig. 3.8.2) for the calcium was found linear over this range
of the standard solutions used. The determination of calcium concentration in aqueous
solution was carried out at a wavelength of 422.7 nm in absorption mode using a hollow
cathode lamp specific for calcium. Adjustment of the burner head relative to the light path of
the instrument was necessary to obtain maximum absorption. The lamp current and silt width
were set at 15 mA and 0.7 nm respectively. Flow rates of acetylene 18 and air at 55 l/min
gave a persistent non-luminous flame. For the analysis of calcium, the solutions were diluted
so as to fall within the range of 5 to 30 ppm.

84
Absorbance
0
0.2
0.4
0.6
0.8
1
0 5 10 15 20 25 30 35Calcium(ppm)
Abs
orba
nce
Fig.3.7.2 Correlation curve for Calcium nitrate versus Absorbance.

85
3.8 Scanning Electron Microscopy
Scanning electron microscopy (SEM) is used for inspecting topographies of
specimens at very high magnifications using the equipment, which is known as scanning
electron microscope. In the present case, the scanning electron microscopy has been used to
characterize morphological features of the sample as shown in Fig. 3.9.1. SEM micrograph
of sample explains many prominent characteristics features. Both dark and bright colored
morphological features are evident. The surface is extremely rough with numerous
disclamations and serrated features mostly in the form of cuts. Most of the pore mouths are
blind. However, some pore drilled into the matrix can be seen. The micrograph reveals
calcareous and siliceous inclusions. The black region embedded in the bright calcareous or
matrix evident the presence of phosphorus in the sample.
3.8.1 Energy Dispersive X-ray Analysis
A SEM may be equipped with an EDX analysis system to enable it to carry out
compositional analysis of samples. EDX Analysis stands for Energy Dispersive X-ray
Analysis. It is sometimes may be referred to also as EDS or EDAX analysis. The EDX
analysis system works as an integrated feature of a scanning electron microscope (SEM), and
cannot work on its own without SEM. EDX analysis is useful in identifying materials and
contaminants, as well as estimating their relative concentrations on the surface of the sample.
The higher a peak in a spectrum, the more concentrated the element is in the sample. Energy
Dispersive X-ray Analysis (EDX) of the sample is shown in Fig. 3.9.2. The EDX of the
sample evaluates the existence of calcareous and siliceous nature of the material under study.
It also indicates the presence of small amount of iron within the matrix of the apatite.

86
Fig.3.8.1 SEM micrograph of the sample

87
Fig. 3.8.2 EDX spectrum of the sample

88
CHAPTER 4
4. RESULTS AND DISCUSSION
4.1 Effect of Reaction Time on the Leaching Process at Different Temperatures
The selective leaching of calcareous material in low-grade phosphate rock may
depend on the various parameters such as reaction time, temperature, acid concentration,
liquid/solid ratio, particle size and stirring speed of the reaction mixture. A number of
experiments have been carried out to see the effect of reaction time on the dissolution of
calcareous material in low-grade phosphate rock at various temperatures as shown in Table
4.1.1 and Figs. 4.1.1-4.1.5. The experimental results show that the degree of selective
leaching of calcareous material increases with an increase in the reaction time depending on
the reaction temperature. According to the experimental results the optimum leaching time
has been found to be between 45 to 55 minutes at 60oC using the acid concentration of 8%
and a liquid/solid ratio of 7:1.
As the temperature of reaction is increased, the conversion of calcareous material
increases with a decrease in reaction time required to reach the equilibrium. This indicates
that the higher rates as well as higher solubility at higher temperatures. However, the results
show that the rate of dissolution is not appreciable after 60-70oC. This situation may be
attributed due to the establishment of equilibrium or the formation of a solid product, which
prevents further leaching of the calcareous material in the rock. It shows that higher
temperatures may tend to decrease the solubility of succinate product along with the
contamination of CO2 gas stream with water and succinic acid vapors, which are vaporized
during the reaction relatively at higher temperature.

89
Table 4.1.1 Effect of reaction time on leaching of calcareous (XB %) material at various
temperatures.
Time (min) 40oC 50oC 60oC 70oC 80oC
5 3.0 7.0 11.0 15.0 19.0
15 9.0 19.0 27.0 37.0 56.1
25 12.0 27.0 37.0 64.21 83.36
35 13.0 37.0 56.0 77.3 96.41
45 21.0 36.39 65.0 81.48 98.94
55 17.73 38.59 73.0 97.0 -
65 17.21 34.15 73.0 97.0 -

90
0
5
10
15
20
25
0 10 20 30 40 50 60 70
Leaching reaction time(min)
XB(%
)
Fig. 4.1.1 Effect of reaction time on the conversion (XB %) of calcareous material at 40oC

91
0
5
10
15
20
25
30
35
40
45
0 10 20 30 40 50 60 70
Leaching reaction time(min)
XB
(%)
Fig.4.1.2 Effect of reaction time on the conversion (XB %) of calcareous material at 50oC

92
10
15
20
25
30
35
40
45
50
55
60
65
70
75
0 5 10 15 20 25 30 35 40 45 50 55 60 65 70
Leaching reaction time(min)
XB(%
)
Fig. 4.1.3 Effect of reaction time on the conversion XB % of calcareous material at 60oC

93
0
10
20
30
40
50
60
70
80
90
100
0 10 20 30 40 50 60 70
Leaching reaction time(min)
XB(%
)
Fig. 4.1.4 Effect of reaction time on the conversion XB (%) of calcareous material at 70 oC

94
15
25
35
45
55
65
75
85
95
105
0 10 20 30 40 50 60 70
leaching reaction time(mni)
XB
%
Fig. 4.1.5 Effect of reaction time on the conversion XB (%) of calcareous material at 80oC

95
4.2 Effect of Reaction Temperature on Dissolution
To see the effect of temperature on selective leaching of calcareous material at
various acid concentrations, a number of experiments have been performed with stirring
speed of 350 rpm using liquid-solid ratio (L/S) 7:1 as shown in Table 4.2.1 and Figs 4.2.1-
4.2.5. The results indicate that the selective leaching process is sensitive to reaction
temperature depending on the acid concentration. The results show that the rate of dissolution
increases with an increase in the acid concentration. However, the dissolution rate of
calcareous material in low-grade phosphate rock is not much higher after 8% concentration
the leaching agent used.
In the leaching of colemanite ore with acetic acid [161], the results showed that as
the acid concentration in the leaching process was increased, the rate of formation of the
product increased by attaining the saturation value near the solid particle along with the
appearance of a sparingly soluble solid film layer around the particle resulting in a decrease
in the leaching process. However, in the present case of selective leaching the acid
concentration has not been increased more than 7-8%. It has been observed separately that by
increasing the acid concentration to about 9-10% and above, the acid starts to dissolve the
phosphate element itself appearing as losses in the filtrate solution. Therefore, the acid
concentration has not been increased more than 7-8% in the present case of selective
leaching.
4.3 Effect of Acid Concentration on P2O5 and CO2 Contents
The concentration of succinic acid can play an important role to selectively
dissolve the calcareous material in a low-grade phosphate rock. An increase in the

96
concentration of the acid is expected to increase the P2O5% content of a low-grade phosphate
rock, but the higher concentration of succinic acid can effect the selective leaching of the
calcareous material and the mechanism of the reaction kinetic. A number of experiments
have been carried to see the effect of acid concentration on the P2O5 and CO2 Contents as
shown in Table 4.3.1 and in Fig 4.3.1.
The experimental results show that the P2O5 content increases with an increase in
the acid concentration. The acid concentration that gives the most promising leaching results
has been found to depend on the liquid/solid ratio used in the leaching process. An acid
concentration of 8% with a liquid/solid ratio of 7:1 appears to be the most promising. As
mentioned before that when the succinic acid concentration increases to 9-10% and above,
the acid starts to considerably dissolve the apatite in the phosphate rock, which indicates that
there should be an optimum acid concentration to increase the degree of beneficiation by
avoiding an attack on apatite in the rock.
The results show that as the acid concentration is increased up to 9%, the increase
in the P2O5 content is not significant, which may due to an increased effect of polarity of the
O-H bond present in the acid molecules. On the other hand, the CO2% decreases
correspondingly with an increase in the acid concentration up to a certain limit and after that
the decrease in CO2% content is not much higher.
4.4 Effect of Liquid/Solid Ratio on P2O5 and CO2 Contents
A number of experiments haven been carried out to see the effect of liquid/solid
ratio (vol./wt. basis), on the degree of beneficiation of low-grade calcareous phosphate rock
as shown in Table 4.4.1 and Figs. 4.4.1-4.4.2. An increase in the liquid/solid ratio (vol./wt.
97
basis) may be expected to decrease the CO2% content resulting in an increased degree of
beneficiation of a low-grade calcareous phosphate rock. In the leaching process, the
liquid/solid ratio has been varied from 4:1 to 9:1. The experimental results show that P2O5
content increases as the liquid/solid ratio increases in the leaching process along with
corresponding reduction in CO2% content. The results indicate an appreciable increase in the
P2O5 content with liquid/solid ratio from 4:1 to 7:1, after which the degree of beneficiation is
not much higher.
On the other hand, after the liquid/solid ratio of 7:1 the corresponding reduction in
CO2% content is not appreciable. Therefore, the liquid/solid ratio of 7:1 has been found to be
promising depending on the reaction conditions in the leaching process. Depending on the
reaction conditions, the results indicate that both of the parameters (acid concentration and
liquid/solid ratio) should be optimized in order to increase the efficiency of the leaching
process reducing the risk of apatite dissolution.
The summery of the optimal parameters regarding calcareous phosphate rock and
succinic acid are given below.
Optimum time required for completion the reaction =55min
Optimum liquid/solid required for completion the reaction =7:1
Optimum acid concentration required for completion the reaction =8%
Optimum temperature required for completion the reaction =60oC
Optimum rpm required for completion the reaction =350

98
Table 4.2.1 Effect of temperature on selective leaching XB % of calcareous material at
various acid concentrations
Tem. (OC) Acid 6% Acid 7% Acid 8% Acid 9% Acid 10%
40 1.88 4.70 7.50 11.0 17.0
50 4.89 11.88 18.90 25.0 28.70
60 6.12 16.87 27.65 35.67 39.87
70 9.88 26.78 41.26 44.0 53.78
80 14.56 31.26 49.87 55.0 59.87

99
0
0.02
0.04
0.06
0.08
0.1
0.12
0.14
0.16
35 40 45 50 55 60 65 70 75 80 85
Leaching reaction temperature oC
Fra
ctio
n (xB
) dis
solv
ed
Fig. 4.2.1 Effect of temperature on dissolution (xB) with 6% succinic acid concentration and
liquid/solid ratio 5:1 for 30 min

100
0
0.05
0.1
0.15
0.2
0.25
0.3
0.35
35 40 45 50 55 60 65 70 75 80 85
Leaching reaction temperature oC
Fra
ctio
n (
xB)
diss
olv
ed
Fig. 4.2.2 Effect of temperature on dissolution (XB) with 7% succinic acid concentration and
liquid/solid ratio 5:1 for 30 min

101
0
0.1
0.2
0.3
0.4
0.5
0.6
35 40 45 50 55 60 65 70 75 80 85
Leaching reaction temperature oC
Fra
ctio
n (x B
) dis
solv
ed
Fig. 4.2.3 Effect of temperature on dissolution (XB) with 8% succinic acid concentration and
liquid/solid ratio 5:1 for 30 min

102
0
0.1
0.2
0.3
0.4
0.5
0.6
35 40 45 50 55 60 65 70 75 80 85
Leaching reaction temperature oC
Fra
ctio
n (x
B)
dis
solv
ed
Fig. 4.2.4 Effect of temperature on dissolution (XB) with 9% succinic acid concentration and
liquid/solid ratio 5:1 for 30 min

103
0
0.1
0.2
0.3
0.4
0.5
0.6
0.7
35 40 45 50 55 60 65 70 75 80 85
Leaching reaction temperature oC
Fra
ctio
n (xB
) dis
solv
ed
Fig. 4.2.5 Effect of temperature on dissolution (XB) with 10% succinic acid concentration
and liquid/solid ratio 5:1 for 30 min

104
Table 4.3.1 Effect of acid concentration on P2O5 and CO2 Contents
Concentration (%) P2O5% CO2%
2 19.9 23.1
3 22.5 17.6
4 26.2 11.7
5 27.9 9.0
6 29.1 7.4
7 30.9 5.5
8 31.5 5.1
9 31.9 5.0

105
15
17
19
21
23
25
27
29
31
33
0 1 2 3 4 5 6 7 8 9 10
Leaching agent concentration(%)
P2 O
5 %
Fig. 4.3.1 Effect of acid concentration on P2O5 content with liquid/solid ratio 7:1 for 55 min
at 55 oC

106
3
5
7
9
11
13
15
17
19
21
23
25
0 1 2 3 4 5 6 7 8 9 10
Leaching agent concentration (%)
CO
2 %
Fig. 4.3.2 Effect of acid concentration on CO2 content with L/S ratio 7:1 for 55 min at 55oC

107
Table 4.4.1 Effect of liquid/solid ratio on P2O5 and CO2 contents using 8% acid concentration
for 55 min at 55oC
L/S Ratio P2O5% CO2%
4 27.9 9.0
5 29.1 7.4
6 30.9 5.5
7 31.5 5.1
8 32.5 5.1
9 32.7 4.9

108
27
28
29
30
31
32
33
34
35
3 4 5 6 7 8 9 10
Liquid/solid ratiox
P2 O
5 %
Fig.4.4.1 Effect of liquid/solid ratio on P2O5 contents using acid concentration 8% for 55 min
at 55oC.

109
4
5
6
7
8
9
10
3 4 5 6 7 8 9 10
Liquid/solid ratio
CO
2%
Fig.4.4.2 Effect of liquid/solid ratio on CO2 contents using acid concentration 8% for 55 min
at 55oC.

110
4.5 Leaching with Lactic acid
Lactic acid has also been used to see the effect of various parameters on the
selective leaching of low-grade phosphate rock with various reaction conditions such as acid
concentration, liquid/solid ratio, particle size, stirring speed and temperature. The succinic
acid can be used as a leaching agent as it dissolves the calcareous material in low-grade
phosphate rock and improves the P2O5 content up to an industrially acceptable level.
However, the use of this acid is limited by its solubility at lower temperatures. The succinic
acid does not appear to work well below about 37oC.
As mentioned before, the formic and acetic acids can be used for selective
leaching of calcareous material, but they may cause higher corrosion effects on the
equipment along with greater tendency of attack on the phosphate element as well.
Lactic acid, being relatively weak and having more organic character, may be
expected to show less corrosion effects on the equipment along with minimal risk of leaching
of the phosphate element itself as compared to formic and acetic acids. On the other hand,
lactic acid is relatively stronger than succinic acid and may be expected to efficiently
dissolve the calcareous material in low-grade phosphate rock. Therefore, the possibility of
lactic acid to selectively dissolve the calcareous material in low-grade phosphate rock has
also been studied.
4.5.1 Effect of Acid Concentration on the Conversion
In the case lactic acid, the selective dissolution of calcareous material in low-
grade phosphate rock is also expected to depend on the various parameters such as reaction
time, temperature, acid concentration, liquid/solid ratio, particle size and stirring speed of the

111
reaction mixture. A number of experiments have been carried out to see the effect of acid
concentration on the selective leaching of calcareous material in the rock as shown Table
4.5.1 and in Figs. 4.5.1-4.5.5. The experimental results show that at relatively higher acid
concentration, the leaching rate of carbonaceous material is not much higher, a situation that
may be attributed to the increase in the polarity of the acid O-H bond.
At relatively higher acid concentration the number of hydrogen ions decreases in
the dissolution medium as the water amount decreases more and more in the medium. The
results indicate that, in the case of selective leaching for calcareous material in the phosphate
rock, the acid concentration should not be increased more than the required level to avoid the
acid attack on phosphate element during the leaching process as already has been described
in the use of succinic acid.
4.5.2 Effect of Liquid-Solid Ratio on the Conversion
To see the effect of liquid/solid ratio on the dissolution process, a number of
experimental have been carried out as shown in Table 4.5.2.1 and Figs. 4.5.2.1-4.5.2.5. The
experimental results show that the degree of dissolution increases with an increase in the
liquid/solid ratio, a situation that indicates that the total number of acid ions is increased due
to the increase the volume of the medium at the same concentration of the acid. It has been
found in a separate experiment that with lower acid concentration, the value of liquid/solid
ratio considerably increases to achieve the required degree of leaching. However, higher
liquid/solid ratio is resulted in a relatively lengthy process including handling, filtration and
regeneration of the consumed acid.

112
4.5.3 Effect of Particle Size on the Conversion
A number of experimental have been carried out to see the effect of particle size
ratio on the dissolution of calcareous material as shown in Table 4.5.3.1 and Figs. 4.5.3.1-
4.5.3.5. The experimental results show that the efficiency of the leaching process increases
with a decrease in the particle size. This can be expected because the surface area per unit
weight of sample increases as the sample is reduced in its size.
On the other hand, the liberation of more calcareous material from the apatite
matrix can be expected as the degree of size reduction is increased more and more. The
efficiency of the leaching process may be increased by further size reduction and fine
grinding of the phosphate feed, but the problems related to handling, filtration and marketing
of fine phosphates, may not allow grinding to exceed a certain limit. On the other hand,
higher amount of energy required for grinding and size reduction may cause an extra cost to
the process.
4.5.4 Effect of Temperature on the Conversion
At various reaction temperatures, a number of experiments have been carried out
to see the effect of reaction time on the dissolution of calcareous material at the known
parameter conditions as shown Table 4.5.4.1. The leaching rate curves have been shown in
Figs. 4.5.4.1-4.5.4.5. The results indicate that, by increasing the temperature, the dissolution
rate of calcareous material in the phosphate rock increases with a decrease in reaction time
required to reach the equilibrium.
The experimental results also show that after about 45-50C the dissolution rate
of calcareous material in the sample is not much higher, a situation which indicates that

113
higher temperatures may tend to decrease the solubility of lactate along with the
contamination of CO2 gas with water and lactic acid vapors.
4.5.5 Effect of Reaction Time on P2O5 and CO2 Contents
Various experiments have been carried out to see the effect of reaction time on
P2O5 and CO2 contents depending on acid concentration, liquid/solid ratio, particle size and
temperature as shown in Table 4.5.5.1 and Figs. 4.5.5.1-4.5.5.2. The results show that lactic
acid may be used to reduce calcium carbonate in low-grade calcareous phosphate rock as it
increases the degree of beneficiation making it viable as a feed to an industrial acidulation
process. For example, at 45 min the P2O
5 content has been raised up to about 35% along with
corresponding reduction in CO2 content up to about 70% of the sample at a phosphate
recovery of more than 75%.
The summery of the optimal parameters regarding calcareous phosphate rock and lactic acid
are given below.
Optimum time required for completion the reaction= 45min
Optimum liquid/solid required for completion the reaction =7:1
Optimum acid concentration required for completion the reaction=8%
Optimum particle required for completion the reaction =0.1255mm
Optimum temperature required for completion the reaction =45-50 oC
Optimum rpm required for completion the reaction =350
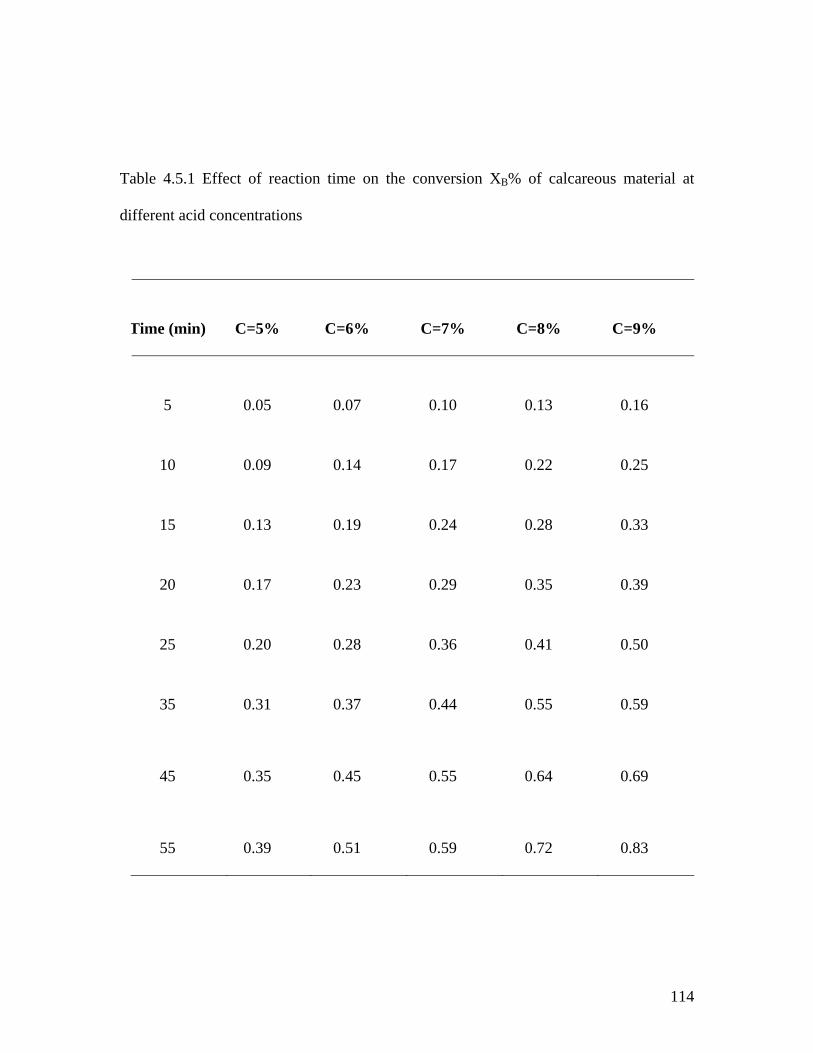
114
Table 4.5.1 Effect of reaction time on the conversion XB% of calcareous material at
different acid concentrations
Time (min) C=5% C=6% C=7% C=8% C=9%
5 0.05 0.07 0.10 0.13 0.16
10 0.09 0.14 0.17 0.22 0.25
15 0.13 0.19 0.24 0.28 0.33
20 0.17 0.23 0.29 0.35 0.39
25 0.20 0.28 0.36 0.41 0.50
35 0.31 0.37 0.44 0.55 0.59
45 0.35 0.45 0.55 0.64 0.69
55 0.39 0.51 0.59 0.72 0.83

115
0
0.1
0.2
0.3
0.4
0 5 10 15 20 25 30 35 40 45 50 55 60
Reaction time (min)
L/S=7, D=0.1255mm, T=45 OC , SS=350 rpm
a e
xp
Fig. 4.5.1 Effect of reaction time on the conversion of calcareous material with 5% lactic acid
concentration
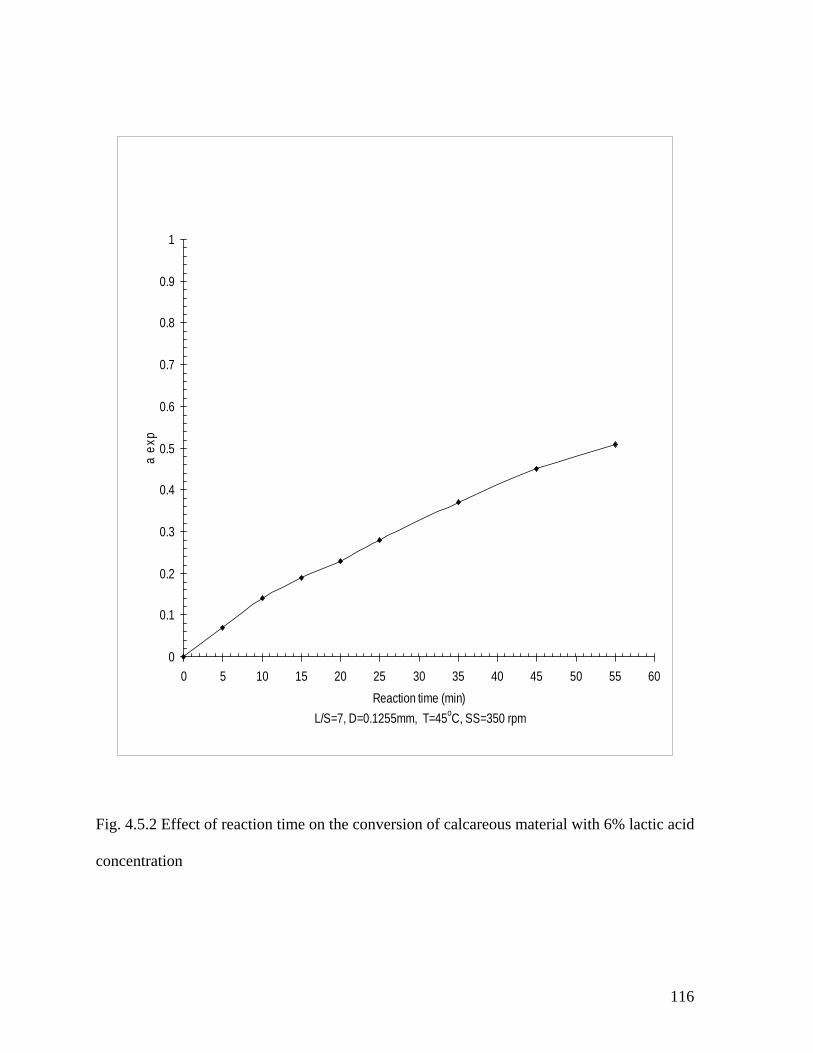
116
0
0.1
0.2
0.3
0.4
0.5
0.6
0.7
0.8
0.9
1
0 5 10 15 20 25 30 35 40 45 50 55 60
Reaction time (min)
L/S=7, D=0.1255mm, T=45oC, SS=350 rpm
a e
xp
Fig. 4.5.2 Effect of reaction time on the conversion of calcareous material with 6% lactic acid
concentration

117
0
0.2
0.4
0.6
0 5 10 15 20 25 30 35 40 45 50 55 60
Reaction Time (min) C8% L/S=7 T=45 OC SS=350rpm
ae
xp
Fig. 4.5.3 Effect of reaction time on the conversion of calcareous material with 7% lactic acid
concentration

118
0
0.1
0.2
0.3
0.4
0.5
0.6
0.7
0.8
0 5 10 15 20 25 30 35 40 45 50 55 60
Reaction time(min)
L/S=7, D=0.1255mm, T=45 OC SS=350rpm
ae
xp
Fig. 4.5.4 Effect of reaction time on the conversion of calcareous material with 8% lactic acid
concentration

119
0
0.1
0.2
0.3
0.4
0.5
0.6
0.7
0.8
0.9
0 5 10 15 20 25 30 35 40 45 50 55 60
Reactiom time(min)
L/S=7, D=0.1255mm, T=45OC SS=350rpm
ae
xp
Fig. 4.5.5 Effect of reaction time on the conversion of calcareous material with 9% lactic acid
concentration

120
Table 4.5.2.1 Effect of Reaction Time on the Conversion of calcareous material in the rock at
Various Liquid/Solid Ratio
Time (min) L/S=4 L/S=5 L/S=6 L/S=7 L/S=8
5 0.03 0.05 0.08 0.1 0.13
10 0.08 0.09 0.15 0.18 0.25
15 0.13 0.16 0.21 0.27 0.31
20 0.17 0.23 0.28 0.33 0.41
25 0.21 0.28 0.35 0.41 0.49
35 0.31 0.39 0.49 0.56 0.65
45 0.38 0.49 0.63 0.71 0.80
55 0.41 0.55 0.69 0.79 0.91

121
0
0.1
0.2
0.3
0.4
0.5
0.6
0 5 10 15 20 25 30 35 40 45 50 55 60
Reaction time(min)C=8%D=0.1255MM.T=450C,SS=350rpm
a e
xp.
Fig.4.5.2.1 Effect of reaction time on the conversion with liquid/solid ratio (L/S) 4:1

122
0
0.1
0.2
0.3
0.4
0.5
0.6
0.7
0.8
0 5 10 15 20 25 30 35 40 45 50 55 60
Reaction time(min)
C=8%, D=0.1255mm, T=450C.SS=350rpm
aex
p.
Fig. 4.5.2.2 Effect of reaction time on the conversion with liquid/solid ratio (L/S) 5:1
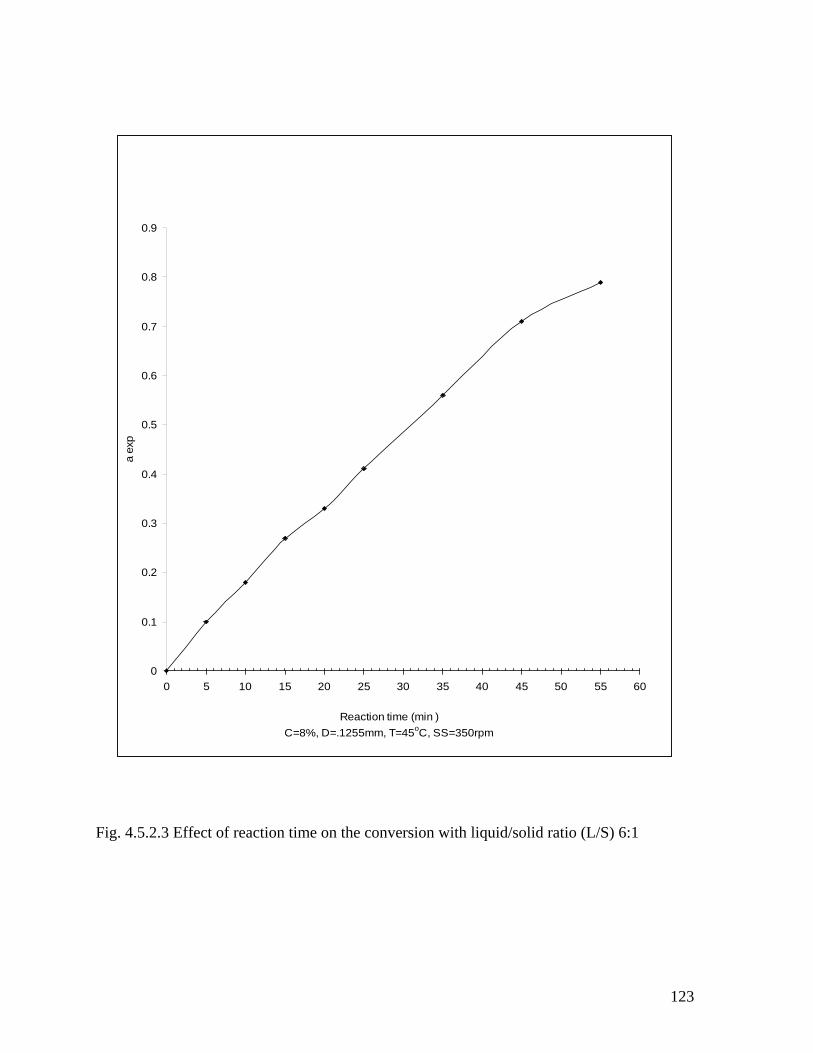
123
0
0.1
0.2
0.3
0.4
0.5
0.6
0.7
0.8
0.9
0 5 10 15 20 25 30 35 40 45 50 55 60
Reaction time (min )
C=8%, D=.1255mm, T=45oC, SS=350rpm
a e
xp
Fig. 4.5.2.3 Effect of reaction time on the conversion with liquid/solid ratio (L/S) 6:1

124
0
0.1
0.2
0.3
0.4
0.5
0.6
0.7
0.8
0.9
1
0 5 10 15 20 25 30 35 40 45 50 55 60
Reaction time(min)
C=8%, D=0.1255mm.T=450C SS=350rpm
ae
xp.
Fig. 4.5.2.4 Effect of reaction time on the conversion with liquid/solid ratio (L/S) 7:1

125
0
0.1
0.2
0.3
0.4
0.5
0.6
0.7
0.8
0.9
1
0 10 20 30 40 50 60
Reaction Time (min)
C=8%, D=0.1255mm.T=450C SS=350rpm
ae
xp.
Fig. 4.5.2.5 Effect of reaction time on the conversion with liquid/solid ratio (L/S) 8:1

126
Table 4.5.3.1 Effect of reaction time on the conversion using different size particles of the
rock
Time (min) 0.503 (mm) 0.356 (mm) 0.2515 (mm) 0.1775 (mm) 0.1255 (mm)
5 0.02 0.04 0.07 0.1 0.12
10 0.05 0.1 0.12 0.16 0.21
15 0.08 0.15 0.19 0.24 0.29
20 0.12 0.2 0.26 0.31 0.41
25 0.17 0.27 0.31 0.38 0.45
35 0.26 0.38 0.45 0.56 0.67
45 0.34 0.46 0.57 0.65 0.79
55 0.36 0.49 0.61 0.76 0.87

127
0
0.1
0.2
0.3
0.4
0 5 10 15 20 25 30 35 40 45 50 55 60
Reaction time(min)
C=8%, L/S=7, T=45OC, SS=350rpm
aexp
Fig. 4.5.3.1 Effect of reaction time on the conversion for particle size 0.503 mm

128
Fig.4.5.3.2 Effect of reaction time on the conversion for particle size 0.356 mm
0
0.1
0.2
0.3
0.4
0.5
0 5 10 15 20 25 30 35 40 45 50 55 60
Reaction time(min)
C=8%, L/S=7,T=45OC, SS=350rpm
aexp

129
0
0.1
0.2
0.3
0.4
0.5
0.6
0.7
0 5 10 15 20 25 30 35 40 45 50 55 60
Reaction Time(mm)
C=8%, L/S=7, T=45OC, SS=350rpm
ae
xp
Fig. 4.5.3.3 Effect of reaction time on the conversion for particle size 0.2515 mm

130
0
0.1
0.2
0.3
0.4
0.5
0.6
0.7
0.8
0 5 10 15 20 25 30 35 40 45 50 55 60
Reaction tiime(min)
C=8%, L/S=7, T=45OC, SS=350rpm
ae
xp
Fig. 4.5.3.4 Effect of reaction time on the conversion for particle size 0.1775 mm

131
0
0.1
0.2
0.3
0.4
0.5
0.6
0.7
0.8
0.9
0 5 10 15 20 25 30 35 40 45 50 55 60
Reaction time(min)
C=8%, L/S=7, T=45OC, SS=350rpm
ae
xp
Fig. 4.5.3.5 Effect of reaction time on the conversion for particle size 0.1255 mm

132
Table 4.5.4 1 Effect of reaction time on the conversion (XB) of calcareous material in the
rock at various temperatures
Time (min) Tem. 25oC Tem. 35oC Tem. 45oC Tem. 55oC Tem. 65oC
5 0.03 0.09 0.13 0.15 0.19
10 0.06 0.13 0.19 0.25 0.35
15 0.09 0.18 0.29 0.35 0.49
20 0.13 0.22 0.36 0.46 0.65
25 0.15 0.27 0.43 0.57 0.82
35 0.19 0.36 0.61 0.79 0.99
45 0.22 0.45 0.77 0.98 -
55 0.27 0.55 0.93 - -
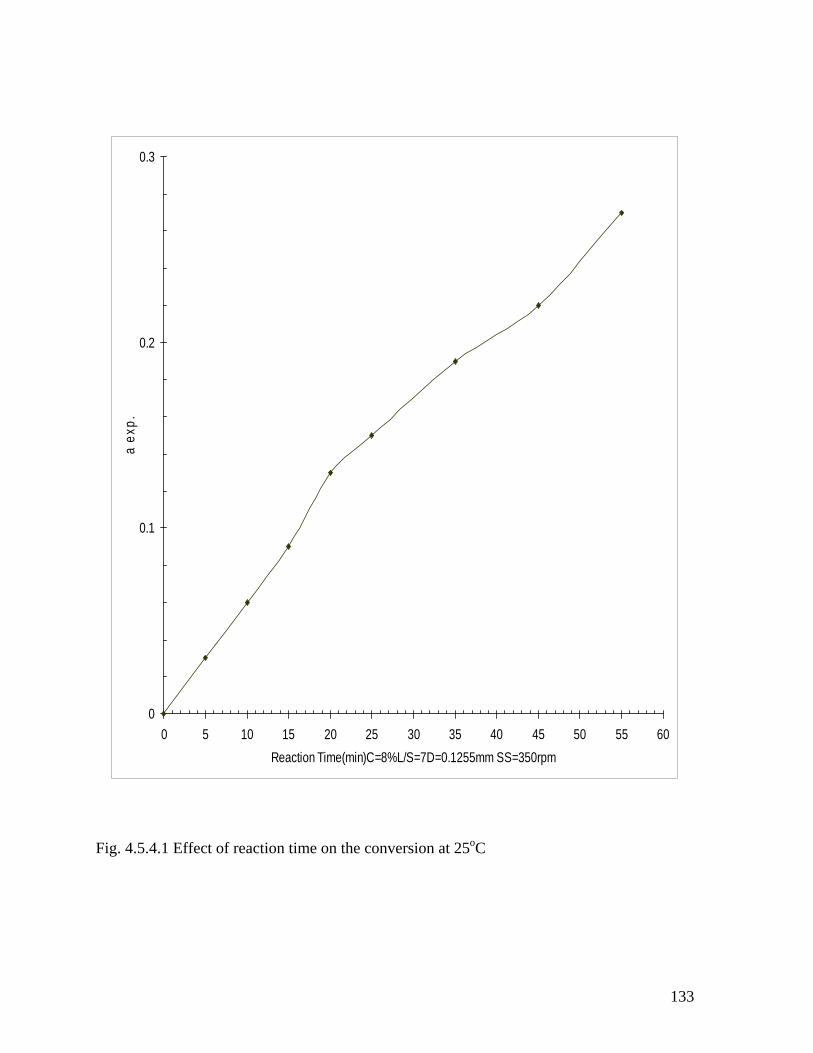
133
0
0.1
0.2
0.3
0 5 10 15 20 25 30 35 40 45 50 55 60
Reaction Time(min)C=8%L/S=7D=0.1255mm SS=350rpm
a e
xp.
Fig. 4.5.4.1 Effect of reaction time on the conversion at 25oC

134
0
0.1
0.2
0.3
0.4
0.5
0.6
0 5 10 15 20 25 30 35 40 45 50 55 60
Reaction Time(min)C==8%L/S=7D=0.1255mm SS=350rpm
a e
xp.
Fig. 4.5.4.2 Effect of reaction time on the conversion at 35oC

135
0
0.2
0.4
0.6
0.8
1
0 10 20 30 40 50 60
Reaction time(min)C=8%L/S=7D=0.1255mm SS=350rpm
a e
xp.
Fig. 4.5.4.3 Effect of reaction time on the conversion at 45oC

136
0
0.1
0.2
0.3
0.4
0.5
0.6
0.7
0.8
0.9
1
0 10 20 30 40 50 60
Reaction time(min)C=8%L/S=7D=0.1255mmSS=350rpm
a e
xp.
Fig. 4.5.4.4 Effect of reaction time on the conversion at 55oC

137
Fig. 4.5.4.5 Effect of reaction time on the conversion at 65oC
0
0.1
0.2
0.3
0.4
0.5
0.6
0.7
0.8
0.9
1
0 10 20 30 40 50 60
Reaction time(min) C =8% D=,1255mm rpm= 350
a e
xp
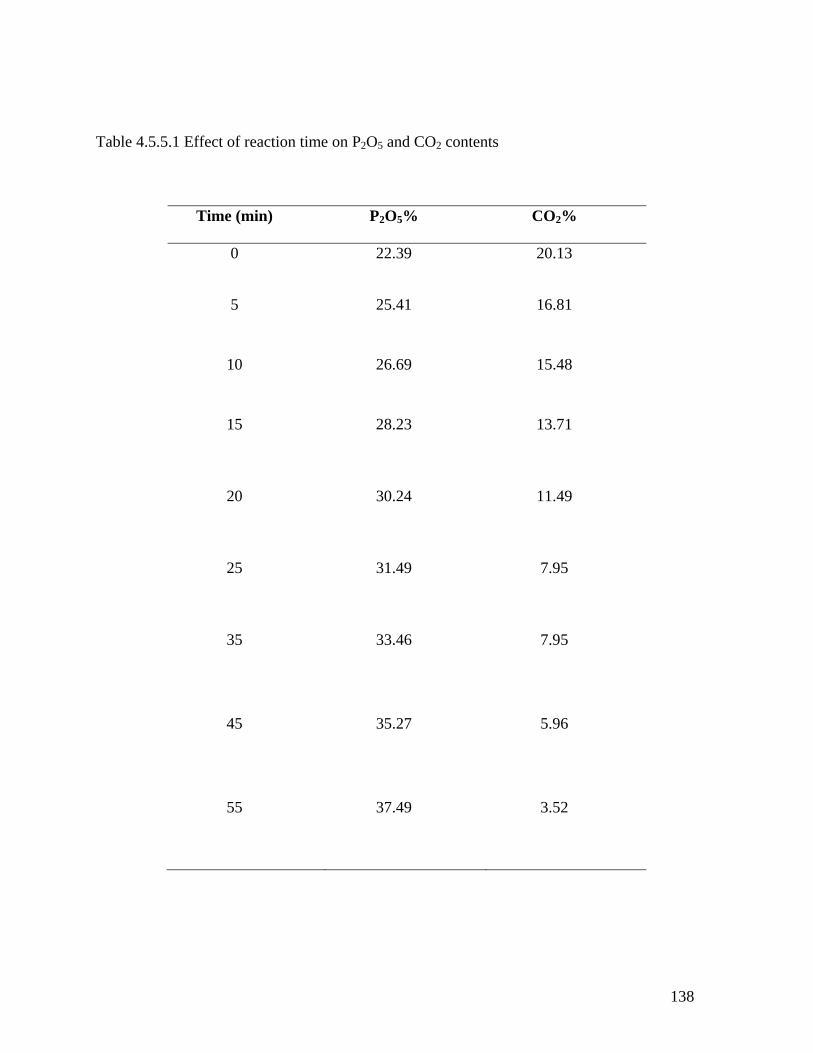
138
Table 4.5.5.1 Effect of reaction time on P2O5 and CO2 contents
Time (min) P2O5% CO2%
0 22.39 20.13
5 25.41 16.81
10 26.69 15.48
15 28.23 13.71
20 30.24 11.49
25 31.49 7.95
35 33.46 7.95
45 35.27 5.96
55 37.49 3.52

139
22
24
26
28
30
32
34
36
38
40
0 5 10 15 20 25 30 35 40 45 50 55 60
Reaction time(min) C=8%, L/S=7, D=0.1255mm, T=45oC, SS=350rpm
P2 O
5 %
Fig. 4.5.5.1 Effect of reaction time on P2O5 contents

140
3
5
7
9
11
13
15
17
19
21
0 5 10 15 20 25 30 35 40 45 50 55 60
Reaction time(min)
C=8% L/S=7, D=0.1255mm, T=45oC, SS=350rpm
CO
2 %
Fig. 4.5.5.2 Effect of reaction time on CO2 contents

141
4.6 Kinetic Analysis
4.6.1 Leaching with succinic acid
Fluid-solid heterogeneous reactions are of a great interest for industrial
applications regarding a number of chemical and hydrometallurgical processes. A successful
and efficient performance of chemical reactors for these processes is generally based on
kinetic data. In order to determine the kinetic parameters and rate-controlling step for the
selective leaching of calcareous material in the phosphate rock using succinic acid, the
experimental data may be analyzed according to the heterogeneous reaction models
[162,163]. According to the model, the reaction between a fluid and a solid can be written as:
F(fluid)+bS(solid)Products (4.6.1.1)
The rate of reaction between calcareous material particle and the dissolution agent
may be controlled by one of the following steps:
Diffusion through the fluid film, diffusion through the ash/product layer or the chemical
reaction at the surface of the particle involved.
Let the time of completion of the dissolution process be k*, the fractional
conversion of calcareous material be and at any time t the integrated equations for liquid-
solid heterogeneous reactions are:
For film diffusion control,
11*kt (4.6.1.2)
For chemical reaction control,
3/111* kt (4.6.1.3)
and for ash or product layer diffusion control,

142
)1(2131* 3/2 kt (4.6.1.4)
The value of *k will depend on various reaction conditions according to the
kinetic models. For example, according to the chemical reaction controlled model, eq.
(4.6.1.3) *k is:
AsoB CbKRk /* (4.6.1.5)
where *k stands for the time required for complete leaching (min), B is the
molar density of the solid reactant (mol m-3), oR is the size of the solid particle (m), b is the
stoichiometric coefficient of the solid reactant, sk is the surface reaction rate constant (m
min-1) and AC is the leaching agent concentration (mol m-3). To determine the kinetic
parameters and rate-controlling step for selective leaching of calcareous material in the
phosphate rock sample, the experimental data have been analyzed on the basis of liquid-solid
heterogeneous reaction models.
The validity of the experimental data into the integral rate has been tested by
statistical and graphical methods. The kinetic analysis results for the dissolution of
calcareous material has been found to be promising with a chemically controlled reaction and
the integral rate expression is determined to follow the following kinetic model:
kt 3/1)1(1 (4.6.1.6)
The eq. (4.6.1.6) has been found to give the best straight lines in comparison with
other kinetic models tested. At various reaction temperatures, using a known size range of the
rock particles and the acid concentration with a specific liquid/solid ratio, the results have
been plotted between the tvsX B .)1(13/1
as shown in Figs. 4.6.1.1-4.6.1.5. Where XB=,
is the fraction of the reacted calcareous material in the rock sample.

143
0
0.01
0.02
0.03
0.04
0.05
0.06
0.07
0.08
0 20 40 60
Leaching reaction time (min)
1-(1
-XB)1/
3
Fig. 4.6.1.1 Time versus 1-(1-XB )1/3 at 40oC

144
0
0.02
0.04
0.06
0.08
0.1
0.12
0.14
0.16
0.18
0 20 40 60
Leaching reaction time (min)
1-(1
-XB)1/
3
Fig. 4.6.1.2 Time versus 1-(1-XB) 1/3 at 50 oC

145
0
0.05
0.1
0.15
0.2
0.25
0.3
0.35
0.4
0 20 40 60
Leaching reaction time (min)
1-(1
-XB)1/
3
Fig. 4.6.1.3 Time versus 1-(1-XB) 1/3 at 60oC

146
0
0.1
0.2
0.3
0.4
0.5
0.6
0.7
0.8
0 20 40 60
Leaching reaction time (min)
1-(1
-XB)1/
3
Fig. 4.6.1.4 Time versus 1-(1-XB) 1/3 at 70oC

147
0
0.1
0.2
0.3
0.4
0.5
0.6
0.7
0.8
0.9
1
0 20 40 60
Leaching reaction time (min)
1-(1
-XB)1/
3
Fig. 4.6.1.5 Time versus 1-(1-XB) 1/3 at 80oC

148
The values of the apparent rate constants, k, have been determined from the slopes
of the straight lines in Figs 4.6.1.1-4.6.1.5. Using the Arrhenius law,
RTEaekk / (4.6.1.7)
A plot of ln k versus 1/T should result in a straight line with a slope of -Ea/RT and
an intercept of ln k* if the experimental data are fitted well by the Arrhenius equation. For
each value of the reaction temperature, the data have been plotted between ln k and 1/T as
shown in Table 4.6.1.1 and Fig. 4.6.1.6. From Fig. 4.6.1.6, the following values have been
calculated:
Ea = 64.92 kJ mol-1
k=1.47106 s-1

149
Table 4.6.1.1 The values of ln k and 1/T.
1/T (K) ln k
0.003195 -10.8198
0.003096 -9.97248
0.003 -9.1303
0.002915 -8.4844
0.002833 -8.04199

150
-12
-11
-10
-9
-8
-7
-6
0.0028 0.0029 0.003 0.0031 0.0032 0.0033
1/T (K)
ln k
(s-1
)
Fig. 4.6.1.6 Arrhenius plot of ln k vs 1/T

151
The value of activation energy shows that the process is a chemically controlled
reaction and is consistent with the values found in the similar research work of liquid-solid
reaction systems [148,164,150]. The activation energy indicates a relatively low value at
higher temperatures, a situation that may be attributed to the mixed chemically-diffusion
controlled behavior of the leaching process. However, at lower temperatures the leaching
mechanism of the low-grade phosphate rock appears to be chemically controlled process,
which agrees with the similar findings reported in literature [165].
The value of activation energy in the dissolution process has been characterized to
determine the controlling step. The activation energy of a diffusion controlled process has
been typically found from 4-12 kJ mol-1, while for a chemically controlled process it has
been reported usually greater than 40 kJmol-1 [155]. The experimental results show that the
dissolution of calcareous material in low grade phosphate rock with succinic acid is
controlled by chemical reaction and thus, Eq. (4.6.1.6) may be written as:
teX RTB
/92.6463/1 1047.1)1(1 (4.6.1.8)
To assess the applicability of the suggested kinetic model, the theoretical values
of the conversion (Xcalc) have been calculated using Eq. (4.6.1.8). To test agreement between
the experimental conversion and the values calculated from the suggested empirical equation,
the graph of Xexpl versus Xcalc has been plotted as shown in Fig. 4.6.1.7. It is has been
observed that the agreement between the experimental and calculated values is good as the
data in the scatter diagram show a positive trend to cluster around the regression line, which
indicates the existence of a good relationship between the variables.

152
0
0.1
0.2
0.3
0.4
0.5
0.6
0.7
0.8
0.9
1
0 0.2 0.4 0.6 0.8 1
Xexp
Xca
l
Fig. 4.6.1.7 Agreement between experimental and calculated conversion values
153
4.6.2 Leaching with lactic acid
To determine the values of kinetic parameters and rate-controlling step for
selective leaching of calcareous material in the phosphate rock sample, the experimental data
have been analyzed on the basis of fluid-solid heterogeneous reaction models as given in the
case of succinic acid. Using statistical and graphical methods, the validity of the
experimental data into the integral rate has been tested. The analysis results for the leaching
of calcareous material with lactic acid have been found to be consistent with a chemically
controlled reaction as well. Thus, the integral rate expression has been determined to follow
the following kinetic model:
kt 3/1)1(1 (4.6.1.6)
After determine the values of the reaction rate constant, k, the Arrhenius equation
may be used to calculate the activation energy and thus the kinetic model:
tek RTEa /3/1)1(1 (4.6.2.1)
To explain the selective dissolution of calcareous material in the rock, the above
kinetic model, Eq. 4.6.2.1 is not expected to hold good for different parameter conditions as
its applicability is limited by the specific values (acid concentration, liquid/solid ratio and
particle size) used in the leaching process. The reaction parameters can affect the rate of
dissolution of calcareous material. These parameters may be included into the above-
mentioned model. Using succinic acid, these parameters have not been included and the
selective leaching kinetic model is based on the Arrhenius equation only. However, to see the
effect of different parametric conditions on the kinetic model, a semi empirical model has
been developed by statistical multiple regression. To establish this model representing the
154
selective leaching process, it has been accepted that the reaction rate constant k may be given
as follows:
RTEcbao
aeDSLCkk /)/( (4.6.2.2)
Combining Eqs. (4.6.2.1) and (4.6.2.2) it follows that:
teDSLCk RTEcbao
a /3/1 )/()1(1 (4.6.2.3)
Where is the conversion fraction, C the acid concentration, L/S the liquid/solid
ratio, D the particle size, R, ko, a, b, c constants, T the reaction temperature, Ea the activation
energy, t the reaction time for the leaching process.
The stirring speed has been omitted from multiple regression analysis as the
results in Table 4.6.2.1 and Fig. 4.6.2.1 show that the leaching of calcareous material in the
rock increases slowly with an increase up to 350 rpm. Further increase in the stirring rate
does not show a considerable effect on the dissolution of calcareous material. This means
that the diffusion through the fluid film cannot be considered as a rate-controlling step.

155
Table 4.6.2.1 Effect of rpm on the conversion
rpm Conversion ()
200 0.47
250 0.54
300 0.62
350 0.67
400 0.68
450 0.69
500 0.70

156
0.4
0.45
0.5
0.55
0.6
0.65
0.7
0.75
200 280 360 440 520
rpm C=8%, L/S=7:1 D=.1255mm, T-45oC
aexp
Fig. 4.6.2.1 Effect of rpm on the conversion at specific reaction conditions

157
For statistical calculations by simultaneous multiple regression a computer
program has been used giving the following values for the constants:
ko=19.1
a=1.753
b=1.627
c= -0.737
Ea=42964.62 J mol-1
Such a value of activation energy, for the selective leaching of calcareous
material, shows that the process is a chemically controlled reaction, which is consistent with
the values found in the fluid-solid reaction systems [136,148,150]. The results show a change
in the leaching phenomena of calcareous material after about 318 K, a situation that may be
attributed to the mixed chemically-diffusion controlled behaviour of the reaction process.
However, at relatively low temperatures the selective dissolution of calcareous material
shows to be chemically controlled process, which is consistent with the similar findings
given in the literature [165]. Depending on the type and nature of the solid materials as well
as strength of the leaching agents, a number of calcite dissolution mechanism studies are
reported in literature [143-145,166-172]. At moderate pH values, most of the studies have
shown that the overall rate of leaching is controlled by a chemical change.
For the selective leaching of calcareous material in the rock with acetic acid
[144], the investigations show that, in the pH range from 2.37 to 4, a chemical change has
been found to be the rate-controlling step for the overall process. Regarding the strength of
the acid used in the selective dissolution, the findings of the present work are also supported

158
by the similar study [145], which claims that the calcareous material dissolution above about
pH 3.7 has been significantly controlled by the kinetics of the surface reaction.
On the other hand, the kinetic analysis regarding the production rate of calcite
leaching in the leach solution shows that the diffusion-controlled mechanism is not the
principal mechanism in the dissolution process. The mechanism of calcite dissolution for the
rate-determining slowest step may need further investigations; however, the results indicate
that the rate-controlling step of the overall process of the heterogeneous reaction system is a
chemical change. Thus, using the values determined by simultaneous multiple regression
analysis the Eq. (4.6.2.3) may be given as:
teDSLC RT/62.42954737.0627.1753.13/1 )/(1.19)1(1 (4.6.2.4)
To test the agreement between the experimental conversion and the values
calculated from the semi empirical model, the graph of exp versus cal has been plotted as
shown in Fig. 4.6.2.2.

159
0
0.2
0.4
0.6
0.8
1
0 0.1 0.2 0.3 0.4 0.5 0.6 0.7 0.8 0.9 1
exp
ca
l
Fig. 4.6.2.2 Agreement between experimental and calculated conversion values

160
The results show that the agreement between the experimental and calculated
values is very good with a correlation coefficient of 0.983 and standard deviation of
0.04156. On the other hand, the data in the scatter diagram indicates a positive trend to
cluster around the regression line, a situation that can be attributed to the existence of a good
relationship between the variables involved. The value of the standard deviation of regression
or standard error of estimate of cal on exp indicates that the degree of scatter of the observed
values about the regression line is not higher. By the statistical analysis with 157 numbers of
experimental data, a relative mean square of errors of 0.1296 has been calculated by Eq.
4.6.2.5:
2/1
12
2exp
)(
1
N
i cal
cal
NER
(4.6.2.5)
The value of relative mean square of errors shows that, in probabilistic models,
such a value of the random errors is not significant. It is interesting to test the applicability of
the semi-empirical model by using the various adjustable parameter conditions for the
dissolution of calcite in low-grade phosphate rock. For 70% dissolution of calcareous
material in the rock, using the various parameter values in the semi-empirical model, the
reaction times have been calculated as shown in Table 4.6.2.2.
The comparison between case 1 and 2 as shown in Table 4.6.2.2 shows that when
the acid concentration decreases from 8 to 7%, the reaction period increases from 46.94 to
59.32 min. Although the increase in the reaction period is about 1.26-fold, however, it shows
that 26.4% more amount of the material can be handled. Regarding the cases 1 and 3 in Table
4.6.2.2, when the acid concentration decreases from 9 to 8%, the reaction period increases
161
only about 8.76 min, which indicates a relatively poor efficiency of the dissolution process as
compared to the above case.
The comparison between case 1 and 4 as shown in Table 4.6.2.2, when the liquid-
solid ratio increases from 6:1 to 7:1, the decrease in the reaction time has been found to be
about 13.38 min. While, regarding the cases 1 and 5 in Table 4.6.2.2, when the liquid-solid
ratio increases from 7:1 to 8:1, the reaction time decreases only about 9.17 min, which shows
that the value of liquid-solid ratio of 7:1 is more beneficial than the other liquid-solid values
used in the leaching process.

162
Table 4.6.2.2 The values of the selected parameters and the reaction periods calculated from
Eq. (4.6.2.4) for these parameters.
Case
Studied
Conc.
(% v/v)
L/S ratio
(cm3 g-1)
Dia.
(mm)
Tem.
(K)
Dissolution
(%)
Time
(min)
1 8 7 0.1255 318 70 46.94
2 7 7 0.1255 318 70 59.32
3 9 7 0.1255 318 70 38.18
4 8 6 0.1255 318 70 60.32
5 8 8 0.1255 318 70 37.77
6 7 8 0.1255 318 70 47.74
7 8 7 0.1775 318 70 60.61
8 8 7 0.1255 328 70 28.61
9 8 7 0.1255 308 70 79.55

163
On the other hand, regarding the cases 1 and 6 in Table 4.6.2.2, the interchange of
concentration and liquid-solid ratio does not indicates any considerable effect on the reaction
time, a situation that shows that these two parameters equally compete for the selective
leaching of calcareous material in the rock. For the cases 1 and 7 in Table 4.6.2.2, when the
particle size decreases from 0.1775 to 0.1255 mm, the reaction period also decreases from
60.61 to 46.94 min, a situation that may be attributed to the fact that the size reduction causes
an easier liberation of the calcareous material from the apatite matrix.
Comparing the two cases 1 and 8 in Table 4.6.2.2, when the reaction temperature
increases from 318 to 328 K, the reaction period decreases from 46.94 to 28.61 min with an
increase in the amount of handled material about 39%. On the other hand, for the cases 1 and
9 in Table 4.6.2.2 when the reaction temperature increases from 308 to 318 K, the reaction
time decreases from 79.55 to 46.94 min with an increase in the amount of handled material
about 41%. The comparison between these two cases shows that to study with 318 K reaction
temperature is more beneficial than the other temperatures. As a result, 8% v/v acid
concentration, 7:1 liquid-solid ratio cm3 g-1, 0.1255 mm particle size, 350 min-1 stirring speed
and 318 K reaction temperature may be recommended as the parameter values, because these
values show the optimum selective dissolution rate (case 1).
To increase the rate of dissolution of calcareous material in the rock using lactic
acid, the results show that the reaction period may be decreased, by increasing the acid
concentration and/or liquid solid ratio as long as the considerable leaching of phosphate
element is not appeared in the leach slurry. Further reduction in particle size may be expected
to improve the efficiency of the dissolution process depending on the type and nature of low-
grade calcareous phosphate rock. Based on the required degree of selective dissolution, the

164
study may be extended to a pilot scale work to beneficiate low-grade calcareous phosphate
rock. Depending on the type and nature of phosphate rock, the design parameters may need
some further investigations at a commercial scale; however, the method may be of value to
others confronted with the need to use typical indigenous phosphate rocks of various
countries in the world.

165
CHAPTER 5
5.1 RECOVERY OF SPENT ACID AND ECONOMY OF PROCESS
The economy of the leaching process may depend on the price of leaching agent
and the cost of its recovery. Succinic acid may be recovered from the calcium succinate
solution by a number of routs as reported in literature [141].
It is estimated that succinic acid did not lost during performing the practical as
long as the succinate solution is recycled to the leaching process for dilution of fresh succinic
acid. However, after the leaching process succinic acid can be recovered from the spent
liquid using any strong acid, providing that an insoluble salt is formed in order to separate the
recovered succinic acid by simple methods such as filtration. For the recovery of succinic
acid, some methods may also be used such as ion exchange, hydrofluoric acid, fluorosilicic
acid.
5.2 Routes for the Acid Recovery
A number of routs, which may be applied to recover the spent acid, are discussed below:
(a) Use of Ion Exchange Resins
Succinic acid from the succinate solution may be recovered by using ion
exchange methods. Treatment of the bed to recover succinic acid from succinate solution
may be written as:
Ca(C4H4O4)+2HRC4H6O4+CaR2 (5.2.1)
Under suitable conditions of the bed, an ion exchange process may recover more than 95%
succinic acid from the succinate solution.

166
Hydrochloric acid may be used to regenerate the bed as shown in equation (5.2.2):
CaR2+2HClCaCl
2+2HR (5.2.2)
(b) Using Hydrofluoric Acid
Succinic acid may be regenerated by another route using succinate solution with
the hydrofluoric acid produced during the manufacture of phosphoric acid or super
phosphates from fluoroapatite.
Ca(C4H4O4)+2HFC4H6O4+CaF2 (5.2.3)
(c) Use of Fluorosilicic Acid
The fluorosilicic acid separated from the phosphoric acid plant or its fresh stock
may be used to treat the succinate solution, which produces succinic acid and insoluble
calcium fluorosilicate salt.
Ca(C4H4O4)+H2SiF6C4H6O4+CaSiF
6 (5.2.4)
Calcium fluorosilicate salt is insoluble in cold water and thus the spent acid may be separated
for recycle.
(d) Use of Sulphuric Acid
Succinic acid may be recovered by the reaction of calcium succinate solution with
any strong acid, provided that an insoluble salt is formed in order to separate the recovered
succinic acid by filtration. The use of sulphuric acid has been found to be the most attractive
method for recovering succinic acid from calcium succinate solution. It potentially converts
the calcium succinate into succinic acid and calcium sulphate. The reaction between
sulphuric acid and calcium succinate can be written as:
Ca(C4H4O4)+H2SO
4+2H
2O+C4H6O4 +CaSO
4.2H
2O (5.2.5)

167
Calcium sulphate produced during the reaction can be separated by filtration.
Stoichiometrically, 98 parts of H2SO4 are needed per 44 parts of CO2 removed from the
sample. The spent organic acid may be regenerated for further use and recycling process.
However, the regeneration needs further studies and details regarding process and designing
parameters. Therefore its extended study is suggested for future. Schematic diagram
suggested for the recovery of the spent acid has been shown in Fig. 5.2.1.

168
Fig. 5.2.1 Schematic diagram suggested for the recovery of spent acid.

169
5.3 Economy of the Process
The economy of the leaching process depends on a number of parameters such as
availability of the rock, demand and application of the product, price of leaching agent and
the cost of its recovery from the spent liquor. Succinic acid may be recovered from the spent
liquor, for example, using sulphuric acid as described in the previous section. Loss of
succinic acid in a closed circuit plant may be expected low. The recovered succinic acid as
well as the washing solution may be recycled to the leaching process decreasing the amount
of the fresh acid. This means that a small amount of the fresh acid may be needed to make-up
the leaching agent concentration in the process.
The suggested leaching process for the beneficiation of low-grade phosphate rock
may eliminate/reduce some of the problems, which are faced during manufacture of
phosphoric acid, a number of phosphate rock based chemicals and phosphate fertilizers. The
dilute solution of the acid is expected to have minimal corrosion effects on the equipments
along with the selective leaching of calcareous material without any considerable amount of
dissolution of phosphate element itself. To increase the overall economy of the suggested
process, it can directly be attached with an acidulation plant in order to eliminate/reduce the
downstream processing steps like drying, handling and packing of the product after the
leaching and beneficiation of the rock.
The filtrate solution (spent liquor) containing succinate salt may be evaporated to
produce crystalline calcium succinate. The calcium succinate may be used directly for other
industrial purposes. Another alternative is to market the calcium succinate and CO2 gas
produced during the leaching process. The by-products, CO2 and calcium sulphate may be
used or sold to other industries to meet the cost of commercial succinic acid and its recovery

170
by sulphuric acid. It is expected that the marketing of the CO2 gas product for other
industries may pay back some of the operating costs of the leaching process.

171
Conclusions
The analysis of the sample indicates that loss on ignition (LOI), insoluble residue
(AIR), P2O5 and CO2 contents depend on the particle size as well as the type and nature of
calcareous phosphate rock. The dissolution results show that succinic acid can be used as
leaching agent in order to eliminate/reduce the calcareous material in low-grade phosphate
rock as it improves the degree of beneficiation up to marketable and industrially acceptable
level. Using -0.175+0.125 mm size fraction, an acid concentration of 8% with liquid/solid
ratio of 7:1 is found to be optimum for the selective dissolution of calcareous material in the
rock.
Analysis of the kinetic data by various kinetic models shows a chemically
controlled process with mixed chemical-diffusion control relatively at higher temperatures.
The activation energy for the leaching process has been found to be 64.92 kJ mol-l, which
agrees with a chemically controlled reaction. For the selective dissolution of calcareous
material in the rock, the applicability of the suggested kinetic model, i.e.,
te RT/92.6463/1 1047.1)1(1 has been tested by the agreement between the experimental
and calculated conversion values. The analysis results show that the agreement between
experimental and calculated values of the conversion is good, however, it has been found that
succinic acid is not a successful leaching agent below about 37 oC due to its limited
solubility.

172
Lactic acid can also be used to selectively leach the calcareous material present in
the phosphate rock as it improves the P2O5 content of the sample making it viable as a feed to
an acidulation plant. For the leaching rate of calcareous material, the process parameters such
as acid concentration, liquid-solid ratio, particle size and reaction temperature have been
optimized using the stirring speed of 350 rpm.
Analysis of the kinetic data by different kinetic models shows that the selective
dissolution of calcareous material in the phosphate rock with lactic acid is also a chemically
controlled process. The value of activation energy has been found to be 42.96 kJmol-1, which
is consistent with a chemically controlled reaction. Regarding the values of activation energy,
the comparison between succinic and lactic acid shows that the rate of dissolution of
calcareous material is relatively higher with lactic acid, which can be expected as the lactic
acid is stronger than the succinic acid.
The applicability of the suggested semi-empirical kinetic model, i.e.,
teDSLC RT/62.42954737.0627.1753.13/1 )/(1.19)1(1 has been tested and the results
show that the calcareous fraction reacted can be estimated with a relative mean square of
errors of 0.1296. The agreement between experimental and calculated values of the
conversion also indicates a good relationship between the variables involved. The analysis
results show that the parameter values for the optimum selective leaching rate are C = 8%
v/v, L/S = 7 cm3g-1, T = 318 K, SS = 350 min-1 and D = 0.1255 mm.

173
The economy of the leaching process mainly depends on the price of the leaching
agent and the cost of its recovery. Both of the leaching agents (succinic and lactic acid) may
be recovered from their soluble salts (calcium succinate and calcium lactate) solutions by a
number of routs. However, sulphuric acid is found potentially most important for recovering
the spent acid from the leach slurry.
Regeneration of organic leaching agents is crucial for further application and
recycling process. Therefore it is suggested to extend study in the future, regarding
regeneration process conditions as well as the process design parameters.

174
References
[1]. Lawver JE Mcclintock WO and Snow RE. Beneficiation of Phosphate Rock. A State
of the Art Review. Miner. Sci. Eng. 10: pp. 278-94 (1978).
[2]. De Voto RH and Stevens DN. Uraniferrous Phosphate Resources and Technology and
Economics of Uranium Recovery from Phosphate Resources. U S and Free World Earth
Sciences Inc. V 2 (1979).
[3]. Kelly EG and Spottisood DJ. Introduction to Mineral Processing. New York, John Wiley
(1982).
[4]. Lawver JE Wiegel RL Snow RE and Hwang CL. Phosphate Reserves Enhancement by
Beneficiation. J. Min. Cong. 68 (12): pp. 27-31 (1982).
[5]. McHardy JC. Future Trends in Florida Phosphate Mining Beneficiation and Tailings
Disposal. Mini. Eng. pp. 1196-1200 (1983).
[6]. Hollick CT and Wright R. Recent Trends in Phosphate Mineral Beneficiation. Trans.
IMM Section A 95: pp. 150-154 (1986).
[7]. McCoubrey JC. Industrial Phosphates: Technology and Trends Ind. Eng. Chem. Res.
Section A 95: pp. 158-161 (1986).
[8]. Notholt AJG and Highley DE. World Phosphate Resources with Particular Reference to
Potential Low-Grade Ores. Ind. Eng. Chem. Res. Section A 95: pp. 125-132 (1986).
[9]. Lavers W. Phosphate Rock. Regional Supply and Changing Pattern of World Trade. Ind.
Eng. Chem. Res. Section A 95: pp. 119-125 (1986).
[10]. Rao TC Rao LS and Rao GM. Beneficiation of Indian Low Grade Phosphate Deposits-
Problems and Prospects. Trans. Indian Inst. Met. 45 (3): pp. 195-205 (1992).

175
[11]. Zafar ZI. The Status of Phosphstic Industry in Pakistan. Engg. Horizons, 7: PP. 26-35
(1993).
[12]. Zafar IZ Anwar MM and Pritchard DW. Innovations in Beneficiation Technology for
Low Grade Phosphate Rocks. J. Nutrient Cycling in Agroecosystems 46(2): pp. 135-151
(1996).
[13]. Anon. Removing Impurities to improve Phosphoric Acid Quality: Rock Beneficiation.
Phosphorus and Potassium No. 146: pp. 27-31 (1986).
[14]. Robinson N. Fisons. Experience on the Effect of Phosphate Rock Impurities on the
Phosphoric Acid Plant Performance. ISMA. (IFA). Orlando, (1978).
[15]. Al Fariss TF Ozbelge HO and El-Shall HS. On the Phosphate Rock Beneficiation for
the Production of Phosphoric Acid in Saudi Arabia, J. King Saud Univ. Eng. Sci. 4(1): pp.
13-32 (1992).
[16]. Lodha TR Sinha NK and Srivastava AC. Chemic. Age of India, 35: P.15 (1984).
[17]. Urano K and Tachikawa. Process Development for Removal and Recovery of
Phosphorous from Wastewater by a New Adsorbent. Ind. Eng. Chem. Res. 31: pp. 1510-
1513 (1992).
[18]. US Bureau of Mines. The Florida Phosphate Slimes Problem. A Review and a
Bibliography IC. 8668. p. 41 (1975).
[19]. Becker P. Phosphates and Phosphoric Acid. Marcel Dekker Inc. p. 585 (1983).
[20]. Stowasser WS. Phosphate Rock Mineral Facts and Problems. Edition BuMines B 675
pp. 579-594 (1985).
[21]. Somasundaran P. On the Problem of Separation of Calcite from Calcareous Apatite In
11th Int. Miner. Proc. Cong. Cagliari, 2: pp. 155-156 (1975).

176
[22]. Hanna HS and Somasundaran P. In Flotation of Salt Type Minerals. MC Fuestenau (ed)
AM Gandin Memorial Vol. AIME. pp. 197-272 New York, (1976).
[23]. Lawver JE Weigel RL Snow RE and Huang CL. Beneficiation of Dolomitic Florida
Phosphate Reserves. In 14th Int. Miner. Proc. Cong. Session iv Flotation Paper iv-20 (1982).
[24]. Al-Fariss TF Ozbelge HO and Abdulrazik AM. Flotation of a Carbonate Rich
Sedimentary Phosphate Rock. Fert. Res. 29: PP.203-208 (1991).
[25]. Hignett TP Doll EC livingston OH and Raistrick B. New Developments in Phosphate
Fertilizer Technology Proceedings, Carpentier LJ (ed) Sci. Pule. Co. Elsevier p. 273 (1977).
[26]. Mew MC. World Survey of Phosphate Deposits. 4th edn. P. 2. The British Sulfur Corp.
Ltd. London, (1980).
[27]. Baudet G. The Processing of Phosphate Ores, Chron. Res. Min. Special issue on
Phosphates 67 (1988).
[28]. Hignett TP. Production of Wet-Process Phosphoric Acid. Proc. Int. Cong. Phosphorus
Compounds 2nd pp. 401-429 (1980).
[29]. Smani SM. Comportment Physicochimiwue Diffrential des. Apatites et. De La. Calcite
Ph. D. Thesis Nancy (1973).
[30]. Deshpande SP and Raju KS. Process Mineralogy of Low Grade Samples of Indian
Rock Phosphate. Process Mineral xi. Proc. Pp. 133-139 (1991).
[31]. Kiukkola K. Selective Flotation of Apatite from Low Grade Phosphorous Ore
Containing Calcite Dolomite and Phlogopite. 2nd .Int. Cong. on Phosphorous Compounds
Proc. Boston, MA. April pp. 219-229. (1980).
[32]. Anon. Warren Springs Laboratory Examines. Two Phosphate Rock Beneficiation
Processes. Phosphorous and Potassium No. 142 pp. 35-37 (1986).

177
[33]. Bushell CHG and Hirsch HE. Phosphate Flotation. US Patent No. 3, 462, 016 and No. 3
462 017 (1969).
[34]. Ratobylskaya LD et al. Development and Indust. Introduction of New Concentration
Processes for Phosphorites of Complex Mineral Composition. Proceedings of the 11th Int.
Min. Proc. Cong. Seminar on Beneficiation of Lean Phosphates with Carbonate Gangue
Sardinia, April pp. 17-39 (1975).
[35]. Smani MS et al. Beneficiation of Sedimentary Moroccan Phosphate Ores. AIME Trans.
258: PP. 168-182 (1975).
[36]. Rule AR et al. Flotation of Carbonate Minerals from Unaltered Phosphate Ores of
Phosphoria Formation. US. Bur. Mines 7864 p. 18 (1974).
[37]. Rule AR and Daellenbach CB. Beneficiation of Complex Phosphate Ores Containing
Carbonate and Silica Gangue. 15th. Int. Min. Proc. Cong. (St Etienne: Edition GEDIM)
Cannes 3: PP. 380-9 (1985).
[38]. Hsieh SS and Lehr JR. Development of Differential Desorption-Reflotation Process for
Beneficiation of North Carolina, Calcite Phosphate Pebble. Ind. Eng. Chem. Proc. Des. Dev.
24: PP. 937-941 (1985a).
[39]. Hsieh SS and Lehr JR. Beneficiation of Dolomitic Idaho Phosphate Rock by TVA
Diphosphoric Acid Depressant Proce. Min. & Met. Proc. pp. 10-13 (1985b).
[40]. Snow RE. Flotation of Phosphate Ores Containing Dolomite. US Patent No. 4 Dec.
364,824 (1982).
[41]. Lawver JE et al. Method of Beneficiating Phosphate Ores Containing Dolomite. US
Patent No. 4 Feb., 372 843 (1983).

178
[42]. Lawver JE et al. Method of Beneficiating Phosphate Ores. US Patent Feb. 4 No. 189 P.
103 (1980).
[43]. Snow RE. Beneficiation of Phosphate Ores. US Patent Mar. 4 No. 144, P. 969 (1979).
[44]. Moudgil BM and Chanchani R. Selective Flotation of Dolomite from Francolite Using
Two-Stage Conditioning. Min. and Met. Proc. pp. 19-25 (1985a).
[45]. Zhong K Vasudevan TV and Somasundaran P. Beneficiation of a High Dolomitic
Phosphate Ore: A Bench Scale Optimization Study. Miner. Eng. 4: PP. 563-571 (1991).
[46]. Moudgil BM and Chanchani R. Flotation of Apatite and Dolomite Using Sodium
Oleate as Collector. Miner. and Metall. Proc. 2(1): P. 13 (1985b).
[47]. Ince DE. Effect of Sodium Chloride on the Selective Flotation of Dolomite from
Apatite. Ph.D. Thesis University of Florida, (1987).
[48]. Crago A. Process of Concentrating Phosphate Minerals. US. Patent. No.2, 293 P. 640
(1940).
[49]. Moudgil BM Ince DE Vasudevan TV and Sober D. Bench-Scale Optimization of the
Two-Stage Conditioning Process for Apatite Dolomite Separation. Miner. and Metall. Proc.
7(1): P. 53 (1990).
[50]. Moudgil BM. Separation of Dolomite from the South Florida Phosphate Rock. Vol III
Florida, Institute of Phosphate Res. Pub. # 02 pp. 023-066 (1988a).
[51]. Moudgil BM and Vasudevan TV. Beneficiation of Phosphate Ores Containing
Carbonate and Silica Gangue. Min. & Metall. Proc. 5(3): pp. 120-124 (1988b).
[52]. Anazia I and Hanna J. New Flotation Approach for Carbonate Phosphate Separation.
Min. & Metall. Proc. 4(4): pp. 196-202 (1987).

179
[53]. Hanna J and Anazia I. Carbonate/Phosphate Flotation Separation by MRI. No-
Conditioning Process: Research Progress Report Submitted to Florida Institute of Phosphate
Research (1988).
[54]. US Bureau of Mines. Minerals Yearbook. Vol. 1 US. Government Printing Office
Washington, D. C. (1977).
[55]. Hollingsworth CA. The Flotaire Flotation Cell: Paper Presented at AIME. Annual
Meeting Feb. Chicago, IL. (1981).
[56]. Tyurnikova VI and Naumov NF. Improving the Effectiveness of Flotation. England,
Technicopy Ltd. Stonehouse (1981).
[57]. Young P. Flotation Machines. Mining Maga. Jan. pp. 35-59 (1982).
[58]. Dobby GS and Finch JA. Mixing Characteristics of Industrial Flotation Columns.
Chem. Eng. Sci. 40(7): pp. 1061-1068 (1985).
[59]. Yianatos JB et al. Apparent Hindered Settling in a Gas-Liquid-Solid Counter current
Column. Int. Min. J. Proc. 18: pp. 155-165 (1986).
[60]. Dobby GS and Finch JA. Flotation Column Scale-up and Modelling. CIM. Bulletin 7:
pp. 89-96 (1986).
[61]. Lane GS and Dunne RC. Column Flotation An Australian Perspective. Proc. of
Exploration Min. and Processing Conf. 81093 (1987).
[62]. Jones GH. Wet Magnetic Separator for Feebly Magnetic Minerals. I. Description and
Theory in Int. Min. Proc. Cong. London, IMM. pp. 717-32 (1960).
[63]. Parsonage P. Extension of Range and Sensitivity of Laboratory Isodynamic netic.
Separator to Fine Sizes. Trans. Instn. Min. Metall. Section C (1979).

180
[64]. Parsonage P Watson D and Hickey TJ. Surface Texture Slime Coating nd. lotation of
Some Industrial Minerals. In Preprints 14th Int. Min. Proc. Cong. cession v. Toronto, Pap. 5
p. 522 (1982).
[65]. Parsonage P. Selective Magnetic Coating for Mineral Separation. Trans. Instn. Min.
Metall. Section C 93: pp. 37-44 (1984).
[66]. Parsonage P et al. Depressant Function in Flotation of Calcite Apatite and Dolomite. In
Reagents in the Minerals Industry Jones MJ. and Oblatt R (eds) London, IMM. pp. 33-40 88:
pp. 182-6 (1984).
[67]. Parsonage P. Treatment of Carbonate-Phosphate Rock by Selective Magnetic Coating.
Trans. IMM. Section A 95: pp. 154-158 (1986).
[68]. Anon. Beneficiation Study of Saudi Arabia Phosphate Ore. US Bureau of Mines Open-
File Report Albomy DGMR. (1968).
[69]. Zafar ZI Anwar MM and Pritchard DW. Optimization of Thermal Beneficiation of a
Low Grade Dolomitic Phosphate Rock. Int. J. Min. Proc. 43: pp. 123-131 (1995).
[70]. Good PC. Beneficiation of Unweathered Indian Calcareous Phosphate Rock by
Calcination and Hydration. US Bureau of Mines Report No 8154 Washington, (1976).
[71]. White JC Goff TN and Good PC. Continuous-Circuit Preparation of Phosphoric Acid
from Florida Phosphate Matrix. BuMines Rl. 8326 p. 22 (1978).
[72]. Issahary D. Prediction of the Phosphorus Pentoxide Content in the Product as a
Function of Raw Material Composition in Phosphate Beneficiation by Calcination. Ana.
Chem. Acta. 138: pp. 183-190 (1982).

181
[73]. Wu LLR and Shibin Y. Concentration of Dolomitic Phosphate Rock and Recovery of
Iodine at Wengfu Phosphorous Mine. 15th Int. Min. Proc. Cong. Cannes 3: pp. 400-411
(1985).
[74]. El-Jalead IS Abouzeid AZM and El-Sinbawy HA. Powder Technology 26: p. 187
(1980).
[75]. Pereira SCC Cekinski E and Valarelli TV. Process for Production of Calcined
Phosphate in a Grate Furnace. Fert. Res. 16: pp. 169-177 (1988).
[76]. Pyldme M Utsal K Aruvali J Arnold M and Paulik F. Investigation of Phase
Transformation in Thermal Processing of Phosphate Rock. J. Ther. Anal. 36 (1990).
[77]. Ray H and Robert JP. Fluidized Bed Processing of Phosphate Rock. Miner. Proc. 10:
pp. 13-17 (1969).
[78]. Grace JR. Modelling and Simulation of Two Phase Fluidized Bed Reactors. NATO.
ASI. Se.r. E. Chem. React. Design Technol. 110: pp. 245-289 (1986).
[79]. Doraiswamy LK and Kulkarni BD. Transport Process in Fluidized Beds. Wiley Eastern
Ltd. New Delhi, (1987).
[80]. Angelo AI and Nabnoulni YI. Elektrostaticheskie Separatori Svobodnovo Padenia, p.
160 (1970).
[81]. Lawver JE. General Principles and Types of Electrostatic Separator. SME. Min.
Processing Handbook. Weiss NL. (ed) 6: pp. 6-10 (1985).
[82]. Alfano G Carbini P Ciccu R Ghiani M Peretti R and Zucca A. Progress in Triboelectric
Separation of Minerals. 16th Int. Min. Proc. Cong. Forssberg KSE (ed) Stockholm, pp. 833-
844 (1988).

182
[83]. Alfano G Carbini P Ciccu R Ghiani M Peretti R and Zucca A. La. Separation Tribo-
Electrique des. Minerais Phosphates. Indust. Mineral pp. 137-143 (1989).
[84]. Ciccu R Peretti R Serci A and Zucca A. Triboelectric Charging of Coal and
Accompanying Gangue Particles. Proc. 4th ICESP. Ruiniam, Li. (ed) pp. 744-755 (1990).
[85]. Ciccu R Ghiani M Peretti R Satta F and Zucca A. Electrostatic Upgrading of Phosphate
Ores. 18th Int. Min. Proc. Proced. Sydney, pp. 433-438 (1993).
[86]. Kelly DP. Ann. Rev. Microbiol. 25: p. 177 (1971).
[87]. Brierley C. Pour la. Science 60: p. 38 (1982).
[88]. Harrison JR and AP. Ann. Rev. Microbiol. 38: p. 265 (1984).
[89]. Hutchins SR and Davidson MS. Ann. Rev. Microbiol. 40: p. 311 (1986).
[90]. Silverman MP and Lundgren DG. J. Bacteriol. 77: p. 326 (1959).
[91]. Mahapatra SSR and Mishra AK. Current Science 54: p. 235 (1985).
[92]. Costa ACA Medronho RA and Pecanha RP. Phosphate Rock Bioleaching.
Biotechnology Letters 14: pp. 233-238 (1992).
[93]. Kokal, H, The origin of phosphorus in iron making raw materials and methods of
removals. A review, 63rd annual meeting Minnesota section AIME, pp. 225-257 (1990).
[94]. Rodriguez, H., Fraga, R., Phosphate solubilizing bacteria and their role in plant growth
promotion. Biotechnol. Adv 17, pp 319-339 (1999).
[95]. Igual, J. M., Valverde, A., Cervantes, E., velazquez., E., Phosphate solubilizing bacteria
as inoculants for agriculture: use of update molecular techniques in their study. Agronomie
21, pp 561-568 (2001).

183
[96]. Reyes, I., Bernier, L., Antoun, H., Rock phosphate solubilization and colonization of
maize rhizosphere by wild and genetically modified strains of penicillium rugulosum.
Microb. Ecol. 44, pp 39-48 (2002).
[97]. Goldstein, A., Lester, T., Brown, J.,. Research on the metabolic engineering of the
direct oxidation pathway for extraction of phosphate from ore has generated preliminary
evidence for PQW biosynthesis in Escherichia coli as well as a possible role for the highly
conserved region of quinoprotein dehydrogenases.BBA-proteins proteom, vol. 1647, pp. 266-
271 (2003).
[98]. Khairnar, N. P., Misra, H. S., Apte, S., Pyrroioquinoline-quinone synthesized in
Escherichia coli by pyrroloquinoline-quinone synthase of Deinococcus radiodurans plays a
role beyond mineral phosphate solubilization. Biochem. Biophys. Res. Commun. 312, pp
303-308 (2003).
[99]. Kim, C. H., S. H., Kim, K. Y., Cho, B. H., Kim, Y.H., Koo, B. S., Kim, Y. C. Cloning
and expression of pyrroloquinoline quinonone (PQQ) genes from a phosphate-solubilizing
bacterium Enterobacter intermedium. Curr. Microbiol. 47, pp 457-461 (2003).
[100]. Richardson, A. E., In: Velazquez, E., Rodriguez-Barrueco, C. (Eds.), Making
Microorganisms Mobilize Soil Phosphorus. Springer, Dordrecht, The Netherlands. Pp 85-90
(2007a).
[101]. Richardson, A. E., Making Microorganisms Mobilize Soil Phosphorus. In: Velazquez,
E., Rodriguez-Barrueco, C. (Eds.), First International Meeting on Microbial Phosphate
Solubilization. Springer, Dordrecht, The Netherlands. Pp 85-90 (2007b).
[102]. Delvasto, P et al./ Hydrometallurgy 92 pp 124-129 (2008).

184
[103]. Mokwunye AU and Chien SH. Reactions of Partially Acidulated Rock with Soils from
the Tropics. J. Soil Sci. Soc. Am. 44: pp. 477-482 (1980).
[104]. Garbouchev IP. The Manufacture and Agronomic Efficiency of a Partially Acidulated
Phosphate Rock Fertilizer. Soil Sci. Soc. Am. J. 45: pp. 970-974 (1981).
[105]. Marwaka BC. Partially Acidulated Rock Phosphate as a Source of Fertilizer
Phosphorous with Special reference to High P-Fixing Acid Soils-A Review Proc. Ind. Natn.
Sci. Acad. B49: pp. 436-446 (1983).
[106]. Jaggi TN. Non-Conventional Phosphatic Fertilizers-Partially Acidulated Phosphate
Rock. FAI. Seminar Tech. 3: pp. 1-24 (1985).
[107]. Hagin J and Katz. Effectiveness of Partially Acidulated Phosphate Rock as a Source to
Plants in Calcareous Soils. Fert. Res. 8: pp. 117-127 (1985).
[108]. Braithwaite AC. A Comparison of Fertilizers Made by Partially and fully Acidulating
Phosphate Rocks with Phosphoric Acid. NZJ. Tech. 2: pp. 37-42 (1986).
[109]. Junge A and Werner W. Investigations on Reactions of Phosphorus Compounds in
Partially Acidulated Phosphate Rock and Fertilizer Effectiveness. Fert. Res. 20: pp. 129-134
(1989).
[110]. Kisitu VB. Some Aspects of Using Rock Phosphate as Direct Application Fertilizers.
Fert. Res. 30: pp. 191-192 (1991).
[111]. Hammond LL. Agronomic Measurements of Phosphate Rock Effectiveness. Sami. on
Phos. Rock for Direct Application Haifa, pp. 147-173 (1978).
[112]. Anon. Partial Acidulation of Phosphate Rock. Phosphorous & Potassium No. 150 pp.
48-53 (1987).

185
[113]. McClellan GH. Mineralogy and Reactivity of Phosphate Rock. Sami. on Phos. Rock
for Direct Application IFDC. pp. 57-81 (1978).
[114]. Roy AH and McClellan GH. Future Prospects for Non-Conventional Phosphate
Fertilizers in Developing Countries. Raw Mate. Meet. Int. Fert. Ind. Associ. Kyoto, 11: pp.
98-122 (1985).
[115]. McClellan GH. Phosphate Products from Indigenous Resources. In. Fert. 85 British
Sulphur Corp's. Int. Conf. on Fertilizers London, pp. 329-343 (1985).
[116]. Livingston OW. Minigranulation-A Method for Improving the Properties of Phosphate
Rock for Direct Application. Sami. on Phos. Rock for Direct Application pp. 367-377 (1978).
[117]. Hignett TP and Parish DH. Appropriate Fertilizer Technology for Developing
Countries. In: Fertilizer 83 British Sulphur Corp's. Int. Conf. on Fertilizers London, pp. 347-
359 (1983).
[118]. Khasawneh FE and Doll EC. The Use of Phosphate Rock for Direct Application to
Soils Adv. Agron. 30: pp. 159-206 (1978).
[119]. Hammond LL and Leon LA. Agronomic Effectiveness of Natural and Altered
Phosphate Rocks from Latin America, 3rd Int. Cong. on Phos. Compounds Brussels, (1983).
[120]. Jaggi TN. Non-Conventional Phosphatic Fertilizers-Partially Acidulated Phosphate
Rock. FAI. Seminar Tech. 3: pp. 1-24 (1985).
[121]. Good PC Goff TN and White JC. Acidulation of Florida Phosphate Matrix in a Single-
Tank Reactor. BuMines Rl 8339 p. 16 (1979).
[122]. Wilemon GM and Scheiner BJ. Leaching of the Phosphate Values from two Central
Florida Ores, Using H2SO4-Methanol Mixtures. Bu Mines Rl. 9094 p. 9 (1987).

186
[123]. Dahanayake K Senaratne A Subasinghe SAND and Liyanarachchi A. Potential Use of
Naturally Occurring Sulphuric Acid to Beneficiate Poorly Soluble Phosphate from Eppawala,
Sri Lanka, Fert. Res. 29: pp. 197-201 (1991).
[124]. May JT and Toan LR. Hydrochloric Acid Digestion and Solvent Extraction of
Western Phosphates. US Bureau of Mines Report of Investigations 8109 Washington, (1976).
[125]. Hansen JP Davis BE and Llewellyn TO. Removal of Magnesia from Dolomitic
Southern Florida Phosphate Concentrates by Aqueous SO2 Leaching. Rl. No. 8953, US.
Bureau of Mines p. 11 (1985).
[126]. Baumann AN and Snow RE. 2nd. Int. Cong. on Phosphate Compounds Proceedings
April 21-25 Boston, 269 (1980).
[127]. Zatout AA and Hussein M. Fluorosilicic Acid Acidulation of Egyptian Abu-Tartur
Rock Phosphate. Fert. Tech. 18: pp. 95-98 (1981).
[128]. Haggin J. Lower-cost Processes Developed for Phosphoric Acid Production. Chem. &
Eng. News 63 (42): pp. 23-25 (1985).
[129]. Rubin AG. The BESA-2 Process New Technology for Phosphoric Acid Phosphorus &
Potassium No. 137 pp. 28-32 (1985).
[130]. Hansen JP Davis BE and Llewellyn TO. Removal of Magnesia from Dolomitic
Southern Florida Phosphate Concentrates by Aqueous SO2 Leaching. Rl. No. 8953 US
Bureau of Mines p. 11 (1985).
[131]. Wilemon GM Swanton RS Davis JG and Scheiner BJ. Phosphate from Wastes via
Acid Leaching in the Presence of Methanol. Min. & Metall. Proc. 288: pp. 201-205 (1990).
[132]. Ekmekyapar A Ersahan H and Donmez B. Calcination of Magnesite and Leaching
Kinetics of Magnesia in Aqueous Carbon Dioxide. J. Doga. Turkish, 17 pp. 197–204 (19930.

187
[133]. Biskupski A and Borowik M. Production of Magmesium Carbonate from Dolomite by
Bicarbonate Method with Sodium Compound Circulation. J. Przemysl Chemiczny 75 pp. 59-
63 (1996).
[134]. Morse JW and Arvidson RS. The Dissolution Kinetics of Major Sedimentary
Carbonate Minerals. J. Earth Sci. Rev.58 pp. 51-84 (2002).
[135]. Liang B Chun Li Zhang C and Zhang Y. Leaching Kinetics of Panzhihua Ilmenite in
Sulfuric Acid. J. Hydrometallurgy 76 pp. 173-179 (2005).
[136]. Ashraf M Zafar IZ Ansari TM and Fiaz A. Selective Leaching Kinetics of Calcareous
Phosphate Rock in Phosphoric acid. J. Applied Sciences 5(10): pp. 1722-1727 (2005).
[137]. Zafar IZ Ansari TM Ashraf M and Amine M. Effect of Hydrochloric Acid on
Leaching of Low Grade Calcareous Phosphate Rock. Iranian J. Chemistry & Chem. Engg.
Iran, Vol. 25(2): pp. 47-57 (2006).
[138]. Abu-Eishah SI and Sadeddin W. Beneficiation of Calcareous Phosphate Rocks by
Acidulation with Dilute Acetic Acid Solutions: Presented at 3rd. Cong. of Chemical
Engineers Cairo-Egypt. March 19-21 TESCE 14: pp. 23-33 (1988).
[139]. Sadeddin W and Abu-Eishah SI. Minimization of Free Calcium Carbonate in Hard and
Medium-Hard Phosphate Rocks Using Dilute Acetic Acid Solution. Int. J. Mineral Proc.
30:pp. 113-125 (1990).
[140]. Abu-Eishah SI El-Jallad IS Muthaker M Touqan M and Sadeddin W. Beneficiation of
Calcareous Phosphate Rocks Using Dilute Acetic Acid Solution: Optimization of Operating
Conditions for Ruseifa (Jordan) Phosphate. Int. J. Mineral Proc. 31:pp. 115-126 (1991).
[141]. Zafar ZI Anwar MM and Pritchard DW. A New Route for the Beneficiation of Low
Grade Calcareous Phosphate Rocks. J. Fert. Res. 44 pp. 133-142 (1996).

188
[142]. Economou ED and Vaimakis TC. Beneficiation of Calcareous Phosphate Ore Using
Acetic Acid Solutions. J. Colloid and Interface Sci. 36 pp. 1491–1497 (1997).
[143]. Economou ED Vaimakis TC and Papamichael EM. Kinetics of Dissolution of the
Carbonate Minerals of Phosphate Ores Using Dilute Acetic Acid Solutions. J. Colloid and
Interface Sci. 245 (1) pp. 164–171 (1998).
[144]. Economou ED Vaimakis TC and Papamichael EM. The Kinetics of Dissolution of the
Carbonate Minerals of Phosphate Ores Using Dilute Acetic Acid Solutions: The Case of pH
Range from 3.96 to 6.40. J. Colloid and Interface Sci. 245 (1) pp. 133–141 (2002).
[145]. Fredd CN and Fogler H.S. The Kinetics of Calcite Dissolution in Acetic Acid
Solutions. J. Chem. Eng. Science 53 pp. 3863–3874 (1998).
[146]. Jordan G Higgins SR Eggleston CM Knauss KG and Schmahl WW. Dissolution
Kinetics of Magnesite in Acidic Aqueous Solution, A Hydrothermal Atomic Force
Microscopy (HAFM) Study: Step Orientation and Kink Dynamics. Geochimica et.
Cosmochimica Acta. 23 pp. 4257–4266 (2001).
[147]. Sarda SE Fernandez M Nilsson M Balcells L and Planell A. Kinetic Study of Citric
Acid Influence on Calcium Phosphate Bone Cements as Water-reducing Agent. J.
Biomedical Materials Res. 61 pp. 653-659 (2002).
[148]. Demir F Donmez B and Colak S. Leaching Kinetics of Magnesite in Citric Acid
Solutions. J. Chem. Eng. of Japan, 36 pp. 683–688 (2003).
[149]. Zafar IZ and Saeed A. Mass Transfer and Reaction Kinetics in Leaching of Calcareous
Phosphate Rock. J. Eng. Horizons Vol. 17(4): pp. 15-21 (2004).
[150]. Oral L Bunyamin D and Fatih D. Dissolution Kinetics of Natural Magnesite in Acetic
Acid Solutions. Int. J. Miner. Proc. 75 pp. 91-99 (2005).

189
[151]. Zafar ZI Anwar MM and Pritchard DW. Selective Leaching of Calcareous Phosphate
Rock in Formic Acid: Optimisation of Operating Conditions. J. Mineral Engineering 19(14):
pp. 1459-1461(2006).
[152]. Veeken A.H.M Hamelers and H.V.M. Removal of Heavy Metals from Sewage Sludge
by Extraction with Organic Acid. Water Science and Technology 400 PP. 129-136. (1999).
[153]. Bilgic S. The Inhibition Effects of Benzoic Acid Salicylic Acid on the Corrosion of
Steel in Sulfuric Acid Medium. Material Chemistry and Physics 76 PP. 52-58 (2002).
[154]. British Mining Consultants Ltd. Assessment of Lagarban Phosphate. December
Phase II. (1982).
[155]. Ishaque M. Ishtiaq A. The potential of Hazara Phosphates for Phosphoric Acid
manufacture. J. Fert. Res.PP. 14 257-263 ( 1987).
[156]. Furmann NH. Standard Methods of Chemical Analysis, (6th ed) D., Van Nostrand
Company, New Jersey, USA. (1963).
[157]. Scott WW. Standard Methods of Chemical Analysis, N Y. (1956).
[158]. A. Rauf, Instrumental Methods of Chemical Analysis, UGC Monograph, University
Grants Commission, Islamabad, Pakistan (1988).
[159]. H. H. Willard, L. L. Merrit and J. A. Dean, Instrumental Methods of Analysis, 5th Ed.,
D. Van Nostrand Co., New Yark(1974).
[160]. H. H. Bauer, G.D. Christian and J. E. O. Reilly, Instrumental Analysis 2nd Ed., Allyn
and Bacon Inc. London (1978).
[161]. Ozmetin C. Kocakerim M.M Yapici S and Yartasi A. J. Ind. & Eng. Chem. Res. 35,
pp. 2355–2359. (1996).

190
[162]. Wen C. Noncatalytic heterogeneous solid-fluid reaction models. Ind. & Eng. Chem.
Res., 60 (9) pp. 34-17 (1968).
[163]. Levenspiel O. Chemical Reaction Eng. 2nd ed. John Wiley and Sons: New York, PP.
357-377(1972).
[164]. Ozbek H Abali Y Colak S Ceylum I and Karagolge Z. Dissolution Kinetics of
Magnesite Mineral in Water Saturated by Chlorine Gas, Hydrometallergy 151, pp. 173-185
(1999).
[165]. Abdel-Aal EA. Kinetics of sulphuric acid leaching of low-grade zinc silicate ore.
Hydrometallurgy 55 pp. 247-254 (2000).
[166]. Somasundaran P. Agar G E. J. Colloid Interface Sci. 24 433 (1967).
[167]. Plummer L.N Wigley T.M.L and Parkhurst D.L. Am. J. Sci. 278 179 (1978).
[168]. Morimoto T kishi J Okada O. Kadota T and Bull. Chem. Jpn. 53 pp.1918-1921
(1980).
[169]. Sjoberg E.L and Rickard D.T. Chem. Geol. 42 pp.119-136 (1984).
[170]. Thompson D.W and Pownall P.G. J. Colloid Interface Sci. 131 pp.74-82. (1989).
[171]. Neagle W and Rochester C.H. J. Chem. Soc. Faraday Trans. 86 pp.181-183.
(1990).
[172]. Fairchild I.J Killawee J.A Hubbard B and Dreybrodt W. Chem. Geol. 155 234
(1999).

191
Appendix A
List of Symbols
MCP Monocalcium Phosphate
DCP Dicalcium Phosphate
TCP Tricalcium Phosphate
BPL Bone Phosphate of Lime
TPL Total Phosphate of Lime
NP Nitrophos
DAP Diammonium Phosphate
MAP Monoammonium Phosphate
SSP Single Superphosphate, or
NSP Normal Superphosphate (also known as superphosphate)
TSP Triple Superphosphate (also known as concentrated superphosphate)
AIR Acid Insoluble Residue
LOI Loss on Ignition
=XB dissolved fraction of Ca++ (–)
cxp experimental dissolved fraction of Ca++ (–)
cal predicted fraction of Ca++ (–)
C acid concentration (% v/v)
L/S liquid/solid ratio (g-1cm3)
D average diameter of particle (mm)
t reaction time (min)
T reaction temperature (K)

192
Ea activation energy (Jmol-1)
SS stirring speed (min-1)
N number of experimental data

193
Appendix B
Published Work