REACTION DYNAMICS IN SUPERCRITICAL MEDIA · REACTION DYNAMICS IN SUPERCRITICAL MEDIA NICOLA EMMA...
183
REACTION DYNAMICS IN SUPERCRITICAL MEDIA Thesis submitted for the degree of Doctor of Philosophy at the University of Leicester by Nicola Emma Durling MChem (Leicester) Department of Chemistry University of Leicester October 2003
Transcript of REACTION DYNAMICS IN SUPERCRITICAL MEDIA · REACTION DYNAMICS IN SUPERCRITICAL MEDIA NICOLA EMMA...

REACTION DYNAMICS IN SUPERCRITICAL MEDIA
Thesis submitted for the degree of
Doctor of Philosophy
at the University of Leicester
by
Nicola Emma Durling MChem (Leicester)
Department of Chemistry
University of Leicester
October 2003

UMI Number: U180413
All rights reserved
INFORMATION TO ALL USERS The quality of this reproduction is dependent upon the quality of the copy submitted.
In the unlikely event that the author did not send a complete manuscript and there are missing pages, these will be noted. Also, if material had to be removed,
a note will indicate the deletion.
Dissertation Publishing
UMI U180413Published by ProQuest LLC 2013. Copyright in the Dissertation held by the Author.
Microform Edition © ProQuest LLC.All rights reserved. This work is protected against
unauthorized copying under Title 17, United States Code.
ProQuest LLC 789 East Eisenhower Parkway
P.O. Box 1346 Ann Arbor, Ml 48106-1346

REACTION DYNAMICS IN SUPERCRITICAL MEDIA
NICOLA EMMA DURLING
UNIVERSITY OF LEICESTER
2003
ABSTRACT
An in situ dielectric method is used to measure aromatic solubilities as a function of pressure and to follow the progress of an Esterification, Aldol and Friedel- Crafts reactions in supercritical (sc) difluoromethane (HFC 32). This is achieved by measuring the changes in the sc solution capacitance as the composition of the sc system changes.
The solubility of /?-hydroxybenzoic, p-toluic, p-aminobenzoic and p- chlorobenzoic acids and also p-chlorophenol and />-aminophenol is determined in sc HFC 32 at 363 K using the dielectric method, and presented as a function of pressure. The compounds are shown to be more soluble than in the commonly employed sc solvent, CO2, under comparative conditions. The enhancement factor is used as a way of expressing solubility to remove the effect of vapour pressure and the observed trend in solubility is found to be highly dependent on the polarity of the substituents present on the aromatic ring.
The use of the in situ dielectric method for monitoring a reaction in a sc fluid is proposed. The Esterification, Aldol and Friedel-Crafts reactions in sc HFC 32 were used to test the applicability of this technique. These are the first reported reactions to be carried out in sc HFC 32. The rate/equilibrium constants for these reactions are determined and found to decrease with increasing pressure. It is proposed that the observed high reaction rates at low pressure are due to local composition enhancements.
Determination of solvent-solute interactions is key to the understanding of solvent properties in liquids and sc fluids. The Kamlet-Taft parameters were determined for HFC 32 and 1,1,1,2-tetrafluoroethane (HFC 134a) as a function of temperature and pressure in the range 313 to 403 K and 50 to 220 bar using three solvatochromic dyes. It is shown that both solvents exhibit considerable hydrogen bond donor and acceptor properties and these parameters also obey the three region density model often invoked when describing the polarisability/dipolarity parameter in sc fluids.
II

ACKNOWLEDGEMENTS
Firstly, a big thank you goes out to my supervisor, Dr. Andrew Abbott, for his ideas and continued support over the past three years. I would also like to thank Prof. Eric Hope and Dr. Stuart Corr for their input into my research, which has been of great benefit to me. It has been a pleasure working in the Abbott group and a very memorable experience, which in part is due to some of the unique characters I have worked alongside for the last few years. Ray and Glen have to get a mention, not for their help with my studies but because without them the development of my culinary skills would not have progressed to the level it has reached today!!
I would like to thank Keith Wilkinson and John Weale for the construction and repair of the high-pressure apparatus and also a general thank you goes to all the staff in the department who have helped me at some stage over the last few years.
Special thanks go to my parents who have supplied me with never-ending enthusiasm and moral support throughout my time at university and last but by no means least I would like to show my gratitude, appreciation and much, much more to Wayne Eltringham. There are so many things I want to thank him for and I hope in the coming years I get the opportunity to do so.
Ill

‘It’s all in the chemistry.’
S Club 7
I V

CONTENTS
PageCHAPTER 1 Introduction 1
1.1 Introduction 21.2 Supercritical Fluids 21.3 Hydrofluorocarbons 51.4 Industrial and Academic Applications of Supercritical Fluids 8
1.4.1 Chromatography 91.4.2 Electrochemical Applications 91.4.3 Extraction and Separation Processes 101.4.4 Chemical Reactions 13
1.5 References 17
CHAPTER 2 Experimental 22
2.1 Materials 232.1.1 Solvents 232.1.2 Solutes 232.1.3 Extraction Capsules 232.1.4 Solvatochromic Probes 23
2.2 Instrumentation 242.2.1 High Pressure Apparatus 242.2.2 Capacitance Cell 262.2.3 Optical Cell 26
2.3 Experimental Measurements 262.3.1 Solubility Measurements 262.3.2 Extraction Technique 292.3.3 Solvatochromic Measurements 292.3.4 Reaction kinetics Measurements 29
2.4 Reactions 302.4.1 Friedel-Crafts Alkylation 302.4.2 Esterification 302.4.3 Aldol Condensation 30
2.5 References 31
CHAPTER 3 Solubility Relations and Modelling in Supercritical 32Difluoromethane
3.1 Introduction 333.1.1 Solubility in Supercritical Fluids 3 33.2.1 Measurements T echniques 3 43.1.3 Solubility Modelling 35
3.2 Results and Discussion 383.2.1 Solubility of Solids in Supercritical HFC 32 383.2.2 Modelling Solubility in Supercritical HFC 32 463.2.3 Extraction Using Supercritical HFC 32 51
V

3.3 Conclusions 563.4 References 57
CHAPTER 4 Solvent Properties of Supercritical Hydrofluorocarbons 59
4.1 Introduction 604.1.1 Solvatochromism 604.1.2 The Kamlet and Taft Polarisability/Dipolarity Parameter, n 614.1.3 Hydrogen Bonding 66
4.2 Results and Discussion 704.2.1 Polarisability/Dipolarity Parameter, n 704.2.2 Hydrogen Bond Acceptor Properties, p 734.2.3 Hydrogen Bond Donor Properties, a 764.2.4 Solubility Modelling 834.2.5 Partition Coefficient Modelling 91
4.3 Conclusions 944.4 References 95
CHAPTER 5 Equilibrium Reactions in Supercritical Media 98
5.1 Introduction 995.1.1 Chemical Equilibrium Constants 995.1.2 Dependence of Equilibrium & Rate Constants on Temperature & 101
Pressure5.1.3 Equilibrium Reactions in Supercritical Fluids 102
5.2 Results and Discussion 1065.2.1 Esterification Reaction 1065.2.2 Aldol Condensation Reaction 112
5.3 Conclusions 1165.4 References 117
CHAPTER 6 Rates of Reaction in Supercritical Media 118
6.1 Introduction 1196.1.1 Reaction Kinetics 1196.1.2 Friedel-Crafts Reaction 1226.1.3 Determination of a Rate Law 125
6.2 Results and Discussion 1286.2.1 Rate Law of the Friedel-Crafts Reaction 1286.2.2 Effect of Temperature and Pressure on the Friedel-Crafts Reaction 136
Rate6.2.3 Effect of Reagents on the Friedel-Crafts Reaction Rate 1456.2.4 Effect of Supercritical Solvent on the Friedel-Crafts Reaction Rate 149
6.3 Conclusions 1556.4 References 156
V I
CHAPTER 7 Summary and Future Work 158
7.1 Summary 1597.1.1 Solubility 1597.1.2 Solvent Properties 1597.1.3 Reactions 160
7.2 Future Work 1617.2.1 Solubility Measurements in Hydrofluorocarbons 1617.2.2 Local Composition Enhancement 1617.2.3 Reactions in Hydrofluorocarbons 161
APPENDIX 163
V I I

1
INTRODUCTION
1.1 Introduction
1.2 Supercritical Fluids
1.3 Hydrofluorocarbons (HFCs)
1.4 Industrial and Academic Applications of Supercritical Fluids
1.4.1 Chromatography
1.4.2 Electrochemical Applications
1.4.3 Extraction and Separation Processes
1.4.4 Chemical Reactions
1.5 References

CHAPTER 1. Introduction
1.1 Introduction
There are serious environmental concerns facing the manufacturers of
industrial scale organic solvents, so there is an increased need to develop
environmentally conscious, economical reaction media. Supercritical (sc) fluids may
be an answer. However, for the development of synthetic processes based on sc
solvents, a detailed knowledge of the effect of the solvent on reaction dynamics is
required. It is well known that the solvent in a chemical process can also affect both
the mechanism and kinetics of a reaction.1 In a chemical reaction the solvent should
ideally be:
0) Highly chemically stable
(ii) Easy to handle
(iii) O f optimum viscosity to allow the required mass transport
(iv) Inexpensive
(v) Non toxic and environmentally acceptable
In this work, complex solvent effects and the effect of physical conditions on
the kinetics and mechanism of chemical reactions are investigated. All of these
properties will change markedly in a sc fluid and this tunability of the solvent
suggests an unprecedented ability to select the product distribution obtained from a
chemical reaction. In particular, the solvent properties of sc difluoromethane (HFC
32) and 1, 1, 1, 2-tetrafluoroethane (HFC 134a) will be assessed.
1.2 Supercritical Fluids
Scientists and engineers have been aware of the enhanced solvent
characteristics of sc fluid solvents for more than one hundred years.2 However, it is
only within the last two decades that sc fluids have been the focus of a number of
research and development programs and much media hype.
A sc fluid is formed if the temperature and pressure of a single substance
simultaneously exceed that of the critical point but below the pressure required to
condense it into a solid. Figure 1.1 shows a typical phase diagram, where Pc and Tc
are the critical pressure and temperature respectively. Figure 1.2 shows the phase
transitions to a sc fluid pictorially.
At high temperatures and pressures the molecules of a sc phase will have high
kinetic energy and therefore it acts like a gas. At the same time, the density of a sc
fluid is intermediate between a gas and a liquid, so solvent molecules have large
2
CHAPTER 1. Introduction
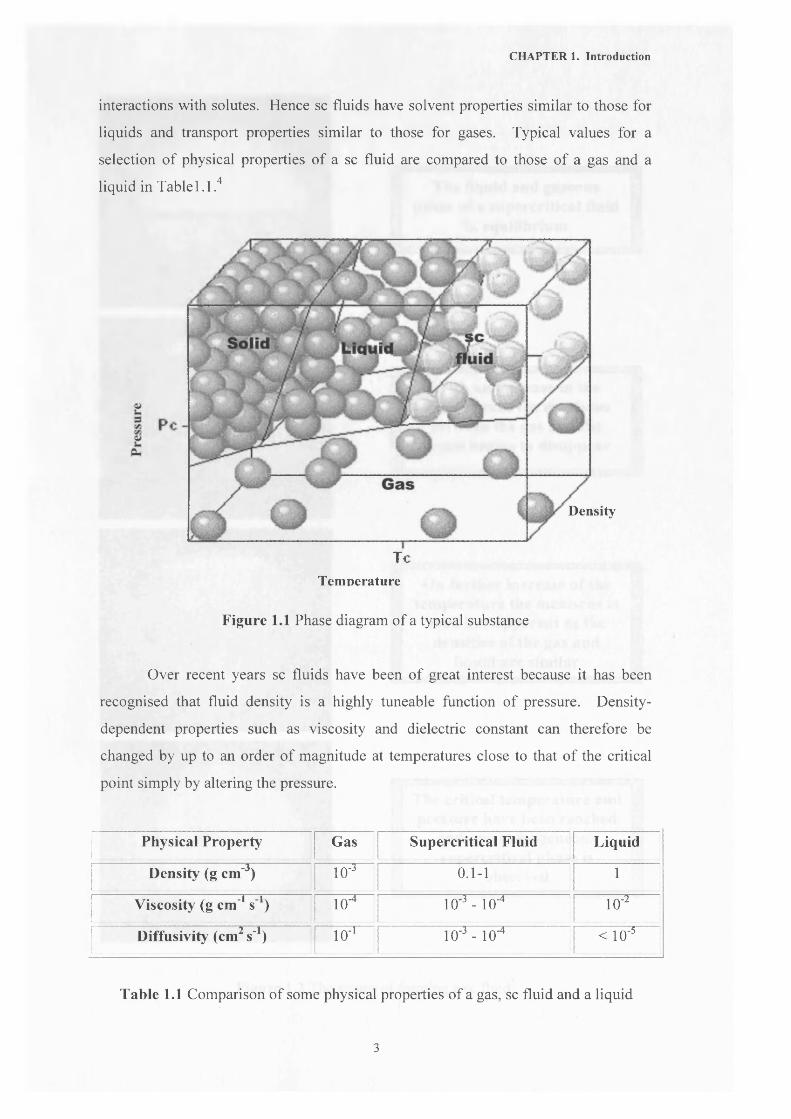
interactions with solutes. Hence sc fluids have solvent properties similar to those for
liquids and transport properties similar to those for gases. Typical values for a
selection of physical properties of a sc fluid are compared to those of a gas and a
liquid in Table 1.1.4
Density
TcTemperature
Figure 1.1 Phase diagram of a typical substance
Over recent years sc fluids have been of great interest because it has been
recognised that fluid density is a highly tuneable function of pressure. Density-
dependent properties such as viscosity and dielectric constant can therefore be
changed by up to an order of magnitude at temperatures close to that of the critical
point simply by altering the pressure.
Physical Property Gas Supercritical Fluid Liquid
Density (g cm'3) l 0-3 0.1-1 1| 1
Viscosity (g cm' s' ) 104 i o 3 - 1 o'4 10'2
Diffusivity (cm2 s'1) 104 10"3 - lor4 < 10'5
Table 1.1 Comparison of some physical properties of a gas, sc fluid and a liquid
3

CHAPTER 1. Introduction
The liquid and gaseous phase of a supercritical fluid
in equilibrium
With an increase in the temperature the meniscus
between the gas and the liquid begins to disappear
On further increase o f the temperature the meniscus is
even less apparent as the densities of the gas and
liquid are similar
Figure 1.2 The stages of forming a sc fluid5
The critical temperature and pressure have been reached
and one homogeneous supercritical phase is
observed
4

CHAPTER 1. Introduction
Not all properties of sc fluids are intermediate between those of gases and
liquids; compressibility and heat capacity, for example, are significantly higher near
the critical point than they are in liquids or gases. Properties of a compound may
change drastically with pressure close to the critical point but most show no
discontinuity.
The majority of studies involving sc fluids have focused on carbon dioxide
(CO2), ethene, ethane and water as solvents. The first three fluids all have critical
temperatures below 308.15 K. As a general trend it is seen that the greater the
polarity of a substance the higher its critical temperature.6 The polarity of water
would make it an ideal solvent but unfortunately it has critical values (Tc = 647.35 K,n
pc = 220.5 bar) that make it impractical for widespread use in industrial applications.o
Carbon dioxide (Tc = 304.55 K, pc = 72.3 bar) is by far the most widely used sc fluid
because it is non-toxic, non-flammable and readily available in high purity with a very
accessible critical temperature. Carbon dioxide also exhibits low miscibility with
water and is a moderately good solvent for many low-to-medium molecular weight
organics. Reported solubilities for non-polar solids and liquids in sc CO2 range
between 0.1 to 10 mol %?
The major problem encountered with sc CO2 and other commonly used sc
fluids, such as ethane, is that they are non-polar, which precludes the dissolution of a
number of polar solutes. This can be overcome to an extent by the introduction of
polar modifiers or an appropriate surfactant but these have their own disadvantages
associated with them. Halogenated aliphatic compounds have also been investigated
as alternative sc solvents because they are more polar than CO2 and still have
accessible critical constants.10,11 More recently still it has been suggested that
hydrofluorocarbons are a promising class of sc solvents because they are relatively1 9polar yet still exhibit moderately low critical constants.
1.3 Hydrofluorocarbons
Hydrofluorocarbons (HFCs) have replaced a number of chlorofluorocarbons
(CFCs) in the refrigeration and propellants industries13,14 and without justification
HFCs have been associated with the same environmental problems as CFCs. The
environmental impact of these HFCs was the focus of intensive research in 1989 by
the Alternative Fluorocarbons Environmental Acceptability Study (AFEAS). This
research program concluded that HFCs contain no chlorine and do not contribute to
5

CHAPTER 1. Introduction
ozone depletion because hydroxyl radicals break them down in the lower atmosphere
to simple inorganic species that are readily present in the atmosphere.15,16 It is found
however, that a few HFCs may form trifluoroacetyl halides that will dissolve in water
to give trifluoroacetate (TFA) salts.16,17 These salts will then be present in rain and
seawater at very low concentrations but micro-organisms naturally present in soils and
sediments can degrade them.
Another environmental concern facing the Earth is the greenhouse effect.
Hydrofluorocarbons do not accumulate in the atmosphere to the same extent as CFCs
so their contribution to the greenhouse effect is greatly reduced. Atmospheric decay
rates of HFCs do vary but the lifetimes are much less than those of CO2. For a
relatively short lived gas like HFC 134a, the concentration and hence contribution to
global warming drops rapidly to zero after emission but the contribution due to
emission of a long lived gas like CO2 persists for more than 500 years as shown in
Figure 1.3.16
< 0.6
Carbon Dioxide
2 0.4
a 0.2
100 200 300 400Years after Em isson
500
Figure 1.3 The decay of HFC 134a compared to CO2 16
6

CHAPTER 1. Introduction
After much work within the gases industry HFCs were found to have the most
useful properties to be replacements for CFCs and lead candidates were identified and
developed to try to meet the needs of the refrigeration, foam blowing, medical and
specialist aerosol industries. These are summarised in Table 1.2.18 In these
applications specific properties of the HFCs such as benign toxicity, solvency,
density, boiling point and flammability are exploited.
Name Abbreviation | Flammable\
Application
144 ,2 -
Tetrafluoroethane
HFC 134a | No
ti
Refrigeration, aerosol,
foam blowing and medical
14-Difluoroethane HFC 152a [ YesI3
General aerosol
Difluoromethane HFC 32 | Yes Refrigeration blends
j 14,1-Trifluoroethane HFC 143a j Yes Refrigeration blends
Pentafluoroethane HFC 125 | No Refrigeration blends
14,1,2,3,3,3-
Heptafluoropropane
HFC 227ea | No
3il
Fire fighting agent and
aerosol propellant
|
Hexafluoropropane]
HFC 236fa | Noj
Foam blowing
Table 1.2 HFCs in common use
It can be seen that HFCs are key to the replacement of refrigerants and
propellants and play an important role in improving our way of life. For example
after a lot of research it is now possible to safely and efficiently install HFCs in
refrigeration and air conditioning units and this has lead to a significant reduction in
global warming.
More recently HFCs have been researched for use on applications outside the
refrigerants and propellants industry, in particular their uses as solvents.19 Focusing
on their use as sc solvents they are thought to be possible replacements for the
commonly used sc solvent CO2 . The main reasons behind employing CO2 as a sc
solvent are thought to be environmental and economic factors. However, the major
problem that is encountered with the use of sc CO2 for extraction and reaction
7

CHAPTER 1. Introduction
purposes is the low solubility of polar solutes due to its low dielectric constant. The
“green” aspect of using sc CO2 as a solvent can then be negated if large volumes or
high pressures are required to solubilise the solutes because of the large energy
contribution associated with such processes. To circumvent these problems, polar
modifying agents have been added to CO2 to increase the solvent polarity. These
modifying fluids add to the cost of the process and may also be left as residues, which90 99may be problematic if the product is to be used for human consumption.
Recently, it has been highlighted that some HFC fluids such as HFC 32 and99 95HFC 134a are relatively polar solvents in the sc state ' and this allows them to be
used as efficient extraction and reaction solvents either on there own or in conjunction
with CO2 . These solvents are also readily available and non-toxic. Three well-
researched HFCs are shown in Table 1.3 where it can be seen that they all have9 f \ 97critical temperatures below 375 K ’ and gaseous dipole moments greater than 1.5
D .13’14
Hydrofluorocarbon FT c(K) 1” P c (bar)\
| pc (kg m'3)i
[p (D )
l,l»l»2-Tetrafluoroethane (HFC 134a) | 374.21|
| 40.59 | 511.90 | 2.06
Difluoromethane (HFC 32) |..351.26 f 57.82..I
Pentafluoroethane (HFC 125)_ _ _ _ _ _ _ _ _ _
| 571.30 1.56
Table 1.3 The critical constants and dipole moments of HFC 134a, HFC 32 and HFC
125
Journal and patent literature contain numerous possible applications outside
the refrigeration and propellants industry where HFCs can be advantageous. Some of
these applications include dry-cleaning, the treatment of sludge to remove
contaminants, 28 natural product extraction19 and HPLC mobile phases.29'31
1.4 Industrial and Academic Applications of Supercritical Fluids
The unique solvent properties of sc fluids offer a series of technical advantages99 99that has resulted in their exploitation in chromatography (section 1.4.1), ’
electrochemical applications (section 1.4.2),12’34"38 extraction and separation processes
(section 1.4.3)39,40 and chemical reactions (section 1.4.4).41
CHAPTER 1. Introduction
1.4.1 Chromatography
In the 1960s it was recognised that sc mobile phases could be employed in
chromatographic analysis.42 Supercritical fluid chromatography (SFC) uses sc gases
as a mobile phase42,43 to transport a mixture of substances over the stationary phase.
The solvent power of the mobile phase is determined by its density and so, for a sc
fluid, can easily be modified by pressure. Furthermore, separation of the eluted
compounds is easily achieved by pressure release. Due to the enhanced mass
transport properties in sc fluids, high molecular mass compounds can be dissolved
and efficiently separated at relatively low temperatures.43,44 Supercritical fluid
chromatography is therefore an important analytical technique that can provide a
fundamental knowledge of solubility and partitioning behaviour of a wide range of
molecular mass compounds which is essential in designing chemical processes.
Hupe et a l45 have reviewed the theory and fundamentals behind SFC in detail.
The most commonly employed mobile phase in SFC is sc CO244,46-48 but, as this is a
relatively non-polar fluid, modifiers are often added to change the solvent strength of
the mobile phase.49-51 Using a more polar sc fluid can increase the solvent strength of
a mobile phase and recent work by Vayisoglu-Giray et al.31 and Ineos Fluor19 have
taken advantage of this by employing HFC 134a in its liquid and sc state. It would
appear that for many separations HFC 134a offers better separation than sc CO2 and if
the process is to be scaled-up, HFC 134a is potentially easier and less expensive than
that employing sc CO2 due to the lower pressures required.19
Supercritical fluid chromatography is a useful analytical technique and as
awareness in the field has increased so has the research. Early studies included the
separation of oligomers,52 polystyrene,53 and high molecular weight compounds.54
Analysis of aromatics in diesel fuel55 and plant materials56 have also been studied by
this technique. A recent review by Chester and Pinkston57 describes some of the most
recent applications that have employed SFC. These include food related separations,
work with natural products and applications in forensic science.58,59
1.4.2 Electrochemical Applications
If electrochemical investigations are to be carried out in a solvent-electrolyte
system the medium must display suitably high conductivity and electrochemical
stability over the potential range of interest. Therefore, to understand voltammetry in
sc fluids it is useful to take conductivity measurements for a range of fluid conditions.
9

CHAPTER 1. Introduction
Most work into electrical conductivity of sc media has focused on aqueous
solutions60'63 and by contrast, the electrical conductivity of electrolytes in non-
aqueous solutions has received relatively little attention.12,64'66 The conductivity of
the medium is important for electrosynthesis but the viscosity of the medium also has
to be considered as this affects the rate of mass transport of an electroactive species to
and from the electrode surface. Supercritical fluids have a low viscosity (Table 1.1),
which leads to enhanced rates of mass transport and therefore their possible
applicability as solvents for electrosynthesis.
Bard and co-workers have performed the most extensive investigations into
electrochemistry in sc media34,35,67'69 employing a number of polar sc solvents such as
acetonitrile (Tc = 547.85 K, pc = 48.3 bar), ammonia (Tc = 406 K, pc = 112.5 bar) and
water (Tc = 645.35 K, pc = 221 bar).
Olsen and Tallman have recently demonstrated that polar halogenated solvents1 7 70can be used for electrochemical investigations in both the liquid and sc states. ’
Their work showed that chlorodifluoromethane (Tc = 406.15 K, pc = 49.7 bar) and
trifluoromethane (Tc = 298.25 K, pc = 47.5 bar) could be made conducting via the19dissolution of tetrabutylammonium tetrafluoroborate (TBABF4). However, because
the dielectric constant is still quite low (s = 2.31) problems with solubility, ion
association and electrolyte adsorption on the electrode surface are still encountered.
From their results they proposed that hydrofluorocarbon solvents would be extremely
promising candidates for use in sc electrochemistry.
Abbott and co-workers have carried out electrochemical investigations using
hydrofluorocarbon solvents,37,65,66 in particular liquid and sc HFC 134a and HFC 32.
In their work they illustrated that these solvents are ideal for electrochemical
investigations in the sc state and that the redox potential of the commonly used
standard solute ferrocene in electrochemical investigations is largely unaffected by
changes in pressure. Results also suggested that ionic atmosphere effects are
insignificant in sc fluids at lower pressures due to low ionic strengths and high ionic
mobilities.
1.4.3 Extraction and Separation Processes
The solubility of compounds in sc fluids has been the most extensively
investigated area of sc fluid research. The solubility is the concentration or mole
10

CHAPTER 1. Introduction
fraction of a substrate in the sc phase when it is in equilibrium with the pure substrate,
at a particular temperature and pressure. Solubility data give an insight into how well
a sc fluid performs as a solvent for a particular solute, which is of key importance in
process design. The solubility of a compound is mainly influenced by its chemical
functionality, nature of the sc fluid solvent, and the operating conditions. Although
the solubility and extractability of a compound in a sc fluid are governed by different
molecular interactions (solute-solvent interactions versus solute-matrix or solute-
solute interactions), knowledge of the solubility of a compound in a sc fluid gives an
indication of the extractability of that compound in that sc solvent.
Solubility data provide important information on the efficacy of separation
between the solute and the sc fluid and therefore the employment of this in
supercritical fluid extraction (SFE), where solvent properties can be tuned to
maximise the solubility of the extract.39,40 An ideal extraction method should be
rapid, simple and inexpensive to perform. It should yield quantitative recovery of the
target analytes without loss or degradation and the sample obtained should be
immediately ready for analysis without additional concentration or fractionation steps.
No additional laboratory wastes should be generated. Liquid solvent extractions fail
to meet a number of these goals but SFE has emerged as a promising tool to overcome
these difficulties.
The SFE literature shows that approximately 98 % of developed applications
have employed CO2 as the extractant. Supercritical CO2 has significant advantages as
it has accessible critical parameters, low toxicity and chemical inertness. However,
the main difficulty in using sc CO2 arises when polar analytes are to be extracted. To
overcome this drawback of CO2 two strategies are employed. The first is to make the
CO2 more polar by adding small amounts of a more polar fluid e.g. methanol and the
second possibility is to use an extractant fluid which is more polar.71
The development of sc fluids for use in extraction processes started in the
1960s primarily in Europe then later in the United States. European researchers
emphasised extraction from botanical substrates, for example, spices,72,73 herbs,74
coffee39,40,75 and tea,39,40,76 using predominately sc CO2 . By the 1980s there were
several large-scale SFE processes in operation in Germany, the United Kingdom and
the United States. The largest of these processes is the decaffeination of coffee and
tea.40 For the decaffeination of coffee the wet green coffee beans are extracted and
for tea the already fermented tea is treated. The extraction of hops is the second
11
CHAPTER 1. Introduction
largest application because nearly all producers of hop extracts have now changed
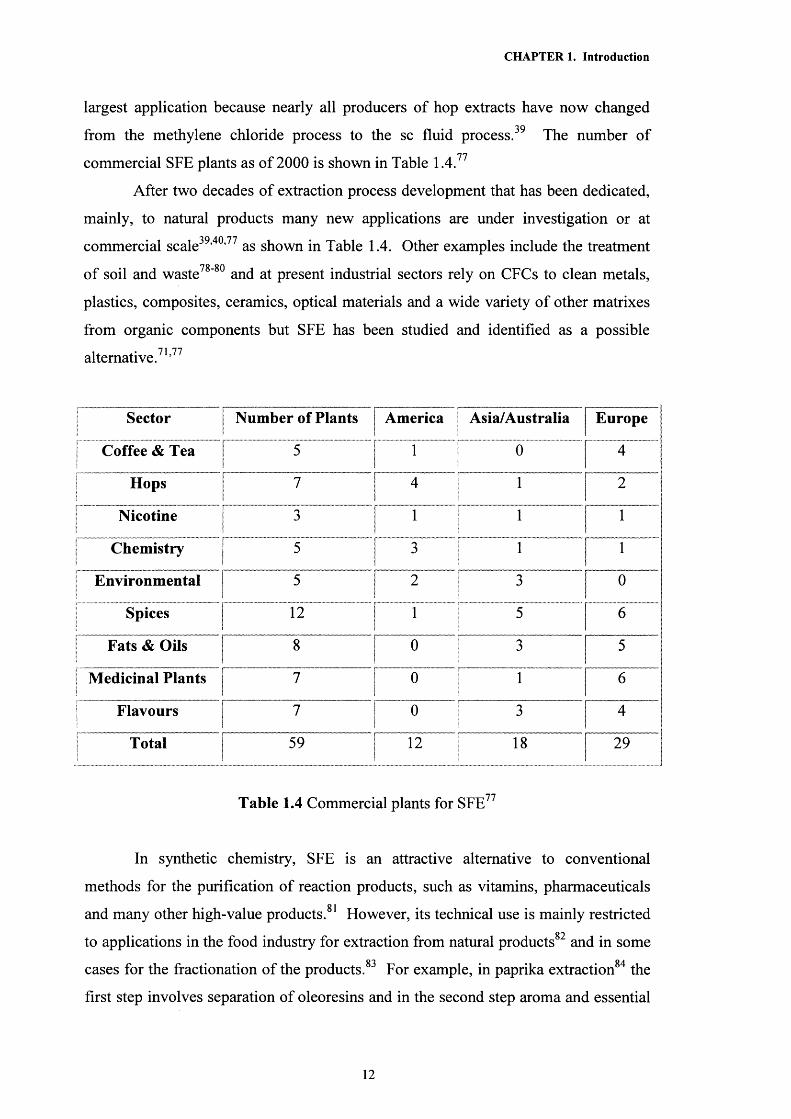
from the methylene chloride process to the sc fluid process. The number of• 77commercial SFE plants as of 2000 is shown in Table 1.4.
After two decades of extraction process development that has been dedicated,
mainly, to natural products many new applications are under investigation or at
commercial scale39,40,77 as shown in Table 1.4. Other examples include the treatment70 O A
of soil and waste ' and at present industrial sectors rely on CFCs to clean metals,
plastics, composites, ceramics, optical materials and a wide variety of other matrixes
from organic components but SFE has been studied and identified as a possible71 77alternative. ’
Sector Number of Plants America Asia/Australia Europe
j Coffee & Tea 5 1 0 4
Hops_
i_
Nicotine 3 1 1 1
Chemistry 5 3 i_
Environmental 5 2 3__
Spices 12 1 5 6
Fats & Oils 8 0 3 5
| Medicinal Plants 7 0 1 6
Flavours 7 0 3 4
Total 59 12 18 29
Table 1.4 Commercial plants for SFE77
In synthetic chemistry, SFE is an attractive alternative to conventional
methods for the purification of reaction products, such as vitamins, pharmaceuticalso 1
and many other high-value products. However, its technical use is mainly restricted
to applications in the food industry for extraction from natural products and in some0 1 * A
cases for the fractionation of the products. For example, in paprika extraction the
first step involves separation of oleoresins and in the second step aroma and essential
12

CHAPTER 1. Introduction
oil. This also occurs in rosemary extraction where the antioxidants are separated from
the aroma and essential oil.85,86
Supercritical fluid extraction is a growing area and too many applications have
been studied to mention here. The main potential areas of interest at present in SFE
are in the purification of polymers, which takes advantage of the different solubilities
of polymers depending on the chain length, and the removal of flame-retardants from
plastic materials, especially electronic parts. Supercritical fluids have also found use
in the textiles industry. They can be used for cleaning, which at present uses
halogenated solvents and also for the dyeing of textiles where the dyestuff is
dissolved in the sc fluid and this mixture penetrates the whole fibre. By controlled07
pressure release the dyestuff remains in and on the fibres.
1.4.4 Chemical Reactions
Another area of interest for sc fluids is their use in the field of reaction
solvents where the range of applications is rapidly widening.41 Excluding the fact that
nature has been doing chemistry in sc H2O in the Earth’s crust for a very long time,
the first reactions observed in sc fluids were reported in the nineteenth century. It was
Baron Cagniard de La Tour who noted in 1822, that near critical water seemed00
particularly reactive. His pioneering work initiated studies of sc fluid reactions
during the next few decades in H2O at temperatures above Tc, as reviewed in great
detail by Morey.89
There are numerous advantages associated with the use of sc fluids in
chemical synthesis, all of which are based on the unique combination of properties of
either the materials themselves or the sc state. A very important incentive for the use
of sc fluids in synthetic chemistry comes from the increasing demand for
environmentally and toxicologically benign processes for the production of high value
chemicals. Many reactions that occur in sc fluids can occur in liquid solvents but
there are considerable examples where the use of a sc fluid can cause the rate of
reaction to increase.41,90,91 Supercritical fluids have a number of unique properties
that may bring about an increase in the rate but it is not always easy to identify the
dominant contributor. In general, the unique combination of gas-like diffusivity and
viscosity, the liquid-like density and the pressure-dependent solvating power and/or
polarity is the fascinating basis for chemical research using sc fluid solvents in
synthesis. These factors account for the unusual reactivity in this media and it should
13

CHAPTER 1. Introduction
be noted that different types of reaction might benefit particularly from a specific
property.
Since 1945 the sc fluid literature has become extensive with a sharp increase
in publications over the last 5 to 10 years. The literature covers a wide range of
reactions including inorganic, organometallic, organic, photochemical, polymerisation
and catalytic.41,92 Even though a wide range of reactions have been studied the
solvent commonly utilised in these reactions is sc CO2 .
A unique sc fluid property is that it has no surface tension and can diffuse
rapidly to occupy the entire volume of a system. This means that if any other gases
are introduced to the system they too will diffuse to fill the entire volume and
therefore the sc fluid and the gases will be totally miscible. Processes such as
hydrogenation,41,92'96 hydroformylation41,92,97,98 and oxidation41,92,99 can take
advantage of the complete miscibility of permanent gases H2, CO, and O2 respectively
in a sc fluid. Rathke et al. who reported the hydroformylation of propylene using scQO #
CO2 observed this advantage. In 1994 Noyori and co-workers reported a
hydrogenation reaction also employing sc CO2.94 Both groups were looking for a
method of avoiding the previously encountered problem of gas-liquid mixing. Noyori
carried out the hydrogenation of CO2 to formic acid using homogeneous ruthenium
(II) phosphine catalysts94 and from this work they found this reaction to be very rapid.
When compared to the same reaction in conventional solvents it was found that the
reaction proceeded 18 times faster in sc CO2 . Since this initial work a number of
research groups have looked into the advantages of carrying out reactions that involve
a gaseous reagent. From this research it has been shown that increased gas miscibility
and the fact that the reaction parameters can be controlled independently give
optimum reaction selectivity, increased reaction rate and very high conversion.41,92,100'102
A number of studies have been devoted to determining the influence of either
bulk or local density variations on stoichiometric reactions.103’105 A classical example
is the Diels-Alder reaction, where the endo/exo and ortho/para selectivity appears to
be controlled to some extent by variation of the bulk density.106'111 Several groups
have investigated these density effects on rates and selectivities where a number of
conflicting results and conclusions have been drawn.41,92,103'111
Paulaitis and Alexander carried out the first Diels-Alder reaction in a sc fluid.
They studied the effect of sc CO2 pressure on the reaction rate of maleic anhydride
14

CHAPTER 1. Introduction
and isoprene.106 This reaction was chosen as the mechanism was thought to be the
same irrespective of the solvent medium. The conclusions drawn from their studies
showed that the reaction rate increased slightly with increasing pressure.
Kim and Johnston took the Diels-Alder reaction a step further and looked at
the product selectivity as a function of sc fluid density.107 They studied the reaction
of cyclopentadiene and methyl acrylate because two isomeric products are formed
(endo and exo). Results showed that the endo selectivity increases with pressure
(density) at constant temperature but at constant pressure the selectivity decreases
with temperature. Their selectivity observations were explained in terms of the
difference in dipole moment of the endo and exo products with the endo being more
polar.
These Diels-Alder reactions were some of the earliest reported synthetic
organic reactions in sc media. Since these pioneering studies, numerous other organic
reactions have been carried out in sc CO2 as reviewed recently by Rayner et a l92
There are too many reactions to discuss in this section and for a more thorough
treatise the readers are directed to other literatures.41,92 Industrial uses of sc fluids as
reaction media are also becoming more prolific and include for example the synthesis
of ammonia, low density polyethylene and the oxidative destruction of chemical
wastes using sc H2O.41
The majority of organic reactions have been carried out in sc CO2 and even
though its numbers are dramatically lower, sc H2O is the second most common sc
solvent. The use of sc solvents for reactions that bridge the gap between non-polar
CO2 and polar H2O are very limited. This is surprising since these medium polarity
solvents may overcome some of the problems encountered with reagent solubility in
sc CO2 and the conditions used will be nowhere near as harsh as those using sc H2O.
Some examples can be found in the literature where more polar solvents than CO2
have been employed and the advantages of these solvents are apparent.
The photodimerisation of isophorone in sc fluoroform (CHF3) and CO2 is
reported by Johnston et al. as a function of pressure.112 This reaction produces three
isomeric products, one being polar and two being relatively non-polar. Their
investigation looked at the selectivity of the products formed and compared the results
of the two fluids. In the more polar sc CHF3, where its dielectric constant changes
with pressure the product ratio was found to be dependent on pressure. However, in
15

CHAPTER 1. Introduction
sc CO2 the product ratio was independent of pressure and the product ratio was found
to be lower (0.1:1 compared to 1:1 in sc CHF3).
Fox and co-workers demonstrated that the rate of the Michael addition of
piperidine to methyl propiolate in sc CHF3 and non-polar sc ethane depends on fluid1 n
density. They saw a difference in the observed rate constants between the two
solvents that was attributed to the reaction’s dependence on the solvent dielectric
constant. The reaction proceeds through a highly polar transition state, which would
be consistent with better stabilisation by the more polar solvent sc CHF3.
Other reactions have been carried out in medium polarity sc media and
examples include the polymerisation of methyl methacrylate in sc HFC 32,114
catalytic cyclopropanation in sc CHF3 115 and an aldol reaction in sc CHF3 .116 In these
reactions the pressure dependency of the dielectric constant was found to influence
reaction rates, mechanisms and selectivities.
16

CHAPTER 1. Introduction
1.5 References
(1) Laider K. Chemical Kinetics, 3 ed.; Harper Collins Publishers: New York,
1987.
(2) Hannay J, B.; Hogart J. Proc. R. Soc. London 1879, 29, 324.
(3) Stanley H, E. Phase Transitions and Critical Phenomena; Clarendon press:
Oxford, 1987.
(4) van Wase U.; Swaid I.; Schneider G, M. Angew. Chem. Int. Ed. Engl. 1980,
19, 575.
(5) http ://www. chem. leeds. ac.uk/People/CMR/.
(6) Savage P, F.; Goplan S.; Mizan T, I.; Martino C, J.; Brook E, E. AIChE J.
1995,41, 1723.
(7) Reid R, C.; Prausnitz J, M.; Poling B, E. The Properties o f Gases and Liquids,
4 ed.; McGraw-Hill: New York, 1987.
(8) Vermilyea D, A.; Indig M, E. J. Electrochem. Soc. 1972,119, 39.
(9) Bartle K, D.; Clifford A, A.; Jafar S, A.; Shilstone G, F. J. Phys. Chem. Ref.
Data 1991,20,1X3.
(10) Yonker C, R.; Futakami M.; Kobayashi T.; Yamasaki K. J. Phys. Chem. 1986,
90, 3022.
(11) Kajimoto O.; Futakami M.; Kobayashi T.; Yamasaki K. J. Phys. Chem. 1988,
92, 1347.
(12) Olsen S, A.; Tallman D, E. Anal. Chem. 1996, 68, 2054.
(13) Meyer C, W.; Morrison G. J. Phys. Chem. 1991, 95, 3860.
(14) Meyer C, W.; Morrison G. J. Chem. Eng. Data 1991, 36, 409.
(15) Ravishankara A, R. Science 1994, 263, 71.
(16) http://www.afeas.org.
(17) Frank H; Christoph E, H.; Holm-Hansen O; Bullister J, L. Environ. Sci.
Technol. 2002, 36, 12.
(18) Noakes T. J. Fluor. Chem. 2002,118, 35.
(19) Corr S. J. Fluor. Chem. 2002,118, 55.
(20) Anitescu G.; Tavlarides L, L. J. Supercrit. Fluids 1991,11,31.
(21) Anitescu G.; Tavlarides L, L. J. Supercrit. Fluids 1999,14, 197.
(22) Foster N, R.; Singh H.; Yun J, S, L.; Tomasko D, L.; MacNaughton S, J. Ind.
Eng. Chem. Res. 1993, 32, 2849.
17

CHAPTER 1. Introduction
(23) Abbott A, P.; Eardley C, A. J. Phys. Chem. B 1998,102, 8574.
(24) Abbott A, P.; Eardley C, A.; Tooth R, J. J. Chem. Eng. Data 1999, 44, 112.
(25) Abbott A, P.; Eardley C, A. J. Phys. Chem. B 1999,103, 2504.
(26) Tillner-Roth R.; Baehr H, D. J. Phys. Chem. Ref. Data 1994, 23, 657.
(27) Tillner-Roth R.; Yokozeki A. J. Phys. Chem. Ref. Data 1997, 26, 1273.
(28) Wilde P. WO 9824517 1998.
(29) Handley A, J.; Clarke R, D.; Powell R, L. US 5824225 1998.
(30) Cantrell G, O.; Blackwell J, A. J. Chromatogr. A 1997, 782, 231.
(31) Vayisoglu-Giray E, S.; Johnson B, R.; Frere B, G, A, M.; Bartle K, D.;
Clifford A, A. Fuel 1998, 77, 1533.
(32) Yonker C, R.; Wright B, W.; Udseth H, R.; Smith R, D. Ber. Bunsen-Ges.
Phys. Chem. 1984, 88, 908.
(33) Wright B, W.; Smith, R. D. Chromatographia 1984,18, 542.
(34) Crooks R, M.; Fan F, F.; Bard A, J. J. Am. Chem. Soc. 1984,106, 6581.
(35) Crooks R, M.; Bard A, J. J. Electroanal. Chem. 1988, 243, 117.
(36) Philips M, E.; Deakin M, R.; Novotny M, V.; Wightman R, M. J. Phys. Chem.
1987, 91, 3934.
(37) Abbott A, P.; Eardley C, A.; Harper J, C.; Hope E, G. J. Electroanal. Chem.
1998, 457, 1.
(38) Abbott A, P.; Harper J, C. Phys. Chem. Chem. Phys. 1999,1, 839.
(39) Taylor L, T. Supercritical Fluid Extraction-, J. Wiley & Sons: New York,
1996.
(40) McHugh M.; Krakonis V, J. Supercritical Fluid Extraction, 2 ed.;
Butterworth-Heinemann: Boston, 1994.
(41) Jessop P, G.; Leitner W. Chemical Synthesis using Supercritical Fluids',
Wiley-VCH: Weinheim, 1999.
(42) Klesper E.; Corwin A, H.; Turner D, A. J. Org. Chem. 1962, 27, 700.
(43) Conaway J, E.; Graham J, A.; Rogers L, B. J. Chromatogr. Sci 1978,16, 102.
(44) Smith R, M. Supercritical Fluid Chromatography; Royal Society of
Chemistry: London, 1988.
(45) Hupe K, P.; McNair H, M.; Kok W, T.; Bruin G, J.; Poppe H.; Poole C.;
Chester T, L.; Wimalasena R, L.; Wilson G, S. LC-G C1992,10, 211.
(46) Grob K. J. High. Res. Chromatogr. 1983, 6, 178.
(47) Wheeler J, R.; McNally M, E. J. Chromatogr. 1987, 410, 343.
18
CHAPTER 1. Introduction
(48) Wu N.; Chen Z.; Medina J, C.; Bradshaw J, S.; Lee M, L. J. Microcolumn Sep.
2000,12, 454.
(49) Pyo D. Microchem. J. 2001, 68, 183.
(50) Gritti F.; Felix G.; Archard M-F.; Hardouin F. Chromatographia 2001, 53,
201 .
(51) Brenner B, A. Anal Chem. 1998, 70, 4594.
(52) Schmitz F, P.; Klesper E. Polymer Bulletin 1981,14, 679.
(53) Schmitz F, P. Polymer Comm. 1983, 24, 142.
(54) Jackson W, P.; Markides K, E.; Lee M, L. J. High Resolut. Chromatogr.,
Chromatogr. Comm. 1986, 9, 213.
(55) Brooks M, W.; Uden P, C. J. Chromatogr. 1993, 637, 179.
(56) Namiesnik J.; Gorecki T. JPC-J. Planar Chromat-Mod. TLC 2000,13, 404.
(57) Chester T, L.; Pinkston J, D. Anal. Chem. 2002, 74, 2801.
(58) Radcliffe C.; Maguire K.; Lockwood B. J. Biochem. Biophys. Methods 2000,
43, 261.
(59) McAvoy Y.; Dost K.; Jones D, C.; Cole M, D.; George M, W.; Davidson G.
Forensic Science International 1999, 99, 123.
(60) Franck E, U. Z. Phys. Chem., N. F. 1956, 8, 92.
(61) Quist A, S.; Marshall W, L. J. Phys. Chem. 1965, 69, 2984.
(62) Yeatts L, B.; Dunn L, A.; Marshall W, L. J. Phys. Chem. 1971, 75, 1099.
(63) Marshall W, L. J. Chem. Eng. Data 1987, 32, 221.
(64) Abbott A, P.; Harper J, C. J. Chem. Soc., Faraday Trans. 1996, 92, 3895.
(65) Abbott A, P.; Eardley C, A. J. Phys. Chem. B 2000,104, 9351.
(6 6 ) Abbott A, P.; Durling N, E. Phys. Chem. Chem. Phys. 2001, 3, 579.
(67) McDonald A, C.; Fan F, F.; Bard A, J. J. Phys. Chem. 1986, 90, 796.
(6 8 ) Cabrera C, R.; Bard A, J. J. Electroanal. Chem. 1989, 273, 147.
(69) Bard A, J.; Faulkner L, R. Electrochemical Methods', Wiley: New York, 1980.
(70) Olsen S, A.; Tallman D, E. Anal. Chem. 1994, 66, 503.
(71) Gamse T.; Marr R. Preceedings o f the 2nd European School on Industrial
Applications o f Supercritical State Fluid Technology 2001, Barcelona, April
2 .
(72) Illes V.; Daood H, G.; Biacs P, A.; Gnayfeed M, H.; Meszaros B. J.
Chromatogr. Sci 1999, 37, 345.
(73) Lack E.; Seidlitz H. Process Technol. Proc. 1996, 12, 253.
19
CHAPTER 1. Introduction
(74) Ma X.; Yu X.; Zheng Z.; Mao J. Chromatographia 1991, 32, 40.
(75) Dean J, R.; Liu B.; Ludkin E. Methods Biotecnol. 2000,13, 17.
(76) Chang C, J.; Chiu K-L.; Chen Y-L. Food Chem. 1999, 68, 109.
(77) Gamse T. High Pressure Chemical Engineering Summer School 2002,
Graz/Maribor, June 27th.
(78) Misch B.; Firus A.; Brunner G. J. Supercrit. Fluids 2000,17, 221.
(79) Sahle-Demessie E. Environ. Technol. 2000, 21, 447.
(80) Laitnen A.; Michaux A.; Aaltanen O. Environ. Technol. 1994,15, 715.
(81) Chester T, L.; Pinkston J, D.; Raynie D, E. Anal. Chem. 1998, 70, 301.
(82) Steytler D. Sep. Processes Food Biotechnol. Ind. 1996, 17.
(83) Zosel K. Angew. Chem. Int. Ed. Engl. 1978,17, 702.
(84) Vesper H.; Nitz S. Adv. FoodSci. 1997,17, 172.
(85) Senorans F, J.; Ibanez E.; Cavero S.; Tabera J.; Reglero G. J. Chromatogr. A
2000,870, 491.
(8 6 ) Tena M, T.; Valcorcel M.; Hidalgo P, J.; Ubera J, L. Anal. Chem 1997, 69,
521.
(87) Montero G, A.; Smith C, B.; Hendrix W, A.; Butcher D, L. Ind. Eng. Chem.
Res. 2000, 39, 4806.
(8 8 ) Cagniard de la Tour C. Ann. Chim. Phys. 1822, 21, 178.
(89) Morey G, W.; Niggli P, J. J. Am. Chem. Soc 1913, 35, 1086.
(90) King J, W.; Holliday R, L.; List G, R.; Sisyder J, M. J. Amer. Oil Chem. Soc.
2001, 78, 107.
(91) Lin B,; Akgerman A. Ind. Eng. Chem. Res. 2001, 40, 1113.
(92) Oakes S, R.; Clifford A, A.; Raynor C, M. J. Chem. Soc. Perkin Trans. 2001,
1, 917.
(93) Jessop P, G.; Hsiao Y.; Ikariya T.; Noyori R. J. Am. Chem. Soc. 1996, 118,
344.
(94) Jessop P, G.; Ikariya T.; Noyori R. Nature 1994, 368, 231.
(95) Tsang C, Y.; Streett W, B. Chem. Eng. Sci. 1981, 36, 993.
(96) Xiao .J; Nefkens S, C, A.; Jessop P, G.; Ikariya T.; Noyori R. Tetrahedron
Lett. 1996,57, 2813.
(97) Koch D.; Leitner W. J. Am. Chem. Soc 1998,120, 13398.
(98) Rathke J, W.; Klingler R, J.; Krause T, R. Organometallics 1991,10, 1350.
(99) Nelson W, M.; Puri I, K. Ind. Eng. Chem. Res. 1997, 36, 3446.
20
CHAPTER 1. Introduction
100) Jessop P, G.; Hsiao Y.; Ikariya T.; Noyori R. J. Am. Chem. Soc. 1994, 116,
8851.
101) Hitzler M, G.; Smail F, R.; Ross S, K.; Poliakoff M. Org. Proc. Res. Dev.
1998, 2, 137.
102) Hitzler M, G.; Poliakoff M. J. Chem. Soc., Chem. Comm. 1997, 1667.
103) Thompson R, L.; Glaser R.; Bush D.; Liotta C, L.; Eckert C, A. Ind. Eng.
Chem. Res. 1999, 38, 4220.
104) Reaves J, T.; Roberts C, B. J. Chem. Soc., Chem. Eng. Comm. 1999,171, 117.
105) Dillow A, K.; Brown J, S.; Liotta C, L.; Eckert C, A. J. Phys. Chem. A 1998,
102, 7609.
106) Paulaitis M, E.; Alexander G, C. Pure Appl. Chem. 1987, 59, 61.
107) Kim S.; Johnston K, P. J. Chem. Soc., Chem. Eng. Comm. 1988, 63, 49.
108) Ikushima Y.; SaitaN.; Arai M.; Blanch H, W. J. Phys. Chem. 1995, 99, 8941.
109) Isaacs N, S.; Keating N. J. Chem. Soc., Chem. Comm. 1992, 876.
110) Weinstein R, D.; Renslo A, R.; Vanheiser R, L.; Hams J, G.; Terter J, W. J.
Phys. Chem. 1996,100, 12337.
111) Korzenski M, B.; Kalis J, W. Tetrahedron Lett. 1997, 38, 5611.
112) Hmjez B, J.; Mehta A, J.; Fox M, A.; Johnston K, P. J. Am. Chem. Soc. 1989,
111, 2662.
113) Rhodes T, A.; O'Shea K.; Bennett G.; Johnston K, P.; Fox M, A. J. Phys.
Chem. 1995, 99, 9903.
114) Abbott A, P.; Durling N, E.; Hope E, G.; Lange S.; Vakusic S. in press 2003.
115) Wynne D, C.; Jessop P, G. Angew. Chem. Int. Ed. Engl. 1999, 38, 1143.
116) Mikami K.; Matsukawa S.; Kayaki Y.; Ikariya T. Tetrahedron Lett. 2000, 41,
1931.
21

EXPERIMENTAL
2.1 Materials
2.1.1 Solvents
2.1.2 Solutes
2.1.3 Extraction Capsules
2.1.4 Solvatochromic Probes
2.2 Instrumentation
2.2.1 High Pressure Apparatus
2.2.2 Capacitance Cell
2.2.3 Optical Cell
2.3 Experimental Measurements
2.3.1 Solubility Measurements
2.3.2 Extraction Technique
2.3.3 Solvatochromic Measurements
2.3.4 Reaction Kinetics Measurements
2.4 Reactions
2.4.1 Friedel-Crafts Alkylation
2.4.2 Esterification
2.4.3 Aldol Condensation
2.5 References
CHAPTER 2. Experimental
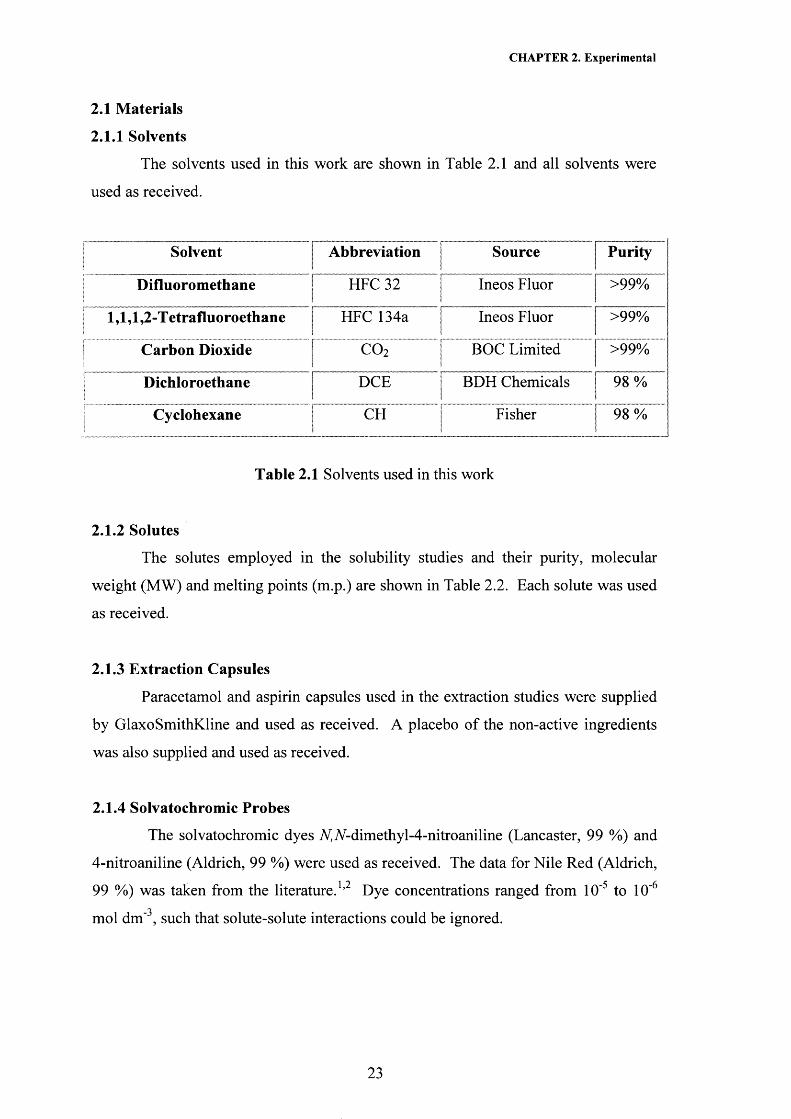
2.1 Materials
2.1.1 Solvents
The solvents used in this work are shown in Table 2.1 and all solvents were
used as received.
Solvent 1 Abbreviation | Source Purity
Difluoromethane |~ HFC 32 | Ineos Fluor >99%
l,l»l»2-Tetrafluoroethane | HFC 134a | Ineos Fluori
>99%
Carbon Dioxide [ c o 2 | BOC Limitedj
>99%
Dichloroethane I DCE ! BDH Chemicals 98%
Cyclohexane___
i Fisherj_ _ _
Table 2.1 Solvents used in this work
2.1.2 Solutes
The solutes employed in the solubility studies and their purity, molecular
weight (MW) and melting points (m.p.) are shown in Table 2.2. Each solute was used
as received.
2.1.3 Extraction Capsules
Paracetamol and aspirin capsules used in the extraction studies were supplied
by GlaxoSmithKline and used as received. A placebo of the non-active ingredients
was also supplied and used as received.
2.1.4 Solvatochromic Probes
The solvatochromic dyes A,A-dimethyl-4-nitroaniline (Lancaster, 99 %) and
4-nitroaniline (Aldrich, 99 %) were used as received. The data for Nile Red (Aldrich,1 9 S f \99 %) was taken from the literature. ’ Dye concentrations ranged from 10' to 10'
mol dm' , such that solute-solute interactions could be ignored.
23

CHAPTER 2. Experimental
Solutes [ Company1
Purity % MW m.p. °C
Naphthalene j Fisons 98 128.17 80-82
Anthracene f BDH Chemicals Ltd 97 178.23 216-218
0-hydroxybenzoic acid j Fisons 97 138.13 158-160
w-hydroxybenzoic acid j BDH Chemicals Ltd 98 138.13 201-203
/7-hydroxybenzoic acid | BDH Chemicals Ltd 98 138.13 215-217
p-toluic acid 1 Aldrichj 98 136.15 180-182
/ 7-aminobenzoic acid | BDH Chemicals Ltd 98 137.14 187-189
/7-chlorobenzoic acid | Aldrich 99 156.57 239-241
0-chlorobenzoic acid 1 Aldrich1 98 156.57 138-140
p-aminophenol | BDH Chemicals Ltd 98 109.13 188-190
/7-chlorophenol | BDH Chemicals Ltd 98 128.56 43-45
/7-acetamidophenol j Aldrich 98 151.17 169-172
Acetyl salicylic acid ] BDH Chemicals Ltd 98 180.16 138-140
Table 2.2 Properties of the solutes employed in the solubility studies
2.2 Instrumentation
2.2.1 High Pressure Apparatus
A schematic of the high-pressure apparatus is shown in Figure 2.1. The
reaction vessel was constructed from 316 stainless steel and was rated to 1 .5 kbar.
The internal volume of the cell, lined with a layer of Teflon (1 mm thick), was 24.73 •cm . An o-ring covered in Teflon was used to provide a high-pressure seal between
the head and base of the cell and the electrical feedthroughs (RS Components Ltd.)
employed were sealed with swagelok fittings. Prior to each experiment the cell was
purged with the appropriate gas. The pressure was then applied using a model 10-500
pump (Hydraulic Engineering Corp.; Los Angeles, CA) driven by compressed air and
retained at a given value (± 2 bar) using a UCC type PGE 1001.600 manometer. The
temperature of the cell was measured using an iron/constantan thermocouple, the tip
of which was in contact with the solvent close to the centre of the cell. This was held
at a given value (± 0.5 K) using a CAL 9900 controlled heater.
24

CHAPTER 2. Experimental
Reactionvessel
Doser
Electricalconnections sealed with Torrseal /
Figure 2.1 High Pressure Apparatus
25

CHAPTER 2. Experimental
2.2.2 Capacitance Cell
The cell consists of two rectangular stainless steel plates, (attached to the# 'j
electrical feedthroughs) with an area of 6 . 6 cm , held 1 mm apart by Teflon spacers as
shown in the enlargement in Figure 2.1. The dielectric constant, £, was measured in
this capacitance cell with capacitance Co such that the measured capacitance was
given by
C = sCq (2.1)
Cell capacitances were measured at 65 kHz with a 20 mV ac voltage amplitude using
a 1254 frequency response analyser and a 1286 potentiostat (both Solartron
Instruments) controlled by ZPLOT software. The acquired data were analysed using
ZVIEW software. The cell geometrical capacitance was 14.6 pF. The uncertainty of
each capacitance measurement was 50 fF. The capacitor was tested with several pure
solvents of known dielectric constant including acetonitrile, dichloromethane, acetone
and toluene where the dielectric constant was found to vary by no more than 1 % from
literature values. The dielectric constant was calculated from the average cell
capacitance obtained from five experimental runs.
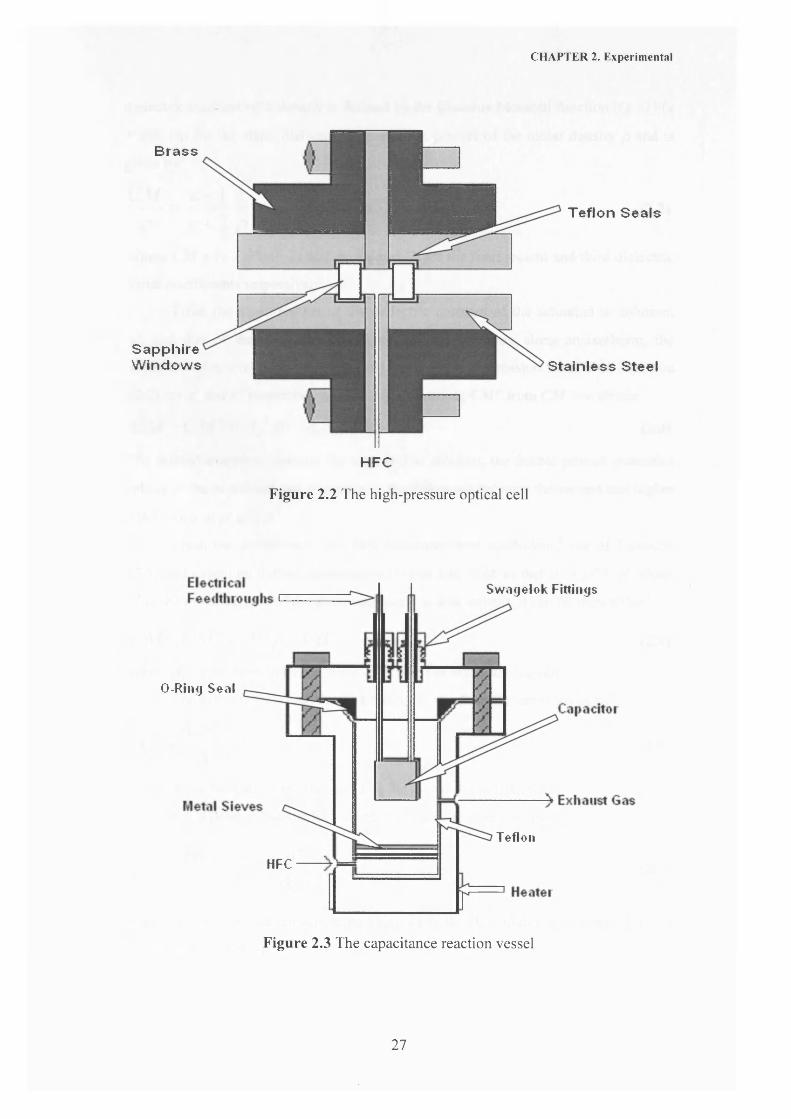
2.2.3 Optical Cell
A Shimadzu Model UV-1601 Spectrophotometer was used to measure the
solvatochromic shift of 4-nitroaniline and N, A-dimethyl-4-nitroaniline in the visible
absorbance region. The optical high-pressure cell is shown in Figure 2.2. This cell
was constructed from brass and 316 stainless steel with 1 cm thick sapphire windows.
The gas seals were made from Teflon. The cell path length was 1 cm and the cell
volume was 1 cm . Light was fed into and out of the high-pressure cell by fibre-optic
cables (Hellma, Mullheim, FRG) fitted with a 662 QX prism adapter.
2.3 Experimental Measurements
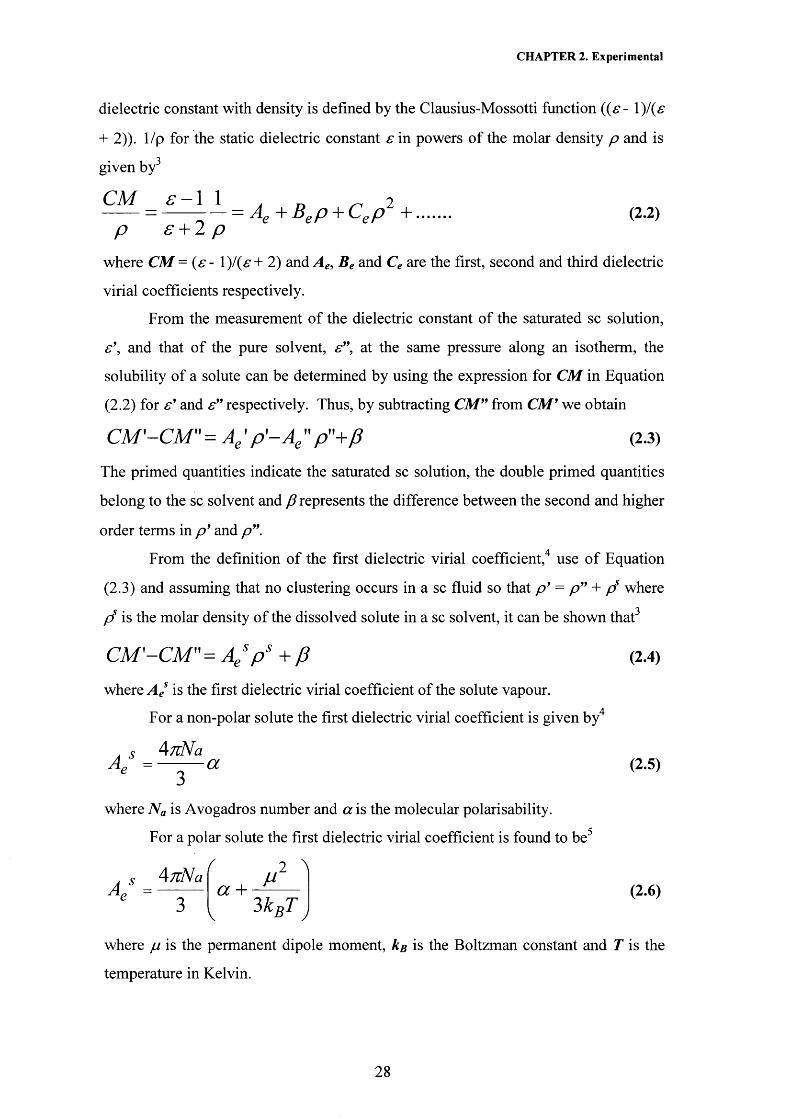
2.3.1 Solubility Measurements
The cell shown in Figure 2.3 was used to carry out solubility measurements. Excess
solute was loaded into the reaction vessel and placed between the two metal sieves.
The capacitance was measured as described in section 2.2.2 as a function of pressure
at constant temperature. The solubility of solid solutes in a sc fluid is found by
converting capacitance values to dielectric constant values. This change in
26
CHAPTER 2. Experimental
Brass
SapphireWindows
Teflon Seals
Stainless Steel
HFC
Figure 2.2 The high-pressure optical cell
Sw agelok Fittings
O-Ring Seal
Tefleii
HFC
Figure 2.3 The capacitance reaction vessel
27
CHAPTER 2. Experimental
dielectric constant with density is defined by the Clausius-Mossotti function ((£- 1 )/(e
+ 2 )). 1/p for the static dielectric constant £ in powers of the molar density p and is■j
given by
CM s - 1 1 . D _ 2 = -------- - = Ae +Bep + Cep + .......... (2.2)
P £ + 2 pwhere CM = (e - l)/(£ + 2) and A e, Be and Ce are the first, second and third dielectric
virial coefficients respectively.
From the measurement of the dielectric constant of the saturated sc solution,
s \ and that of the pure solvent, £”, at the same pressure along an isotherm, the
solubility of a solute can be determined by using the expression for CM in Equation
(2.2) for £’ and £” respectively. Thus, by subtracting CM” from CM’ we obtain
CM'-CM" = Ae' p '-A e " p"+p (2.3)
The primed quantities indicate the saturated sc solution, the double primed quantities
belong to the sc solvent and p represents the difference between the second and higher
order terms in p ’ and p ”.
From the definition of the first dielectric virial coefficient,4 use of Equation
(2.3) and assuming that no clustering occurs in a sc fluid so that p ’ = p ” + f? where
P is the molar density of the dissolved solute in a sc solvent, it can be shown that3
CM'-CM"= A / p s + p (2.4)
where A es is the first dielectric virial coefficient of the solute vapour.
For a non-polar solute the first dielectric virial coefficient is given by4
. 5 A nN aAp = a (2.5)3
where N a is Avogadros number and a is the molecular polarisability.
For a polar solute the first dielectric virial coefficient is found to be5
( .2 \s \7zN aA e = (X +
v 3 k B T )(2.6)
where p is the permanent dipole moment, Ab is the Boltzman constant and T is the
temperature in Kelvin.
28

CHAPTER 2. Experimental
Equation (2.4) then gives the working relation for the solubility determination,
which is
where (fi/Af) is the correction to the solubility ps arising from the difference (CM 9-
CM ”) and relative to the difference of the higher order terms p ' and p ”.
2.3.2 Extraction Technique
The capsule to be extracted from was placed in the bottom of the reaction
vessel shown in Figure 2.1 and trapped by a metal sieve. Extraction was left to occur
for a given length of time at the desired temperature and pressure. Trapping of the
extract takes place by rapid depressurisation into the autoclave shown in Figure 2.1.
The extract was then analysed by GC-MS (Perkin Elmer)
2.3.3 Solvatochromic Measurements
The optical cell shown in Figure 2.2 was used to measure the solvatochromic
shift of two indicator dyes at various temperatures and pressures. A small amount of
the desired dye was loaded into the cell and subsequently heated and pressurised to
the desired conditions. The system was left to equilibrate for 15 minutes then
absorbance spectra were taken as described in section 2.2.3. The wavelength of
absorbance maximum was calculated from the average of five spectra.
2.3.4 Reaction Kinetics Measurements
The apparatus shown in Figure 2.1 was used to measure the capacitance of a
number of the reactions described in section 2.4. The technique for carrying out these
reactions is described in section 2.4. Whilst the reaction system was left to react for
the desired time, capacitance readings were taken at specific intervals by the
technique described in section 2.2.2. The changes in capacitance and hence the
dielectric constant of the reaction with time could then be calculated. On analysis of
the reactants and products as described in section 2.4 the change in concentration of
the reactants/products with time can be deduced and reaction kinetics obtained.
pCM'-CM" fi
(2.7)
29

CHAPTER 2. Experimental
2.4 Reactions
2.4.1 Friedel-Crafts Alkylation
The apparatus shown in Figure 2.1 was used to carry out the Friedel-Crafts
alkylation of anisole (Aldrich, 99 %) and toluene (Fisher, 98 %) using 2-methyl-2-
propanol (ter/-butylchloride) (Aldrich, 99.5 %) or 2-chloro-2-methylpropane (BDH,
99 %) with jP-toluenesulphonic acid monohydrate (Lancaster, 98 %) as the acid
catalyst. The reactants were placed into the doser and the acid catalyst in the reaction
vessel. This was then heated to the desired temperature and subsequently pressurised
pushing the reactants from the doser into the reaction vessel. The system was left to
react for the desired time and where applicable capacitance measurements were taken
(section 2.3.4). The products were trapped by depressurisation into a larger volume
autoclave, which also stopped the reaction and the products were analysed by GC-MS
(Perkin Elmer).
2.4.2 Esterification
The esterification of benzoic acid (Scientific & Chemical Supplies Ltd, 98 %)
with 1-butanol (Fisher, 98 %) using /7-toluenesulphonic acid as the catalyst was
carried out. The apparatus and technique is described in section 2.4.1.
2.4.3 Aldol Condensation
The acid catalysed aldol condensation of cyclohexanone (Aldrich, 98 %) was
carried out using the technique described in section 2.4.1 once again employing p-
toluenesulphonic acid as the catalyst.
30
CHAPTER 2. Experimental
2.5 References
(1) Abbott A, P.; Eardley C, A. J. Phys. Chem. B 1998,102, 8574.
(2) Abbott A, P.; Eardley C, A. J. Phys. Chem. B 1999,103, 2504.
(3) Hourri A.; St-Amaud J, M.; Bose T, K. Rev. Sci. Instru. 1998, 69, 2732.
(4) Hourri A.; St-Amaud J, M.; Bose T, K. J. Chem. Phys. 1997,106, 1780.
(5) Barao T.; Nieto de Castro C, A.; Mardolcar U, V.; Okambawa R.; St-Amaud
J, M. J. Chem. Eng. Data 1995, 40, 1242.
31

SOLUBILITY RELATIONS AND
MODELLING IN SUPERCRITICAL
DIFLUOROMETHANE
3.1 Introduction
3.1.1 Solubility in Supercritical Fluids
3.1.2 Measurement Techniques
3.1.3 Solubility Modelling
3.2 Results and Discussion
3.2.1 Solubility of Solids in Supercritical HFC 32
3.2.2 Modelling Solubility in Supercritical HFC 32
3.2.3 Extraction using Supercritical HFC 32
3.3 Conclusions
3.4 References
CHAPTER 3. Solubility Relations and Modelling in Supercritical Difluoromethane
3.1 Introduction
The knowledge of the solubility of a substance in a supercritical (sc) fluid is
essential for the feasibility study or the design efficiency of any sc fluid extraction
process or chemical reaction. A suitable experimental technique for the measurement
of the solubility of organic compounds in sc fluids needs to be fast, simple and
precise. The most common methods employed to date for measuring solubilities are
gravimetric, chromatographic and spectroscopic techniques but each of these methods
has limitations.
This work looks to assess the validity of a recently proposed dielectric method
for the measurement of solubilities in sc fluids. Previous research employing
dielectrometry has shown it to be a quick, simple and precise in situ method for the
measurement of solubilities. 1 The scope of the dielectrometry technique is also
assessed in this work by measuring the solubilities of a wide range of polar and non
polar solutes in sc CO2 and in the more polar fluid HFC 32.
This work reports the first measured solubilities of organic solutes in sc HFC
32 at 363 K employing the dielectrometry method. Supercritical HFC 32 is used in
this work due to its higher dielectric constant compared to that of sc CO2 . The higher
polarity of HFC 32 should result in higher solubilities of polar solutes than in CO2,
making HFC 32 an attractive replacement solvent for use in sc fluid applications
involving polar compounds such as extraction and as a solvent in chemical reactions.
3.1.1 Solubility in Supercritical Fluids
Solubility is amongst the most important physicochemical properties of
solutes dissolved in sc fluids. On one hand knowledge of it is essential to determine if
substances can be processed using sc fluids and on the other it gives valuable
information about the solute-solvent interactions in solution.2 Solubility data are
typically presented in the form of solubility isotherms, where it is readily apparent
that solubility increases rapidly at low pressures around the critical pressure, whereas
at higher pressures the increase in solubility is less pronounced. The shape of the
solubility isotherm reflects changes in the density with pressure.
The ability of a sc fluid to dissolve solids was first reported more than 100
years ago by Hannay and Hogarth,3 who studied the solubility of inorganic salts in sc
ethanol. Subsequent work by Buckner in 19064 showed that the solubility of organic
solutes in sc CO2 was orders of magnitude higher than that predicted by vapour
33

CHAPTER 3. Solubility Relations and Modelling in Supercritical Difluoromethane
pressure considerations. Since then, the interest in the quantitative determination of
solubility has increased continuously. Several substances have been employed as sc
fluids in order to carry out different processes although sc CO2 is by far the most
frequently used. Over the last few decades, the solubilities of solids and liquids in sc'y c o
fluids have been measured extensively, ’ ’ with work up to 1989 being reviewed by
Bartle et al.9
Solubility measurements of compounds in sc HFCs are very limited. Stahl
and co-workers determined solubilities of different alkaloids in sc N2O, CO2 and
CHF3 .10 Their results showed that the solubility of these alkaloids was higher in
CHF3 than the other solvents. Taylor et al. measured the solubility of two sulphur
containing analytes in sc CO2, CHF3 and HFC 134a.11 Results showed that both
analytes had much higher solubilities in HFC 134a than in the other two solvents.
Recently, it has been highlighted by Abbott et al. that HFC 134a is a relatively polar
solvent, even in the sc state, which may enhance the solubility of polar solutes. 12’14
Therefore, the increased solubility in HFC 134a may be a consequence of the higher
dielectric constant of the medium. Water solubility has also been measured in sc HFC
134a by the use of near IR spectroscopy. 15
A significant problem associated with the wide spread use of these HFC fluids
in the sc state is the lack of solubility data. To begin to overcome this problem this
work measures the first solubilities in sc HFC 32 for a variety of substituted aromatic
hydrocarbons at 363 K and a variety of pressures.
3.1.2 M easurement Techniques
The experimental methods most frequently employed to measure the solubility
of substances in sc fluids are gravimetric, chromatographic and spectroscopic, of1 f \ 17 I Swhich the gravimetric method developed by Eckert, Paulaitis, Reid and their co
workers in the late 1970s is most widely used. Of these methods spectroscopic
techniques give the most meaningful data but they can only be used if the solute has
one or more absorption bands in the UV/VIS/IR wavelength ranges, which can be
used to determine its concentration. Implementation of these techniques meets certain
experimental difficulties, as relatively small changes in pressure frequently vary the
solubility by several orders of magnitude, which complicates measurements. At
concentrations above 1 0 ' 1 mol dm'3 and in the case of turbid or opaque solutions,
optical techniques are inapplicable and other less accurate gravimetric methods will
34

CHAPTER 3. Solubility Relations and Modelling in Supercritical Difluoromethane
have to be employed. The choice of an adequate experimental method for the
determination of solubility in a sc fluid is therefore important.
In the late 1990s it was proposed that dielectrometry could be used to measure
the solubility of polar solutes in sc fluids. 1,19,20 Polar solutes cause a change in the
dielectric constant, s, of the medium and the extent of this dielectric constant change
with respect to the pure solute (at the same temperature and pressure) can be related to
the solute concentration and hence its solubility. This technique has the advantage• • • • l 'lthat it can be used when solubilities are high (> 1 0 ' mol dm' ) or if the solution is
turbid. It is also simple to use, inexpensive and permits direct in situ measurements of
solute solubility in sc fluids.
To date this dielectrometry technique has only been applied in a few cases for
solubility measurements in sc CO2 . Fedotov et al. initially measured the solubility of
numerous polar compounds in sc CO2 including acetonitrile, acetone and manganese
cyclopentadienyltricarbonyl as a function of pressure. 19,20 Then later Hourri and co
workers measured the solubility of naphthalene in sc CO2 as a function of temperature
and pressure to assess the validity of the technique by comparing their results to
published data. 1 They found that their results agreed to better than 4 % of those
published previously.
As sc CO2 is a non-polar solvent the use of this technique may be rather
limited because the low solubility of polar solutes means that the overall change in the
dielectric constant is relatively small. In the current work it is demonstrated that this
method is ideal for use with HFC fluids where the dielectric constant change is
considerably larger.
3.1.3 Solubility Modelling
As stated earlier, solubility is one of the most important physicochemical
properties of solutes dissolved in sc fluids. Knowledge of solubility is essential to
determine whether substances can be processed using sc fluids and it gives valuable
information about solute-solvent interactions in solution. An important solute
property that significantly affects solubility is its vapour pressure. The enhancement
factor, E , is often used instead of solubility giving
^ 2 = £ — (3-DP
35
CHAPTER 3. Solubility Relations and Modelling in Supercritical Difluoromethane
The enhancement factor represents the solubility increase in the sc solvent over that in
the ideal gas mixture, p 2 is the vapour pressure of the pure solid, p is the system21pressure and y 2 is the observed solubility.
Numerous solubility measurements for a number of solutes in different sc
fluids have been carried out. The fact that solubility is a function of the sc fluid, the
solute, the temperature, and the pressure translates into a demand for experimental
data. To reduce this demand several procedures have been adopted to describe and
correlate solubility (or enhancement factor) of solutes in sc fluids and their changes
with temperature and density. Equations of state (EOS) are frequently employed to
describe the change of solubilities with the thermodynamic parameters.
Cubic EOS are often used to describe the solubility at different temperatures
and pressures but the main limitation of these is the need to describe a combining rule
which can be used to express the mixture parameters. The application of simple virial
EOS has proved successful at representing the dependence of the solubility of the
solutes on the thermodynamic variables.22,23 It has been proposed that the spread of
the electrostatic potential on the solutes surface may be a relevant quantity to predict
the solubility of solids in sc fluids.24 This basic procedure only seems to describe the
solubility fundamentally in terms of the changes of the vapour pressure of the pure
solute. Recently, a few laboratories have developed more general thermodynamic9 S 9 f \methods to describe and predict the equilibrium properties of binary solutions. ’
There are several theories to predict the solubility of solutes in sc fluids but
still cubic EOS are the most commonly employed. An example is the Redlich-Kwong97 •EOS but densities at high pressure are the weak point of this. The Guigard-Stiver
EOS introduced a density-dependent solute solubility parameter, which requires the
critical pressure and density of the sc fluid, as well as the solutes melting point, liquid9 8molar volume and enthalpy of fusion. However, if the solute properties are
unknown the most widely used technique for correlating sc fluid solubilities is that9 0proposed by Chrastil. On the other hand if the solute properties are known the
Peng-Robinson (PR) EOS is the most widely used.30 The PR EOS is
D R T <>{T )P = -------------- 7--------- — ,--------r (3.2)v - b v(v + b ) + b ( v - b )
where v is the molar volume, a accounts for intermolecular interactions between the
species in the mixture, and b accounts for size differences between the species of the
36

CHAPTER 3. Solubility Relations and Modelling in Supercritical Difluoromethane
mixture. The pure component parameters a and b can be expressed in terms of the
critical temperature, Tc, and pressure, p c, of the pure substance. So for the PR
equation
The quantity a is taken to be temperature dependent and is determined from pure
component vapour pressures. The main problem associated with solid-fluid phase
equilibrium calculations using the PR EOS is the lack of known vapour pressures of
the relatively non-volatile solids. The a values determined from vapour pressures of
saturated liquids are generally not suitable for extrapolation to the sublimation curve,
or suitable for the solvent in the sc region.21
As binary systems are being used it is necessary to define the relationship
between the EOS parameters for the pure component and for the mixtures, that is, the
dependence of the mixture parameters on the composition. The conventional mixing
rules frequently employed are the quadratic mixing rules, where
where an and bt are the pure component parameters and kij is an adjustable binary
interaction parameter, which in general must be determined from experimental data.
The proper choice of mixing rules for the determination of mixing parameters is very
important in phase equilibrium calculations, especially if the solutions are highly
asymmetric. The quadratic mixing rules are simple but often inadequate for
asymmetric, polar components and mixtures, but a number of more complex rules are
available in the literature.31,32
0.45724fl2r 2 1a - (3.3)
and
b = - — — Pc
0.07780R TC(3.4)
(3.5)' J
and
b = Y y ibi (3.6)
and the combining rule for a# is given by
(3.7)
37
CHAPTER 3. Solubility Relations and Modelling in Supercritical Difluoromethane
3.2 Results and Discussion
3.2.1 Solubility of Solids in Supercritical HFC 32
To gain an appreciation of the factors that affect the solubility of a compound,
the solubility of a wide range of solutes had to be measured whereby the identities of
the solutes are changed systematically. To achieve this, the organic solutes employed
in these studies were derived from either a benzoic acid or a phenolic backbone.
For each different solubility study involving a compound with a benzoic acid
backbone a different functional group was added to the para position. The affect of
the functional group on solubility could then be assessed. Solubility measurement
involving the phenol backbone followed the same procedure, whereby, for each
different study a different functional group was present at the para position. The
measured solubilities for this wide range of aromatic derivatives could then be
compared as a function of the polarity of the functional group. A broad understanding
of the factors that affect solubility in HFC 32 should then be achieved.
Firstly, before any new solubility measurements were obtained it was
necessary to test the reliability of the dielectrometry technique. Measuring the
solubility of known solutes and comparing the results to published data tested this
reliability. The solubility of naphthalene was measured in sc CO2 at 318 K and a
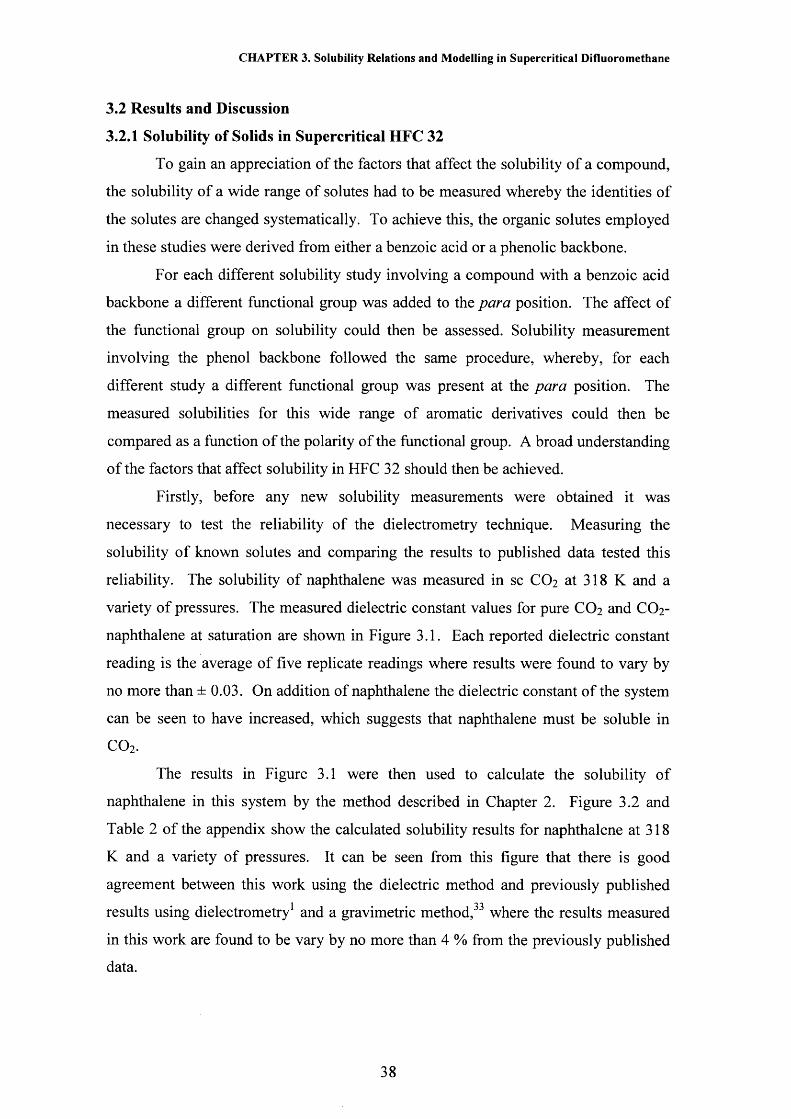
variety of pressures. The measured dielectric constant values for pure CO2 and CO2-
naphthalene at saturation are shown in Figure 3.1. Each reported dielectric constant
reading is the average of five replicate readings where results were found to vary by
no more than ± 0.03. On addition of naphthalene the dielectric constant of the system
can be seen to have increased, which suggests that naphthalene must be soluble in
C 0 2.
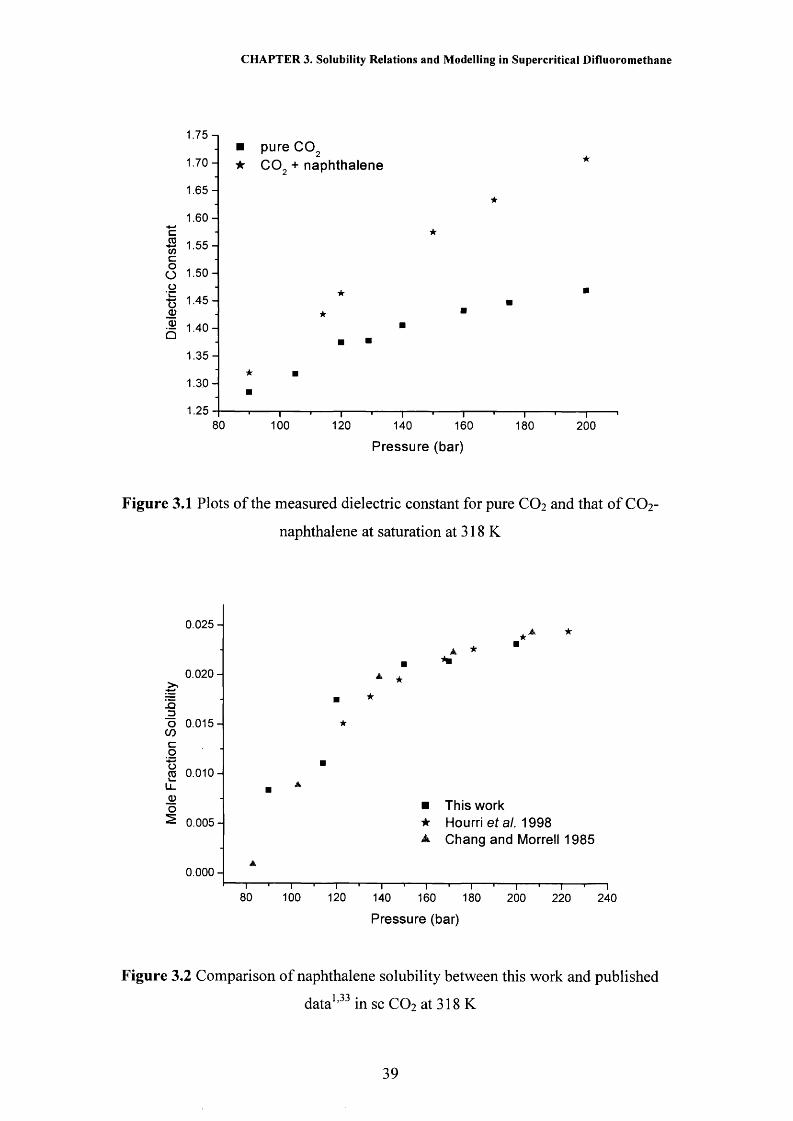
The results in Figure 3.1 were then used to calculate the solubility of
naphthalene in this system by the method described in Chapter 2. Figure 3.2 and
Table 2 of the appendix show the calculated solubility results for naphthalene at 318
K and a variety of pressures. It can be seen from this figure that there is good
agreement between this work using the dielectric method and previously published
results using dielectrometry1 and a gravimetric method,33 where the results measured
in this work are found to be vary by no more than 4 % from the previously published
data.
38
CHAPTER 3. Solubility Relations and Modelling in Supercritical Difluoromethane
cCO -«—■ co c: o O o
‘i_o0)0)b
1.75-1
1.70-
1 .65-
1 .60-
1.55-
1 .50-
1 .45-
1 .40-
1.35-
1.30-
1.25
■ pure C 0 2 ★ CO. + naphthalene
80 100 120 140 160
Pressure (bar)
180 200
Figure 3.1 Plots of the measured dielectric constant for pure CO2 and that of CO2-
naphthalene at saturation at 318 K
0.025 -
0.020 -
-Q 3O 0.015 -| CO c o2 0.010 H
LL Q)O^ 0.005 -J
0 . 0 0 0 -
A *
■ This work ★ Hourri et al. 1998 A Chang and Morrell 1985
i80
l 1 l 1 1100 120 140
I160 180 200 220 240
Pressure (bar)
Figure 3.2 Comparison of naphthalene solubility between this work and published
data1,33 in sc CO2 at 318 K
39

CHAPTER 3. Solubility Relations and Modelling in Supercritical Difluoromethane
The reliability of this technique for measuring the solubility of liquid solutes
was then tested using water in HFC 134a along three isotherms at a variety of
pressures. The results at 383 K were compared to the data published by Jackson et
al. 15 Their initial work on water solubility in HFC 134a at 383 K has been extended
here to measure the water solubility at 343 and 363 K. The measured dielectric
constant for the three isotherms for pure HFC 134a and HFC 134a-water at saturation
are shown in Figure 3.3. The change in dielectric constant on addition of water is
only small indicating that water solubility in this solvent is low, which is what would
be expected for highly polar water in a lower polarity solvent.
The experimentally calculated solubilities for water in HFC 134a are shown in
Figure 3.4 and Tables 3 to 5 in the appendix. From this plot it can be seen that there
is good agreement between this work and published data. Also as the temperature and
pressure increase water solubility increases, which is what is expected due to vapour
pressure and density considerations.
To calculate solubilities in HFC 32 the dielectric constant of the pure solvent
needs to be found over the temperature and pressure range of interest. Figure 3.5
shows the dielectric constant of HFC 32 at 363 K as a function of pressure. The
dielectric constant is considerably higher than that for CO2 at similar temperatures and
pressures (s < 2 ) and there is a large change in the dielectric constant with increasing
pressure, especially around the critical point, where there is a large change in the
density. The greater dielectric constant value of HFC 32 indicates that HFC 32 is a
more polar solvent than CO2, which means that the solubility of polar solutes in this
medium should be greater.
Tables 6 to 17 of the appendix show the first solubility measurements in sc
HFC 32 at 363 K over a range of pressures for the solutes shown in section 2.1.2.
Figures 3.6 and 3.7 are compiled from this data, comparing the effect of substituent
on para substituted benzoic acids and phenols respectively. The values used in
Equation (2.7) for the dielectric constant from five replicate measurements are found
to vary by no more than ± 0.005 which results in the mole fraction solubility
fluctuating by no more than ± 2 % . Further uncertainty arises in the mole fraction
solubility value from the calculation of the first dielectric virial coefficient. The
molecular polarisabilities used in Equation (2.5) to calculate the first dielectric virial
40

CHAPTER 3. Solubility Relations and Modelling in Supercritical Difluoromethane
8.0
7 .5 -
7 .0 -
Jj 6.5 H to
O 6.0 H
° 5 5 -
b 5 .0-
4 .5 -
4.0
A
pure HFC 134a at 343 K pure HFC 134a at 363 K pure HFC 134a at 383 K HFC 134a-water at 343 K HFC 134a-water at 363 K HFC 134a-water at 383 K
60I
80 100I—
120 140 160“ I—180 200 220
Pressure (bar)
Figure 3.3 Plots of the measured dielectric constant of pure HFC 134a and that of
HFC 134a-water at saturation along three isotherms
XIJDoCOcooro
0.022 -i
0 .020 -
0.018-
0.016-
0.014-
0 .0 1 2 -
0 .0 1 0 -
0.008 -
0.006 -
0.004 -
0.002 -
0.000 -
-0.002
★A▼
383 K383 K (Jackson et a/. 1995) 363 K 343 K
▼ ▼
_i—r60 80 100 120 140 160 180 200 220 240 260 280 300
Pressure (bar)
Figure 3.4 Comparison of water solubility between this work and published data15 in
HFC 134a along three isotherms
41
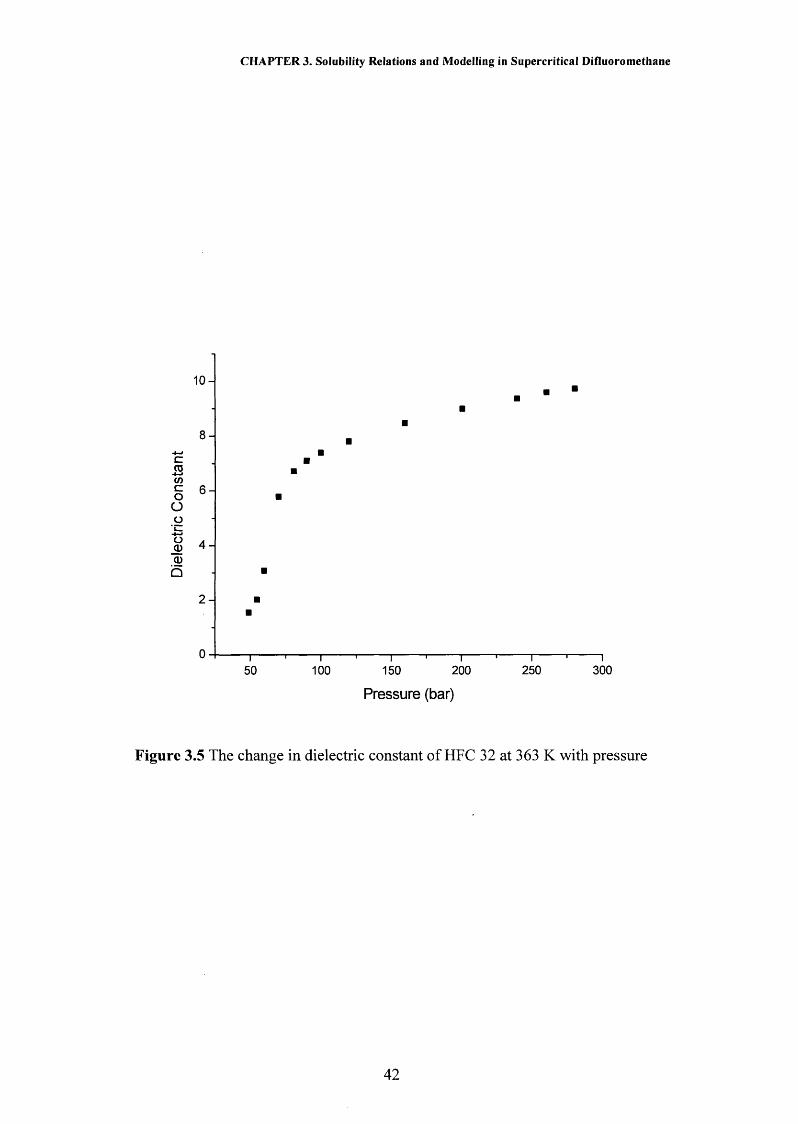
Diel
ectri
c C
onst
ant
CHAPTER 3. Solubility Relations and Modelling in Supercritical Difluoromethane
10 -
8 -
6 -
4 -
2 -
- l ----------- 1----------- 1----------- '----------- 1----------- 1----------- 1----------- '----------- 1----------- '----------- 1
50 100 150 200 250 300
Pressure (bar)
Figure 3.5 The change in dielectric constant of HFC 32 at 363 K with pressure
42

CHAPTER 3. Solubility Relations and Modelling in Supercritical Difluoromethane
coefficient were taken from the literature34 or calculated via an additive method that35was introduced by Le Fevre.
The uncertainty in the molecular polarisability value is unknown but if a
theoretical maximum uncertainty of 5 % is assumed then the mole fraction solubility
is found to fluctuate by no more than ± 0.5 %. For polar solutes the molecular
polarisability34,35 and permanent dipole moment values36 are needed to calculate the
first dielectric virial coefficient from Equation (2.6). In this equation the molecular
polarisability is found to be insignificant and the dipole moment value dominates the
first dielectric virial coefficient. If a theoretical 5 % uncertainty is taken in both these
properties the error in the mole fraction solubility is found to increase to ± 6 %.
Actual uncertainties are likely to be less but ± 0.5 % and ± 6 % must be taken as the
maximum error limits for the non-polar and polar solutes respectively. The maximum
errors will result in a fluctuation of the last mole fraction solubility significant figure
shown in the tables in the appendix. The molecular polarisability, dipole moment and
first dielectric virial coefficient values for each of the solutes used in this work are
shown in Table 1 of the appendix.
In Figures 3.6 and 3.7 the mole fraction solubility is found to increase with
increasing pressure for all solutes studied and the solubility is greatly affected by the
polarity of the substituent present. For both the benzoic acids and the phenols it can
be seen that solubility decreases with the increasing polarity of the substituent. It has
been noted previously that the presence of a carboxy group causes a decrease inT7solubility. This is illustrated here by comparison of Figures 3.6 and 3.7 where it can
be observed that the solubility of phenols is approximately two orders of magnitude
greater than the corresponding benzoic acids.
For all solutes, the solubility increase with applied pressure, at values above
the critical point, shows approximate linearity. For the solutes where solubility
measurements have been taken at low pressures it can be seen that the solubility
decreases as the pressure approaches the critical value. This observation is consistent
with previously published solubility results9 and is thought to be due to the decrease
in dielectric constant in this region, which corresponds to the region of high fluid
compressibility. 14
Figure 3.8 is compiled from the results given in Tables 6 to 8 of the appendix
for the solubilities of ortho-, met a- and />ara-hydroxybenzoic acid (HBA). The
solubility results for the HBAs measured by Krukonis et al.3S in sc CO2 at similar
43

CHAPTER 3. Solubility Relations and Modelling in Supercritical Difluoromethane
0.01 -
_Q
OCOCo
'*->oro
1E-3-
■ p-hydroxybenzoic acid• p-aminobenzoic acid ^ p-chlorobenzoic acid★ p-toluic acid
1E-4-
I60
— |— i— |— i— |— i— |— i— |— i— |— i— |— i— |— i— |— i— |
80 100 120 140 160 180 200 220 240 260
Pressure (bar)
Figure 3.6 Effect of substituent on benzoic acid solubility in sc HFC 32 at 363K
0.01 -
X I
O CO§ 1E-3 oCO
0)o
1E-4-■ p-hydroxybenzoic acid• p-ami nophenol a p-chlorophenol★ p-acetamidophenol
— i— i— i— i— i— i— i— i— i— i— i— i— i— i— i— i— i— i— i— i— i— i— |—
60 80 100 120 140 160 180 200 220 240 260 280
Pressure (bar)
Figure 3.7 Effect of substituent on phenol solubility in sc HFC 32 at 363K
44

Mole
Fr
actio
n So
lubi
lity
CHAPTER 3. Solubility Relations and Modelling in Supercritical Difluoromethane
1E-3-— • -----
— o- HBA in HFC 32 m-HBA
A p-HBA —T ~ o-HBA in C 0 2 i
m-HBA — p- HBA <
1E-4 -
1E-5-
100 250 300 35050 150 200 400
Pressure (bar)
Figure 3.8 Comparison of the solubility of HBAs in sc HFC 32 at 363 K and sc CO2
at 373 K
45
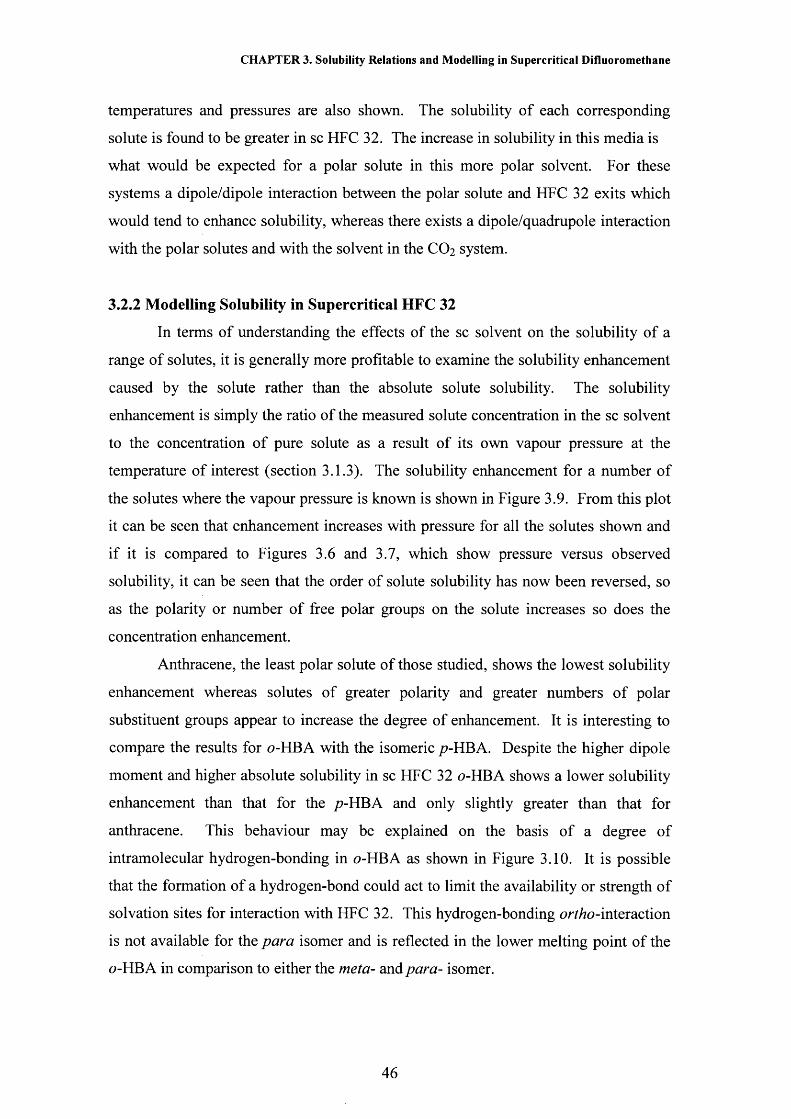
CHAPTER 3. Solubility Relations and Modelling in Supercritical Difluoromethane
temperatures and pressures are also shown. The solubility of each corresponding
solute is found to be greater in sc HFC 32. The increase in solubility in this media is
what would be expected for a polar solute in this more polar solvent. For these
systems a dipole/dipole interaction between the polar solute and HFC 32 exits which
would tend to enhance solubility, whereas there exists a dipole/quadrupole interaction
with the polar solutes and with the solvent in the CO2 system.
3.2.2 Modelling Solubility in Supercritical HFC 32
In terms of understanding the effects of the sc solvent on the solubility of a
range of solutes, it is generally more profitable to examine the solubility enhancement
caused by the solute rather than the absolute solute solubility. The solubility
enhancement is simply the ratio of the measured solute concentration in the sc solvent
to the concentration of pure solute as a result of its own vapour pressure at the
temperature of interest (section 3.1.3). The solubility enhancement for a number of
the solutes where the vapour pressure is known is shown in Figure 3.9. From this plot
it can be seen that enhancement increases with pressure for all the solutes shown and
if it is compared to Figures 3.6 and 3.7, which show pressure versus observed
solubility, it can be seen that the order of solute solubility has now been reversed, so
as the polarity or number of free polar groups on the solute increases so does the
concentration enhancement.
Anthracene, the least polar solute of those studied, shows the lowest solubility
enhancement whereas solutes of greater polarity and greater numbers of polar
substituent groups appear to increase the degree of enhancement. It is interesting to
compare the results for o-HBA with the isomeric /?-HBA. Despite the higher dipole
moment and higher absolute solubility in sc HFC 32 o-HBA shows a lower solubility
enhancement than that for the /?-HBA and only slightly greater than that for
anthracene. This behaviour may be explained on the basis of a degree of
intramolecular hydrogen-bonding in o-HBA as shown in Figure 3.10. It is possible
that the formation of a hydrogen-bond could act to limit the availability or strength of
solvation sites for interaction with HFC 32. This hydrogen-bonding or/7zo-interaction
is not available for the para isomer and is reflected in the lower melting point of the
o-HBA in comparison to either the meta- and para- isomer.
46

Enh
ance
men
t F
acto
r
CHAPTER 3. Solubility Relations and Modelling in Supercritical Difluoromethane
100000-
10000 -
___
— Anthracene -★ — p-ami nophenol
a p-chlorophenol — p-toluic acid
♦ o-HBA* p-HBA
A A.....A ...
1000 -
100 - —I— I— I— i— I— I— I— I— I— I— I— I— I— I— I— I— I— I— I— I— I
80 100 120 140 160 180 200 220 240 260 28060
Pressure (bar)
Figure 3.9 Relationship between concentration enhancement and pressure for some of
the solutes studied in HFC 32 at 363K
47
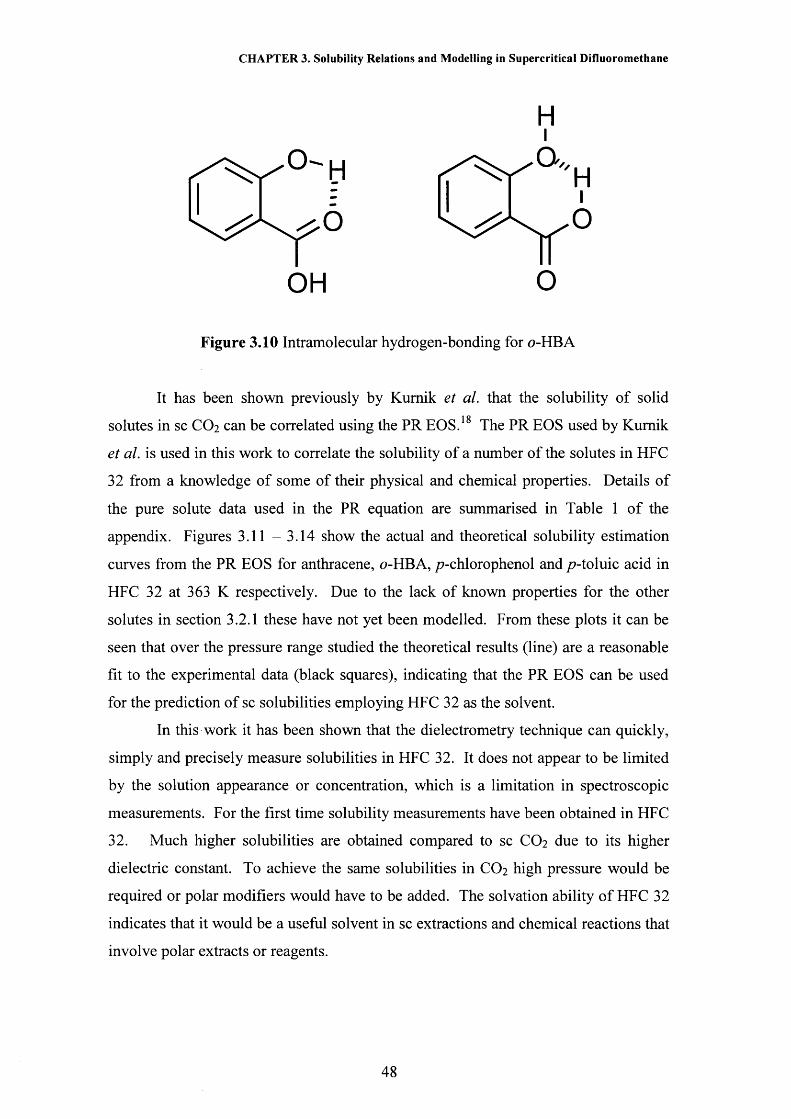
CHAPTER 3. Solubility Relations and Modelling in Supercritical Difluoromethane
H
Hi
o
OH O
Figure 3.10 Intramolecular hydrogen-bonding for o-HBA
It has been shown previously by Kumik et al. that the solubility of solid
solutes in sc CO2 can be correlated using the PR EOS. 18 The PR EOS used by Kumik
32 from a knowledge of some of their physical and chemical properties. Details of
the pure solute data used in the PR equation are summarised in Table 1 of the
appendix. Figures 3.11 - 3.14 show the actual and theoretical solubility estimation
curves from the PR EOS for anthracene, o-HBA, /?-chlorophenol and /?-toluic acid in
HFC 32 at 363 K respectively. Due to the lack of known properties for the other
solutes in section 3.2.1 these have not yet been modelled. From these plots it can be
seen that over the pressure range studied the theoretical results (line) are a reasonable
fit to the experimental data (black squares), indicating that the PR EOS can be used
for the prediction of sc solubilities employing HFC 32 as the solvent.
In this work it has been shown that the dielectrometry technique can quickly,
simply and precisely measure solubilities in HFC 32. It does not appear to be limited
by the solution appearance or concentration, which is a limitation in spectroscopic
measurements. For the first time solubility measurements have been obtained in HFC
32. Much higher solubilities are obtained compared to sc CO2 due to its higher
dielectric constant. To achieve the same solubilities in CO2 high pressure would be
required or polar modifiers would have to be added. The solvation ability of HFC 32
indicates that it would be a useful solvent in sc extractions and chemical reactions that
involve polar extracts or reagents.
et al. is used in this work to correlate the solubility of a number of the solutes in HFC
48

CHAPTER 3. Solubility Relations and Modelling in Supercritical Difluoromethane
1E-3
1E-4cooCOu_0)o
1E-550 100 150 200 250 300
Pressure (bar)
Figure 3.11 Comparison of experimental and theoretical data for anthracene in HFC
32 at 363 K
0.01
-Q
OCOc 1E-3- oOCO1_
U_0)O
E-450 100 150 200 250 300
Pressure (bar)
Figure 3.12 Comparison of experimental and theoretical data for o-HBA in HFC 32
at 363 K
49
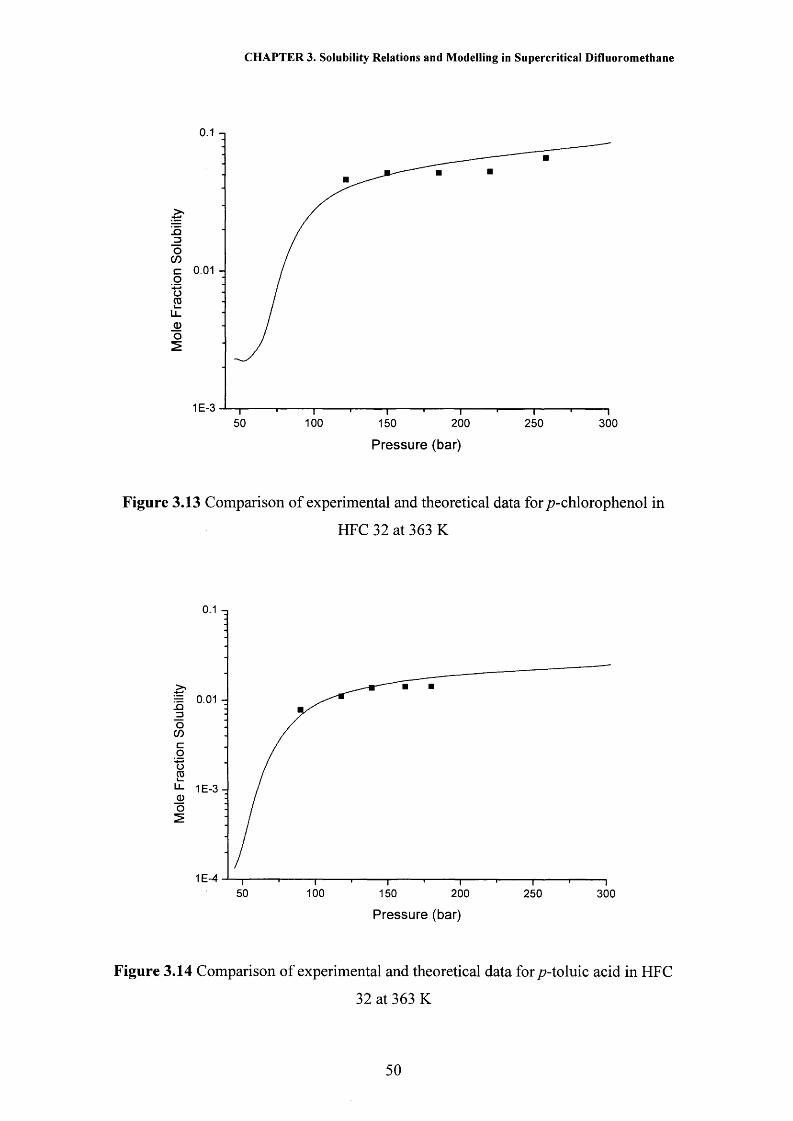
CHAPTER 3. Solubility Relations and Modelling in Supercritical Difluoromethane
JDOCOc 0.01 - ooCDu_
1E-320050 100 150 250 300
Pressure (bar)
Figure 3.13 Comparison of experimental and theoretical data for p-chlorophenol in
HFC 32 at 363 K
0.01
-4—«oCDi_
L l_0O
1E-3
1E-410050 150 200 250 300
Pressure (bar)
Figure 3.14 Comparison of experimental and theoretical data for /?-toluic acid in HFC
32 at 363 K
50

CHAPTER 3. Solubility Relations and Modelling in Supercritical Difluoromethane
3.2.3 Extraction using Supercritical HFC 32
The knowledge of the solubility of solutes in sc fluids is crucial if extraction is
to be carried out. High solubilities are not necessary but some finite solubility is
required to cause extraction. This work looks to assess the use of sc HFC 32 as an
extraction fluid to overcome some of the problems faced by GlaxoSmithKline® with
the extraction of the active ingredients from paracetamol and aspirin capsules. The
main issue at present is that the capsule material is resistant to attack by a number of
liquid organic solvents employed by GlaxoSmithKline®, therefore, impeding
extraction. The advantage of using HFC 32 for this extraction may arise from its high
solubilising power and ability to plasticise and expand the pill coating. The pill
coating may then rupture and release the active ingredients for extraction and analysis.
By placing a capsule in the high-pressure optical cell it was observed that
swelling of the coating occurs after about 30 minutes, depending on pressure. The
swelling continued for a further 30 minutes until the coating was ruptured releasing
the ingredients. A test extraction on the placebo of the tablets was carried out to
assess whether the sc fluid was extracting the non-active ingredients as well as the
active ones. It was found that none of the ingredients in the placebo were soluble in
the sc solvent, which makes for a cleaner analysis.
Knowledge of the actual solubilities of the active ingredients, paracetamol and
aspirin, under the extraction conditions is necessary. The solubility of paracetamol
and aspirin has been measured in HFC 32 at 363 K as a function of pressure and
results are shown in Tables 16 and 17 of the appendix. Figure 3.15 displays the mole
fraction solubility results for these two solutes. As expected the mole fraction
solubility increases with increasing pressure with a rapid increase around the critical
pressure. It can also be seen that the mole fraction solubility of aspirin is
approximately an order of magnitude greater than that for paracetamol.
Extraction results from the paracetamol and aspirin capsules using HFC 32 at
363 K are shown in Tables 18 to 20 of the appendix. Experiments using CO2 under
similar conditions are also shown for comparison. After extraction, analysis showed
that HFC 32, under the conditions studied, selectively extracted the paracetamol or the
aspirin from the corresponding capsule. When CO2 was employed it was found that a
small amount of caffeine was extracted from both capsules.
51
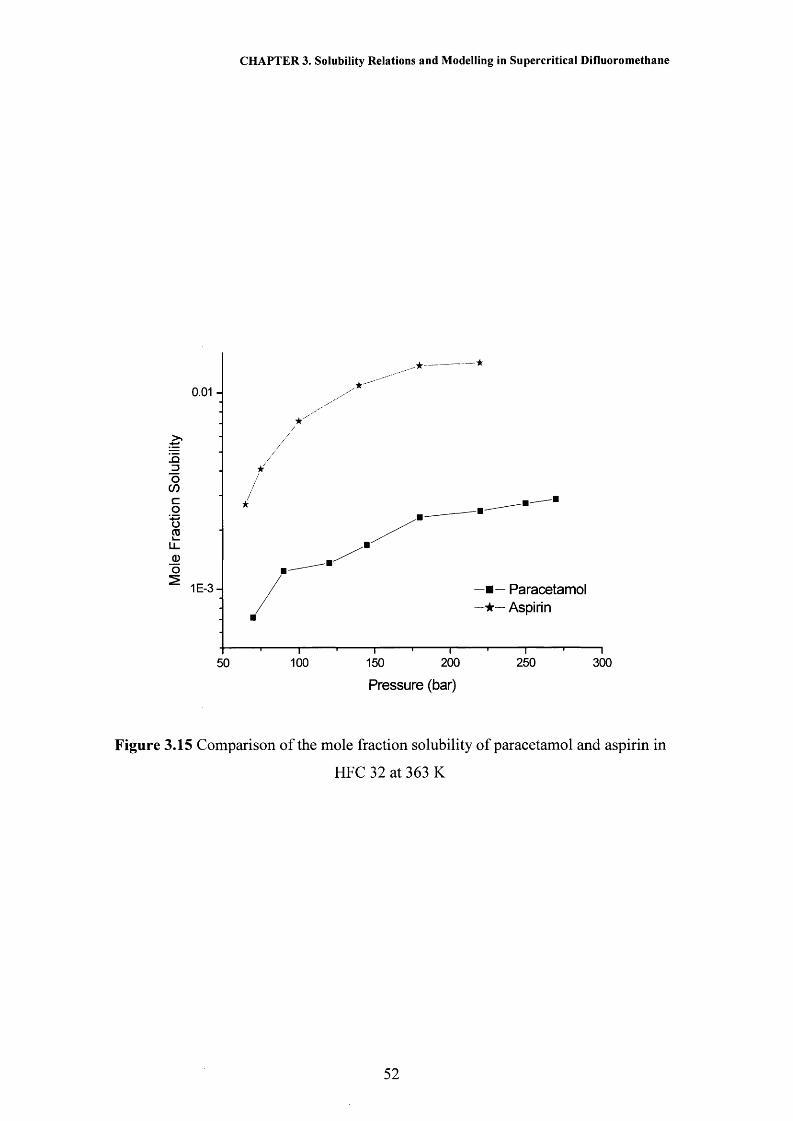
CHAPTER 3. Solubility Relations and Modelling in Supercritical Difluoromethane
0.01 -
-t—>
oroLL0O
1E-3- ■ Paracetamol — Aspirin
200 250 300100 15050
Pressure (bar)
Figure 3.15 Comparison of the mole fraction solubility of paracetamol and aspirin in
HFC 32 at 363 K
52

CHAPTER 3. Solubility Relations and Modelling in Supercritical Difluoromethane
Figure 3.16 compares the extraction of paracetamol and aspirin as a function
of time using HFC 32 at 363 K and 200 ± 20 bar. The amount of aspirin extracted
over all time lengths is greater than that for paracetamol, which is expected from the
actual solubility of each of these solutes in HFC 32. For both analytes an initial rapid
rise in the amount of extract is observed which tails off as the time is increased
further. Over the time length studied in this work it appears that extraction is still not
complete and the analyte is still being extracted, albeit slowly.
If the amount of analyte extracted is compared to the its actual solubility under
the same conditions (paracetamol solubility at 220 bar is 0.040342 mol L' 1 and the
amount extracted at 220 bar after 4 hours is 0.004391 mol L '1; aspirin solubility at 180
bar is 0.212019 mol L' 1 and the amount extracted at 190 bar after 2 hours is 0.016716
mol L '1) it can be seen that the amount extracted is about an order of magnitude lower.
This result indicates that it is not just the solubility of an analyte that governs the
extraction process but this also depends on other factors such as the analyte-matrix
interaction, analyte location within the matrix and the porosity of the matrix. When
considering these other factors the initial rise in Figure 3.16 can be thought of
including any effects arising from solubility limitations i.e. the removal of analyte
from the outer matrix surfaces where diffusion and extraction will be rapid. The
levelling out of the curve is indicative of extraction from deeper within the matrix,
which is most time consuming.
Figure 3.16 also shows a few experimental points using sc CO2 as the
extraction solvent at 363 K and 200 ± 10 bar. The amount extracted for both analytes
in CO2 is considerably less than the corresponding analyte in HFC 32. This is due
partly to the fact that CO2 is less polar than HFC 32 so its ability to placticise and
expand the capsule coating is reduced. Using the optical cell to inspect the swelling
of the capsule it was noted that it took approximately twice as long for the pill coating
to rupture compared to HFC 32 at similar temperatures and pressures. Secondly, the
non-polar nature of CO2 will result in a lower actual solubility of these relatively polar
active ingredients compared to HFC 32. The lower polarity of CO2 may also have an
influence on matrix effects.
Aspirin extraction after two hours as a function of pressure was also measured
in HFC 32 at 363 K. Results are shown in Table 20 of the appendix and in Figure
3.17. It can be seen that extraction increases with pressure, which is to be expected as
53
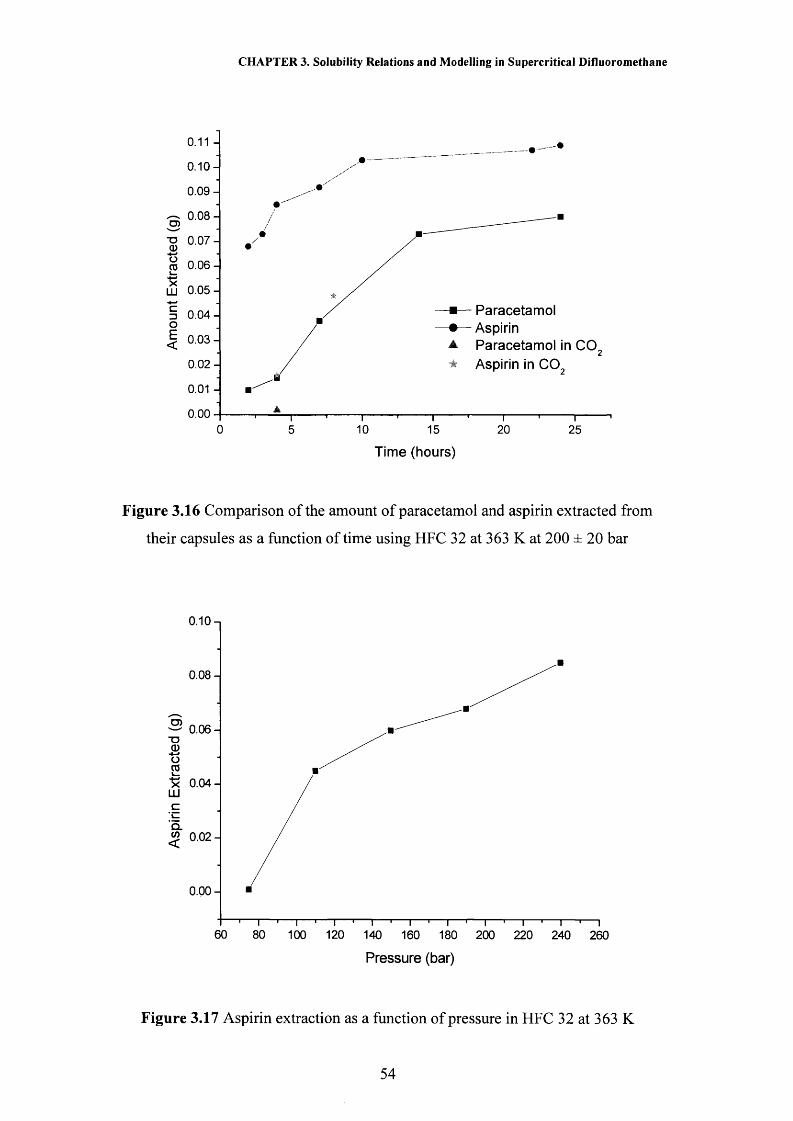
CHAPTER 3. Solubility Relations and Modelling in Supercritical Difluoromethane
0 . 1 0 -
0.09-
— 0.08-
i ° ° 7: 0.06-O 03 -*—*
X LU 0.05-c o| 0 .03-
0 .0 2 -
Paracetam olAspirinParacetam ol in CO Aspirin in CO
0.01 -
0.000 10 15 20 255
Time (hours)
Figure 3.16 Comparison of the amount of paracetamol and aspirin extracted from
their capsules as a function of time using HFC 32 at 363 K at 200 ± 20 bar
0.10 n
0.08-
D) 0.06-T30 ■4—'oCOI— ■4—>XUJ
0.04-
c
Q.0.02 -<
0.00 -
60 80 100 120 140 160 180 200 220 240 260
Pressure (bar)
Figure 3.17 Aspirin extraction as a function of pressure in HFC 32 at 363 K
54

CHAPTER 3. Solubility Relations and Modelling in Supercritical Difluoromethane
Figure 3.15 shows that an increase in pressure causes an increase in the actual
solubility. From visual inspection of the capsule coating as a function of pressure it
was also observed that increasing the pressure reduces the time it takes for the pill
coating to rupture. An increase in the pressure may also affect the arrangement of the
matrix and aid the extraction process by causing the matrix to break down.
If the amount of aspirin extracted in Figure 3.17 is compared to the actual
solubility under similar conditions (Figure 3.15) it can be seen that there is
approximately an order of magnitude difference. As mentioned earlier this is thought
to be due to the time over which the measurements were taken and matrix effects.
This work has shown that HFC 32 can be used as a solvent to carry out sc
fluid extraction. The increased polarity of HFC 32 compared to CO2 makes it an ideal
solvent when looking to carry out extractions involving more polar analytes or in
systems where the outer coating is hard to penetrate. This preliminary work has
demonstrated to GlaxoSmithKline® that SFE can be used to analyse the active
ingredients in their pills without initial degradation of the coating. Supercritical fluid
extraction may therefore be a faster, cleaner and more viable method for analysis of
these systems. It was not the intention of this work to do an exhaustive study to find
optimal extraction conditions for these analytes. However, a basic knowledge of the
dependency of extraction on the experimental variables has been assessed and from
these results it has been found that extraction depends on pressure, time, solvent,
actual solubility and matrix effects.
55

CHAPTER 3. Solubility Relations and Modelling in Supercritical Difluoromethane
3.3 Conclusions
The first solubility measurements of a number of p-benzoic acids and p-
phenols in HFC 32 at 363 K over a range of pressures are reported in this work.
Under the conditions studied the solubility of all solutes was found to increase with
increasing pressure. The identity of the functional group at the para position of the
benzoic acid and phenol backbone was found to have a large affect on the measured
solubilities. It was found that the greater the polarity of the solute the lower the
solubility. However, when vapour pressure considerations were taken into account
and the change in concentration enhancement was measured instead of actual
solubility, it was revealed that the enhancement increased as the polarity or number of
free polar groups in the solute increased. Opposite trends were observed between the
two measurements indicating that the vapour pressure of a solute has a large affect
upon solubility. The Peng-Robinson equation-of-state was used to model the
solubility data for the solutes where vapour pressure data was available. A good fit
was obtained for all solutes over the temperature and pressure range studied showing
that the PR EOS can be used to predict solubilities in HFC 32.
It has been shown in this work that the previously proposed dielectrometry
method for measuring solubilities is applicable to measuring solubilities in sc HFC
32. The limitations associated with the use of other commonly employed solubility
measurement techniques are not observed. It is a quick, simple and precise in situ
technique that can be applied in different sc solvents to measure the solubility of both
polar and non-polar liquid and solid solutes.
The solubility studies have shown that HFC 32 is a relatively polar solvent and
should be a useful fluid for sc fluid extraction or chemical reactions, especially if
polar compounds are involved, as these have limited solubility in the commonly
employed solvent CO2. Extraction from aspirin and paracetamol capsules was carried
out to verify this point by employing HFC 32 as the extraction medium and
comparing the results obtained to those for CO2. HFC 32 was shown to be a suitable
medium for carrying out extractions where the rate of extraction depended upon the
actual solubility of the extract, time and pressure.
56
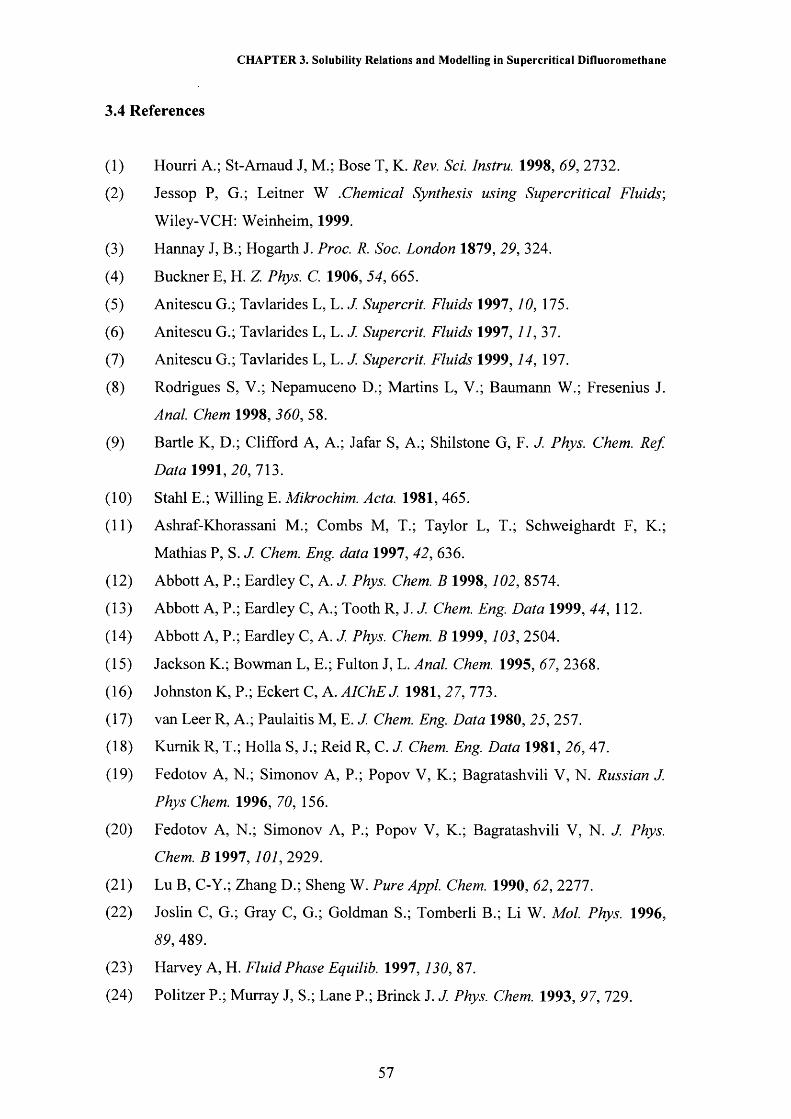
CHAPTER 3. Solubility Relations and Modelling in Supercritical Difluoromethane
3.4 References
(1) Hourri A.; St-Amaud J, M.; Bose T, K. Rev. Sci. lnstru. 1998, 69, 2732.
(2) Jessop P, G.; Leitner W .Chemical Synthesis using Supercritical Fluids',
Wiley-VCH: Weinheim, 1999.
(3) Hannay J, B.; Hogarth J. Proc. R. Soc. London 1879, 29, 324.
(4) Buckner E, H. Z Phys. C. 1906, 54, 665.
(5) Anitescu G.; Tavlarides L, L. J. Supercrit. Fluids 1997,10, 175.
(6 ) Anitescu G.; Tavlarides L, L. J. Supercrit. Fluids 1997,11, 37.
(7) Anitescu G.; Tavlarides L, L. J. Supercrit. Fluids 1999,14, 197.
(8 ) Rodrigues S, V.; Nepamuceno D.; Martins L, V.; Baumann W.; Fresenius J.
Anal. Chem 1998, 360, 58.
(9) Bartle K, D.; Clifford A, A.; Jafar S, A.; Shilstone G, F. J. Phys. Chem. Ref.
Data 1991,20,113.
(10) Stahl E.; Willing E. Mikrochim. Acta. 1981, 465.
(11) Ashraf-Khorassani M.; Combs M, T.; Taylor L, T.; Schweighardt F, K.;
Mathias P, S. J. Chem. Eng. data 1997, 42, 636.
(12) Abbott A, P.; Eardley C, A. J. Phys. Chem. B 1998,102, 8574.
(13) Abbott A, P.; Eardley C, A.; Tooth R, J. J. Chem. Eng. Data 1999, 44, 112.
(14) Abbott A, P.; Eardley C, A. J. Phys. Chem. B 1999,103, 2504.
(15) Jackson K.; Bowman L, E.; Fulton J, L. Anal. Chem. 1995, 67, 2368.
(16) Johnston K, P.; Eckert C, A. AIChEJ. 1981, 27, 773.
(17) van Leer R, A.; Paulaitis M, E. J. Chem. Eng. Data 1980, 25, 257.
(18) Kumik R, T.; Holla S, J.; Reid R, C. J. Chem. Eng. Data 1981, 26, 47.
(19) Fedotov A, N.; Simonov A, P.; Popov V, K.; Bagratashvili V, N. Russian J.
Phys Chem. 1996, 70, 156.
(20) Fedotov A, N.; Simonov A, P.; Popov V, K.; Bagratashvili V, N. J. Phys.
Chem. B 1997,101, 2929.
(21) Lu B, C-Y.; Zhang D.; Sheng W. Pure Appl. Chem. 1990, 62, 2211.
(22) Joslin C, G.; Gray C, G.; Goldman S.; Tomberli B.; Li W. Mol. Phys. 1996,
89, 489.
(23) Harvey A, H. Fluid Phase Equilib. 1997, 130, 87.
(24) Politzer P.; Murray J, S.; Lane P.; Brinck J. J. Phys. Chem. 1993, 97,129.
57

CHAPTER 3. Solubility Relations and Modelling in Supercritical Difluoromethane
(25) Alvarez J, L.; Femandez-Prini R.; Japas M, L. Ind. Eng. Chem. Res. 2000, 39,
3625.
(26) Sedlbauer J.; O'Connell J, P.; Wood R, H. Chem. Geol. 2000,163, 43.
(27) Redlich O.; Kwong J, N, S. Chem. Rev. 1949, 44, 233.
(28) Guigard S, E.; Stiver W, H. Ind. Eng. Chem. Res. 1998, 37, 3786.
(29) Chrastil J. J. Phys. Chem. 1982, 86, 3016.
(30) Peng D-Y.; Robinson D, B. Ind. Eng. Chem. Fundam. 1976,15, 59.
(31) Yu J-M.; Lu B, C-Y. Fluid Phase Equilib. 1987, 34, 1.
(32) Adachi Y.; Lu B, C-Y. Fluid Phase Equilib. 1983,14, 147.
(33) Chang H.; Morrell D, G. J. Chem. Eng. Data 1985, 30, 74.
(34) Weast R, C.; Astle M, J.; Beyer W, H. Handbook o f Chemistry and Physics,
6 8 ed.; CRC Press: Florida, 1988.
(35) Le Fevre R, J. W.. Advan. Phys. Org. Chem. 1965, 3, 1.
(36) McClellan A, L. Tables o f Dipole Moments', Freeman: San Francisco, 1963.
(37) Stahl E.; Schilz W.; Schutz E.; Willing E. Angew. Chem. Int. Ed. Engl. 1978,
17, 731.
(38) Krukonis V, J.; Kumik R, T. J. Chem. Eng. Data 1985, 30, 247.
(39) Taylor L, T. Supercritical Fluid Extraction; J. Wiley & Sons: New York,
1996.
58

4SOLVENT PROPERTIES OF
SUPERCRITICAL
HYDROFLUOROCARBONS
4.1 Introduction
4.1.1 Solvatochromism
4.1.2 The Kamlet and Taft Polarisability/Dipolarity Parameter, n*
4.1.3 Hydrogen Bonding
4.2 Results and Discussion
4.2.1 Polarisability/Dipolarity Parameter, tt*
4.2.2 Hydrogen Bond Acceptor Properties, P
4.2.3 Hydrogen Bond Donor Properties, a
4.2.4 Solubility Modelling
4.2.5 Partition Coefficient Modelling
4.3 Conclusions
4.4 References
CHAPTER 4. Solvent Properties of Supercritical Hydrofluorocarbons
4.1 Introduction
It is known that there are a number of complex solvent effects that have an
influence on the kinetics and mechanism of a reaction. In previous studies by Abbott
and Eardley the polarisability parameter, n*, from the theory of Kamlet and Taft were
measured for 1,1,1,2-tetrafluoroethane (HFC 134a) and difluoromethane (HFC 32).1,2
As an extension to this work the hydrogen bond donor (HBD, a) and hydrogen bond
acceptor (HBA, (3) parameters will be determined by solvatochromic shifts using UV-
VIS spectroscopy of a variety of indicator solutes. These properties are essential for
understanding reactant association in solution and the acid/base properties of the
solvent. These parameters will also be required to model the solubility of the
reactants and catalysts in solution.
4.1.1 Solvatochromism
Solvatochromism can be defined as the change in position of an electronic
absorption or emission band, accompanying a change in the polarity of the medium.
The solvatochromic shift itself is the displacement of an electronic spectrum on going
from one solvent to another. Negative solvatochromism corresponds to a
hypsochromic shift with increasing solvent polarity and a positive solvatochromism is
a bathochromic shift with increasing solvent polarity.
This observed solvatochromic shift could be explained by considering the
electronic states of a molecule. Each electronic state has a discrete energy, E, and
wavefunction, 'F, related by the Schrodinger equation
(4.1)
where H is the Hamiltonian operator. In the case of an isolated molecule in quantum
mechanics, these electronic states are relaxed states corresponding to the most stable
nuclear configurations. From the Franck-Condon principle it is deduced that
immediately following an electronic transition the final state, termed the Franck-
Condon state, cannot be relaxed because nuclei require considerably more time19 1A(around 1 0 ' s) than electrons (around 1 0 ' s) to rearrange to their most stable
configurations.4,5 Hence the nuclear configuration in both the initial relaxed and final
Franck-Condon states remains unchanged.
In an absorption or emission process it is a radiative electronic transition that
links the initial relaxed and final Franck-Condon states. When considering a molecule
60
CHAPTER 4. Solvent Properties of Supercritical Hydrofluorocarbons
surrounded by a medium, each of its electronic states will be stabilised or destabilised
by an amount known as the solvation energy, Es, which is dependent on the polarity of
the medium. Thus it is the influence of this solvating medium on the electronic
absorption or emission spectra of the solute that gives rise to the definition of
solvatochromism.4
The solvatochromic shift between two solvents is the difference in solvation
energies between the final (Si) and initial (So) states as shown in Figure 4.1. These
shifts are important not only for the description of the relative energies of electronic
states of molecules but also for the experimental determination of some important
physical properties such as the polarisability and the dipole moment of the molecule
in question. However, they can often provide information about specific interactions
such as hydrogen bonding and on a microscopic level, solvatochromic shift data can
provide information on solvation in the cybotactic region of a solute molecule.
4.1.2 The Kamlet and Taft Polarisability/Dipolarity Parameter, n
Solvation is defined quantitatively as the energy of interaction between a
solute and a solvent. For non-specific interactions the solvation energy can be
expressed as the products of two polarity functions4
E s o lv ~ P m x ^ s (4*2)
where p m and TCs represent the polarity of the solute and solvent respectively.
Attempts at understanding solvent effects in terms of these polarity functions have
proved difficult as they are not easy to define precisely or express quantitatively. It
has been mostly macroscopic solvent parameters such as dielectric constant, dipole
moment, refractive index, or functions thereof, which have been used for the
evaluation of medium effects. ' This approach is sufficient in the case of non
specific interactions, however, solute-solvent interactions can also take place on a
microscopic level, giving rise to specific interactions such as hydrogen bonding,
electron-pair donor or electron-pair acceptor interactions. It is in these cases that this
electrostatic approach to medium effects fails in correlating observed solvent effects
with physical solvent parameters.9 To compensate for the failings of this method
several empirical solvent polarity scales have been devised, 10,11 which take into
consideration the presence, or absence of specific solvent-solute interactions.
61

Ene
rgy
CHAPTER 4. Solvent Properties of Supercritical Hydrofluorocarbons
vac/ \
sol
Figure 4.1 A solvatochromic shift energy diagram for the case of a vacuum and a
solvent. E°s and are the solvation energies of the ground and excited states
respectively and f(D) is the Onsager solvent polarity function 2(c - l)/(2s + 1)
62

CHAPTER 4. Solvent Properties of Supercritical Hydrofluorocarbons
The first empirical parameter was the Y-scale of solvent ionising power1 9introduced by Winstein et al. in 1948. This publication establishing solvent
polarities based on Y-values prompted other authors to propose scales of solvent
polarities based on a given solvent sensitive property. Brooker and co-workers made
the first suggestion that solvatochromic dyes could serve as visual indicators of
solvent polarity. 13 However, in 1958 it was Kosower who was first to set up a real
spectroscopic solvent polarity scale. 14,15 This was called the Z-scale and was based on
the UV-VIS spectra of an A-methylpyridinium iodide, where the low energy
absorption band in the spectra characterises the charge transfer from iodide to the
pyridinium ring. Since then various additional UV/VIS/IR based solvent polarity
scales have been developed, for example the E t(30) scale.9,16,17
All these scales are single parameter scales in which the non-specific and
specific interactions ‘mix’ into a single solvent parameter. Obviously, this is an
oversimplification and causes serious limitations when applying this single parameter
approach to medium effects. A more satisfactory method is to use multi-parameter
correlation equations, which may consist of up to four single empirical parameters,
each measuring a specific aspect of the overall solvation capability of the medium . 10,18
An example of a commonly used multi-parameter scale is the n scale of solvent
polarisability/dipolarity. 18'24
The 7i* scale relies on a linear solvation energy relationship (LSER) correlating
a number of solvent effects on a solute. 19'21 The relationship has the general form
XYZ — JCYZq + ci ct + bj3 + hSfj + SPPE (4.3)
where X Y Z represents a property of the system in a given solvent related to that in the
standard XYZo, such as reaction rate, equilibrium constant or a position or intensity of
spectral absorption. The solvatochromic parameter a is a quantitative, empirical
measure of the ability of the bulk solvent to act as a hydrogen bond donor (HBD)
towards a solute, thus ft is the opposite and measures the hydrogen bond accepter1 Q 90 9S 9f\(HBA) properties of the solvent. ’ ’ ’ The a and b parameters are the
corresponding hydrogen bonding constants associated with the solute. 5h is known as
the Hildebrand solubility parameter and is a measure of the solvent-solvent
interactions that are broken in creating a cavity for the solute and h is the9 7corresponding solute parameter. Finally SPPE is a parameter that denotes the
solvent polarisability/dipolarity effect.
63

CHAPTER 4. Solvent Properties of Supercritical Hydrofluorocarbons
Kamlet, Taft and co-workers developed their n scale based on solvent-
induced shifts on the peak position of a UV-VIS absorption maximum of an indicator
solute in a liquid solvent with characteristic values of the HBD, HBA and SPPE1 R 90parameters for various solvents. ’ Initially using seven nitroaromatics, Kamlet and
Taft showed that their UV-VIS spectral data could express the SPPE term by the
parameter 7i*, a measure of solvent polarisability/dipolarity.19 This n scale is so
named as it derives from solvatochromic effects on n —> n and n —» n electronic
spectral transition. Over the years from its original construction this n* scale has been
expanded and refined with the addition of other solvatochromic indicators. Hence, an
arbitrary tc* scale of solvent polarities has been established, in which for example,
non-polar cyclohexane has a 7c* value of 0.0 and polar dimethyl sulphoxide has a 71*
value of 1.0.
In Equation (4.3) substitution of the n* parameter for the SPPE term leads to
J C Y Z — X Y Z q + s ^ 7 r + q c c + b f 3 + h S ^ (4.4)
where s represents the susceptibility of XYZ to changing SPPE and is a constant
characteristic of the solute. The quantity d is a polarisability correction term with
dimensions equal to 0.0 for non-halogenated aliphatics, 0.5 for halogenated aliphatics
and 1.0 for aromatic solvents. It is observed that when the electronic spectrum is
shifted to lower frequencies (bathochromically) with increasing solvent polarity, the
coefficient of the 5 term, d, is equal to zero and, therefore, 5 can be neglected.
The LSER in Equation (4.4) can be simplified under a number of conditions.
It is notable in the case of UV-VIS spectroscopy that electronic transitions are hardly
accompanied by a change in molar volume of the absorbing ground state molecule on
excitation. Thus according to the Frank-Condon principle the ground and excited
states of the indicator molecule will occupy the same volume and the h5n term in
Equation (4.4) can be ignored. If only non-HBD solvents are considered it is the a
term that can be ignored. Conversely, if the solutes are non-HBD the p term can be
ignored. As a consequence of these simplifications the four-parameter Equation (4.4)
can be reduced to a three-, two-, or even a one-parameter equation of the form
“ ° 0 + S 7 t (4.5)
64
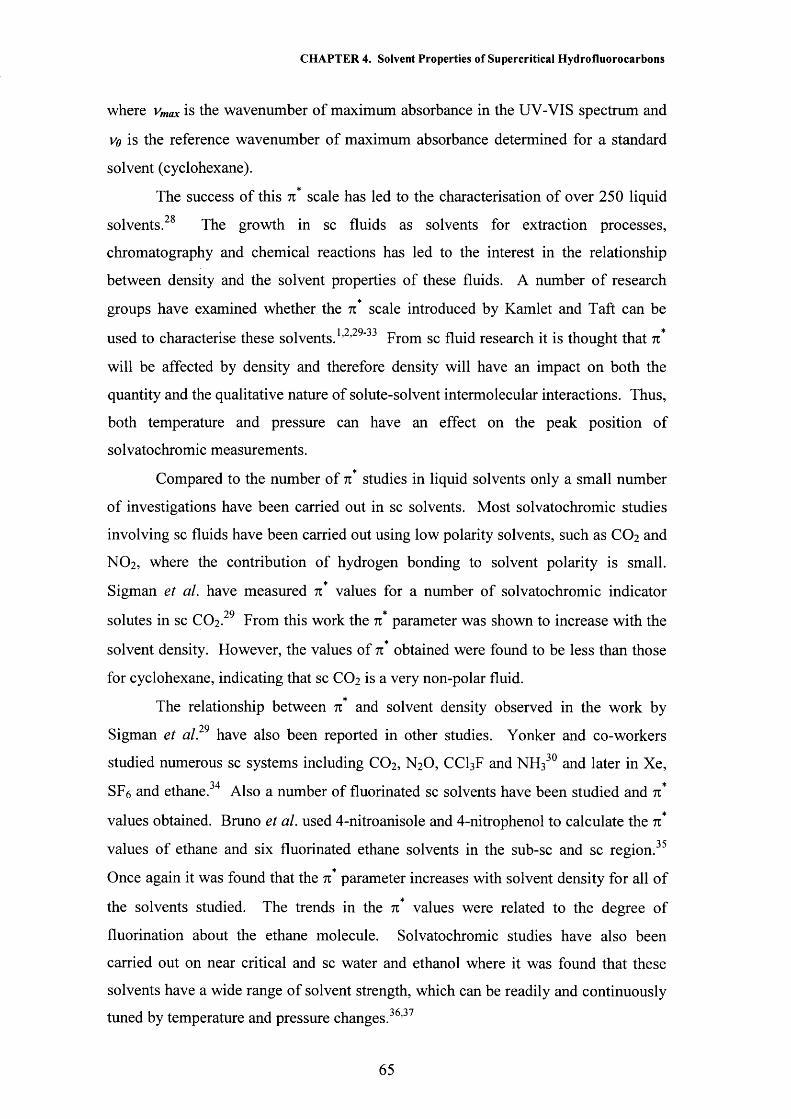
CHAPTER 4. Solvent Properties of Supercritical Hydrofluorocarbons
where vmax is the wavenumber of maximum absorbance in the UV-VIS spectrum and
vo is the reference wavenumber of maximum absorbance determined for a standard
solvent (cyclohexane).
The success of this n scale has led to the characterisation of over 2 5 0 liquid9 osolvents. The growth in sc fluids as solvents for extraction processes,
chromatography and chemical reactions has led to the interest in the relationship
between density and the solvent properties of these fluids. A number of research$
groups have examined whether the n scale introduced by Kamlet and Taft can be1 9 9Q 99 ♦used to characterise these solvents. ’ ’ ' From sc fluid research it is thought that 7C
will be affected by density and therefore density will have an impact on both the
quantity and the qualitative nature of solute-solvent intermolecular interactions. Thus,
both temperature and pressure can have an effect on the peak position of
solvatochromic measurements.
Compared to the number of tC studies in liquid solvents only a small number
of investigations have been carried out in sc solvents. Most solvatochromic studies
involving sc fluids have been carried out using low polarity solvents, such as CO2 and
NO2, where the contribution of hydrogen bonding to solvent polarity is small.
Sigman et al. have measured 71* values for a number of solvatochromic indicator9 0 • *solutes in sc CO2. From this work the 71 parameter was shown to increase with the
solvent density. However, the values of n obtained were found to be less than those
for cyclohexane, indicating that sc CO2 is a very non-polar fluid.
The relationship between 71* and solvent density observed in the work by29Sigman et al. have also been reported in other studies. Yonker and co-workers
studied numerous sc systems including CO2, N2O, CCI3F and NH330 and later in Xe,
SF6 and ethane. Also a number of fluorinated sc solvents have been studied and 71
values obtained. Bruno et al. used 4 -nitroanisole and 4 -nitrophenol to calculate the 7t*
values of ethane and six fluorinated ethane solvents in the sub-sc and sc region.35
Once again it was found that the n* parameter increases with solvent density for all of
the solvents studied. The trends in the n* values were related to the degree of
fluorination about the ethane molecule. Solvatochromic studies have also been
carried out on near critical and sc water and ethanol where it was found that these
solvents have a wide range of solvent strength, which can be readily and continuously
tuned by temperature and pressure changes.36,37
65

CHAPTER 4. Solvent Properties of Supercritical Hydrofluorocarbons
The polarisability parameter % has also been studied for HFC 134a1, HFC 32
and pentafluoroethane (HFC 125) as a function of temperature and pressure, to cover
the liquid and sc states over the range 303 to 403 K and 40 to 300 bar. In this work
Abbott and Eardley explained the change in n* with reduced density in terms of local
density augmentation and used a van der Waals model to predict the changes in
solvent properties. More recently they extended their work to look at CO2/HFC 134a
mixtures. Only a handful of other authors had studied the solvent properties of sc
mixtures.38"41 Research into sc mixtures has shown that there is preferential solvation
of the solute by the more polar solvent in the mixture and the local composition of this
polar constituent steadily decreases as the pressure is increased. In the work by
Abbott et al,33 they discovered that a mixture of 30 mol % HFC 134a in CO2 has
properties similar to those of bulk HFC 134a at high densities. The combination of
HFC 134a with CO2 is found to decrease the critical temperature by 42 K from that of
pure HFC 134a making these mixtures more economically attractive solvents
especially as the HFC 134a is not left as a residue after depressurisation.
4.1.3 Hydrogen Bonding
The hydrogen bond is an intermolecular or intramolecular interaction, which
has a strength of around 20 kJ mol'1. This is similar in strength to a van der Waals
force but a hydrogen bond is directional which can give rise to discrete recognisable
units consisting of two or more single molecules.
Hydrogen bonds were originally postulated by Latimer and Rodebush in 1920
to explain, among other effects, the high boiling points of compounds containing the
groups -OH, -NH2 or >NH compared with isomeric molecules with no hydrogen
directly attached to the oxygen or nitrogen 42 From this initial work it was found that
a hydrogen bond is an attractive interaction between two closed shell species, which is
represented by the broken line in Figure 4.2. Hydrogen bonding can only occur if A
and B in Figure 4.2 are highly electronegative and small for example F, O or N, and B
must also possess a lone pair of electrons.
Figure 4.2 Representation of a hydrogen bond
66

CHAPTER 4. Solvent Properties of Supercritical Hydrofluorocarbons
It has been shown that hydrogen bond strengths can be measured via UV-VIS9 S 9 f \spectral data using a solvatochromic comparison method. ’ Initial work by Kamlet
9 and Taft used this method to construct a P-scale of solvent HBA basicities and an a-9 fscale of HBD acidities. These hydrogen bond interactions can be accounted for by
modifying Equation (4.5) to *
Umax = V 0 + S 7T + a a + b/3 (4.6)
where a and p are measures of HBD acidity and HBA basicity respectively, and a, band s are susceptibility constants.
From Equation (4.6) the solvatochromic comparison method can then be used
for the determination of a values by comparison of solvent-induced shifts of the$
longest wavelength 7r —> 7r absorption band of two similar probe molecules, one of
which cannot act as a HBA towards HBD solvents, whereas the other can.
Determination of p values is analogous to the determination of a values, however in
this case one of the probe molecules cannot act as a HBD towards solvents, whereas
the other one can. Values of a and p for a number of liquid solvents have been
reported by Kamlet and Taft25,26 and more recently by Marcus.43,44
Extending the a and p scales to sc fluids has been the focus of more recent
work by a number of authors to see how these scales change with density. Kim and
Johnston used UV-VIS spectroscopy to characterise the HBD ability of sc fluoroform
with the solvatochromic probe phenol blue.45 It was shown that the hydrogen bond
interactions were well developed at the critical density but did not change
substantially with pressure up to 350 bar. Bennett and Johnston characterised the
HBD strength of sc water with the UV-VIS spectroscopic probes acetone and
benzophenone.46 They also showed that hydrogen bonding can persist in sc media at
low densities and specifically as low as 0.1 g cm'3 in sc water at 653 K.
Sigman et al. reported p values in sc CO2 and found a constant value of p over• • • 90all densities using 4-nitrophenol. The HBD strength of five pure fluids, CO2, N2O,
CCIF3, SF6 and NH3 were found using five probe indicators.32 p values were
measured along three isotherms, from atmospheric pressure up to 1000 bar. Of the
fluids investigated only NH3 showed significant basicity under any of the conditions
studied. The NH3 p values were found to be approximately 0.70 at 293 K, 0.65 at 333
K and 0.55 at 413 K and 1000 bar. Lagalante and co-workers have measured P for six
67

CHAPTER 4. Solvent Properties of Supercritical Hydrofluorocarbons
c
fluorinated ethane solvents in their liquid and sc states. It was found that for the
solvents in this work p values were generally negative over the density range studied
and could be classed as an average value over the entire density range.
Recently Eckert and co-workers characterised the Kamlet-Taft parameters of
near critical and sc ethanol and showed that the HBD properties decrease with
increasing pressure and temperature. The HBA properties were found to be small and
relatively invariant with pressure in the sc region.
Eardley has reported preliminary results for the determination of a in liquid
and supercritical HFC 134a47 based on the measured Kamlet and Taft parameters, n
and p, by Lagalante and co-workers using the solvatochromic probe molecule 4-A O
nitroanisole. In the work by Lagalante et al. it was shown that HFC 134a was
unable to act as a hydrogen bond acceptor, implying that p is equal to zero. Using this
result and assuming the reported n* values are accurate, Eardley calculated the
hydrogen bond donor parameter of HFC 134a as a function of temperature and
pressure using Equation (4.6).
Results showed that in liquid HFC 134a at 323 K, a values were widely
spread in the range of 0.05 to 0.2 over the pressure range of 60 to 250 bar. The
diversity in a values was attributed to the relatively poor accuracy of the 4-
nitroanisole solvatochromic measurements. In sc HFC 134a, at 378 K and 393 K, a
was found to lie in the range of 0.2 to 0.3 at pressures above 60 bar. Below this
pressure a increased dramatically as the pressure tended towards zero. It was thought
that if hydrogen bond interactions did exist between HFC 134a and Nile Red (the
solvatochromic probe employed by Eardley) they are likely to be relatively consistent
over the range of temperatures and pressures studied, as it had previously been shown
that there is good correlation between the polarisability function, a(s) and n ? These
results had further inconsistencies because a and hence the hydrogen bond donating
ability of HFC 134a, increased as the temperature of the system was raised from
liquid to supercritical values; generally the hydrogen bond donor strength of a solvent
decreases with temperature at a given density.45,46
This work looks to quantify the hydrogen bond properties of HFC 32 and HFC
134a over a range of temperatures and pressures. Unlike the preliminary work by
Eardley, which relied on results in the literature, this work uses the same
instrumentation and technique to measure all the necessary Kamlet and Taft
68

CHAPTER 4. Solvent Properties of Supercritical Hydrofluorocarbons
parameters using three solvatochromic probes, therefore, significantly reducing any
sources of error. It is thought that the HBA parameter, p, for these solvents should be
zero by analogy with the chlorinated analogues and perfluoroalkanes under ambient
conditions but this is yet to be verified. It is also unclear how the a values for these
HFC solvents will change as no conclusive comparisons are found in the literature.
However, it has been noted that a for pentachloro- and tetrachloroethane is zero,
while for dichloromethane a is O.4.28
69

CHAPTER 4. Solvent Properties of Supercritical Hydrofluorocarbons
4.2 Results and Discussion
To obtain the a , p and 7i* values for the two HFC fluids the susceptibility
constants a, b and s for the three solvatochromic dyes were first obtained by
measuring their absorption spectra in 16 liquid solvents of different polarity and
solvent type i.e. HBD, HBA and non-hydrogen bonding (NHB). The data obtained
were fitted to Equation (4.6) using a multiple regression analysis. Very good
correlation was obtained in all cases (R2 > 0.95). The a, b and s values for the three
solutes used are listed in Table 4.1 and are in close agreement with those published in
the literature. 19 The calculated wavelength of absorption maxima, vmax, using the
susceptibility constants in Table 4.1 are shown in Table 21 of the appendix along with
the measured vmax for comparison.
Dye a value ] b value | s valuei
Vo (kK) R2 value
N, V-dimethyl-4-nitroaniline -0.562 | N/A | -3.3261
27.956 0.9757
4-nitroaniline N/A I” -3.484 p . 6 0 0 30.820 0.9970
Nile Red -0.942 J N/A -1.623S
19.978 0.9503
Table 4.1 Susceptibility constants for the solvatochromic probes used in this work
4.2.1 Polarisability/Dipolarity Parameter, n*
Abbott and Eardley previously reported the pressure and temperature
dependency of 7r* for HFC 134a and HFC 32 using Nile red as an indicator solute.
Lagalante and co-workers have also measured the Kamlet-Taft parameters, n* and p,
for six liquid and sc fluorinated ethane solvents, including HFC 134a. The n*
values of HFC 134a previously reported by Abbott were consistently slightly higher
(c.a. 0.07) than those determined by Lagalante in both the liquid and sc phases. It was
implied that the difference in 71* values results from the neglect of hydrogen bonding
interactions between HFC 134a and Nile Red. Similar inconsistencies in n*,
however, have been observed for CO2 when employing the solvatochromic probes
Nile red and 4-nitroanisole31,33 and hence this may not be the sole reason.
Figures 4.3 and 4.4 show the 71* values calculated for HFC 32 and HFC 134a
as a function of temperature and pressure respectively. The first point to note is that
70
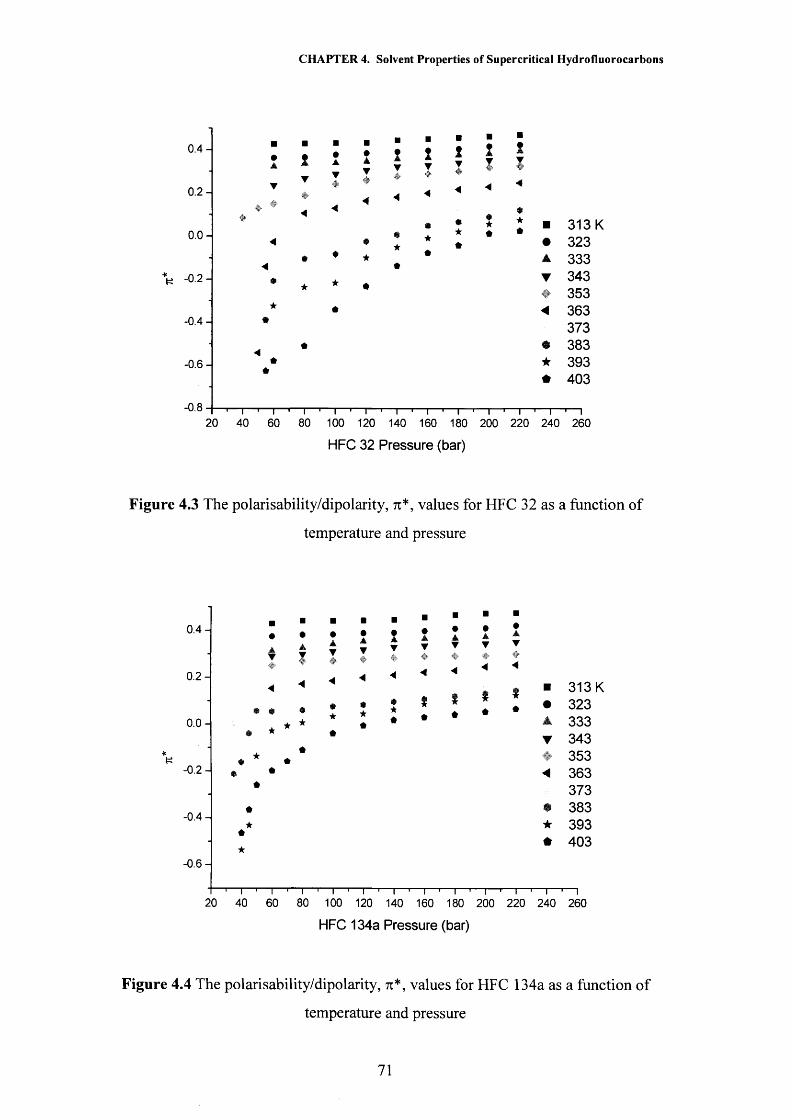
CHAPTER 4. Solvent Properties of Supercritical Hydrofluorocarbons
0.4-
0 .2 -
313 K323333343353363373383393403
0 .0 -
-0.4-
- 0 . 6 -
- 0.820 40 60 80 100 120 140 160 180 200 220 240 260
HFC 32 Pressure (bar)
Figure 4.3 The polarisability/dipolarity, n*, values for HFC 32 as a function of
temperature and pressure
0.4-
0 .2 -
313 K323333343353363373383393403
0 .0 -
- 0 .2 -
-0.4-
- 0 . 6 -
20 40 60 80 100 120 140 160 180 200 220 240 260
HFC 134a Pressure (bar)
Figure 4.4 The polarisability/dipolarity, 7i*, values for HFC 134a as a function of
temperature and pressure
71
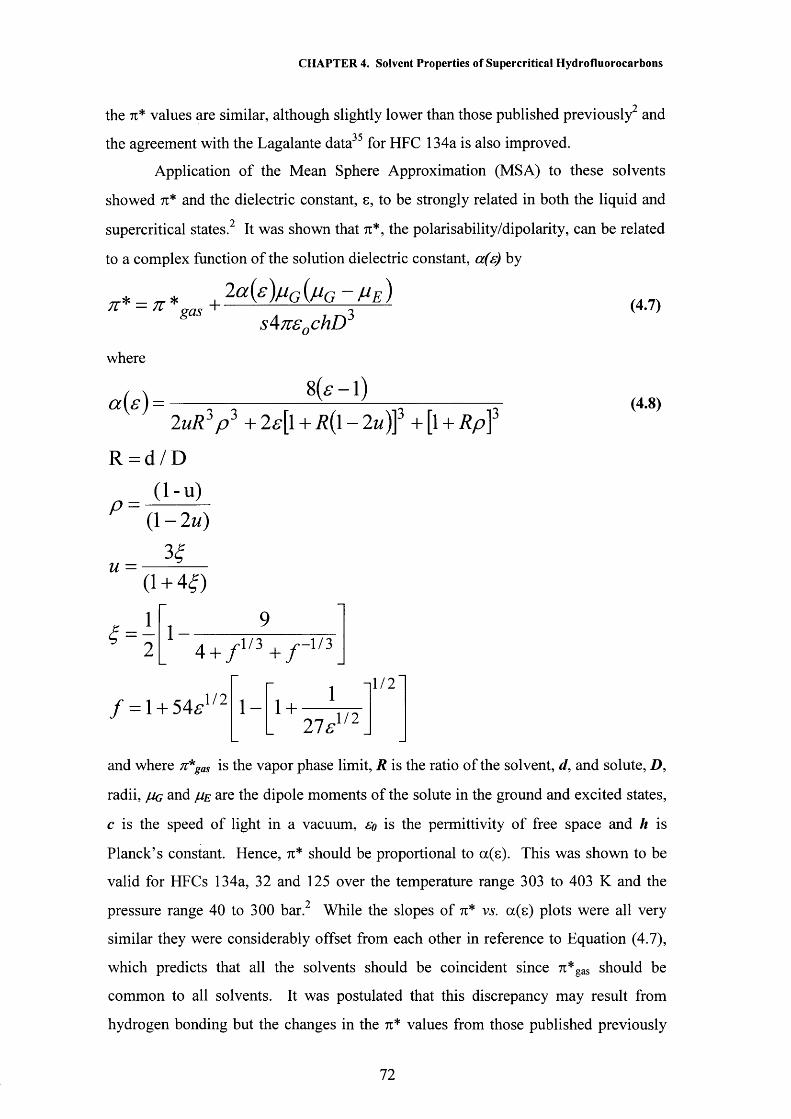
CHAPTER 4. Solvent Properties of Supercritical Hydrofluorocarbons
the 71* values are similar, although slightly lower than those published previously2 and
the agreement with the Lagalante data for HFC 134a is also improved.
Application of the Mean Sphere Approximation (MSA) to these solvents
showed 7i* and the dielectric constant, s, to be strongly related in both the liquid and
supercritical states 2 It was shown that 7i*, the polarisability/dipolarity, can be related
to a complex function of the solution dielectric constant, a(s) by
2 a ( s ) p G ( p G - p E )71* — 71* 4gas n
where
a ( z ) =
sATTS^chD ^(4.7)
2 u R V + 2 f [ l + R ( 1 - 2m)]3 + [l + R p f
R = d / D
( 1 - u )
(4.8)
P
u
4 =
(1 - 2 m)
(1 + 4# )
1 1 -4 + / l / 3 + / - l / 3
/ = l + 5 4 f 1/21 - 1 +
1
2 1 s 1/2
1/2
and where n*gm is the vapor phase limit, R is the ratio of the solvent, d, and solute, D.
radii, /Mr, and /ie are the dipole moments of the solute in the ground and excited states,
c is the speed of light in a vacuum, Eo is the permittivity of free space and h is
Planck’s constant. Hence, n* should be proportional to a(s). This was shown to be
valid for HFCs 134a, 32 and 125 over the temperature range 303 to 403 K and the
pressure range 40 to 300 bar. While the slopes of 7i* vs. a(s) plots were all very
similar they were considerably offset from each other in reference to Equation (4.7),
which predicts that all the solvents should be coincident since 7i*gas should be
common to all solvents. It was postulated that this discrepancy may result from
hydrogen bonding but the changes in the 7t* values from those published previously
72

CHAPTER 4. Solvent Properties of Supercritical Hydrofluorocarbons
are too small to account for this difference. Analysis of Equation (4.8) shows a
critical dependence of a(s) on the ratio of the solvent and solute radii. The previously
reported method49 for determining the molecular radii was an additive method based
upon average atomic Stokes radii that was relatively inaccurate and may result in the
previously observed offset. In the current study computer simulation was used to
determine the solvent and solute volumes. 50 The equilibrium geometry and charge
distributions of the solute and the solvent were calculated using a Hartree-Fock
method utilizing an STO-3G model.50 Figure 4.5 shows plots of 7i* vs. a(s) for the
new data and shows that both solvents are in much closer agreement to Equation
(4.7). The model does, however, still assume that the indicator solutes are spherical,
which in the case of Nile red is clearly not accurate as it is more oblate. Redefining d
and D as the volume/area ratio (rather than the radius) of the solvent and solute
respectively, yields a parameter that more accurately accounts for the contribution of
molecular geometry to the solvent-solute interaction i.e. an oblate molecule has a
larger surface of interaction with the surrounding environment than a spherical
molecule of the same formula. Figure 4.5 shows that the modified Mean Sphere
Approximation (MMSA) approach yields a much closer agreement between the two
solvents and a 7t*gas value in close agreement with the theoretical value o f -1.06 (7r*gas
is -1.10 and -1.22 for HFCs 134a and 32 respectively) . 51 The polarisability/dipolarity
parameter can accurately be modeled for HFC 32 and HFC 134a using the Mean
Sphere Approximation although critical parameters such as molecular radii
significantly affect the accuracy of the parameter a(s) which is a weakness of this
approach.
4.2.2 Hydrogen Bond Acceptor Properties, p
The solvatochromic probes 4-nitroaniline and TV, A-dimethyl-4-nitroaniline
were used to obtain the basicity parameter based on a comparison method.25,26 The
calculated p values as a function of temperature and pressure for HFC 32 and HFC
134a are shown in Figures 4.6 and 4.7 respectively. The p values for both solvents
are small but positive. This is a slight contradiction to the data presented by
73

CHAPTER 4. Solvent Properties of Supercritical Hydrofluorocarbons
0.5-
0.4-
0.3-
0 .2 -
*K 0 . 1 -
■ HFC 32 MMSA • HFC 134a MMSA A HFC 32 MSA T HFC 134a MSA
0 .0 -
- 0.1 -
- 0 .2 -
0.20 0.25 0.30 0.35 0.40 0.45 0.50 0.55
Dielectric Constant Function a(e)
Figure 4.5 Application of the mean sphere approximation (MSA) and modified MSA
(MMSA) to the polarisability/dipolarity, 7i*, data shown in Figures 4.3 and 4.4
74
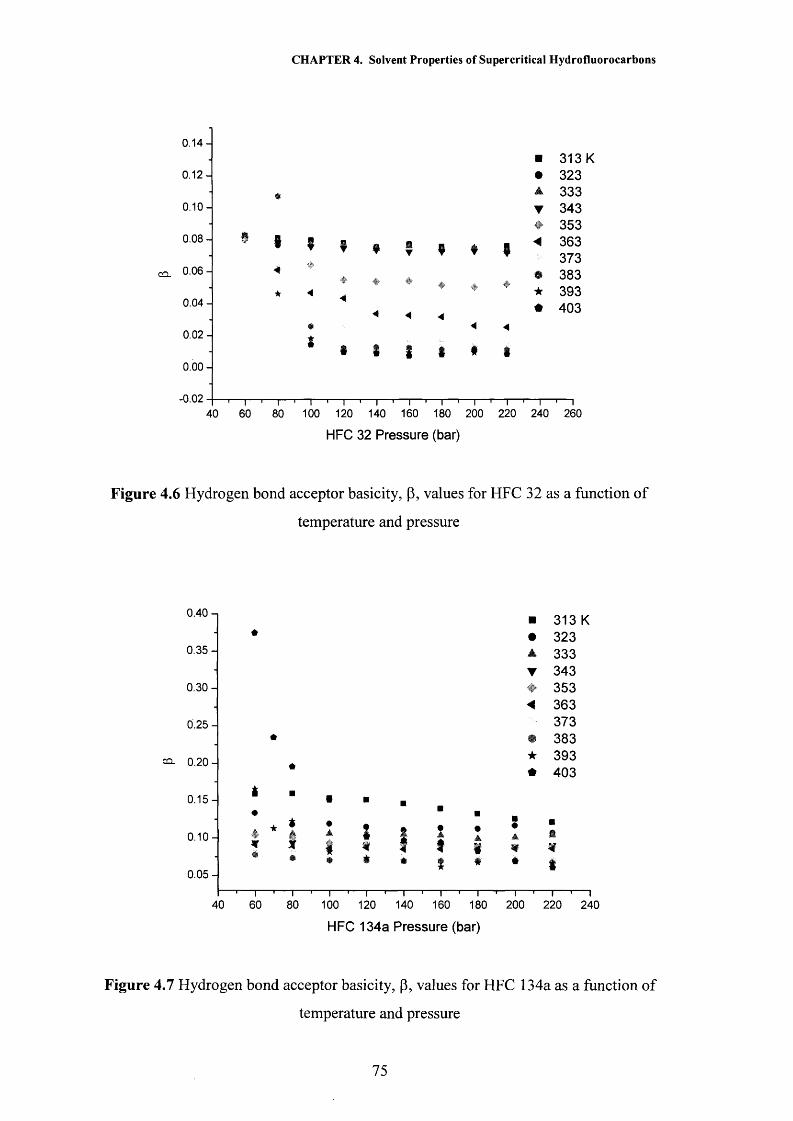
CHAPTER 4. Solvent Properties of Supercritical Hydrofluorocarbons
0.14-313 K323333343353363373383393403
0 . 1 2 -
0 . 1 0 -
0.08-
0.06-
0.04-
0 . 0 2 -
0 .0 0 -
- 0.0240 60 80 100 120 140 160 180 200 220 240 260
HFC 32 Pressure (bar)
Figure 4.6 Hydrogen bond acceptor basicity, P, values for HFC 32 as a function of
temperature and pressure
0.40 313 K323333343353363373383393403
0.35-
0.30-
0.25 -
ea. 0.20 -
0.15-
0 . 1 0 -
0.05-
40 80 100 120 140 160 180 200 220 24060
HFC 134a Pressure (bar)
Figure 4.7 Hydrogen bond acceptor basicity, p, values for HFC 134a as a function of
temperature and pressure
75
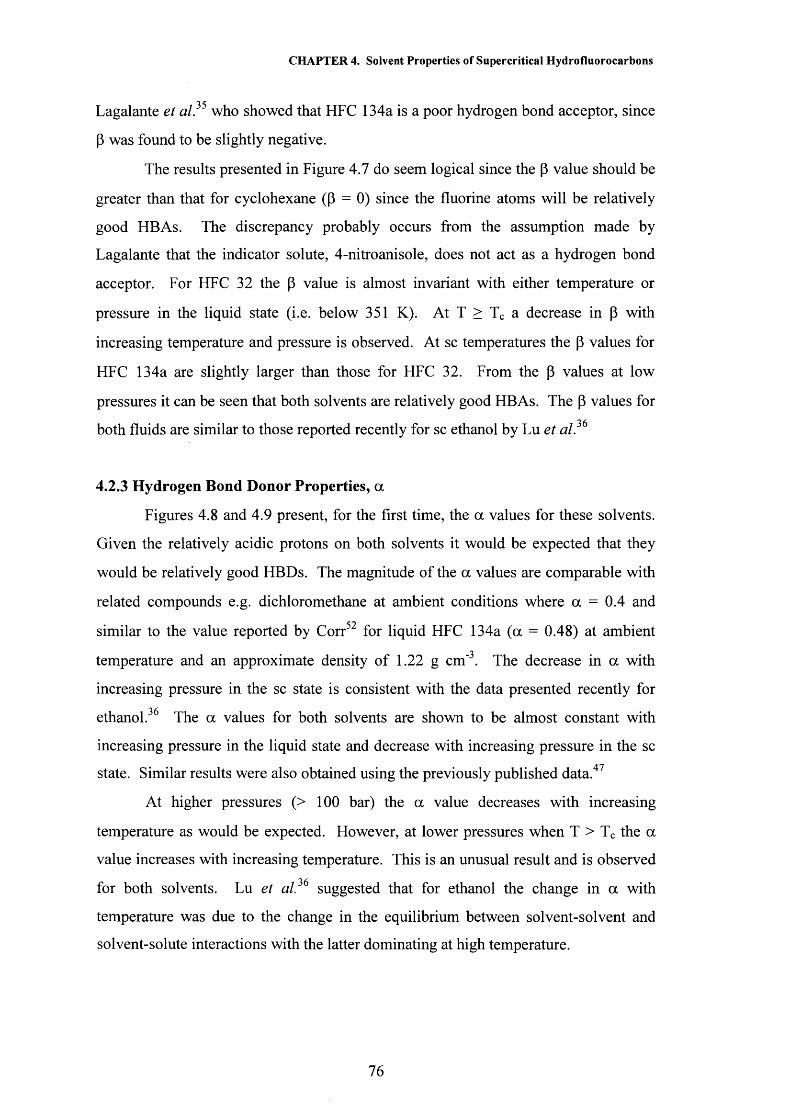
CHAPTER 4. Solvent Properties of Supercritical Hydrofluorocarbons
Lagalante et al?5 who showed that HFC 134a is a poor hydrogen bond acceptor, since
P was found to be slightly negative.
The results presented in Figure 4.7 do seem logical since the p value should be
greater than that for cyclohexane (P = 0) since the fluorine atoms will be relatively
good HBAs. The discrepancy probably occurs from the assumption made by
Lagalante that the indicator solute, 4-nitroanisole, does not act as a hydrogen bond
acceptor. For HFC 32 the p value is almost invariant with either temperature or
pressure in the liquid state (i.e. below 351 K). At T > Tc a decrease in p with
increasing temperature and pressure is observed. At sc temperatures the p values for
HFC 134a are slightly larger than those for HFC 32. From the p values at low
pressures it can be seen that both solvents are relatively good HBAs. The p values for
both fluids are similar to those reported recently for sc ethanol by Lu et al.
4.2.3 Hydrogen Bond Donor Properties, a
Figures 4.8 and 4.9 present, for the first time, the a values for these solvents.
Given the relatively acidic protons on both solvents it would be expected that they
would be relatively good HBDs. The magnitude of the a values are comparable with
related compounds e.g. dichloromethane at ambient conditions where a = 0.4 and
similar to the value reported by Corr for liquid HFC 134a (a = 0.48) at ambient'l
temperature and an approximate density of 1.22 g cm' . The decrease in a with
increasing pressure in the sc state is consistent with the data presented recently for'X f\ethanol. The a values for both solvents are shown to be almost constant with
increasing pressure in the liquid state and decrease with increasing pressure in the sc
state. Similar results were also obtained using the previously published data.47
At higher pressures (> 100 bar) the a value decreases with increasing
temperature as would be expected. However, at lower pressures when T > Tc the a
value increases with increasing temperature. This is an unusual result and is observed
for both solvents. Lu et a l36 suggested that for ethanol the change in a with
temperature was due to the change in the equilibrium between solvent-solvent and
solvent-solute interactions with the latter dominating at high temperature.
76
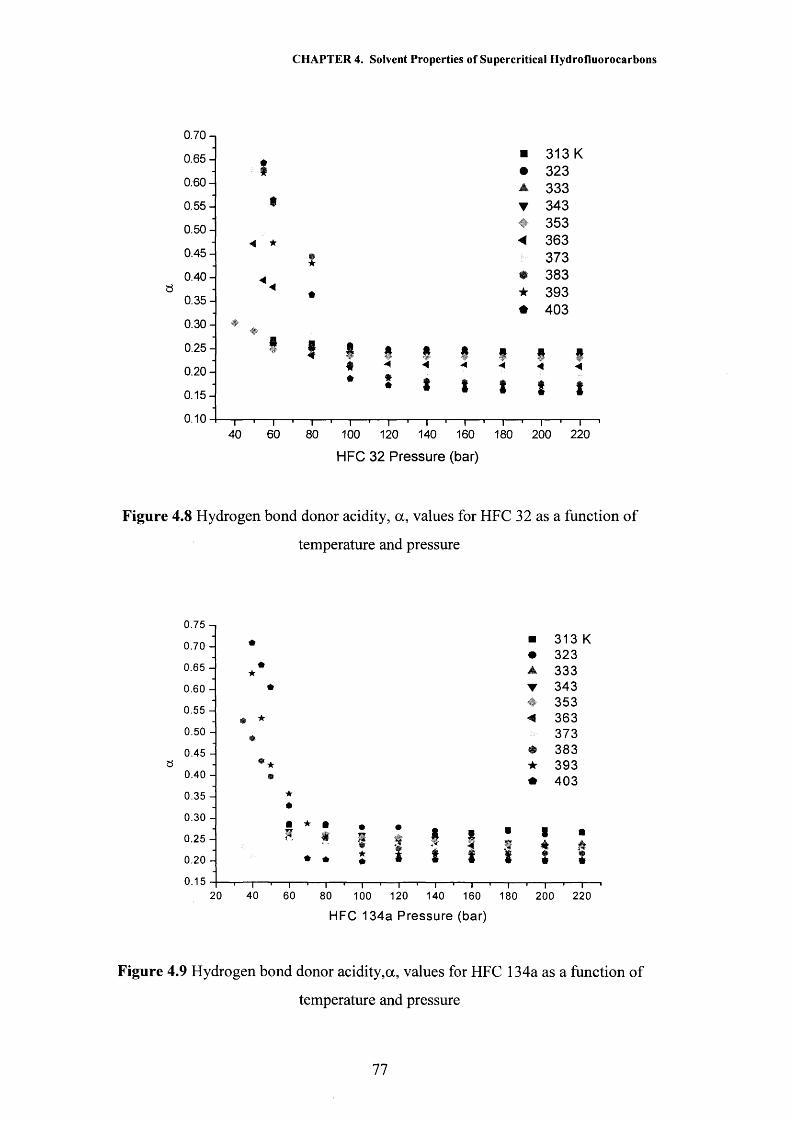
CHAPTER 4. Solvent Properties of Supercritical Hydrofluorocarbons
0.70 n313323333343353363373383393403
0.65-
0.60 -
0 .55-
0.50-
0.45-
0.40-S
0.35-
0.30-
0.25-
0.20
0.15-
0.1060 80 100 120 140 160 180 200 22040
HFC 32 Pressure (bar)
Figure 4.8 Hydrogen bond donor acidity, a , values for HFC 32 as a function of
temperature and pressure
0.75 -,313 K323333343353363373383393403
0.70 -
0.65 -
0.60 -
0.55 -
0.50 -
0.45 -a
0.40 -
0.35 -
0.30 -
0.25 -
0.20 -
0.1540 6020 80 100 120 140 160 180 200 220
HFC 134a Pressure (bar)
Figure 4.9 Hydrogen bond donor acidity,a, values for HFC 134a as a function of
temperature and pressure
77
CHAPTER 4. Solvent Properties of Supercritical Hydrofluorocarbons
It can be argued that because the a parameter gives a measure of the
equilibrium constant, K, between the solvent-solvent and solvent-solute interactions in
a liquid, then at low density it can be used to obtain an apparent enthalpy of hydrogen
bond formation A H 9 since
d l n K AH' da-------------= -------- = -------------- (4.9)d( l / T) R d( l / T)
where R is the gas constant and T in the temperature in Kelvin. Hence when p < 100
bar and T > Tc, da/dT is negative and hydrogen bond formation is exothermic. At 55
bar, for example, the data obeys Equation (4.9) well and yields an apparent enthalpy
of hydrogen bond formation of -9.2 kJ mol"1. The exothermic behavior is also
observed for HFC 134a although less data display this characteristic because of the
higher Tc. It is interesting to note that for all the data where da/dT is negative the
density of the solvent is less than the critical density, pc. It is around this density that
the solvation sheath is assumed to be complete and hence the decrease in hydrogen
bonding is most probably due to the competing solvent-solvent interactions with
neighbouring solvent molecules. This suggests that the same three-region density
model should also be evident for a as is observed for n*.
Figure 4.10 shows the a, p and 7i* values for HFC 32 as a function of solvent
density. The first point to notice is that HFC 32 is such an excellent solvent due in
part to the high density exhibited in the sc state. The density in the sc state is higher
than many common solvents in the liquid state at ambient conditions. It is also clear
from Figure 4.10 that this three-region density model does indeed exist for the a
parameter. Unfortunately it was not possible to confirm this for the p parameter
although the trend observed over the obtainable density range is remarkably linear
suggesting that density augmentation has little effect on the HBA properties of the
solvent. Figure 4.10 shows that at low density the polarity of this HFC is dominated
by hydrogen bond donor properties, which suggests that in the low density region the
solvent interaction is different to that at higher densities. Analogous results were
obtained for HFC 134a.
Figure 4.11 compares the polarity parameters for HFCs 32 and 134a as a
function of reduced density at a reduced temperature of 1.128 (HFC 32: T = 373 K;
HFC 134a: T = 403 K). It can be seen that at a given reduced density the HBA and
HBD parameters for HFC 134a are larger than those for HFC 32, which may be
78

CHAPTER 4. Solvent Properties of Supercritical Hydrofluorocarbons
0.6-
0 .4 -
0 .2 -<u 0)Ero 0.0 H co Q_& -0 .2-1 ro oQ_ -0.4-
- 0 .6 -
- 0.8
%★★*
* ★ t■* * * 1AA A iiJSk Am
■
4
■ ■■
1
.★A
■ TC★ aA (3
0i
200 400 600i
800 1000
HFC 32 density (kg m'3)
Figure 4.10 Polarity parameters for HFC 32 as a function of reduced density
00E2TOCL>.
0 .7 -
0 .6 -
0 .5 -
0 .4 -
0 .3 -
0 .2 -
0.1 -
0 . 0 -
ro -0 .1 - oCL -0.2 -
-0 .3-
-0 .4-
-0 .5-—r~0.2
- ■ - H F C 32 tc*• HFC 32 a A HFC 32 p
- □ - H F C 134a tc* O HFC 134a a A HFC 134a p
Q, Q—-0-O'GOO....
A...
0.4 0.6“ I-0.8
T -1.0
—r - 1.2
—I-1.4 1.6
I1.8 2.0
Reduced Density
Figure 4.11 Polarity parameters for HFC 32 and 134a as a function of reduced
density at a constant reduced temperature (1.128)
79

CHAPTER 4. Solvent Properties of Supercritical Hydrofluorocarbons
expected given the differences in dipole moment (2.058 and 1.987 D respectively). In
contrast the n* for HFC 32 is larger than that for HFC 134a possibly due to the
difference in size and the ability to pack more of the smaller solvent molecules around
the indicator solute. The two solvents show points of inflection for all three
parameters at approximately the same reduced density confirming that they both obey
the same three-region density model.
Cross correlation of the parameters presented above also yields some
interesting results. Figure 4.12 shows the correlation between a and n* for HFC 32
as a function of reduced density. Two distinct regions are observed, one with a
positive and one with a negative correlation between the parameters. At high
densities in the ‘liquid-like’ region (pr > 1) there is a small, positive correlation of a
and 7i* and this is linearly dependent on density, suggesting it is just the packing of
solvent molecules around the solute that affects these two parameters. In the ‘gas-
like’ region (pr < 1) both parameters change more significantly with density.
Importantly, a negative correlation is observed between the parameters and da/d7i*
increases with increasing temperature. Exactly the same trend is observed for HFC
134a shown in Figure 4.13. The two solvents differ only in the reduced density at
which the point of inflection occurs (for HFC 32 it is c.a. 0.4 whereas for HFC 134a it
is c.a. 0 .6 ).
There are two possible scenarios that could lead to this effect; either the
solvent-solvent interactions are weakened as the inter-solvent separation increases
(allowing the solvating molecules to interact more strongly with the solute) or the
solvation sheath is incomplete and the solvent molecules cluster preferentially around
the hydrogen bonding moieties. To analyse these scenarios it is important to
determine the local solvent density by assuming that if local density augmentation did
not occur then iC would increase linearly with density as it does in the liquid state
(and the sc state at high pressures) . 53 Figure 4.14 shows the value of the a parameter
as a function of the average local intermolecular separation for HFC 32. Increasing
the distance between the solvating molecules to about 5 to 6 A causes a significant
increase in a suggesting that decreased solvent-solvent interactions play a key role in
influencing solvent-solute interactions. However, since under the low-density
conditions, where a increases significantly, the solvation sheath is incomplete,
hydrogen bond interactions will be larger than dipole-dipole or dipole-induced dipole
80

CHAPTER 4. Solvent Properties of Supercritical Hydrofluorocarbons
0.60.5
0.4 0.00.2 -0.5
Figure 4.12 Cross-correlation between hydrogen bond donor acidity, a , the
polarisability/dipolarity, 7t*, and the reduced density, pr for HFC 32
2
1
0.50.6 o.o
0.471*-0.50.2
Figure 4.13 Cross-correlation between hydrogen bond donor acidity, a , the
polarisability/dipolarity, n*, and the reduced density, pr for HFC 134a
81

CHAPTER 4. Solvent Properties of Supercritical Hydrofluorocarbons
0.65-
0.60-
0.55-
0.50-
0.45-
0 .40-■ 353 K
363 A 373
383 393
< 403
s 0.35-
0.30-
0.25-
0 . 2 0 -
0.15-
0.109 105 6 87
Average Local Intermolecular Distance (A)
Figure 4.14 Change in hydrogen bond donor acidity, a , with intermolecular distance
for HFC 32
82

CHAPTER 4. Solvent Properties of Supercritical Hydrofluorocarbons
interactions and it is probable that the solvent interacts with the indicator solute
preferentially at the polar groups. The computer simulation by Tucker54 showed that
the local solvent density around a solute was larger around a polar functional group
and supports this idea.
Figure 4.15 shows the correlation between a and p for both solvents and while
this cannot interrogate the low-density region because of the lack of p data it is clear
that the two parameters are related. For HFC 32 a well defined correlation is
observed where dp/da is small under liquid and sc conditions and larger in the near
critical regime. Considerably more scatter is seen for HFC 134a, although a general
positive correlation is observed which would be expected. The difference between the
two solvents is difficult to rationalize although the generally larger p value for HFC
134a suggest that solvent-solvent interactions through hydrogen bonding may be more
important than in HFC 32.
4.2.4 Solubility Modelling
The ability to predict accurately the solubility of a molecule in a sc fluid is of
great industrial importance. There have been many studies dedicated to the prediction
of solubilities employing for example computer simulation,55'57 equations-of-state55f f co
and linear solvation energy relationships (LSER). ’ The LSER is based on that first
developed by Kamlet et al. 59 As there is a plethora of solubility data in the literature
using sc CO2 the construction of these models has been carried out to a high degree of
accuracy. This work looks to model the solubility data in Chapter 3 using a LSER of
the form shown in Equation (4.3).
The LSER used to model Log S (in mole fraction) incorporates the solvent
properties measured earlier in this chapter and is given by
LogS = LogS0 + S 7 T * +aa + bp (4.10)
where s, a and b are coefficients relating to the solute interactions and /r*, a and f3
relate to the solvent interactions. A data set of 11 molecules, at a constant
temperature of 363 K and varying pressures in the range 70 to 270 bar, totalling 53
data points was used. The coefficients were calculated using a multiple regression
analysis and from this the following LSER was obtained
83

CHAPTER 4. Solvent Properties of Supercritical Hydrofluorocarbons
0 .2-1
'■ > 1 ■0.1 -| ■ \ a #
- b ■■ l|p ■ *
« * . . * * • * < * * •■ ■
* *ifc
* A * * ■ HFC 134a********* * * * ★ HFC 32
o.o-I
, ! 1 1 1 1
0.15 0.20 0.25 0.30
Figure 4.15 Cross-correlation between the hydrogen bond donor acidity, a , and the
hydrogen bond acceptor basicity, (3, for HFC 32 and 134a
84

CHAPTER 4. Solvent Properties of Supercritical Hydrofluorocarbons
LogS = 2.13574 - 8.12413;r * -6.86849a - 57.50452/? (4.11)
n = 53, r = 0.39364, sd = 0.31216, % AARD = 27.03
The correlation statistics obtained from using this model are also shown where
r is the correlation coefficient of the regression, sd is the standard deviation of the
LSER equation and % AARD is the percentage average absolute relative deviation in
predicting the reported values. Figure 4.16 shows the correlation for this model
between the predicted and measured results. On inspection of this and the statistics
presented above it can be seen that these solvent properties alone do not form an
accurate LSER for the prediction of solubilities. This may be due to the fact that the
data set is too small and/or there are numerous properties of the solutes that also
influence their solubilities that have to be taken into consideration.
Abraham60 used five physicochemical properties in a LSER that also include
solute properties to describe solubility as shown in Equation (4.12).
LogS - LogS0 + S 7 r * +aa + b/3 + rR + vV (4.12)
where R is the excess molar refraction and V is the McGowens characteristic volume
of the solute. To apply this LSER these extra solute descriptors must be known or
estimated. For the majority of the solutes studied in this work these were available
and are shown in Table 4.2.60,61 The solute descriptors were measured at 278 K but it
has been assumed that the values, relative to each other, remain constant up to 363 K.
Due to the lack of data on certain solutes the data set for this LSER was reduced to 9
molecules and 46 data points. The coefficients were once again obtained by a
multiple regression analysis and the LSER obtained is shown below.
LogS = 44.03802 -1 .33824tt * +2.68406^ -18.875310 +
2.327817? - 52.83497F (4.13)
n = 46, r = 0.96515, sd = 0.23694, % AARD = 9.157
Figure 4.17 shows the correlation using this LSER and it can be seen from the graph
and the correlation statistics that including these solute properties dramatically
improves the LSER model.
85

CHAPTER 4. Solvent Properties of Supercritical Hydrofluorocarbons
cnO)o_iT30OT30
CL -
■2.6 i
2 . 8 -
3,0 -
3 .2 -
3 .4 -
3 .6-
3 .8 -
4 .0 -
■4.2-
4 .4 -
4 .6 -
4 .8 -
5 .0 -
5.2-5.0
p-HBAp-TolAp-ABAp-CBAp-APo-HBAm-HBAo-CBAAnthraceneParacetamol
-4.5I
-4.0—r~-3.5 -3.0 -2.5
Measured LogS
- 2.0 -1.5 - 1.0
Figure 4.16 Comparison of measured Log solubility and those predicted by the LSER
of Equation (4.11)
i 1------ 1------ 1------ 1------ >------ 1------ «------ 1------ •------ 1------ •-------r--4.5 -4.0 -3.5 -3.0 -2.5 -2.0 -1.5
M easured LogS
Figure 4.17 Comparison of measured Log solubility and those predicted by the LSER
of Equation (4.13)
8 6
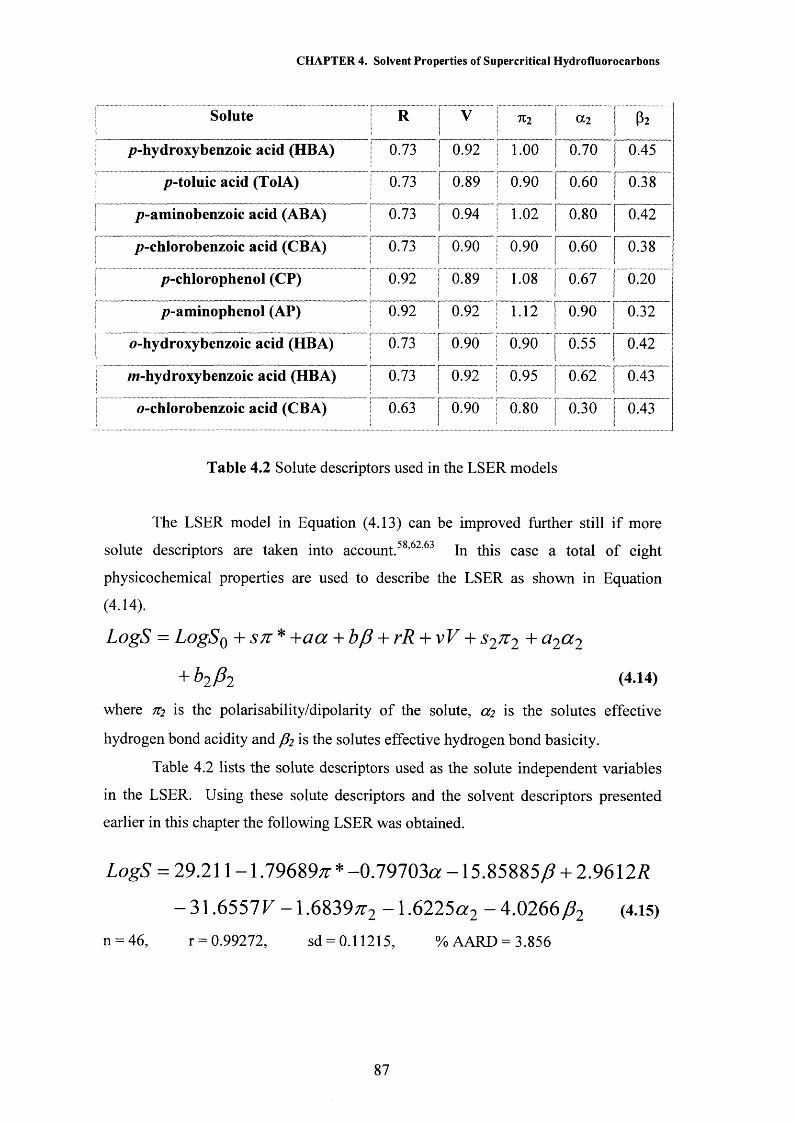
CHAPTER 4. Solvent Properties of Supercritical Hydrofluorocarbons
Solute R i vi
n 2 | a 2 P2
p-hydroxybenzoic acid (HBA) 0.73 P~iX92i
1.00 ro?7o—1I0.45
p-toluic acid (TolA) 0.73 r 0.89 0.90 I 0.60 0.38
p-aminobenzoic acid (ABA) 0.73 1 0.94i
1.02 p T 8 0 r 0.42
/7-chlorobenzoic acid (CBA) 0.73 | 0.90 0.90 | 0.60 0.38
p-chlorophenol (CP) 0.92 | 0.89 1.08 [ 0.67I
0.20
p-aminophenol (AP) 0.92 0.92i
1.12 ! 0.90 0.32
0-hydroxybenzoic acid (HBA) 0.73 r 0 .9 0 0.90 0.55 0.42
m-hydroxybenzoic acid (HBA) 0.73 r w ^ 0.95 | 0.62!
0.43
0-chIorobenzoic acid (CBA) 0.63 j 0.90 0.80 | 0.30 0.43
Table 4.2 Solute descriptors used in the LSER models
The LSER model in Equation (4.13) can be improved further still if more
solute descriptors are taken into account.58,62,63 In this case a total of eight
physicochemical properties are used to describe the LSER as shown in Equation
(4.14).
LogS = LogSo + sn * +aa + bp + rR + vV + s2^2 + a2a 2
+ b2fi2 (4-14)
where 712 is the polarisability/dipolarity of the solute, 0 ,2 is the solutes effective
hydrogen bond acidity and P2 is the solutes effective hydrogen bond basicity.
Table 4.2 lists the solute descriptors used as the solute independent variables
in the LSER. Using these solute descriptors and the solvent descriptors presented
earlier in this chapter the following LSER was obtained.
LogS = 29.211 -1.79689# * -0.79703a -15.85885/9 + 2.96127?
- 31 , 6 5 5 1 V - 1,6839#2 - 1 -6225a2 - 4.0266p 2 (4.15)
n = 46, r = 0.99272, sd = 0.11215, % AARD = 3.856
87

CHAPTER 4. Solvent Properties of Supercritical Hydrofluorocarbons
The correlation for this LSER is shown in Figure 4.18 where an excellent agreement
between predicted and measured values is observed.
It can be seen that for the solutes under investigation in this study, these
models allow the possibility of predicting their solubilities with an accuracy of, at
maximum, around 0.3 mole fraction units. The accuracy of these models is found to
be highly dependent on the number of descriptors used. The coefficients of these
LSER should give an indication of the relative importance of each descriptor when a
solute is solved in HFC 32. Tables 4.3 - 4.5 list the coefficients, standard errors (S.E.)
and the t-values for the LSER in Equations (4.11), (4.13) and (4.15) respectively. The
t-value is the ratio of the regression coefficient to its standard error and this can be
used to test the significance of each coefficient.
Variable | Coefficient j" S.E. | t-value
■k*............... |............. -S. 12413.......... [......9.40636........... | -0.85X21
_ j 4^86849 j” 18.36068 | 4K37409
_ j I5 7 J0452 | 5 0 8 9 4 2 9 ( 4 .1 2 9 8 9
Table 4.3 Coefficients, S.E. and t-values for the variables in Equation (4.11)
On inspection of the t-values in Table 4.3 the most significant term is the p
term. This p variable has the largest t-value and because it is negative, it shows that
the stronger a solutes hydrogen bond acceptor basicity, the less it will be solvated by
the HFC 32.
When solute descriptors are added to the LSER it can be seen from Tables 4.4
and 4.5 that the standard errors associated with the coefficients decrease. From these
LSER it is observed that the variable V dominates the solubility in both models. The
t-values for V in both cases are large and negative, which, as expected, indicates that
the solubility of solutes in HFC 32 is favoured if it is small.
8 8
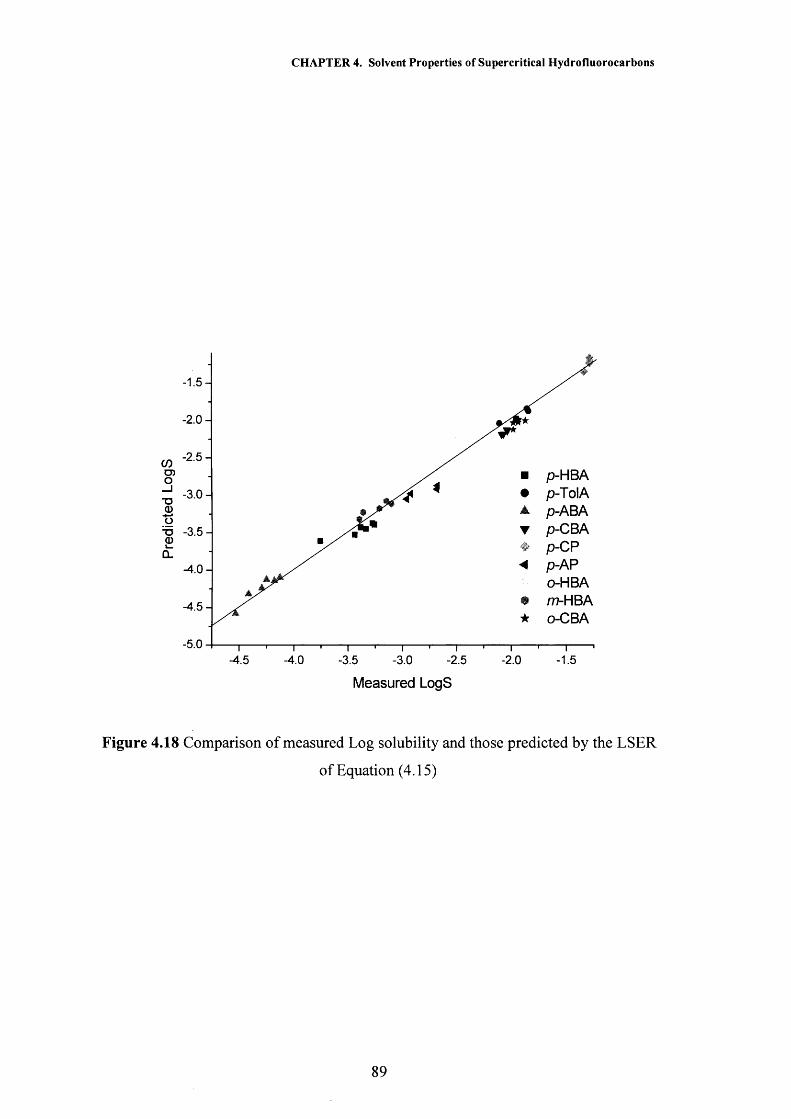
Pred
icte
d L
ogS
CHAPTER 4. Solvent Properties of Supercritical Hydrofluorocarbons
■ p-HBA• p-TolA A p-ABA T p-CBA♦ p-CP < p-AP
o-HBA• att-HBA★ o-CBA
—i----- 1------1----- 1----- 1----- 1----- 1----- 1----- 1----- 1----- 1----- 1------1-4.5 -4.0 -3.5 -3.0 -2.5 -2.0 -1.5
Measured LogS
Figure 4.18 Comparison of measured Log solubility and those predicted by the LSER
of Equation (4.15)
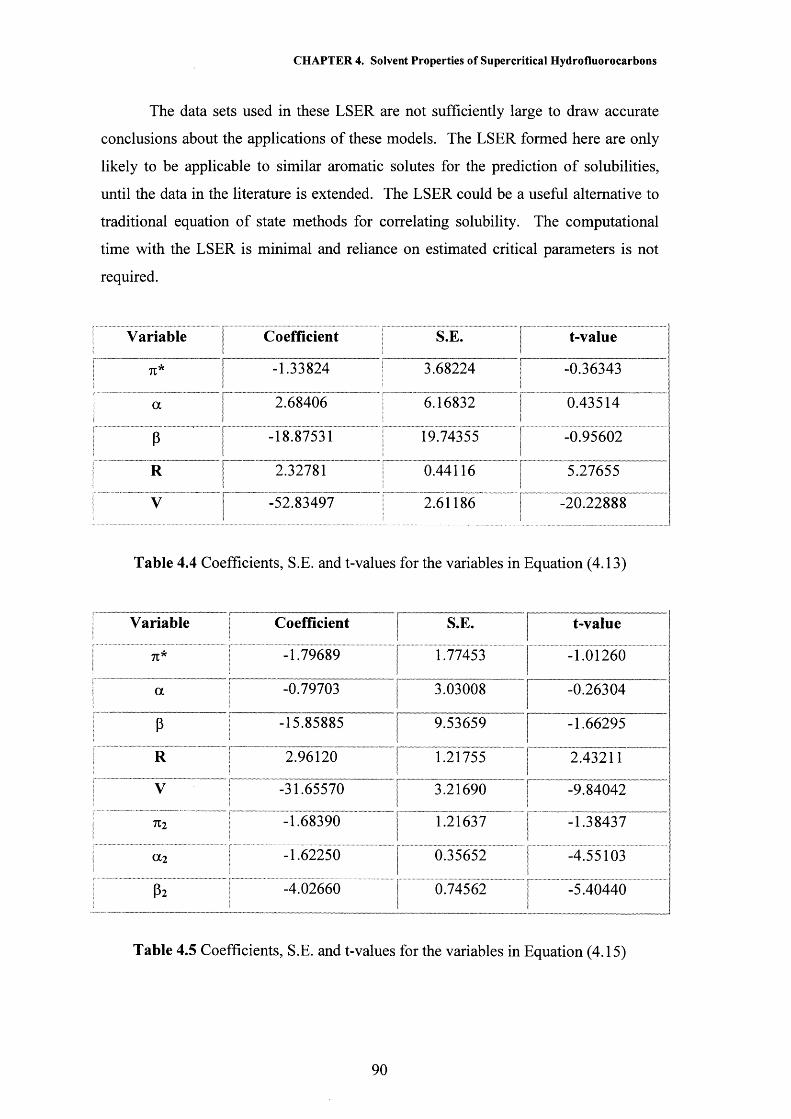
CHAPTER 4. Solvent Properties of Supercritical Hydrofluorocarbons
The data sets used in these LSER are not sufficiently large to draw accurate
conclusions about the applications of these models. The LSER formed here are only
likely to be applicable to similar aromatic solutes for the prediction of solubilities,
until the data in the literature is extended. The LSER could be a useful alternative to
traditional equation of state methods for correlating solubility. The computational
time with the LSER is minimal and reliance on estimated critical parameters is not
required.
| Variable | Coefficient S.E. ..j...... t-value
1 n * | -1.33824 3.68224 i -0.36343
aI 1
268^ 06 -6.16832
10.43514
P -18.87531 19.74355 I! -0.95602
1 r r___ _
044H 6 jii
___| y j" -52.83497 2.61186
i-20.22888
Table 4.4 Coefficients, S.E. and t-values for the variables in Equation (4.13)
Variable Coefficient | S.E. | t-value
71* -1.79689 | 1.77453 | -1.01260
a -0.79703 | 3.03008 | -0.26304
P -15.85885 1 9.53659 |~” -1.66295
R | L21755 j_____
V : -31.65570 I 3.21690 T_____
n2 -1.6X390 [..~i
1.21637 [!
_ _ _
a 2 -1.62250 | 0.35652 [i
-4.55103
P2 -4.02660 | 0.74562 [i
-5.40440
Table 4.5 Coefficients, S.E. and t-values for the variables in Equation (4.15)
90

CHAPTER 4. Solvent Properties of Supercritical Hydrofluorocarbons
4.2.5 Partition Coefficient Modelling
Bruno and co-workers measured the water-HFC 134a partition coefficients for a
set of 11 organic solutes in the gas and sc phases of HFC 134a. They then developed
a LSER to predict the measured partition coefficients using the Kamlet and Taft
descriptors of the solvent and solute molecules as independent variables.
The LSER was similar in form to Equation (4.14) but the solubility, S, is
substituted by the partition coefficient, K, and the solvent a and p terms are omitted
from the equation. In this work the same data set is used but the solvent n* value
used by Bruno et al. is substituted for those calculated for HFC 134a earlier in this
chapter. Incorporating all this data found the following LSER.
LogK = -0.35771 + 3.91812;r * -0.507127? + 2.8837F
-0.29097^2 -2 .53015a2 -2.63785/?2 (4.16)
n = 102, r = 0.966, sd = 0.19227, % AARD = 29.09
The correlation statistics are also reported and in Figure 4.19 where the
correlation between predicted and measured values of the water-HFC 134a partition
coefficient is shown. Using the values of 7i* from this work it can be seen that the
correlations have been slightly improved from the LSER of Bruno. The predictive
ability from this model is within the acceptable error range for measurements in sc
fluids and is comparable to EOS uncertainties.
Direct comparison of the coefficients in Equation (4.16) should give an
indication of the relative importance of each descriptor. Table 4.6 shows the
coefficients, S.E. and t-values for the coefficients in this equation. The t-value gives
the best indication of coefficient significance and it can be seen that n* is the most
significant descriptor with the largest value. This value is positive, indicating that the
higher the density of the sc HFC 134a, the higher the solvent strength and the greater
the partitioning of the organic solvent.
Table 4.6 also shows that the partition coefficients strongly depend on the
solutes hydrogen bond donor ability, hydrogen bond acceptor ability and the volume,
with the other descriptors being less significant. The large positive t-value displayed
by V means that larger molecules prefer water to HFC 134a. The large negative t-
91

pred
icte
d lo
gK
CHAPTER 4. Solvent Properties of Supercritical Hydrofluorocarbons
■ Benzoic acid• Benzyl alcohol A Caffeine▼ Cyclohexanone• 4-Nitroaniline ■< 2-Nitrophenol
4-Chloroaniline• 2-Hexanone• 4-Methyl-2-pentanone• Phenol+ 4-f-Butylphenol
M easured logK
Figure 4.19 Comparison of measured water-HFC 134a partition coefficients and
those predicted by the LSER of Equation (4.16)
92

CHAPTER 4. Solvent Properties of Supercritical Hydrofluorocarbons
value for the P2 coefficient means that the stronger a solutes hydrogen bond basicity
the less it will be partitioned into the HFC 134a and the ct2 term is analogous to this
but represents the solutes hydrogen bond acidity.
Variable Coefficient_
~ rt-value
71* 3.91812 | 0.183041
21.40523
R -0.50712 | 0.10068 1 -5.03703
V.
2.88370 | 0.15857 1 18.18538
712 -0.29097 1* 0.10171i
j -2.86092
a 2 -2.53015 [ 0.119081
-21.24675
P2 -2.63785 | 0.12622I 1
-20.89853
Table 4.6 Coefficients, S.E. and t-values for the variables in Equation (4.16)
This model successfully predicts water-HFC 134a partition coefficients. The
relative size of the coefficients allow the importance and influence of each descriptor
to be determined and in the case of these partition coefficients the main contributing
factor was 71*, which means that partitioning into the HFC 134a is increased if the
density of the HFC 134a is increased.
93

CHAPTER 4. Solvent Properties of Supercritical Hydrofluorocarbons
4.3 Conclusions
This work has shown that HFCs 32 and 134a have significant hydrogen bond
donor characteristics, particularly in the sc state. The hydrogen bond donor properties
of the solvents decrease with increasing pressure and this trend is suggested to be due
to a decrease in solvent-solvent interactions and an increase in the preferential
solvation around the polar moieties as the local solvent density decreases.
The Log solubility of aromatic solutes in HFC 32 was modelled using the
solvent properties obtained in this study and published solute descriptor data. The
LSER approach was found to be successful for the solutes under investigation and can
rival equation of state methods. The accuracy of this LSER model was found to
increase with the addition of a number of solute descriptors but the data set was not
large enough to draw any accurate conclusions about the applicability of this model to
predict other solute solubilities. It is thought however, that it would be successful for
the prediction of solubilities with similar aromatic solutes.
Using 7T* values from this work a slightly improved LSER was observed for
the water-HFC 134a partition coefficients of organic solutes. This model had a %
AARD of 29.09, which means the accuracy of this model rivals equation of state
methods. The t-value for the descriptor coefficients gave an indication of the relative
importance and influence of each descriptor. It was found that 7t* dominates and
partitioning into the HFC 134a phase increases as the density, and hence solvent
strength increases.
94

CHAPTER 4. Solvent Properties of Supercritical Hydrofluorocarbons
4.4 References
(1) Abbott A, P.; Eardley C, A. J. Phys. Chem. B 1998,102, 8574.
(2) Abbott A, P.; Eardley C, A. J. Phys. Chem. B 1999,103, 2504.
(3) Atkins P, W. Physical Chemistry, 5 ed.; Oxford University Press: Oxford,
1996.
(4) Suppan P.; Ghoneim N. Solvatochromism; Royal Society of Chemistry:
Cambridge, 1997.
(5) Hollas J, M. Modern Spectroscopy,; Wiley: Chichester, 1992.
(6) Abraham M, H. J. Am. Chem. Soc. 1982,104, 2085.
(7) Battino R.; Clever H, L. Chem. Rev. 1966,16, 395.
(8) Davies M. Molecular Behaviour, Pergamon Press: Oxford, 1965.
(9) Reichardt C. Chem. Rev. 1994, 94, 2319.
(10) Reichardt C. Solvents and Solvent Effects in Organic Chemistry, 2 ed.; VCH
Publishers: Weinheim, 1988.
(11) Reichardt C. Angew. Chem. 1965, 77, 30.
(12) Grunwald E.; Winstein S. J. Am. Chem. Soc. 1948, 70, 841.
(13) Brooker L, G, S.; Craig A, C.; Heseltine D, W.; Jenkins P, W.; Lincoln L, L. J.
Am. Chem. Soc. 1965, 87, 2443.
(14) Kosower E. J. Am. Chem. Soc. 1958, 80, 3253.
(15) Kosower E. Physical Organic Chemistry', Wiley: New York, 1968.
(16) Dimroth K.; Reichardt C.; Siepmann T.; Bohlmann F. Lieb. Ann. Chem. 1963,
661, 1.
(17) Reichardt C. Angew. Chem. 1979, 91, 119.
(18) Taft R, W.; Abboud J-L, M.; Kamlet M, J.; Abraham M, H. J. Soln. Chem.
1985,14, 153.
(19) Kamlet M, J.; Abboud J-L, M.; Taft R, W. J. Am. Chem. Soc. 1977, 99, 6027.
(20) Kamlet M, J.; Taft R, W.; Abboud J-L, M. Prog. Phys. Org. Chem. 1981, 13,
485.
(21) Bekarek V, J. J. Phys. Chem. 1981, 85, 722.
(22) Brady J, E.; Carr P, W. J. Phys. Chem. 1985, 89, 1813.
(23) Nicolet P.; Laurence C, J. J. Chem. Soc., Perkin Trans. 1986, 2, 1071.
(24) Laurence C, J.; Nicolet P.; Dalati M, T.; Abboud J-L, M.; Notario R. J. Phys.
Chem. 1994, 98, 5807.
(25) Kamlet M, J.; Abboud J-L, M.; Taft R, W. J. Am. Chem. Soc. 1976, 98, 377.
95

CHAPTER 4. Solvent Properties of Supercritical Hydrofluorocarbons
(26) Kamlet M, J.; Abboud J-L, M.; Taft R, W. J. Am. Chem. Soc. 1976, 98, 2886.
(27) Hildebrand J, H.; Scott R, L. The Solubility o f Non-Electrolytes, 3 ed.; Dover
Publisher: New York, 1964.
(28) Kamlet M, J.; Taft R, W.; Abboud J-L, M.; Abraham M, H. J. Org. Chem.
1983, 48, 2877.
(29) Sigman M, E.; Lindley S, M.; Leffler J, E. J. Am. Chem. Soc. 1985,107, 1471.
(30) Yonker C, R.; Frye S, L.; Kalkwarlf D, R.; Smith R, D. J. Phys. Chem. 1986,
90, 3022.
(31) O'Neill M, L.; Kruus P.; Burk R, C. Can. J. Chem. 1993, 71, 1834.
(32) Maiwald M.; Schneider G, M. Ber. Bunsen. Phys. Chem. 1998,102, 960.
(33) Abbott A, P.; Eardley C, A.; Scheirer J, E. J. Phys. Chem. B 1999,103, 8790.
(34) Smith R, D.; Frye S, L.; Yonker C, R.; Gale R, W. J. Phys. Chem. 1987, 91,
3059.
(35) Lagalante A, F.; Hall R, L.; Bruno T, J. J. Phys. Chem. B 1998,102, 6601.
(36) Lu J.; Boughner E, C.; Liotta C, L.; Eckert C, A. Fluid Phase Equilib. 2002,
198, 37.
(37) Lu .J; Brown J, S.; Boughner E, C.; Liotta C, L.; Eckert C, A. Ind. Eng. Chem.
Res. 2002, 41, 2835.
(38) Yonker C, R.; Smith R, D. J. Phys. Chem. 1988, 92, 2304.
(39) Kim S.; Johnston K, P. AIChEJ. 1987, 33, 1603.
(40) Sun Y, P.; Bennett G.; Johnston K, P.; Fox M, A. J. Phys. Chem. 1992, 96,
10001 .
(41) Zhang .J; Lee L, L.; Brennecke J, F. J. Phys. Chem. 1995, 99, 9268.
(42) Latimer W, M.; Rodebush W, H. J. Am. Chem. Soc. 1920, 42, 1419.
(43) Marcus Y. Chem. Soc. Rev. 1993, 22, 409.
(44) Marcus Y. J. Soln. Chem. 1991, 20, 929.
(45) Kim S.; Johnston K, P. Ind. Eng. Chem. Res. 1987, 26, 1206.
(46) Bennett G, E.; Johnston K, P. J. Phys. Chem. 1994, 98, 441.
(47) Eardley C, E. PhD, University of Leicester, 2000.
(48) Lagalante A, F. Private Communication.
(49) Edwards J, T. J. Chem. Educ. 1970, 47, 261.
(50) Spartan Pro, W. I., Irvine, CA, USA.
(51) Essfar M.; Guiheneuf G.; Abboud J-L, M. J. Am. Chem. Soc. 1982, 104, 6786.
(52) Corr S. J. Fluor. Chem. 2002,118, 55.
96

CHAPTER 4. Solvent Properties of Supercritical Hydrofluorocarbons
(53) Johnston K, P.; Kim S.; Combes J. ACSSymp. Ser. 1989, 406, 52.
(54) Tucker S, C. Chem. Rev. 1999, 99, 391.
(55) Saunders R, A.; Platts J, A. J. Phys. Org. Chem. 2001,14, 612.
(56) Famini G, R.; Wilson L, Y. J. Phys. Org. Chem. 1993, 6, 539.
(57) Politzer P.; Lane P.; Murray J, S.; Brinck T. J. Phys. Chem. 1992, 96, 7938.
(58) Catchpole O, J.; Proells K. Ind. Eng. Chem. Res. 2001, 40, 965.
(59) Kamlet M, J.; Taft R, W.; Abboud J-L, M. J. Am. Chem. Soc. 1977, 91, 8325.
(60) Abraham M, H. Chem. Soc. Rev. 1993, 22, 73.
(61) Abraham M, H.; Haftvan J, A.; Whiting G, S.; Leo A. J. Chem. Soc., Perkin
Trans. 1994, 2, 1777.
(62) Lagalante A, F.; Clarke A, M.; Bruno T, J. J. Phys. Chem. 1998,102, 8889.
(63) Lagalante A, F.; Bruno T, J. J. Phys. Chem. 1998,102, 907.
97

EQUILIBRIUM REACTIONS IN
SUPERCRITICAL MEDIA
5.1 Introduction
5.1.1 Chemical Equilibrium Constants
5.1.2 Dependence of Equilibrium & Rate Constants on Temperature & Pressure
5.1.3 Equilibrium Reactions in Supercritical Fluids
5.2 Results and Discussion
5.2.1 Esterification Reaction
5.2.2 Aldol Condensation Reaction
5.3 Conclusions
5.4 References

CHAPTER 5. Equilibrium Reactions in Supercritical Media
5.1 Introduction
An increase in environmental awareness has led to stringent regulations on the
use and disposal of hazardous materials by the chemical industry. There are a number
of reaction components that could be replaced to make the chemical industry
‘greener’ and more environmentally friendly. An obvious target for replacement is
the solvent and supercritical (sc) fluids are one of a number of possible alternatives to
conventional organic solvents.
This work studies the esterification and aldol equilibrium reactions in sc HFC
32. HFC 32 is used as the reaction solvent rather than the traditionally used sc solvent
CO2 as it has a much higher dielectric constant and density. The higher dielectric
constant value means that reactions will not be limited by the solubility of the
reagents and catalysts. Other environmental benefits including the fact that HFC 32 is
non-toxic, ozone friendly and recyclable add to the attractiveness of using it as a sc
solvent.
The dielectrometry technique, used in Chapter 3 to measure solubilities, is
shown in this work to be suitable to follow the progress of the esterification and aldol
reactions. This technique can be used to follow changes in reactant/product
concentration with time. These measurements show when the equilibrium condition is
attained and then equilibrium constants for the reaction can be calculated.
Dielectrometry is found to be a quick, simple, in situ method for following
equilibrium reactions and is not limited by the concentration of species in solution.
The first equilibrium reactions in sc HFC 32 are reported in this work and by
using the newly proposed dielectrometry technique, for the first time it is possible to
follow the extent of these equilibrium reactions and calculate equilibrium constants.
In particular, the effect of pressure on the progress of these equilibrium reactions is
discussed.
5.1.1 Chemical Equilibrium Constants
Many chemical processes exist in a state of balance in which the starting
material is not completely converted to products so both reactants and products are
present. This state of balance is called an equilibrium. At this equilibrium state the
reactants and products have no further tendency to undergo net change so the
quantities of all species present in the mixture remain constant, although the reaction
99

CHAPTER 5. Equilibrium Reactions in Supercritical Media
is still continuing. This is because the rates of the forward and back reactions are
equal.
For example, looking at a general reaction written in the form
ciA. + bB c C + d D
If the reaction is allowed to reach equilibrium and then the equilibrium concentrations
are measured, these can be combined into an expression for the equilibrium constant
as shown belowI d
r [ C ] c[ D ] ‘K = „ (5.1)[A mwhere A, B, C and D are the equilibrium concentrations of reactants and products and
a, b, c and d are the stoichiometric constants in the chemical equation.
In a sc fluid the pressure of the system affects the activity of reactants and
products, therefore, the equilibrium constant should be expressed in terms of mole
fraction instead of concentration giving
K = rcx cr„x». = KK (5.2)rAxAyBxB r
and
K r = (5.3)T J n
r X cX »K x = c (5.4)
where X a, X b, X c and X d are the mole fractions of A, B, C and D at equilibrium
conditions respectively. Kx is the apparent equilibrium constant and /a , /b, Yc and yd
are the activity coefficients, which have not yet been thoroughly researched in sc
fluids. To my knowledge, the only study on measuring activity coefficients in sc
fluids has been carried out by Abbott and Durling. 1 In this work it was shown that
the activity coefficients for ferrocene carboxylic acid, in HFC 32 at 363 K, behaved
ideally at low pressures but decreased as the pressure was increased.
The equilibrium constant for a particular reaction has the same value
irrespective of the initial amounts of A, B, C and D, provided the temperature is kept
constant. If the value of Kx < 1 then mostly reactants are present and if Kx > 1 then
mainly products are present at equilibrium.
100

CHAPTER 5. Equilibrium Reactions in Supercritical Media
5.1.2 Dependence of Equilibrium & Rate Constants on Temperature & Pressure
The temperature and pressure dependency of the equilibrium (K) and rate (k)
constants is reviewed in detail by Blandamer et al. In this review it is found that
there is no universally correct method of analysing kinetic data. The conclusions
reached about the chemistry are found to depend on the model adopted and the
method of analysis used on the kinetic data. Approximately 80 % of this review is
dedicated to describing the dependence of In K and In k on temperature with the
remaining 20 % describing the pressure dependence. These percentage values
accurately reflect data published to date with research on the dependence of
temperature far exceeding that of pressure.
The pressure dependence In K or In k is not defined by thermodynamics so often
the aim is to analyse the pressure dependence to extract further information. Usual
practice is to adopt a simple description for the chemical processes where a reactant,
A, goes to products, B, as shown below.
A < K >B (5.5)
A — > 5 (5.6)
It is then possible to estimate the activation volume, AV* or AV*, because
a In K dp
- A V(5.7)
RT
The simplest equation expresses In K and In k as a linear function of pressure
In K = ax+ a2p AVK = - a 2RT (5.8)
In k = ax + a2p AVk = - a 2RT (5.9)
From this it is found that AV\s independent of pressure and aj is the value of In K or
In k when the pressure is zero. If this simplest equation is found to be inadequate for
describing the dependence of measured In K and In k values on pressure, other
methods have been reported in the literature. These include polynomial
dependences2'4 and non-linear least squares techniques,2,5 however, the models and
analysis methods become increasingly more complex.
To describe temperature dependencies it is assumed that the K and k values
have been measured for a series of temperatures, T. Once again the first task is to
formulate an equation to describe the observed dependence. One suggested approach
is to assume that In K and In k are linear functions of T so
101

CHAPTER 5. Equilibrium Reactions in Supercritical Media
In K - a xT + a2 (5.10)
In k - a xT + a2 (5.11)
and differentiation of this equation yields an expression for the enthalpy, A//* or A//*
that is dependent on temperature.
a In KdT
AH0 (5.12)RT2
Another approach treats AHK or AHk as independent of T to give an equation
that relates In K or In k to T' 1
In K = aT + a , (5.13)
Ink = axT x + a 2 (5.14)
where (12 is the value of In K or In k when T' 1 is zero. From this equation it is found
that the Gibbs free energy, AG, is a simple linear function of temperature because
AG = -R T In K (5.15)
These are the simplest models for describing the temperature dependency of
equilibrium and rate constants. When these simple models become inadequate there• 2 6 7are numerous other, more complex models that can be applied. ’ ’ It can be seen from
the models described here that it is possible to extract various thermodynamic
information depending on whether In K or In k is dependent on T or T '1.
5.1.3 Equilibrium Reactions in Supercritical Fluids
The recent growth in the use of sc fluid solvents as media for chemical
synthesis8 has inspired several research groups to examine chemical equilibria in
order to probe intermolecular interactions in sc fluids. The solvent influences reaction
thermodynamics through the environment it produces around the solutes. Among the
most important solvent properties that characterise this reaction environment are the
polarity and the polarisability. The solvent polarity corresponds to the permanent
dipole-dipole interactions, whereas polarisability is indicative of inductive forces,
where the solute molecule induces a dipole in the solvent. Thus, measuring equilibria
in sc fluids can give insight into molecular interactions.
Kimura et a l9'n addressed the problem of how fluid structure influences
chemical reactions by examining the effect of solvent density on the equilibrium
102

CHAPTER 5. Equilibrium Reactions in Supercritical Media
constant for the dimerisation of 2-methyl-2-nitrosopropane in CO2, CCIF3, CHF3, Ar,
and Xe. Their studies were typically carried out at sc temperatures and the densities
ranged from the gas to the sc phase. The experimental results showed that the
equilibrium constant in CO2, CCIF3 and CHF3 increased with density in the low-
density region (gas-phase). Further increases in density caused the equilibrium
constant to decrease into the high-density region. However, once in the high-density
region the equilibrium constant increased once more with density. The authors argued
that these observations were due to the different dominant molecular interactions of
the fluid within each of these density regions.
Chemical equilibria have also been related to hydrogen bonding in sc fluids.1 0Gupta and co-workers studied the hydrogen bonding between methanol and
triethylamine in sc SF6 where a pronounced solvent effect was observed. The
equilibrium for methanol-triethylamine association increased as the pressure
decreased towards the critical point, with the pressure effect being most dominant
around the critical point.13O’Shea et al. probed the hydrogen bonding and polar interactions in sc ethane,
fluoroform and CO2 by measuring the tautomeric equilibrium of 4-(phenylazo)-l-
napthol in these solvents as shown in Scheme 1.
OH O
p. = 1.79 D jn = 5.03 D
Scheme 1 Equilibrium between the tautomers of 4-(phenylazo)-l-naphthol
The least polar tautomer (p = 1.79 D) was dominant in ethane, nearly equal amounts
of the tautomers were seen in CO2 and in fluoroform it was found that the most polar
tautomer (p = 5.03 D) was dominant. These shifts in equilibrium composition
favouring the more polar tautomer were attributed to the large quadrupole moment of
CO2 and hydrogen bond donor ability of fluoroform. From these results it is
103
CHAPTER 5. Equilibrium Reactions in Supercritical Media
suggested that pressure can be used to control processes involving polar molecules in
some sc fluids.
Studies in the literature on aldol and esterification reactions in sc fluids are
very limited. Ikariya and co-workers have reported the catalytic asymmetric
Mukaiyama aldol reaction of a ketene silyl acetal of thioester in sc CHF3 and CO2 .14
The reaction proceeded to give the silylated aldol product in moderate yields. The
yield and enantioselectivity of the reaction were found to be influenced by the solvent
used. A maximum in enantioselectivity and yield of 8 8 % and 46 % respectively was
observed for the reaction in sc CHF3. On comparison with CO2 the reaction was
found to proceed only slightly to give an aldol product yield of 8 % and also a
reduced enantioselectivity of 72 %. The low yield in sc CO2 was reported to be due to
its low polarity that results in the low solubility of the acid catalyst in this medium.
Ellington et al, 15 and Ellington and Brennecke16 have used UV-VIS
spectroscopy to find the apparent bimolecular rate constant for the esterification of
phthalic anhydride with methanol in sc CO2 at 313 and 323 K and pressures from 97.5
to 166.5 bar. This reaction was chosen as a representative reaction between a dilute
solute (phthalic anhydride) and a typical co-solvent (methanol) in sc CO2 . At 313 K
the calculated bimolecular rate constants exhibited a 4-fold increase with a decrease in
pressure from 145.8 to 97.5 bar. Along the 323 K isotherm a 25-fold increase in the
rate constant was observed when the pressure was decreased from 166.5 to 97.5 bar.
The 25-fold decrease in the rate constant at low pressures and 323 K greatly exceeded
what the authors expected from the estimated activation volumes of the reaction.
Thus, the authors attributed the enhanced reaction rate constants at lower pressures to
the local concentration of methanol around the phthalic anhydride molecules
exceeding the average, bulk methanol concentration. By using estimated local
densities and local compositions they showed that this explanation was reasonable.
The esterification of acetic acid and ethanol in compressed CO2 has been
studied at 333 K and at pressures up to 160 bar. 17 From conversion verses time
experiments they found that the reaction had reached equilibrium in 3 hours under sc
conditions and could be reached in 6 hours under sub-critical conditions. They
calculated the apparent equilibrium constant, Kx, from the conversion of ethanol at a
reaction time of 6 hours. Results showed that Kx increased with pressure at low
pressures and reached a maximum in the critical region where the system becomes
one phase. Once past the critical point Kx was found to decrease with increasing
104

CHAPTER 5. Equilibrium Reactions in Supercritical Media
pressure. The observed increase in Kx at low pressures was explained with respect to
the degree of clustering/local density enhancement at these pressures. At high
pressures, where clustering is insignificant, Kx for the reaction was found to be close
to that of the reaction in the absence of CO2.
105

CHAPTER 5. Equilibrium Reactions in Supercritical Media
5.2 Results and Discussion
5.2.1 Esterification Reaction
For the first time an esterification reaction is reported in sc HFC 32. The
dielectrometry technique, employed in Chapter 3 to measure solid solubilities, was
used to follow the esterification reaction by measuring the change in capacitance as
the reaction proceeded. This dielectrometry technique is a quick, simple, in situ
method for measuring capacitance changes of reaction systems. Dielectrometry is not
affected by solution concentration, high pressure and turbidity restraints that are
present with spectroscopic techniques.
As with most analytical techniques there are always some limitations. Firstly,
this technique can only be used with reagents that are readily soluble because accurate
capacitance measurements can only be obtained in homogeneous solutions. It is also
necessary to have a large difference in dielectric constant between the reactants and
products so that product formation produces a change in the capacitance of the
solution. For this to occur it is also necessary for the products to remain in solution as
the reaction proceeds.
With these limitations in mind the esterification reagents employed were
benzoic acid, 1-butanol and p-toluenesulphonic (pTos) acid as the catalyst. Benzoic
acid is known to have reasonable solubility in some non-polar solvents (sc CO2) and
from the solubility measurements of some benzoic acid derivatives reported in
Chapter 3, it can be assumed that the solubility of benzoic acid will be greater than
these. A quick gravimetric solubility study carried out using sc HFC 32 at 363 K
justified this assumption. At 100 bar and below the solution saturation limit it was
found that a solubility of 0.542 mol dm'3 could be obtained. The alcohol was
observed to readily go into solution, which was expected because it is a liquid, and the
catalyst has been observed in earlier work to have a high solubility in sc HFC 32.18
The dielectrometry technique had to be assessed to see whether it could be
used to follow this esterification reaction. To do this the reaction was carried out in
dichloroethane, as this has a similar dielectric constant to sc HFC 32 at 363 K (DCE, c
= 10.37 at 278 K; HFC 32, s = 8.99 at 363 K and 200 bar). The reaction was followed
over a 2 hour time period by using dielectrometry and GC-MS. Dielectrometry
measurements were measured in situ and for the GC-MS measurements, 2 ml aliquots
of the reaction solution were taken. The actual reaction conversion was obtained from
106

CHAPTER 5. Equilibrium Reactions in Supercritical Media
the GC-MS results at specific time intervals. The conversion value from the
dielectrometry measurements was calculated from a knowledge of the final
conversion of the reaction, from GC-MS, and the capacitance value at a given time
interval. The measured (GC-MS) and calculated (dielectrometry) conversions for this
esterification reaction are shown in Figure 5.1. It can be seen from Figure 5.1 that
very close agreement between the measured and calculated ester conversion values is
observed, signifying that the dielectrometry technique is suitable for following the
process of this reaction.
The esterification reaction was then carried out in the presence of sc HFC 32
as the reaction solvent. From previous esterification studies in sc fluids it is assumed
that this esterification reaction follows the mechanism shown in Scheme 2.
HC ( w OHH
S^'cr R OH
OH2
R = CH3CH2CH2CH2
Scheme 2 The mechanism for esterification between benzoic acid and 1-butanol

Con
vers
ion
(%)
CHAPTER 5. Equilibrium Reactions in Supercritical Media
18—1i
16- MeasuredCalculated
14-
1 2 -
1 0 -
200 40 60 80 100 120
Time (minutes)
Figure 5.1 Comparison of measured and calculated conversion for the esterification
reaction
108

CHAPTER 5. Equilibrium Reactions in Supercritical Media
Using an optical cell it was visually observed that the reaction was
homogeneous under all conditions studied in this work. The dielectrometry technique
was used to follow the progress of the benzoic acid esterification reaction as a
function of time. This is shown in Figure 5.2 at some selected pressures. The
uncertainty of the conversion is found to be no greater than ± 2 %. From Figure 5.2 it
can be seen that this dielectrometry technique is useful for following equilibrium
reactions as it can be easily seen when the reaction has reached equilibrium. Figure
5.2 shows that the reaction has reached equilibrium in two hours or less under the
conditions studied. Therefore, in the rest of this work a reaction time of 2 hours was
taken to ensure that the system had reached equilibrium.
The apparent equilibrium constant, Kx, calculated using Equation (5.4) and the
equilibrium mole fractions of the reactants and products are shown as a function of
pressure in Figure 5.3 and Table 22 of the appendix. Kx increases with decreasing
pressure and a sharp increase is observed as the critical point is approached. The
increase in the Kx value with decreasing pressure signifies that Ky must be decreasing
because the equilibrium constant, K, is independent of pressure (see Equation (5.2)).
However, the lack of activity coefficient data reported in the literature makes it
impossible to justify this observation.
A 14-fold decrease in the apparent equilibrium constant is observed when the
pressure is increased from 70 to 220 bar. Ellington et al. have reported a decrease in
an esterification reaction rate constant previously. 15 They suggested that a significant
portion of the large reaction rates at low pressures is most likely to be due to local
composition enhancements of the alcohol about the acid. To verify this they
measured the local composition enhancements of the alcohol about a solvatochromic
probe. It is assumed that the same reasons apply to the high reaction rates observed in
this work, which means that Kx must increase with the increased degree of local
composition enhancement at low pressure and vice versa for Ky. The results
presented here for this reaction in HFC 32 also clarify the points made by Hou et al.
on the effect of pressure on the reaction equilibrium of an esterification reaction in sc
C 0 2. 17
109

CHAPTER 5. Equilibrium Reactions in Supercritical Media
3 5 -
3 0 -
2 5 - • •
2 0 -
co<75 15 -a3>o 10 - O
75 bar • 100 bar
145 bar
o 40 10020 60 80 120
Time (minutes)
Figure 5.2 Ester conversion with time for a variety of pressures in HFC 32 at 363 K
0.0
■ HFC 32 ★ CO„
-0.5-
- 1.0 -
-1.5-X
c- 2 .0 -
-2.5-
-3.0 -
60 80 100 120 140 160 180 200 220 240
Pressure (bar)
Figure 5.3 The change in In Kx with pressure for the benzoic acid esterification
reaction at 363 K
110

CHAPTER 5. Equilibrium Reactions in Supercritical Media
To verify that it is an enhancement in the local composition of 1-butanol about
benzoic acid that gives rise to the increase in Kx at low pressure, the measurement of
local composition of 1 -butanol about a solvatochromic probe is the topic of future
work.
This esterification reaction was also carried out in conventional liquid solvents
for comparison. Dichloroethane (DCE) was chosen as it has the closest dielectric
constant to HFC 32 at 363 K. The apparent equilibrium constant, calculated from
dielectrometry measurements, for this reaction in DCE at 363 K was calculated to be
0.201, which is similar to the Kx values in HFC 32 at moderate pressures (Kx = 0.23
at 125 bar) where local composition enhancement is less important. The reaction was
also carried out in cyclohexane (CH), which has a much lower dielectric constant than
DCE or HFC 32 (CH, s = 2.02 at 273 K). However, the Kx value was calculated to be
0.192, which is very similar to that in DCE considering the large difference in
dielectric constant and density between the two solvents.
To assess whether the solution dielectric constant has this effect in a sc fluid,
the esterification reaction was carried out in sc CO2 at 363 K (CO2, £ = 1.2 at 363 K
and 200 bar). Carbon dioxide under these conditions has a considerably lower
dielectric constant than HFC 32. Results obtained for Kx are shown on Figure 5.3,
where within experimental error, the Kx values for CO2 fall onto the same line as
those for HFC 32. This is a remarkable observation considering the vast differences
between the two solvents.
In the low dielectric media under liquid and sc conditions it is surprising that
the reaction progresses at all as the dissociation of the acid catalyst should be
negligible. This suggests that the catalyst activity is not a factor affecting the reaction
rate. It is interesting to note that the starting dielectric constant of the solution
containing reagents in CO2 is c.a. 5, which is much higher than the dielectric constant
for the pure solvent (s < 1). So even though the reagents are present in less than 1
mol % they have a marked effect on the dielectric constant of the solution. This result
suggests that to gain a better understanding of the process of a reaction it is necessary
to measure the solution dielectric constant and not assume that it is the solvent
dielectric constant that influences a reaction.
I l l

CHAPTER 5. Equilibrium Reactions in Supercritical Media
5.2.2 Aldol Condensation Reaction
The first acid catalysed aldol condensation in sc HFC 32 is reported in this
work. The aldol equilibrium is studied by applying the dielectrometry technique and
equilibrium constants are calculated as a function of pressure. In an aldol reaction it
is the a carbon of an aldehyde or ketone molecule that adds to the carbonyl carbon of
another molecule of the aldehyde or ketone. Base catalysed aldol reactions are most
common but acid catalysed reactions are known. 19,20 Under acidic conditions the
alcohol almost always undergoes acid catalysed dehydration to yield the a,p-
unsaturated ketone. Scheme 3 shows the mechanism of the acid catalysed reaction of
the ketone, cyclohexanone ( 1), which is used in this work.
OHOH
+ H
H
H+OH
(2)
(3)
+ h2o
Scheme 3 The mechanism for the acid catalysed aldol reaction of cyclohexanone
112

CHAPTER 5. Equilibrium Reactions in Supercritical Media
Cyclohexanone was chosen for environmental and handling reasons and also
because it is a liquid, which readily solves into solution allowing the reaction to be
followed by dielectrometry. Aldol condensation reactions using ketones are known to
be less feasible than those using aldehydes. However, due to handling reasons
aldehydes could not be employed in this work. The acid catalyst employed was once
again pTos as this has been found to have a high solubility in HFC 32 at 363 K.
As expected, analysis of the product showed that the dehydration product (3)
was isolated rather than the aldol dimerisation product (2). Analogous to the
esterification reaction the dielectrometry technique was assessed to see whether it was
suitable for use with the aldol condensation reaction. The change in dielectric
constant accompanying the formation of products for this reaction was found to be
sufficiently large so that dielectrometry could be used. Initial experiments involved
conversion versus time analysis and it was found that this reaction had reached
equilibrium in less than 2 hours. The mole fraction of reactants and products at 2
hours were therefore taken to be the equilibrium values in the rest of this work.
Figure 5.4 and Table 23 in the appendix show the calculated apparent
equilibrium constants for this reaction as a function of pressure. The Kx values
shown in Figure 5.4 follow the same trend observed with the esterification reaction
described earlier, where Kx increases with decreasing pressure. A sharp increase in
Kx can be seen as the pressure decreases towards the critical pressure. The arguments
applied to the esterification reaction also apply to the results observed here for the
aldol reaction, where the increased value of Kx at low pressures is thought to be due to
local composition enhancements.
The values for the apparent equilibrium constants for the aldol reaction are
lower than those observed for the esterification reaction and the rate of the aldol
reaction showed only a 4-fold increase when decreasing the pressure from 200 to 70
bar. At higher pressures it should be noted that both the esterification and aldol
reactions have similar Kx values, so the main factor in causing only a 4-fold change in
rate is due to the much lower Kx values observed for the aldol reaction at low
pressures. For the esterification reaction at 70 bar, Kx is 0.743 whereas for the aldol
reaction at 70 bar, Kx is 0.121. It is proposed that this large difference in Kx at low
pressures is due to lower local composition enhancements bought about by weaker
solute-solute interactions between reagents for the aldol reaction. For example, in the
113

In K
CHAPTER 5. Equilibrium Reactions in Supercritical Media
- 2 .0 -
- 2 .2 -
-2,4 -
- 2 .6 -
- 2 . 8 -
-3.0-
-3.2-
-3.4-
i60 80 100 120 140 160 180 200 220
Pressure (bar)
Figure 5.4 The change in In Kx with pressure for the aldol condensation reaction of
cyclohexanone in HFC 32 at 363 K
114

CHAPTER S. Equilibrium Reactions in Supercritical Media
esterification reaction it is possible for the reagents to be in close proximity due to
hydrogen bonding. This however, is not possible for the cyclohexanone in the aldol
reaction.
115

CHAPTER 5. Equilibrium Reactions in Supercritical Media
5.3 Conclusions
The first examples of an esterification and aldol condensation reaction in sc
HFC 32 are presented here. By using these reactions as examples the successful
application of the in situ dielectrometry technique to follow equilibrium reactions was
demonstrated. The advantages and disadvantages of applying this technique to follow
reactions were discussed but it could be seen that when it is possible to apply this
technique, it is a quick and simple method. From the measured capacitance values
using dielectrometry it was possible to tell when the reaction has reached equilibrium
and also the concentrations of reactants or products could be measured as a function
of time. This data then presented the opportunity to calculate equilibrium constants.
Equilibrium constants were calculated for both reactions using dielectrometry
as a function of pressure. For both reactions it was found that the apparent
equilibrium constant decreased with increasing pressure. The enhanced equilibrium
constants observed at low pressure were thought to be due to local composition
enhancements. The lower observed apparent equilibrium constants for the aldol
reaction compared to those for the esterification reaction are thought to be due to
lower local composition enhancements. This situation may arise because of the lower
polarity solute employed in the aldol reaction giving a reduced ability to form solute-
solute interactions.
116

CHAPTER 5. Equilibrium Reactions in Supercritical Media
5.4 References
(1) Abbott A, P.; Durling N, E. Phys. Chem. Chem. Phys. 2001, 3, 579.
(2) Blandamer M, J.; Burgess J.; Robertson R, E.; Scott J, M., W,. Chem. Rev.
1982, 82, 259.
(3) Ives D, J, G.; Marsden P, D. J. Chem. Soc. 1965, 649.
(4) Golinkin H, S.; Lee I.; Hyne J, B. J. Am. Chem. Soc. 1907, 89, 1307.
(5) Jones W, R.; Carey L, R.; Swaddle T, W. Can. J. Chem. 1972, 50, 2739.
(6 ) Hamed H, S.; Embree N, D. J. Am. Chem. Soc. 1934, 56.
(7) Heppolette R, L.; Robertson R, E. Can. J. Chem. 1966, 44, 677.
(8 ) Jessop P, G.; Leitner W. Chemical Synthesis using Supercritical Fluids',
Wiley-VCH: Weinheim, 1999.
(9) Kimura Y.; Yoshimura Y.; Nakahara M. J. Chem. Phys. 1989, 90, 5679.
(10) Kimura Y.; Yoshimura Y. J. Chem. Phys. 1992, 96, 3085.
(11) Kimura Y.; Yoshimura Y. J. Chem. Phys. 1992, 96, 3824.
(12) Gupta R, B.; Combes J, R.; Johnston K, P. J. Phys. Chem. 1993, 97, 707.
(13) O'Shea K.; Kirmse K, M.; Fox M, A.; Johnston K, P. J. Phys. Chem. 1991, 95,
7863.
(14) Mikami K.; Matsukawa S.; Kayaki Y.; Ikariya T. Tetrahedron Lett. 2000, 41,
1931.
(15) Ellington J, B.; Park K, M.; Brennecke J, F. Ind. Eng. Chem. Res. 1994, 33,
965.
(16) Ellington J, B.; Brennecke J, F. J. Chem. Soc., Chem. Comm. 1993, 1094.
(17) Hou Z.; Han B.; Zhang X.; Zhang H.; Z, L. J. Phys. Chem. B 2001,105, 4510.
(18) Lange S. University of Leicester unpublished results 2000.
(19) Mahrwald R.; Gundogan B. J. Am. Chem. Soc. 1998,120, 413.
(20) Simth M, B.; March J. March's Advanced Organic Chemistry, 5th ed.; Wiley
& Son: New York, 2001.
117
G
RATES OF REACTION IN SUPERCRITICAL MEDIA
6.1 Introduction
6.1.1 Reaction Kinetics
6.1.2 Friedel-Crafts Reaction
6.1.3 Determination of a Rate Law
6.2 Results and Discussion
6.2.1 Rate Law of the Friedel-Crafts Reaction
6.2.2 Effect of Temperature and Pressure on the Friedel-Crafts Reaction Rate
6.2.3 Effect of Reagents on the Friedel-Crafts Reaction Rate
6.2.4 Effect of Supercritical Solvent on the Friedel-Crafts Reaction Rate
6.3 Conclusions
6.4 References
CHAPTER 6. Rates of Reaction in Supercritical Media
6.1 Introduction
Supercritical (sc) fluids are attractive media for chemical synthesis because of
their unique properties. One of the attractive features of a sc fluid as a medium for
chemical reactions is that its properties e.g. viscosity, dielectric constant and
diffusivity vary with density, which is a strong function of temperature and pressure.
Consequently, sc fluids provide the opportunity to engineer the reaction environment
by manipulating temperature and pressure and this in turn may have an effect on
selectivity and rate of reaction.
This work reports the first Friedel-Crafts (FC) alkylation study in sc HFC 32
and compares the results to the commonly employed sc solvent CO2 . The kinetics of
the reaction is measured by application of the newly proposed dielectrometry
technique and the first rate constants of a FC reaction in a sc fluid are presented. The
effect on the reaction selectivity and rate to changes in the reagent/catalyst
concentration, time, temperature and pressure are also addressed.
6.1.1 Reaction Kinetics
It is useful to study chemical kinetics as it can give mechanistic information
for the reaction. In a sc fluid, by measurement of the kinetics, it has been found that
reaction rates, yields and selectivity can be adjusted by varying the pressure without
the need for harsh chemical changes. 1
A common observation of reactions in sc fluids is that local density and/or
local composition enhancements are found to affect the reaction thermodynamic and
kinetic properties and therefore influence reaction rates. Effects observed include
local density augmentation2'5 and preferential solvation on the addition of co
solvents.6,7 Many papers have been published in this area and there have been some
review papers on the topic. ' These local solvation effects are in addition to the
fluctuations of the properties of sc fluids normally observed near the critical point.
Reaction kinetics in sc fluids is a relatively new area and therefore the
mechanism by which a sc fluid controls a reaction is still unclear. Some studies have
been carried out but conclusions drawn by the authors are often contradictory due, in
part, to the complexity of the parameters that change with pressure in the sc state.
The majority of kinetic measurements in the literature have been achieved by
application of time-resolved spectroscopic techniques where the reaction rate can be
determined directly by monitoring the intensity of absorption in a spectral region of a
119

CHAPTER 6. Rates of Reaction in Supercritical Media
reactant or product. 11 Spectroscopic techniques used to measure both the solvation of
the reactants and the kinetics of a reaction in a sc fluid can give detail on whether and
to what extent the solvation influences reactivity.
Most research on chemical kinetics studies that employ spectroscopic
techniques, which measures the change in absorption/emission peak height of a
reactant or product as the reaction proceeds, has involved the use of non-polar sc
fluids e.g. CO2 and ethane. 12' 16 Research in the literature involving more polar sc
solvents is much more limited. Rhodes et al. used the more polar solvent fluoroform17and compared their results to those obtained in the non-polar solvent ethane. The
basis of their work was to see how solvent-solute and solute-solute interactions affect
the rate of Michael addition of piperidine to methyl propiolate in sc fluoroform and sc
ethane at 310 K and pressures between 48.3 and 213.8 bar. This reaction had been
studied previously and a mechanism was proposed in which the reaction proceedst I o #
through a highly zwitterionic intermediate. Therefore, a change in the polarity of
the medium (from non-polar to polar) and the change in polarity induced by varying
pressure in a sc fluid would dramatically stabilise this intermediate and thus increase
the rate constant for the reaction. It was observed that the kinetics in the two sc
solvents were distinctly different, which was attributed to a strong density dependent
dielectric constant in fluoroform, whereas in ethane the dielectric constant is regarded
as approximately constant over the density range studied. The observed rate constants
were related to the changes in solvent dielectric with pressure, which result from the
increased stabilisation of a highly polar zwitterionic transition state.
In sc ethane the Michael addition reaction kinetics were largely unaffected by
changes in pressure and thus density, as the polarity of ethane is only weakly affected
by density. However, it was observed that near the critical point the reaction rate
increased due to solute-solute clustering. As solvent density had little effect on the
kinetics of the reaction this observed increase could not be due to solvent-solute
clustering. The Michael addition in sc fluoroform exhibited different trends. The rate
constant is linearly related to pressure above 82 bar due to the pressure dependence of
solvent polarity and thus the stabilisation of the transition state. Rhodes and co
workers attributed the changes in rate constant near the critical point to solvent-solute
clustering, indicating that the reaction occurs in an environment different from the rest
of the bulk. Their work illustrates how the polarity of a solvent can greatly affect the
solubility and stability of a reaction species in an organic reaction. It was also shown
120

CHAPTER 6. Rates of Reaction in Supercritical Media
that altering the pressure could favour one interaction type, providing a means of
kinetic control for a reaction.
Kinetic measurements can also be made via product analysis and this has been
the method of choice of a number of investigators. A variety of organic reactions
have been analysed and the affect of local composition on the reaction kinetics is
often considered.
The Diels-Alder reaction has been the focus of a number of studies by various1 Q 9Tinvestigators in sc CO2 and sc propane. ' In 1987, Paulaitis and Alexander used
transition state theory to explain the reaction kinetics for the Diels-Alder reaction of• 9maleic anhydride with isoprene in CO2 near the CO2 critical point. Later work by
Reaves and Roberts examined the same system but in sc CO2 at 308 K and sub-90 •critical propane at 353 K. Their experiments were carried out over a range of
pressures and bimolecular rate constants were calculated. Values for the experimental
rate constants were compared to predications from the thermodynamic pressure effect
using transition state theory and the Peng-Robinson equation-of-state. The rate
constants in sc CO2 were in good agreement with predicted values over the pressure
range studied and it was also observed that the rate constants varied linearly with the
density of solution. However, in sub-critical propane, rate constants diverged from
the predictions made and the system lost its density dependence at lower pressures.
Weinstein et al. carried out the Diels-Alder reaction of cyclopentadiene and
ethyl acrylate in sc CO2 from 311 to 361 K and pressures from 80 to 2 1 0 bar.22
Results were related to a simple second-order rate law and used to construct a linear
Arrhenius plot at a constant density of 0.5 g cm’3. Over the temperature range studied
the density independent activation energy was calculated to be 40 ± 2 kJ mol'1. By
application of transition state theory the effects of temperature and density on the
reaction rate was considered. When the rate constants were normalised at various
temperatures to a fixed density, the data fell on to a single line. Results from other
researchers were also shown to fit this trend, giving rise to a possible global rate law,
where all that is required to predict the rate constant is the activation energy and a pre
exponential term with a linear dependence on the density of solution.
121

CHAPTER 6. Rates of Reaction in Supercritical Media
6.1.2 Friedel-Crafts Reaction
The FC reaction first introduced in 1877 by Charles Friedel and James
Crafts,24 reported that benzene rings could be alkylated by reaction with an alkyl
chloride in the presence of aluminium chloride as the catalyst.
Since its discovery the FC alkylation has been recognised as one of the most
important tools for introducing alkyl substituents onto the ring of aromatic
compounds. Friedel and Crafts could not have foreseen the countless applications,
theoretical discussions and reviews that have followed their pioneering work. The
original scope of their research has been extended continuously over more than 1 2 0
years to cover every conceivable variation of reagent, catalyst and affiliated reactions.
Therefore, over the years, the amount of material in both scientific and patent
literature has grown tremendously. Due to the vast amount of data available it is not
feasible to attempt to survey the entire FC reaction background. Much of the earlier9 <FC studies are reviewed in the comprehensive treatise compiled by Olah. This
monograph was published in four volumes (six parts) with about 2 0 ,0 0 0 references.
In these books Olah provides a summary of data and attempts to achieve some
evaluation of the data to formulate a general picture of a specific field from both a
theoretical and preparative chemical point of view.
From this published literature a general picture of the mechanism for FC
alkylation can be achieved. Depending on the reactants employed it is commonly
accepted that the reaction can go through either a carbocation or nucleophilic
displacement mechanism. Tertiary alkyl halides have the highest tendency to ionise.
Secondary halides are intermediate and primary halides are least prone to such
transformations. As the ability of the alkylating agent to ionise declines the
mechanism by which the reaction proceeds will tend to move away from the ionic
mechanism and change more and more to a reaction involving nucleophilic
substitution.
The widely accepted carbocation mechanism for a general FC reaction is
shown in Scheme 1. The reaction proceeds initially by addition of a catalyst that
enables the alkyl halide to ionise to a carbocation. Once this carbocation is formed an
electrophilic substitution then takes place. The reaction is completed by loss of a
proton to form the substituted aromatic compound.
122

CHAPTER 6. Rates of Reaction in Supercritical Media
RXH+
R+ + X
+ HX
Scheme 1 The carbocation mechanism for a FC alkylation reaction
When ionisation is unfavourable it then becomes possible for the reaction to
proceed through a nucleophilic displacement reaction in which no carbocation is
involved. Scheme 2 shows an example of a general FC nucleophilic displacement
reaction. The reaction takes place in a single step in which the transition state
involves a partially formed C - C bond and a partially broken C - X bond.
Scheme 2 The nucleophilic displacement mechanism for a FC alkylation reaction
There are several problems associated with reactions, including the FC
reaction, in conventional solvents both from an environmental and a practical
standpoint.
• Reactions are usually carried out batch wise
• A large excess of the substrate is needed or the reaction is carried out in an
organic solvent.
123
CHAPTER 6. Rates of Reaction in Supercritical Media
• These reactions typically use more than one stoichiometric equivalent of a
liquid acid (e.g. H2SO4) or Lewis acid (e.g. AICI3) catalyst.
• To maintain selectivity a long reaction time at low temperature is necessary.
• After the reaction the catalyst and solvent have to be separated from the
reaction mixture.
The conditions of the reaction are not ideal because under these conventional
conditions large quantities of waste are produced that cause problems associated with
separation, cost, apparatus and the environment. As a result FC reactions are far from
being atom efficient or environmentally friendly. Therefore, the development of
environmentally more benign FC processes is a high priority.
One recently explored area that may present possible solutions to some of• • ~)f\ T 1these problems is the use of sc fluids. ' Using sc fluids allows reaction conditions
to be tuned to get high product selectivity. It is hoped that relatively small amounts of
FC catalyst can be used due to higher solubilities and depressurisation of the reaction
vessel easily separates the solvent, products and acid catalyst. The majority of the sc
fluid and acid catalyst can then be recycled for further use.
These sc fluid properties and reaction conditions sound very promising at
overcoming some of the problems associated with conventional reactions but only on
a few occasions have sc fluids been utilised for such a reaction. Poliakoff et al.
introduced the sc phase to the FC alkylation reaction by using CO2 and propene as theTOsc fluid. They carried out a continuous FC reaction of mesitylene and anisole with
propene or propan-2-ol employing a heterogeneous Deloxan® catalyst in a small fixed
bed reactor. By optimising the conditions they managed to achieve 100 % selectivity
for mono-alkylated products with 50 % conversion. Their work clearly demonstrates
the feasibility of continuous and sustainable FC alkylation in sc fluids but no
comparison was made with conventional continuous alkylation in conventional
solvent using the same catalyst. A few other research groups have also looked at• 0A OQ TOapplying solid acid catalysts such as zeolites ’ and fixed bed catalysts to FC
reactions.
Research into the use of sc fluids as homogeneous reaction media for the FC
reaction is much more limited. The main reason behind this is that sc CO2 is usually
the fluid of choice and conventional FC catalysts have very low solubility in this non
polar medium. FC reactions have been reported in near critical water27,31 where it was
124

CHAPTER 6. Rates of Reaction in Supercritical Media
found that phenol and p-cresol could be alkylated with f-butyl alcohol and 2 -propanol
in the absence of added acid catalyst. Under the reaction conditions it was found that
the water acted as both the solvent and catalyst.
Chateauneuf and Nie carried out the FC alkylation of triphenylmethanol with
anisole in sc and sub-critical CO2 employing a small amount of trifluoroacetic acid
(TFA) as the catalyst. Their work in the sc state was found to be homogeneous but
the product yield was low, at approximately 3 to 4 %. They concluded that for this
particular FC reaction the TFA initiated homogeneous reaction conditions do not
appear suitable for synthesis. It is their aim to build on these initial studies and
investigate other FC alkylations and explore the kinetics of these reactions using in
situ optical spectroscopy. To my knowledge no kinetic studies on the FC reaction in
sc fluids appear in the literature.
6.1.3 Determination of a Rate Law
The rate of a chemical reaction may depend upon reactant concentrations,
temperature, and the presence of catalysts. It is often found that the rate of reaction is
proportional to the concentrations of the reactants raised to a power. For example, if
it is found that the rate is proportional to the concentration of two reactants A and B,
the rate can be expressed as
r a te = k [ A ] a [ B ^ (6 .1 )
where the concentration of A and B are raised to the a and b power respectively. The
coefficient k is the rate constant for the reaction that is independent of the
concentration of reactants but depends on temperature. The quantities a and b are
called the order of reaction with respect to that species and the sum of the orders
equals the overall reaction order. An experimentally determined equation of this kind
is called the rate law.
The rate law can be deduced directly from the rate-determining step (RDS) of
the reaction. The RDS is the slowest elementary step in a sequence of reactions. For
example if we take a two-step reaction
A + B C + D (fast)
C + E —> F + B (slow, RDS)
in which the second step is much slower than the first step it is found that the second,
slow RDS governs the rate of the overall reaction. Figure 6.1 shows pictorially the
125
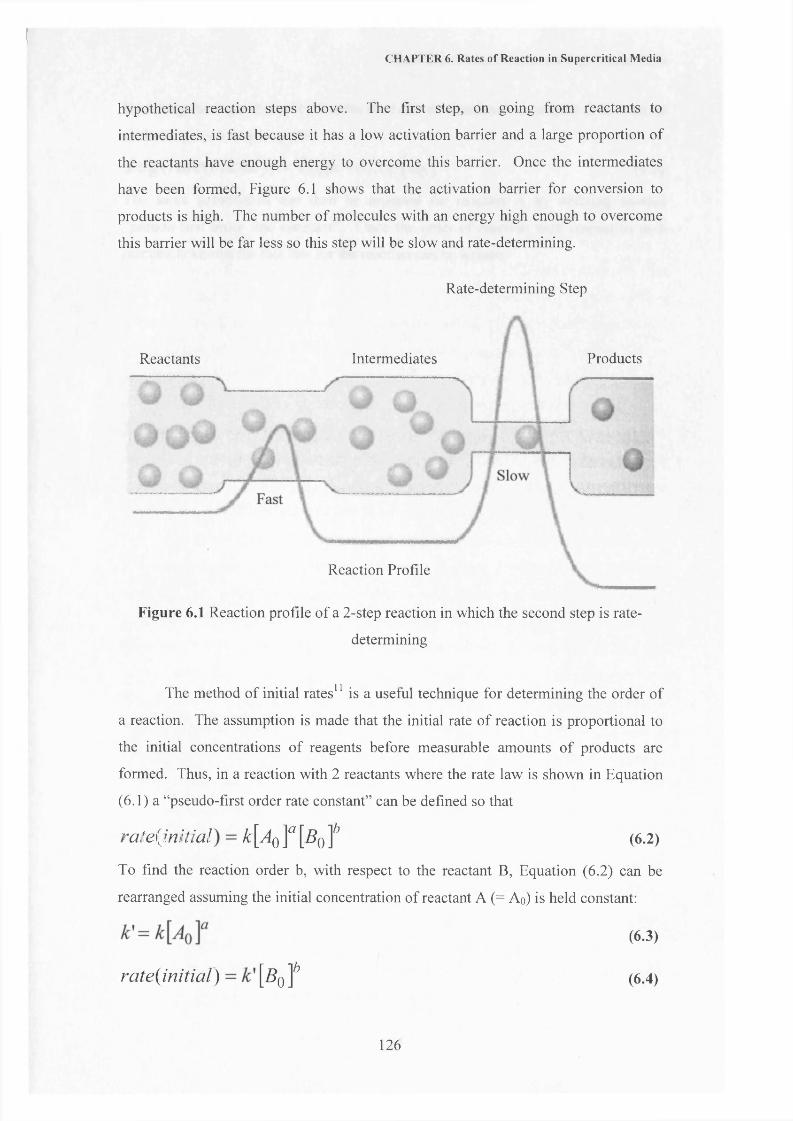
CHAPTER 6. Rates of Reaction in Supercritical Media
hypothetical reaction steps above. The first step, on going from reactants to
intermediates, is fast because it has a low activation barrier and a large proportion of
the reactants have enough energy to overcome this barrier. Once the intermediates
have been formed, Figure 6.1 shows that the activation barrier for conversion to
products is high. The number of molecules with an energy high enough to overcome
this barrier will be far less so this step will be slow and rate-determining.
Figure 6.1 Reaction profile of a 2-step reaction in which the second step is rate-
determining
a reaction. The assumption is made that the initial rate of reaction is proportional to
the initial concentrations of reagents before measurable amounts of products are
formed. Thus, in a reaction with 2 reactants where the rate law is shown in Equation
(6 .1) a “pseudo-first order rate constant” can be defined so that
To find the reaction order b, with respect to the reactant B, Equation (6.2) can be
rearranged assuming the initial concentration of reactant A (= Aq) is held constant:
Rate-determining Step
Intermediates ProductsReactants
Reaction Profile
The method of initial rates11 is a useful technique for determining the order of
rate(initial ) = k [Aq ]u [Bq ]/’ (6.2)
(6.3)
rate(initial) [fi0 f (6.4)
126
CHAPTER 6. Rates of Reaction in Supercritical Media
By taking the logarithm of both sides the order of reaction with respect to B is found
as the slope of a Log-Log plot.
Log(rate{initial)) = Logk'+bLog\B^ ] (6.5)
The same substitution can then be repeated for reactant A by defining another
“pseudo-first order rate constant”. Once the order of reaction with respect to each
reactant is known the rate law for the reaction can be written.
127

CHAPTER 6. Rates of Reaction in Supercritical Media
6.2 Results and Discussion
6.2.1 Rate Law of the Friedel-Crafts Reaction
The acid catalysed FC alkylation reaction has been extensively studied in the
liquid state.25 However, considering the fact that the FC reaction is one of the most
important tools for introducing alkyl substituents into an aromatic compound it seems1 9 8 TOstrange that studies on this reaction in the sc state are limited. ’ ’ This work looks to
widen the knowledge of the FC alkylation reaction in the sc state and presents the first
acid catalysed FC reaction in sc HFC 32. The aim of this work was not to find
optimum operating conditions for the reaction but to achieve a knowledge of the
manner in which changes in sc solvent, temperature, pressure and reagents affect the
kinetics and therefore the yield and selectivity of the reaction.
The dielectrometry technique has been shown to be applicable to follow the
progress of certain equilibrium reactions (Chapter 5). The change in dielectric
constant of general FC reagents and products (Scheme 1 and 2) is thought to be large
enough so that dielectrometry could be used to follow this reaction. Reagents for this
reaction then had to be chosen which would dissolve rapidly in the sc medium.
Traditionally, the FC reaction employs Lewis acid catalysts such as AICI3 and9 BF3 or uses highly reactive organometallic reagents. It is widely known that these
catalysts have some unfavourable properties such as limited solubility in organic
solvents, sublimation at higher temperatures and they can cause undesirable side
reactions. A number of organic sulphonic acids have also been employed as catalysts
in FC alkylations, including /?Tos acid. Recent work by Mahindaratne and
Wimalasena33 demonstrated that pTos acid is a very effective environmentally
friendly catalyst for the alkylation of aromatic rings because it can be recovered,
reused and has a low cost. They also discovered that the formation of undesired
products from side reactions was minimised. It has also been reported previously that
pTos has a high solubility in HFC 32.34 These results made pTos a very attractive
catalyst for use in this work.
Anisole and toluene were chosen as the aromatic compounds in this work
because they are both liquids and they were observed to solve into solution quickly.
There were also no environmental issues with these two reagents and it was hoped
that a direct comparison between the results of the two reagents could be made.
TerZ-buytlchloride (/-BuCI) and ter/-butylalcohol (/-BuOH) were chosen as the
alkylating agents because, firstly, they are liquids and it was observed that they solve
128

CHAPTER 6. Rates of Reaction in Supercritical Media
into solution readily and, secondly, they are tertiary compounds so rearrangement to a
more stable carbocation will not occur. It is therefore likely that a carbocation will be
formed when a tertiary alkylating agent is used and it is probable that the reaction will
follow a mechanism similar to that shown in Scheme 1.
To assess whether the dielectrometry technique is applicable to following the
progress of a FC reaction it was used to follow the alkylation of anisole (R = OCH3)
(1) with f-BuCl (X = Cl) (2) using pTos as the catalyst, as shown in Scheme 3. The
reaction was carried out over a 1 hour time period in DCE at 363 K and followed by
dielectrometry and GC-MS.
(i)
“H
(2)
H+ cat
T,P+ HX
(3) (4) (5)
where R = CH 3 or OCH 3
andX = Cl orOH
Scheme 3 The acid catalysed FC alkylation reaction of PhR with t-BuX used in this
work
As with the previously described equilibrium reactions in Chapter 5, the
dielectrometry measurements were taken in situ and for the GC-MS measurements, 2
ml aliquots of the reaction solution were taken. The actual reaction conversion was
obtained from the GC-MS results at specific time intervals. The conversion value
from the dielectrometry measurements was calculated from a knowledge of the final
conversion of the reaction, from GC-MS, and the capacitance value at a given time
interval. Three products were isolated in this reaction as shown in Scheme 3. It was
found that ortho-, para- and Jf-butylated substitution could occur on the aromatic
compound. The isolation of these products has been reported previously.35
The measured (GC-MS) and calculated (dielectrometry) conversions for this
FC reaction are shown in Figure 6.2. Very close agreement is once again observed
129
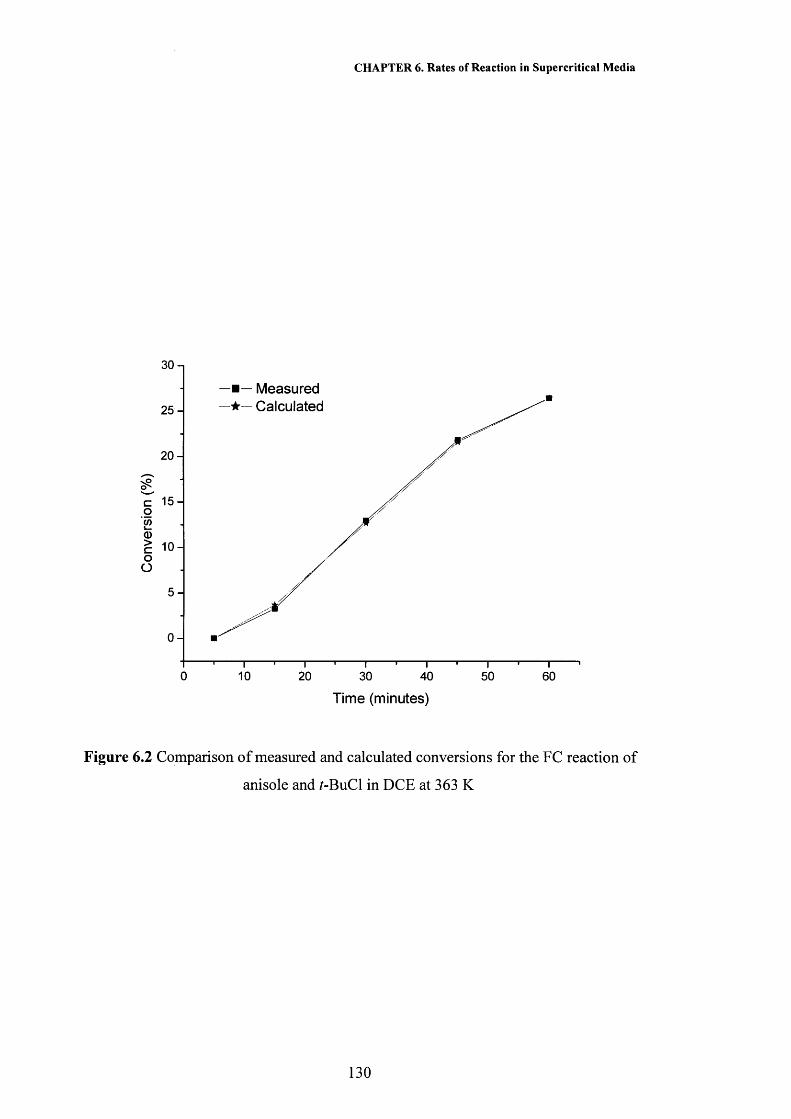
(%)
UO
jSJQA
UO
Q
CHAPTER 6. Rates of Reaction in Supercritical Media
30i— Measured — Calculated2 5 -
2 0 -
15 -
1 0 -
5 -
0 -
0 10 20 30 40 50 60
Time (minutes)
Figure 6.2 Comparison of measured and calculated conversions for the FC reaction of
anisole and f-BuCl in DCE at 363 K
130

CHAPTER 6. Rates of Reaction in Supercritical Media
between the measured and calculated conversion values, signifying that the
dielectrometry technique is applicable to following the progress of this reaction.
The FC reaction is actually an equilibrium reaction therefore equilibrium
constants can be calculated if the reaction is left long enough so an equilibrium is
reached. In Chapter 5 it has been shown that equilibrium constants could be
calculated using dielectrometry. The aim of this section however, is to study the FC
alkylation reaction under non-equilibrium conditions and from this get an appreciation
of the mechanism and rate of reaction under various conditions.
Initially the time taken for this reaction to reach equilibrium had to be
determined. To achieve this the FC reaction of anisole (0.16 M) and f-BuCl (0.16 M)
was carried out at 363 K and 235 bar in HFC 32. Taking capacitance measurements
at time intervals up to 20 hours enabled the reaction to be followed. Figure 6.3 shows
the measured changes in capacitance as the FC reaction proceeds. The increase in
capacitance is rapid at first and begins to plateau after 5 to 6 hours indicating that the
reaction is approaching equilibrium. To calculate rate constants, instead of
equilibrium constants, reactant or product concentrations need to be calculated under
non-equilibrium conditions. To fulfil this a reaction time of 1 hour was taken for the
calculation of rate constants because at this time the reaction will be far from
equilibrium under all conditions studied.
The reproducibility of this dielectrometry technique was assessed with this FC
reaction. Five separate FC reactions were carried out under the same conditions of
temperature, pressure and reagent concentrations in HFC 32. These five reactions
were left to proceed for different times lengths ranging from 30 minutes up to 20
hours. Figure 6.4 shows the change in anisole concentration (calculated from the
capacitance of the reaction medium) as a function of time. Within experimental error
all reactions are in agreement with each other over the same measured time lengths
indicating that dielectrometry is highly reproducible.
Before attempting to obtain rate constant information it is important to
elucidate the mechanism. To achieve this for the FC reaction of anisole with /-BuCl
using /?Tos in sc HFC 32 at 363 K in this work, the method of initial rates as
explained in section 6.1.3 is applied. By varying the initial concentration of a
reactant, whilst keeping the concentrations of the other reagents in excess, the initial
rate for that reactant can be calculated from dielectrometry measurements. The order
of reaction with respect to that reactant can then be calculated. This then needs to be
131

CHAPTER 6. Rates of Reaction in Supercritical Media
7 0 -
6 5 -
6 0 -
U_S 5 5 -0ocro-I—*
5 0 -oCOcl 4 5 -coO
4 0 -
3 5 -
0 400200 1000 1200600 800
Time (minutes)
Figure 6.3 Change in capacitance for the FC reaction of anisole and f-BuCl in HFC
32 at 235 bar and 363 K over 20 hours
0.16-
0.15-
0.14-
-I 0.13H
0.1208 0 .11-1 c <
— ' 0 . 1 0 -
0.09-
0.08-
*%A
30 minutes1 hour2 hours 16 hours 20 hours
200 400 600 800
Time (minutes)
1000 1200
Figure 6.4 Change in anisole concentration for the FC reaction in HFC 32 at 363 K at
250 ±10 bar as a function of time
132

CHAPTER 6. Rates of Reaction in Supercritical Media
repeated for the other reactants, so the order of reaction with respect to each reactant
can be found and then the rate law can be written. This rate law will then be a guide
to the mechanism of the reaction.
It has been reported previously that for active halides, like f-BuCl employed
here, a trace amount of catalyst will be enough to initiate the reaction. If this is
observed in this work then differing pTos concentrations will not have an effect on the
initial rate. Table 6.1 and Figure 6.5 show the affect of different initial pTos
concentrations on the initial rate of FC alkylation in HFC 32 at 363 K and 140 bar.
Entry
...T
Anisole (M)__ *-BuCl (M)
0.16
pTos (M) |_ ^ Initial Rate (Mol dm'3 s'1)
r i z f r T F 5
2 0.08 0.16 0.08 | 1.427 x 10'5
3 0.08 0.16 0.16 | 1.461 x 10'5
Table 6.1 Effect of the acid catalyst on the initial rate of the FC alkylation of anisole
with f-BuCl in HFC 32 at 363 K and 140 bar
It can be seen that the initial rate remains unchanged and the reaction order
from the slope of the Log-Log plot is zero. Entry 3 in Table 6.1 cannot be included in
the method of initial rates as the anisole concentration is not in excess of the p Tos
under investigation. However, from these results it can reasonably be assumed that as
the initial rate is unchanged the catalyst does not appear in the RDS and is not in the
rate law for this reaction.
The method of initial rates was then repeated for anisole as shown in Table 6.2
and Figure 6.5. On analysis of Figure 6.5 and Table 6.2 it is noted that the initial rate
increases as the concentration of anisole increases under the conditions studied. The
concentration of /?Tos shown in Table 6.3 as entry 2 and 3 can be seen not to be in
excess compared to the concentration of anisole. It was found previously that the acid
catalyst is not included in the rate law so it can be assumed that it does not affect the
initial rate of these reactions and therefore it does not need to be in excess. From the
Log-Log plot the order is calculated from the slope of the graph, which is found to be
1.215. Within experimental error it can be assumed that the reaction is first order with
133

Log
initi
al r
ate
CHAPTER 6. Rates of Reaction in Supercritical Media
-4.5-,
-4.6-
-4.7-
-4.8-
-4.9-
-5.0-
-5.1 -
-5.2-
-5.3-pTosAnisolef-BuCI
-5.4-
-5.5
-5.6-
-5.7-1.4 -1.3 -1.2 -1.1 -1.0 -0.9 -0.8 -0.7 -0.6 -0.5
Log [AJ
Figure 6.5 Log-Log plot to calculate the reaction order of the acid catalyst, anisole
and /-BuCl in the FC reaction
134

CHAPTER 6. Rates of Reaction in Supercritical Media
respect to anisole. This result indicates that anisole will be involved in the RDS and
will, therefore, appear in the rate law for the reaction raised to the power of 1 .
Entry Anisole (M) f-BuCl (M)i
1 0.04 0.16 i 0.08i
2_ _
lT l 6 “f ^ O 0 8
3_
0.16 "i 67o8
Initial Rate (Mol dm' s ' )
............. 2 49 ! x ] 0-6
luT T xT or
T3987Tcr
Table 6.2 Effect of anisole concentration on the initial rate of FC alkylation in HFC
32 at 363 K and 260 bar
The method of initial rates was then repeated for f-BuCl as shown in Table 6.3
and Figure 6.5. Similar analysis of Table 6.3 and Figure 6.5 for various f-BuCl
concentrations shows that doubling the f-BuCl concentration the initial rate also
doubles. The slope of the Log-Log plot was found to be 0.9784 and therefore within
experimental error it can be assumed that the reaction is first order with respect to t-
BuCl. From this result it is deduced that t-BuCl will be involved in the RDS and
therefore appears in the rate law for the reaction raised to the power of 1 .
Expt Anisole (mols) f-BuCl (mols) 1 pTos (mols)!
1 Initial Rate (Mol dm'3 s’1)
1 0.16 0.08 ! 0.08I 7T08 x 10'6
2 0.16 0.16 [ 0.08 1.398x 1 O'3
3 0.16 0.32 I 0.08 2.762 x 1 0 5t
Table 6.3 Effect of f-BuCl concentration on the initial rate of FC alkylation in HFC
32 at 363 K and 260 bar
Using the method of initial rates on each reactant in turn, the rate law for this
/>Tos catalysed FC alkylation of anisole and f-BuCl in HFC 32 at 363 K has been
determined to be
rate = k\tBuCl\ [Anisolef (6.6)

CHAPTER 6. Rates of Reaction in Supercritical Media
From the addition of the individual orders it can be seen that the rate of the overall
reaction is second order
The method of initial rates might not reveal the full rate law for a reaction
because the products formed may participate in the reaction and affect the rate. To
assess this possibility the rate law should be fitted to the data obtained for the duration
of the reaction not just at initial time lengths. Rate laws are differential equations so
by integration it is possible to find the concentrations of reactants/products as a
function of time. Anisole and f-BuCl are formed in the same stoichiometric amounts
in the chemical equation so it can be assumed that [anisole] = [f-BuCl] so the
integrated form of the second order rate law in Equation (6 .6 ) becomes
i i----------------- = k t (6.7)[A] [A]0
This equation signifies that if 1/[concentration] is plotted against time a
straight line will be observed if the reaction is second order. Figure 6 .6 shows the
change in l/[anisole] versus time for the FC reaction in HFC 32 at 363 K. A straight
line is observed in accordance to Equation (6.7) with a correlation of 0.9937. This
result verifies that this FC reaction is indeed second order. It is noted however that a
limitation of this approach is that if the data for the FC reaction are fitted to the
integrated rate law of a first order reaction a linear plot may also be observed that is a
consequence of experimental error.
6.2.2 Effect of Temperature and Pressure on the Friedel-Crafts Reaction Rate
For an organic reaction there are a number of variables that can be adjusted
e.g. reactant concentrations, solvent, catalyst, time and temperature and these will
have an effect on the rate and maybe the selectivity of the reaction. In a sc fluid, the
same organic reaction can also be affected by alteration of the pressure because above
the critical point a small change in pressure can result in a change in a number of the
solvent properties including density, viscosity, hydrogen bonding and dielectric
constant.
It is found that the majority of reaction rates depend on the temperature at
which the reaction is run. As the temperature increases the molecules carry more
kinetic energy, resulting in faster movement of molecules and more frequent
136

1/[A
niso
le]
(mol
'1 dm
3)
CHAPTER 6. Rates of Reaction in Supercritical Media
10.5
10.0
9.5
9.0
8.5
8.0
7.5
7.0
6.5
6.0
2000 2500 3000 3500 40001000500 15000
Time (seconds)
Figure 6 .6 The change in 1/anisole concentration with time for the FC reaction in
HFC 32 at 363 K
137

CHAPTER 6. Rates of Reaction in Supercritical Media
collisions. Thus, the proportion of collisions that can overcome the activation energy
for the reaction increases with temperature.
The simplest model to explain the relationship between temperature and rate
of reaction is the Arrhenius equation.-Ea
k = ZeRT (6.8)
Where, k is the rate constant for the reaction, Z is a proportionality constant that
varies from one reaction to another, Ea is the activation energy for the reaction, R is
the ideal gas constant and T is the temperature in Kelvin.
The Arrhenius equation can be used to determine the activation energy for a
reaction. By taking the natural logarithm of both sides the equation becomes
£\ n k - l n Z (6.9)
RTA plot of In k against 1/T according to Equation (6.9) should give a straight line with
a slope of -E a/R.
The Arrhenius plot in Figure 6.7 is compiled from the data in Table 24 of the
appendix for the FC reaction of anisole (0.16 M) and f-BuCl (0.16 M) at 260 ±10 bar.
Rates of reaction were measured at three different temperatures and from the linear
relationship seen in Figure 6.7 the activation energy is found to be 93.6 kJ mol'1. A
direct literature comparison for this reaction in a liquid solvent could not be found.
DeHaan et al. have reported the activation energy for the FC reaction of benzene with
f-BuCl in nitromethane. In this work they calculated the activation energy to be 76
± 13 kJ mol'1. The activation energy reported in this study is the same order of
magnitude.
To assess the effect of pressure on the FC alkylation of anisole (0.16 M) with
/-B ud (0.32 M) using pTos (0.08M) in HFC 32 at 363K a number of reactions were
conducted at differing pressures over a 1 hour time period. The total conversion of
the reaction at a variety of pressures is shown in Figure 6 .8 and Table 25 of the
appendix. At low pressures the conversion increases and as the critical pressure is
reached a maximum in conversion is observed. Further increases in pressure result in
a decrease of the observed conversion.
138

CHAPTER 6. Rates of Reaction in Supercritical Media
- 6.2
-6.4
- 6.6
- 6.8
-7.0
c-7.2
-7.4
-7.6
-7.8
- 8.00.00260 0.00265 0.00270 0.00275
1/T (fC1)
Figure 6.7 Arrhenius plot for the FC alkylation of anisole with 7-BuCl in HFC 32 at
260 ± 1 0 bar
6 0 -
50 -cow
30-
20 40 60 80 100 120 140 160 180 200 220 240 260
Pressure (bar)
Figure 6 .8 Change in conversion for the FC alkylation of anisole and 7-BuCl in HFC
32 at 363 K after 1 hour at a variety of pressures
139

CHAPTER 6. Rates of Reaction in Supercritical Media
Second order rate constants can be calculated for each pressure by measuring
the gradient of a 1/[anisole] against time plot, as shown previously in Figure 6 .6 . This
process was carried out for all pressures and the results are shown in Figure 6.9 and
Table 26 of the appendix. It is observed that the rate constant increases with pressure
and reaches a maximum at the critical point. From this point a further increase in the
pressure results in a decrease in the rate of reaction. In these reactions the number of
reactant molecules stays constant but as the pressure increases the number of solvent
molecules in the reaction system will increase. Thus, an increase in the pressure of
the reaction system results in an increase in the ratio of solvent molecules to starting
reagent molecules. Therefore it is necessary to see whether the observed change in
rate with pressure is actually a result of a pressure affect or whether it is due to a
dilution effect.
To remove the possibility of dilution affecting the rate as the pressure is
increased, FC reactions were carried out with the same mole fraction of solute and
solvent molecules at various pressures. To achieve this, different amounts of starting
reagents had to be used in each reaction for a given pressure. The reaction of anisole
and f-BuCl in HFC 32 at 363 K was once again used for this study.
The results in Table 27 of the appendix were obtained from the reactions at the
same mole fraction of solute and solvent but at different pressures. It can be seen
from Table 27 that these rates of reaction do not have such a large dependency on
pressure (c .f Table 26 of the appendix). Also shown in Table 27 is a second order
rate constant for this FC reaction in a liquid solvent. Dichloroethane was chosen as it
has a similar dielectric constant to HFC 32 at 363 K. The reaction in DCE was
carried out under reflux using the same number of moles of solvent and reagents as
the FC reaction at 180 bar and 363 K in HFC 32. The calculated second order rate
constant in the liquid solvent is an order of magnitude lower than that in the sc state.
The number of molecules used in the liquid state was the same and the dielectric
constant between the two solvents is very similar so the difference in the rate is
thought to be due to the difference in density and viscosity between the two solvents
In the sc fluid the density and the viscosity is lower which means that diffusion of the
reactant species should be greater and therefore the reaction should be faster than that
in the liquid solvent.
140
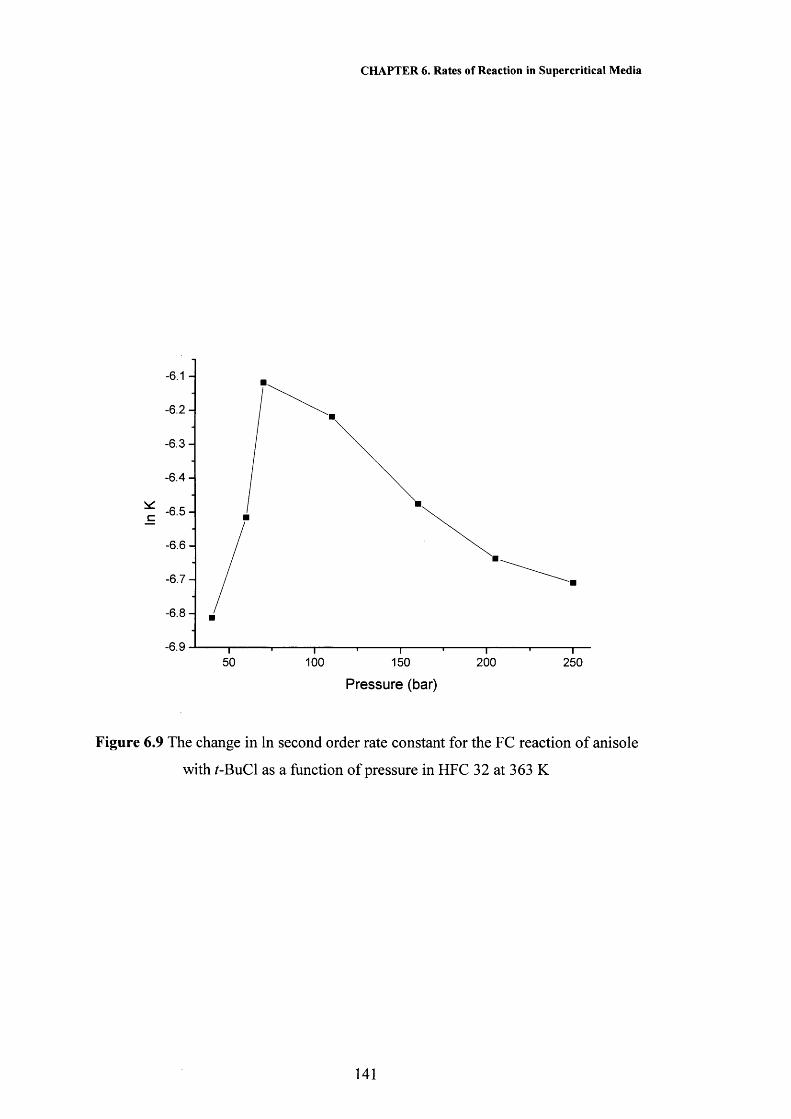
In K
CHAPTER 6. Rates of Reaction in Supercritical Media
- 6.1
- 6.2
-6.3
-6.4
-6.5
- 6.6
-6.7
- 6.8
-6.950 100 200150 250
Pressure (bar)
Figure 6.9 The change in In second order rate constant for the FC reaction of anisole
with f-BuCl as a function of pressure in HFC 32 at 363 K
141
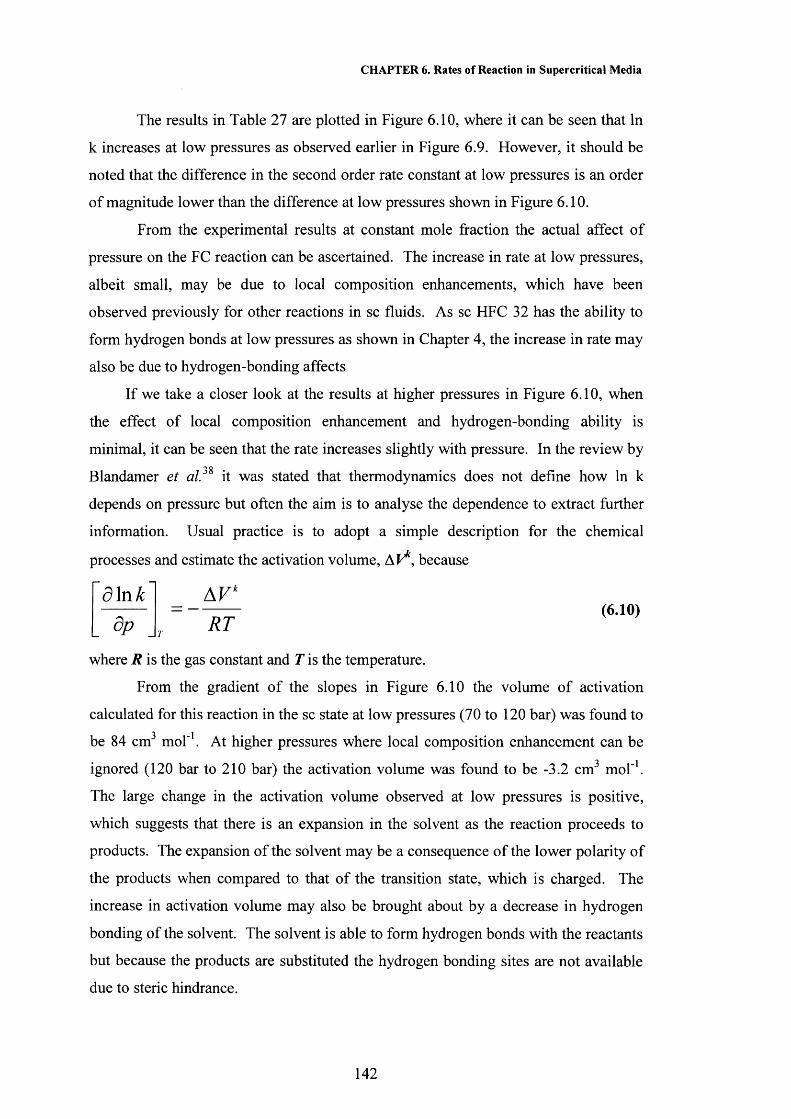
CHAPTER 6. Rates of Reaction in Supercritical Media
The results in Table 27 are plotted in Figure 6.10, where it can be seen that In
k increases at low pressures as observed earlier in Figure 6.9. However, it should be
noted that the difference in the second order rate constant at low pressures is an order
of magnitude lower than the difference at low pressures shown in Figure 6 .10.
From the experimental results at constant mole fraction the actual affect of
pressure on the FC reaction can be ascertained. The increase in rate at low pressures,
albeit small, may be due to local composition enhancements, which have been
observed previously for other reactions in sc fluids. As sc HFC 32 has the ability to
form hydrogen bonds at low pressures as shown in Chapter 4, the increase in rate may
also be due to hydrogen-bonding affects
If we take a closer look at the results at higher pressures in Figure 6.10, when
the effect of local composition enhancement and hydrogen-bonding ability is
minimal, it can be seen that the rate increases slightly with pressure. In the review byi o
Blandamer et al. it was stated that thermodynamics does not define how In k
depends on pressure but often the aim is to analyse the dependence to extract further
information. Usual practice is to adopt a simple description for the chemical
processes and estimate the activation volume, AF*, because
d i n k dp
AVk(6.10)
RTT
where R is the gas constant and T is the temperature.
From the gradient of the slopes in Figure 6.10 the volume of activation
calculated for this reaction in the sc state at low pressures (70 to 120 bar) was found to3 1be 84 cm mol' . At higher pressures where local composition enhancement can be
ignored (120 bar to 210 bar) the activation volume was found to be -3.2 cm3 mol’1.
The large change in the activation volume observed at low pressures is positive,
which suggests that there is an expansion in the solvent as the reaction proceeds to
products. The expansion of the solvent may be a consequence of the lower polarity of
the products when compared to that of the transition state, which is charged. The
increase in activation volume may also be brought about by a decrease in hydrogen
bonding of the solvent. The solvent is able to form hydrogen bonds with the reactants
but because the products are substituted the hydrogen bonding sites are not available
due to steric hindrance.
142
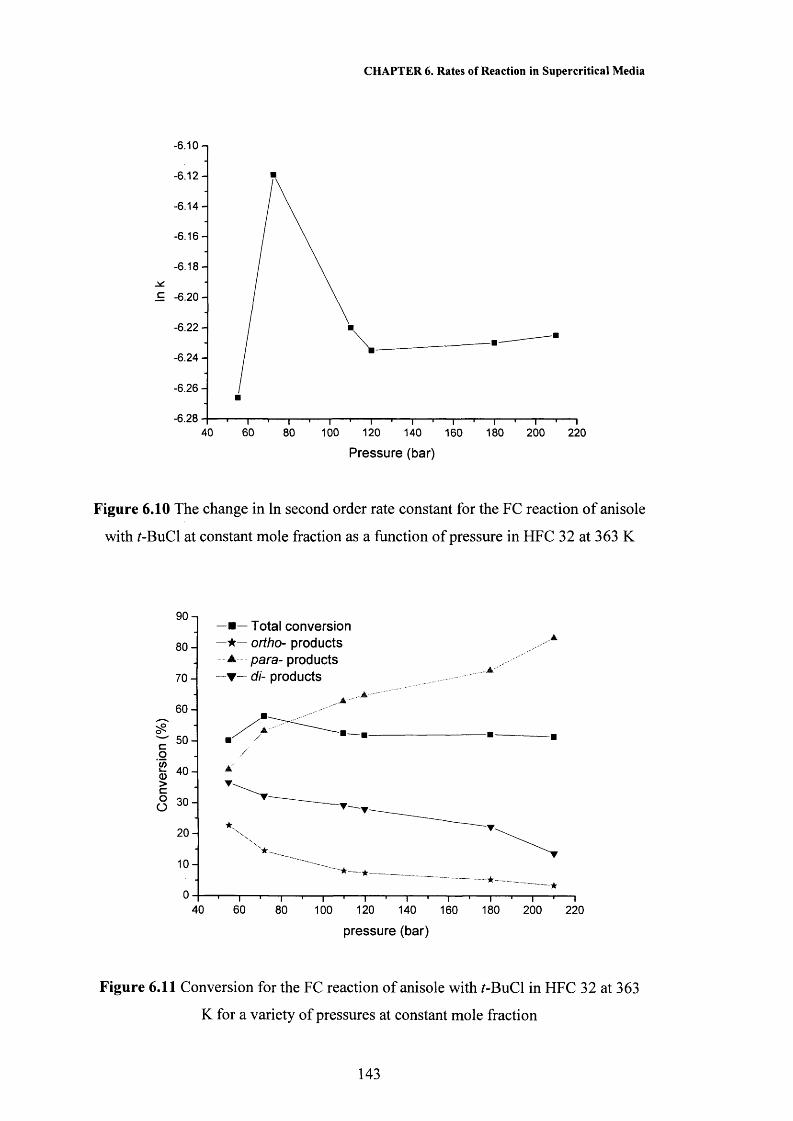
CHAPTER 6. Rates of Reaction in Supercritical Media
-6.10
- 6 . 1 2 -
-6 .14-
-6 .16-
-6.18 -
^ - 6 . 2 0 -
- 6.22 -
-6.24 -
-6.26 -
-6.2840 60 100 12080 140 180 200 220160
Pressure (bar)
Figure 6.10 The change in In second order rate constant for the FC reaction of anisole
with f-BuCl at constant mole fraction as a function of pressure in HFC 32 at 363 K
co'(/}0>coO
90 -i— ■
8 0 -
7 0 - —▼
6 0 -
5 0 -
4 0 - Jtk
3 0 -
2 0 -
1 0 -
0 -40
Total conversion
d i- products
,Jk.
I60 80 100 120 140 160
pressure (bar)
180 200 220
Figure 6.11 Conversion for the FC reaction of anisole with 7-BuCl in HFC 32 at 363
K for a variety of pressures at constant mole fraction
143
CHAPTER 6. Rates of Reaction in Supercritical Media
From this work it has been found that pressure has only a small affect on the
rate of FC alkylation so under the pressures studied the yield (total conversion) for the
reaction is approximately constant as shown in Figure 6.11 and Table 28 of the
appendix. On analysis of the products from the FC alkylation of anisole with f-BuCl
it was found that 3 products were observed, the ortho-, para- and di- butyl substituted
anisole, as shown in Scheme 3.
In Figure 6.11 the change in conversion of these three products is displayed as
a function of pressure at constant mole fraction. Compared to the total conversion for
the reaction it is seen that the product selectivity has a large dependency on the
pressure. As the pressure is increased the amount or ortho- and di- products decreases
and the amount of para- product increases. The methoxy group on anisole is ortho-
and para- directing so substitution at both these positions is to be expected. The
observation that the amounts of these products varies with pressure is an interesting
one and presents the opportunity to change the selectively of the FC reaction by
manipulation of the pressure.
The observed changes in the product ratio with pressure may be due to the
change in hydrogen bonding of the solvent as the pressure is increased. It has been
shown in Chapter 4 that the ability of HFC 32 to form hydrogen bonds decreases with
increasing pressure. The observed decrease in the ortho- and di- (both products
involve ortho- substitution) products as pressure is increased so it is possible that this
is related to the decrease in hydrogen bonding ability of the HFC 32 solvent. The FC
reaction in the commonly employed sc solvent CO2 was carried out for a comparison
because CO2 cannot form hydrogen bonds. In this reaction it was found that the
selectivity of the reaction is independent of pressure (see section 6.2.4 later) and
therefore it may be possible that the observed changes in product distribution are
somehow connected to hydrogen bonding effects. Further investigations will be
carried out in future work to assess this possibility.
To assess the true affect of pressure on a reaction it can be seen that it is
necessary to keep the mole fraction of all the reagents and the solvent constant as the
pressure is increased. In this work it has been shown that the rate of the FC reaction
can easily be calculated by application of the dielectrometry technique. Even though
the FC reaction between anisole and r-BuCl has not been optimised, good yields are
observed. The rate of this reaction is found to be only slightly dependent on pressure
144

CHAPTER 6. Rates of Reaction in Supercritical Media
but the selectivity of the reaction can be tuned by small changes in pressure due to the
hydrogen bonding ability of HFC 32.
6.2.3 Effect of Reagents on the Friedel-Crafts Reaction Rate
It has been shown that the FC alkylation of anisole using f-BuCl proceeds with
moderate yields in sc HFC 32. The selectivity was also found to be a function of
pressure due to the presence of hydrogen bonds between the anisole oxygen and the
solvent. In this work anisole is replaced by toluene in the FC alkylation reaction in
HFC 32. Toluene differs from anisole in that the functional group on the benzene ring
is missing an oxygen atom. The lack of this oxygen atom results in a lower dielectric
constant for toluene (s = 2.38 at 278 K, whereas for anisole 8 = 4.33 at 278 K) and
also toluene is unable to form hydrogen bonds. The effect that the loss of this oxygen
atom has on the rate, yield and selectivity of FC alkylation is assessed.
The conversion for the FC reaction of toluene (0.16 M) with /-BuCI (0.16 M)
at 260 bar is shown in Figure 6.12 as a function of time. The results for anisole at the
same concentrations are also shown for comparison. It can easily be seen that
conversion is greater for the FC reaction employing anisole than toluene. It is
interesting to note that on analysis of the product distribution for the toluene reactions,
only the /para-substituted product was isolated. This is surprising because it is known
that under kinetic control anisole and toluene are both ortho- and para- directing.
The reason for this observation is unknown but it may be possible that the sc solvent
is inhibiting substitution at the ortho- position. It is possible that the ortho- product is
formed in the very early stages of the reaction at time lengths shorter than those
studied here. If this is so and the amount of ortho- product is low, the rapid ortho-
para mterconversion observed with these /-butylated products may account for the
lack of ortho- product isolated at longer time lengths. Experimental work to explain
the observed product distribution for the FC reaction of toluene is the focus of future
research.
To assess the affect of pressure on the FC alkylation of toluene (0.16 M) with
/-BuCI (0.32 M) using pTos (0.08M) in HFC 32 at 363K, a number of reactions were
conducted at differing pressures over a 1 hour time period. The total conversion of
the reaction at a variety of pressures is shown in Figure 6.13 and Table 29 of the
appendix. At low pressures the conversion increases and a maximum is observed
145

CHAPTER 6. Rates of Reaction in Supercritical Media
5 0 -,
4 5 -
4 0 -
3 5 -■— Toluene
Anisolec 3 0 - o
1 5 -
1 0 -
0 5 10 15 20
Time (hours)
Figure 6.12 Change in conversion with time for the FC reaction of toluene compared
to anisole in HFC 32 at 260 bar and 363 K
22 n
2 0 -
1 8 -
1 6 -
1 4 -
(O0 1 0 ->c° 8 - O S
50 100 150 200 250 300
Pressure (bar)
Figure 6.13 Change in conversion for the FC alkylation of toluene and f-BuCl in HFC
32 at 363 K after 1 hour at a variety of pressures
146

CHAPTER 6. Rates of Reaction in Supercritical Media
at the critical pressure. Further increase in the pressure results in a decrease of the
observed conversion. Results for the reaction with anisole presented earlier follow the
same trend observed here but the observed conversions are considerably higher for the
anisole reaction.
Second order rate constants can be calculated for each different pressure by
measurement of the gradient of a 1/[toluene] against time plot, as shown previously
for anisole in Figure 6 .6 . This process was carried out for all pressures and results are
shown in Figure 6.14 and Table 30 of the appendix. It is observed that the rate
constant increases with pressure up to a maximum at the critical point. From this
point a further increase in the pressure results in a decrease in the rate of reaction. In
these reactions the number of reactant molecules stays constant but as the pressure
increases the number of solvent molecules in the reaction system will increase. An 8 -
fold decrease in the rate is observed in the sc region when the pressure in increased
from 75 to 265 bar. The resulting rate decrease observed in these studies is once
again thought to be due to a dilution effect as the increase in pressure increases the
ratio of solvent to solute molecules increases. The actual affect of pressure on the FC
reaction of toluene would need to be found from constant mole fraction studies.
These have not been carried out at this time and will be the focus of future work.
To explain the relationship between temperature and rate of reaction it is
commonly assumed that the rate constant depends on the temperature at which the
reaction is run as explained earlier. To assess the affect of temperature on the rate of
FC alkylation reactions of toluene (0.16 M) and /-BuCl (0.16 M) at 260 ± 20 bar were
carried out at 363, 373 and 383 K in HFC 32. The results are shown on the Arrhenius
plot in Figure 6.15 and in Table 31 of the appendix. From the gradient of the plot in
Figure 6.15 the activation energy is found to be 139.8 kJ mol"1. If this is compared to
the result obtained for anisole under the same conditions it is observed that the
activation energy for the toluene reaction is approximately 40 kJ mol' 1 higher. The
higher activation energy for these reactions explains the lower yields obtained for the
FC reaction involving toluene. As the activation energy is higher there are less
reaction molecules that have sufficient energy to overcome the activation barrier and
so less molecules will have the ability to react.
147

CHAPTER 6. Rates of Reaction in Supercritical Media
-7.5
- 8.0
-8.5j*:c
-9.0
-9.5
- 10.050 100 150 200 250
Pressure (bar)
Figure 6.14 The change in In second order rate constant for the FC reaction of toluene
with 7-BuCl as a function of pressure in HFC 32 at 363 K
-7.0
-7.5
- 8.0
-8.5c
-9.0
-9.5
- 10.00.00260 0.00265 0.00270 0.00275
1/T (K'1)
Figure 6.15 Arrhenius plot for the FC alkylation of toluene with 7-BuCl in HFC 32 at
260 ± 2 0 bar
148
CHAPTER 6. Rates of Reaction in Supercritical Media
By changing the aromatic reagent to toluene in the FC reaction a change in the
reaction yield, selectivity and rate is observed, which further supports the inclusion of
the aromatic species in the rate law. The anisole reaction is favoured over that of
toluene due to the greater stabilisation of the transition state. The oxygen on the
methoxy group is a good electron donor so it is able to donate electrons to the ring,
thereby stabilising the carbocation. Due to the higher activation energy for the FC
reaction of toluene lower yields were obtained and for reasons as of yet unknown, the
reaction was found to selectively produce the para-substituted product.
An experiment to assess the affect of changing f-BuCl to f-BuOH was carried
out on the FC reaction of anisole in HFC 32 at 363 K. With the change to the alcohol
a vast increase in the yield and the rate was observed. At 250 bar employing f-BuCl
gave a yield and rate of 17.19 % and 3.87 x 10'4 mol' 1 dm3 s' 1 respectively whereas
with /-BuOH the yield and rate were found to be 52.04 % and 2.07 x 10‘3 mol’1 dm3 s'
1 respectively. The increase in reaction rate supports the inclusion of the alkylating
species in the previously calculated rate law.
The increased yield and rate using f-BuOH is expected because the leaving
group formed with the alcohol, H2O, is a better leaving group than HC1, which is
formed with the f-BuCl. To justify the observed results using f-BuOH a thorough
investigation into the effect of this alkylating agent on the yield, selectivity and rate
will have to be carried out. This will be the basis of future research.
6.2.4 Effect of Supercritical Solvent on the Friedel-Crafts Reaction Rate
To assess the affect of the sc solvent on the yield, selectivity and rate of FC
alkylation, CO2 was employed and results compared to those presented earlier in HFC
32. The dielectric constant of sc CO2 is less than 2 and is not greatly affected by
changes in pressure, whereas with HFC 32, the dielectric constant is higher and
strongly dependant on pressure changes.39 The differences in the dielectric constants
of these two sc solvents at 363 K and a variety of pressures are shown in Figure 6.16.
Measurements on the unoptimised FC alkylations of anisole and /-BuCl using pTos
catalyst were carried out at 363 K in CO2 at various pressures to assess the effect of
the sc solvent on this reaction.
Figure 6.17 and Table 32 of the appendix present the conversion for the
reaction of anisole (0.16 M) and t-BuCl (0.4 M) after 1 hour in sc C 0 2 at 363 K as a
149

CHAPTER 6. Rates of Reaction in Supercritical Media
7 -cro -*—* to c o O o - ■ - C 0 2 at 363 K
★ HFC 32 at 363 KE 5"o0)0) 4 _ Q
80 100 120 140 160 180 200 220 24060
Pressure (bar)
Figure 6.16 Change in dielectric constant for the sc fluids used in this work at 363 K
and a function of pressure
- 6.2
5 0 -Conversion
--6.4
4 5 -
- - 6.6
.1 4 0 -- - 6.80
>co° 35 - - -7.0
XV--7.23 0 -
100 120 140 180160 200 220
Pressure (bar)
Figure 6.17 Change in conversion and In k with pressure for the FC reaction in CO2
at 363 K
150

CHAPTER 6. Rates of Reaction in Supercritical Media
function of pressure. It can be seen from Figure 6.17 that the yield of the reaction
decreases as the pressure increases. A reaction was also carried out at 50 bar and at a
lower f-BuCl concentration (0.16 M) but no product was isolated in either case. It is
assumed that the reaction in sc CO2 will follow the same mechanism proposed earlier
so second order rate constants were calculated and are also shown in Figure 6.17 and
Table 32 of the appendix. It can be seen that the rate decreases as the pressure
increases, which is consistent with the dilution effect proposed earlier for the work in
HFC 32.
To eliminate the effect of dilution on the reaction the mole fraction of the
reaction should be kept constant. Therefore, the amount of solute put into the reaction
system was adjusted in accordance with the increased number of moles of solvent at
higher pressures, thus keeping a constant mole fraction. Constant mole fraction
experiments were carried in sc CO2 at various pressures. The second order rate
constants and reaction yields are shown in Table 33 and 34 of the appendix
respectively. Figure 6.18 shows the total reaction conversion and individual product
yields for these constant mole fraction experiments.
The total conversion of the reaction was found to be around 29 %. The
conversion and the rate constant were found to be independent of pressure. On
analysis of the product yield for each reaction it was found that all three products
shown in Scheme 3 were isolated. The yield of each product is also shown in Figure
6.19 where it can be seen that the para- product is most abundant followed by the di-
and ortho- substituted products.
The yield of each product was found to be independent of pressure. In the
reactions employing HFC 32 as the solvent the product distributions were found to
vary with pressure and it was postulated that the hydrogen-bonding character of HFC
32 resulted in this pressure dependence. In CO2 it is not possible for hydrogen
bonding to occur which may account for the constant product distribution with
changing pressure.
Another interesting point to note is the moderately high yields obtained for the
FC reaction in sc CO2. It must be noted here that the amount of /‘-BuCl used in these
reactions is higher than that employed in HFC 32 because the reaction did not proceed
at lower /-BuCl concentrations. However, even with this in mind the yields
151

Con
vers
ion
(%)
CHAPTER 6. Rates of Reaction in Supercritical Media
8 0 1
7 0 -
6 0 -
5 0 -
4 0 -
3 0 -
2 0 -
1 0 -
"A:..................A
-A................
— Total conversion• Ortho- product a Para- product★ Di- product
— i--------------1--------------1--------------'-------------- 1-------------- •--------------1----------------■------------ 1—120 140 160 180 200
Pressure (bar)
Figure 6.18 Conversion for the FC reaction of anisole with f-BuCl in CO2 at 363 K
for a variety of pressures at constant mole fraction
152

CHAPTER 6. Rates of Reaction in Supercritical Media
are much higher than expected for this FC reaction involving moderate polarity
solutes in a non-polar fluid. The solubility of the solutes used in these FC studies
would be lower than in HFC 32 and most importantly the dissociation of the acid
catalyst should be negligible in low dielectric media.
The reason behind these unexpectedly high yields is thought to be due to the
solutes in the FC reaction acting as polar modifiers and therefore causing an increase
in dielectric constant of the reaction medium. Figure 6.19 shows the dielectric
constant of three different solutions at 363 K; pure CO2, pTos and anisole in CO2 and
all of the reagents mixed together in CO2 at the start of the reaction. It is clear that
although each reagent is present in « 1 mol % they have a marked effect on the
dielectric constant of the solution. It can therefore be assumed that the dissociation of
the acid catalyst occurs because it is principally solvated by the reagents. To clarify
this point the same reaction was repeated using a lower concentration of f-BuCl (0.16
M) (solution dielectric constant = 3.3). At 363 K and 230 bar the dielectric constant
of the solution did not change and no conversion was observed, which suggests that
the medium is too non-polar to allow any significant acid dissociation. Nor did the
reaction proceed at 50 bar, where the solution is in the near critical state and the
dielectric constant (s = 3) is too low to allow significant acid dissociation.
If these values are compared to those in HFC 32 (solution dielectric constant =
8.5 at 150 bar with all the reagents present), the dielectric constants of the two
reaction media are not dissimilar as first thought on the basis of the pure solvent
dielectric constant values.
It has been shown in this study that the sc solvent is found to have an effect on
the yield, selectivity and rate of FC alkylation. This work has demonstrated that it is
in fact the dielectric constant of the solution rather than that of the solvent that affects
the yield and rate of reaction. At low solution dielectric constants where acid
dissociation is minimal the reaction did not proceed. It has been shown that sc CO2
can support the FC alkylation of anisole resulting in moderate yields. The main
drawback with CO2 compared to HFC 32 is the inability to control the selectivity of
the reaction. With CO2 it is not possible to form hydrogen bonds at any pressures so
the selectivity was found to be independent of pressure.
153

Diele
ctric
Con
stan
t
CHAPTER 6. Rates of Reaction in Supercritical Media
5 -I pure Q o
4 -
2• pTos + Anisole a All reagents
• -
^ • —
2 -
— 1---------------------------1 1 1 1 1------------------------ 1—50 100 150 200
Pressure (bar)
Figure 6.19 The change in solution dielectric constant with pressure in CO2 at 363 K
154
CHAPTER 6. Rates of Reaction in Supercritical Media
6.3 Conclusions
It has been shown that the dielectrometry technique is applicable to following
the progress of the FC reaction in sc HFC 32 and sc CO2. By following the progress
of this reaction it was possible to relate the measured capacitance of the solution to the
concentration changes of the reactants and products. A rate law for the reaction was
proposed, which was found to depend on the concentrations of the aromatic and
alkylating species, giving rise to second order reaction kinetics.
It was demonstrated that second order rate constants could be calculated for
this reaction and changes in the observed rates with temperature, pressure, reagents
and solvent were addressed. If the molar amount of reagents is kept constant as the
pressure is increased the ratio of solvent to solute molecules increases resulting in a
dilution of the reaction system. The affect of this dilution was observed in the results
obtained at various pressures so no meaningful data could be obtained.
The dielectric constant of the reaction solution was discovered to have a high
dependency on the reagents present, even when they are present in very small
amounts. In the case of CO2, which has a low dielectric constant, the solutes seemed
to behave as polar modifiers causing an increase in the dielectric constant of the
whole reaction solution. The yields obtained in CO2 were also much higher than
expected from dielectric constant considerations of the pure solvent. The result
emphasises the fact that it is the solution dielectric constant not the solvent dielectric
constant that has a controlling influence on the reaction.
155

CHAPTER 6. Rates of Reaction in Supercritical Media
6.4 References
(1) Jessop P, G.; Leitner W. Chemical Synthesis using Supercritical Fluids;
Wiley-VCH: Weinheim, 1999.
(2) Brenneke J, F.; Tomasko D, L.; Pehkin J.; Eckert C, A. Ind. Eng. Chem. Res.
1990, 29, 1682.
(3) Heitz M, P.; Bright F, V. J. Phys. Chem. 1996,100, 6889.
(4) Kim S.; Johnston K, P. Ind. Eng. Chem. Res. 1987, 26, 1206.
(5) Zhang J.; Lee L, L.; Brennecke J, F. J. Phys. Chem. 1995, 99, 9269.
(6 ) Zhang J.; Roek D, P. J. Phys. Chem. 1995, 49, 8793.
(7) Worrall D, R.; Wilkinson F. J. Chem. Soc., Faraday Trans. 1996, 92, 1467.
(8 ) Kajimoto O. Chem. Rev. 1999, 99, 355.
(9) Tucker S, C.; Maddox M, W. J. Phys. Chem. B 1998,102, 2437.
(10) Tucker S, C. Chem. Rev. 1999, 99, 391.
(11) Atkins P, W. Physical Chemistry, 5 ed.; Oxford University Press: Oxford,
1994.
(12) Roek D, P.; Kremer M, J.; Roberts C, B.; Chateauneuf J, E.; Brennecke J, F.
Fluid Phase Equilib. 1999,158-160, 713.
(13) Dillow A, K.; Brown J, S.; Liotta C, L.; Eckert C, A. J. Phys. Chem. A 1998,
102, 7609.
(14) Lineham J, C.; Yonker C, R.; Bays J, T.; Autrey S, T. J. Am. Chem. Soc 1998,
120, 5826.
(15) Guan Z.; Combers J, R.; Menceloglu Y, Z.; deSimone J, M. Macromolecules
1993, 26, 2663.
(16) Worrall D, R.; Abdel-Shafi A, A.; Wilkinson F. J. Phys. Chem. A 2001, 105,
1270.
(17) Rhodes T, A.; O'Shea K.; Bennett G.; Johnston K, P.; Fox M, A. J. Phys.
Chem. 1995, 99, 9903.
(18) Giese B.; Huise R. Tetrahedron Lett. 1967,18, 89.
(19) Thompson R, L.; Glaser R.; Bush D.; Liotta C, L.; Eckert C, A. Ind. Eng.
Chem. Res. 1999, 38, 4220.
(20) Reaves J, T.; Roberts C, B. J. Chem. Soc., Chem. Eng. Comm. 1999, 171, 117.
(21) Knutson B, L.; Dillow A, K.; Liotta C, L.; Eckert C, A. Innovations in
Supercritical Fluids 1995, 608, 166.
156
CHAPTER 6. Rates of Reaction in Supercritical Media
(22) Weinstein R, D.; Renslo A, R.; Vanheiser R, L.; Harns J, G.; Terter J, W. J.
Phys. Chem. 1996,100, 12337.
(23) Paulaitis M, E.; Alexander G, C. Pure Appl. Chem. 1987, 59, 61.
(24) Friedel C.; Crafts J, M. Compt. Rend. 1877, 84, 1450.
(25) Olah G. Friedel-Crafts and Related Reactions', Wiley Interscience: New York
and London, 1963-1964; Vol. I-IV.
(26) Baiker A. Chem. Rev. 1999, 99, 453.
(27) Chandler K.; Deng F.; Dillow A, K.; Liotta C, L.; Eckert C, A. Ind. Eng.
Chem. Rev. 1997, id , 5175.
(28) Chateauneuf J.; Nie K. Adv. Environ. Res. 2000, 4, 307.
(29) Fan L.; Nakamura I.; Ishida S.; Fujimoto K. Ind. Eng. Chem. Res. 1997, 36,
1458.
(30) Hitzler M, G.; Smail F, R.; Ross S, K.; Poliakoff M. J. Chem. Soc., Chem.
Comm. 1998,133, 359.
(31) Savage P, E. Chem. Rev. 1999, 99, 603.
(32) Clark M, C.; Subramaniam B. Ind. Eng. Chem. Res. 1998, 37, 1243.
(33) Mahindaratne M, P, D.; Wimalasena K. J. Org. Chem. 1998, 63, 2858.
(34) Lange S. University of Leicester unpublished results 2000.
(35) Olah G, A.; Olah J, A.; Ohyama T. J. Am. Chem. Soc. 1984,106, 5284.
(36) Simth M, B.; March J March's Advanced Organic Chemistry, 5th ed.; Wiley &
Son: New York, 2001.
(37) DeHaan F, P.; Delker G, L.; Covey W, D.; Ahn J.; Cowan R, L.; Fong C, H.;
Kim G, Y.; Kumar A.; Roberts M, P.; Schubert D, M.; Stoler E, M.; Suh Y, J.;
Tang M. J. Org. Chem. 1986, 51, 1587.
(38) Blandamer M, J.; Burgess J.; Robertson R, E.; Scott J, M., W,. Chem. Rev.
1982, 82, 259.
(39) Abbott A, P.; Eardley C, A.; Tooth R, J. J. Chem. Eng. Data 1999, 44, 112.
157

SUMMARY AND FUTURE WORK
7.1 Summary
7.1.1 Solubility
7.1.2 Solvent Properties
7.1.3 Reactions
7.2 Future Work
7.2.1 Solubility Measurements in Hydrofluorocarbons
7.2.2 Local Composition Enhancement
7.2.3 Reactions in Hydrofluorocarbons

Chapter 7. Summary and Future Work
7.1 Summary
This study has shown that difluoromethane (HFC 32) and 1,1,1,2-
tetrafluoroethane (HFC 134a) are polar fluids with solvent properties that change
markedly with temperature and pressure. HFC 32 is known to have accessible critical
constants, relatively high dielectric constants and low viscosity; these properties alone
make HFC 32 ideal for use in supercritical (sc) fluid applications. It has been shown
in this work that sc HFC 32 also displays high solubilities, relatively high
polarisability/dipolarity and hydrogen bonding properties making this solvent even
more attractive for use in sc fluid applications. The first examples of reactions in
HFC 32 were carried out in this work to justify these findings.
7.1.1 Solubility
The first solubility measurements of a number of /?-benzoic acids and p-
phenols in HFC 32 at 363 K over a range of pressures have been reported. The
identity of the functional group at the para position of the benzoic acid and phenol
backbones was found to have a large affect on the measured solubilities. The Peng-
Robinson equation-of-state (PR EOS) was used to model the solubility data for the
solutes where vapour pressure data was available. A good fit was obtained for all
solutes over the temperature and pressure range studied showing that the PR EOS can
be used to predict solubilities in HFC 32.
It has been shown in this work that the dielectrometry technique is especially
suitable for measuring solubilities in sc HFC 32. It is shown to be a quick, simple
and precise in situ technique that can be applied to measure the solubility of polar ad
non-polar liquid and solid solutes.
7.1.2 Solvent Properties
This work has shown that HFCs 32 and 134a have relatively high
polarisability/dipolarity and they also exhibit significant hydrogen bond donor
characteristics, particularly in the sc state. The hydrogen bond donor properties of the
two solvents decrease with increasing pressure and this trend is suggested to be due to
a decrease in solvent-solvent interactions and an increase in the preferential solvation
around the polar moieties as the local solvent density decreases.
The Log solubility of aromatic solutes in HFC 32 was modelled using the
solvent properties obtained in this study and published solute descriptor data. The
159
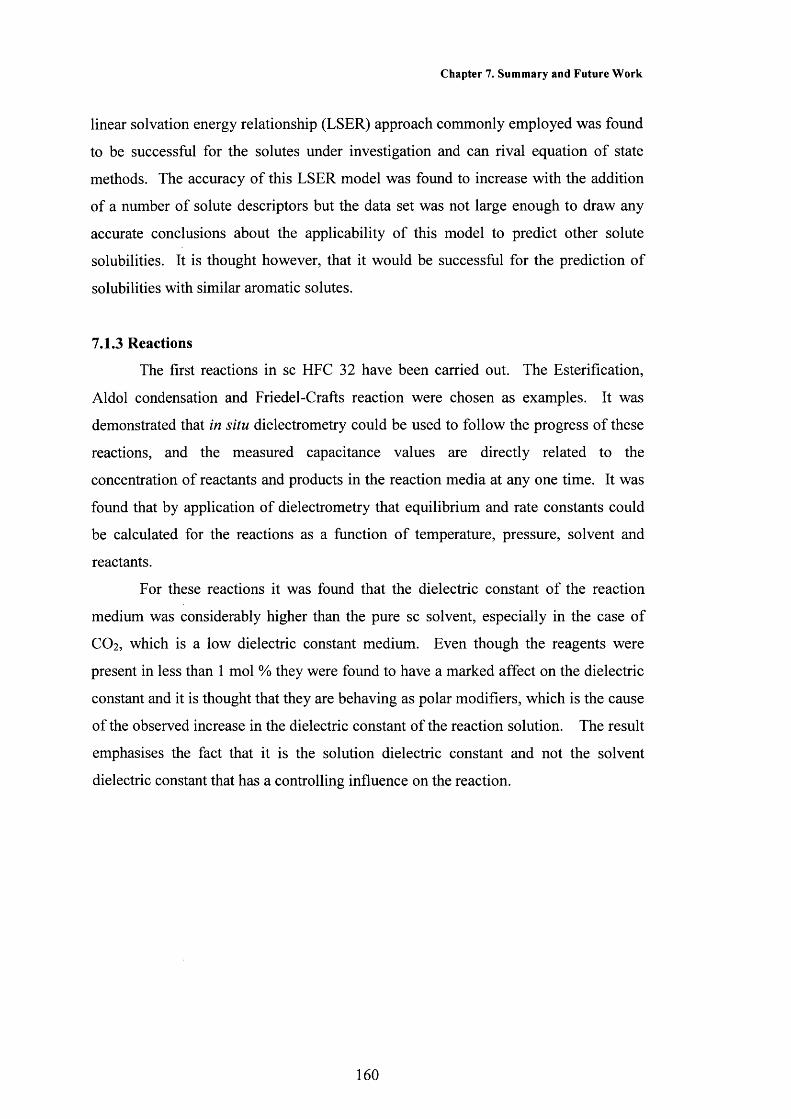
Chapter 7. Summary and Future Work
linear solvation energy relationship (LSER) approach commonly employed was found
to be successful for the solutes under investigation and can rival equation of state
methods. The accuracy of this LSER model was found to increase with the addition
of a number of solute descriptors but the data set was not large enough to draw any
accurate conclusions about the applicability of this model to predict other solute
solubilities. It is thought however, that it would be successful for the prediction of
solubilities with similar aromatic solutes.
7.1.3 Reactions
The first reactions in sc HFC 32 have been carried out. The Esterification,
Aldol condensation and Friedel-Crafts reaction were chosen as examples. It was
demonstrated that in situ dielectrometry could be used to follow the progress of these
reactions, and the measured capacitance values are directly related to the
concentration of reactants and products in the reaction media at any one time. It was
found that by application of dielectrometry that equilibrium and rate constants could
be calculated for the reactions as a function of temperature, pressure, solvent and
reactants.
For these reactions it was found that the dielectric constant of the reaction
medium was considerably higher than the pure sc solvent, especially in the case of
CO2, which is a low dielectric constant medium. Even though the reagents were
present in less than 1 mol % they were found to have a marked affect on the dielectric
constant and it is thought that they are behaving as polar modifiers, which is the cause
of the observed increase in the dielectric constant of the reaction solution. The result
emphasises the fact that it is the solution dielectric constant and not the solvent
dielectric constant that has a controlling influence on the reaction.
160

Chapter 7. Summary and Future Work
7.2 Future Work
7.2.1 Solubility Measurements in Hydrofluorocarbons
A knowledge of the ability for a sc fluid to act as a solvent for a particular
solute is essential in process design. The hydrofuorocarbons used in this work have
shown many characteristics that make these solvents attractive for sc fluid
applications but in the literature there is a large void in the solubility data needed for
these solvents. This data must be extended to cover a wider range of solutes,
temperatures and pressures. It is then possible that these solvents will be seen as
possible alternatives to CO2.
7.2.2 Local Composition Enhancement
The reactions rates reported in this work are found to increase dramatically
around the critical pressure. The idea of local composition enhancements is proposed
to account for the observed increase in rate. The concept of local composition
enhancement is that the concentration of a reactant or a product around other reactants
or products is higher than that of the bulk. A solvatochromic probe can be used as a
representative polar solute and then by addition of a reagent used in the reactions it is
possible to measure the local composition of this reagent about the solvatochromic
probe from measurement of the wavelength of maximum absorption. The affect of
temperature and pressure on local composition enhancement can also be found.
7.2.3 Reactions in Hydrofluorocarbons
The use of these hydrofluorocarbons to support chemical synthesis needs to be
extended to cover a wide range or reactions. In this work only a few reactions are
briefly mentioned and a whole new hydrofluorocarbon application has been shown to
be feasible. The affect of heterogeneous catalysts compared to homogeneous
catalysts and concentrated solutions compared to dilute solutions needs to be
addressed. In concentrated solution it may be possible to form emulsions and then by
application of light scattering techniques it may be possible to gain knowledge of the
size and stability of the colloids formed.
To conduct a simple reaction in a sc fluid there are a number of variables that
can be altered and each of these will have an effect on the reaction yield, rate and
selectivity. To address the possibility of chemical reactions in sc fluids being
161

Chapter 7. Summary and Future Work
commercially viable, and to take full advantage of the tunability of reactions in sc
fluids, the reactions must be optimised.
162

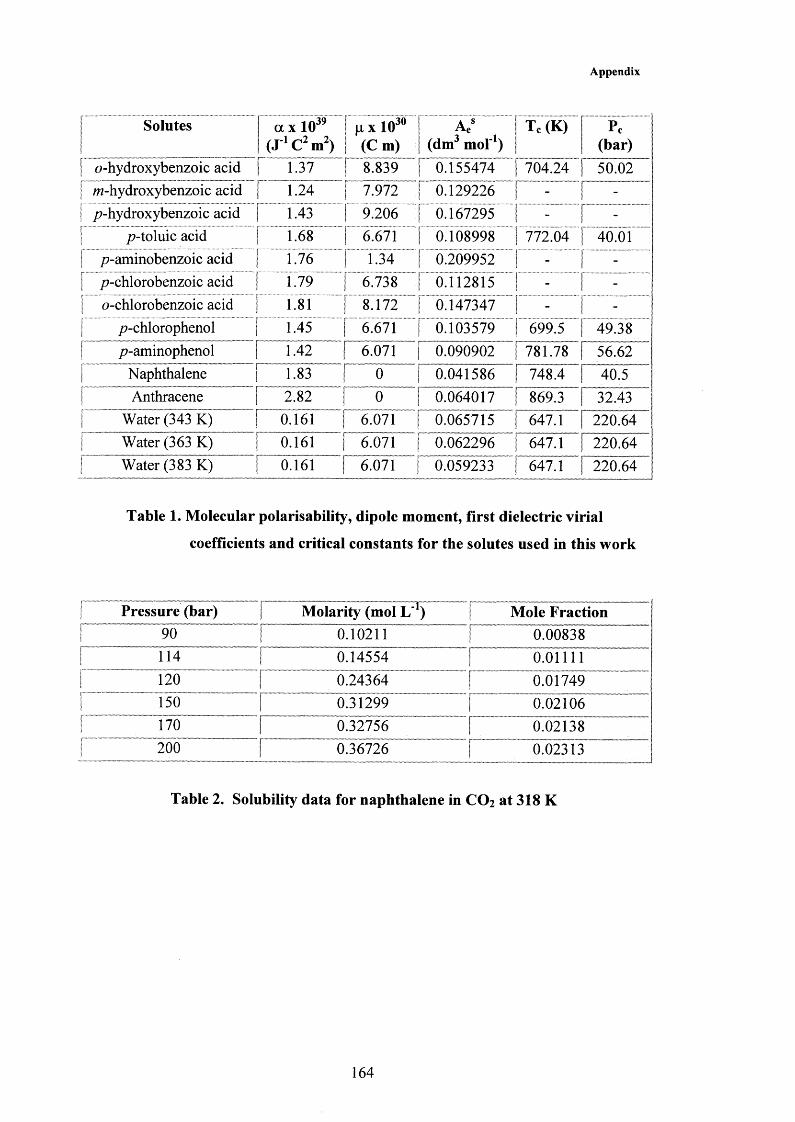
Appendix
| Solutes | a x 1039 (J 1 C2m2)
p x 1030 (C m)
AeS (dm3 m ol1)
| Tc(K) Pc(bar)
f o-hydroxybenzoic acid f 1.37 8.839 0.155474 1 704.24 50.02| m-hydroxybenzoic acid f 1.24 7.972 0.129226 r~~
-
j />-hydroxybenzoic acid | 1.43 9.206 0.167295 I - -i /?-toluic acid | 1 . 6 8 6.671 0.108998 | 772.04 40.01[ p-aminobenzoic acid | 1.76 1.34 0.209952 -| /7-chlorobenzoic acid [ 1.79 6.738 0.112815 I - -| 0 -chiorobenzoic acid [ 1.81 8.172 0.147347 1 - -[ /7-chlorophenol [ 1.45 6.671 0.103579 i 699.5 49.38j p-aminophenol [ 1.42 I 6.071 0.090902 f 781.78 56.62| Naphthalene ] 1.83 0 0.041586 r 7 4 8 T “ 40.5| Anthracene f 2.82 0.064017 32.43_____
0.161 1 6.071 0.065715 j 647.1 220.64F Water (363 K) f 0.161 \ 6.071 0.062296 r647T™ ” 220.64r.. watCTpsTKT- - r 0.161 \ 6.071 0.059233 ”™2 2 0 ^ “
Table 1. Molecular polarisability, dipole moment, first dielectric virial
coefficients and critical constants for the solutes used in this work
| Pressure (bar) | Molarity (mol L'r) 1 Mole Fraction
0 I 0 . 1 0 2 1 1r— "— 1 0.00838
1 114 1 0.14554 11 0 . 0 1 1 1 1
| 1 2 0 | 0.24364 \j |
0.31299 I1 0.02106[ 170 r 0.32756 [ 0.02138| 2 0 0 f 0.36726 r 0.02313
Table 2. Solubility data for naphthalene in CO2 at 318 K
164

Appendix
Pressure (bar)80
Too
Molarity (mol L' )0.00756 000883"
Mole Fraction^0007
120__ 0.011200.01362M1749"
0.0010OjOOlY00015"
180200210
0.020830023400.02474
0.0018
0.0021
Table 3. Solubility data for water in HFC 134a at 343 K
Pressure (bar) Molarity (mol L'1) [ Mole Fraction1 1 0 0.02080 | 0 . 0 0 2 0
140 0.03062 0.0029160 0.04185 | 0.0039187
______0.0044
2 1 0 0.05731 | 0.0052.................. 2 2 1 1 0.06725 f 0.0061
Table 4. Solubility data for water in HFC 134a at 363 K
Pressure (bar) Molarity (mol L'1) [ Mole Fraction_ [ 0 03771 | M 043
110.................... 0.05517...................... [.................0.0060...... 125.................... 0.06920...................... [.................0.0073...... 149.................... 009710.......................j.................0.0100...... 180.................... 0.11502...................... j.................0.0115...... 199.................... 0.12519...................... [.................0.0123......
Table 5. Solubility data for water in HFC 134a at 383 K
165
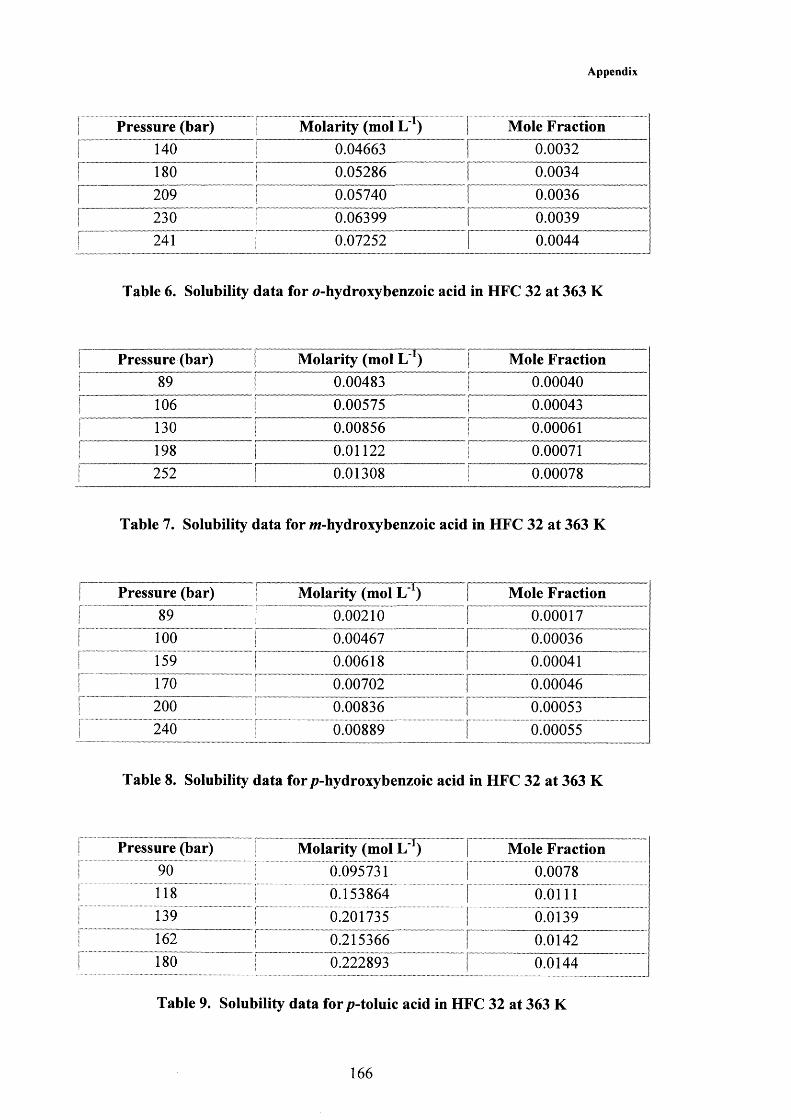
Appendix
[ Pressure (bar) Molarity (mol L' ) Mole Fraction140 0.04663 0.0032
ooo 0.05286 0.0034j 209 0.05740| 230f
0.063990.07252
0.00390.0044
Table 6. Solubility data for o-hydroxybenzoic acid in HFC 32 at 363 K
j Pressure (bar) Molarity (mol L"1) Mole Fraction| 89 0.00483 0.00040| 106 0.00575 0.00043| 130 0.00856 0.00061| 198 0 . 0 1 1 2 2 0.00071{ 252 0.01308 0.00078
Table 7. Solubility data for m-hydroxybenzoic acid in HFC 32 at 363 K
{ Pressure (bar) Molarity (mol L'1) | Mole Fractioni|
OO |jI 0 . 0 0 2 1 0 r 0.00017
| 1 0 0 0.00467 | 0.00036| 159 0.00618 | 0.00041| 170 0.00702 | 0.00046| 2 0 0 0.00836 [ 0.00053| 240 0.00889 [ 0.00055
Table 8. Solubility data for /7-hydroxybenzoic acid in HFC 32 at 363 K
| Pressure (bar) Molarity (mol L'1) | Mole Fraction| 90 0.095731 | 0.0078S 118 0.153864 | 0 . 0 1 1 1
| 139 0.201735 | 0.0139| 162 0.215366 | 0.0142| 180 0.222893 f
_ _
Table 9. Solubility data for /7-toluic acid in HFC 32 at 363 K
166

Appendix
| Pressure (bar) Molarity (mol L ') 1 Mole Fraction| 135 0.118530 1 0.0082
170 0.130444 r ^QyQQg5
200 r 0T45446 [ " 0.0092221 0.149951 | 0.0093
Table 10. Solubility data for p-chlorobenzoic acid in HFC 32 at 363 K
| Pressure (bar) Molarity (mol I /1) [ Mole Fraction
0 0 0.13555 | 0.01051 134 0.15147 | 0.0106I 170 0.17751 | 0.0115| 190 0.18162 | 0.0116! 219 0.18915 | 0.01171 248 0.22332 | 0.0135
Table 11. Solubility data for 0-chlorobenzoic acid in HFC 32 at 363 K
[ Pressure (bar) Molarity (mol L'1) | Mole FractionI 69 ! 901. . . 120 rr . T53 r
0.00018 \ 0.00046 | 0.00070 |
0.000029
_ _0.000056
-0 0.00101 1 0.000066| 220 0.00120 [ 0.000074
Table 12. Solubility data for p-aminobenzoic acid in HFC 32 at 363 K
Pressure (bar) Molarity (mol L'r) f Mole Fraction! 79 0.00448 | 0.000422
125 0.00615 | 0.000436148
i 175, _ _ .0.00697 |- 00815 p
0.000471OJ000528““‘
Table 13. Solubility data for anthracene in HFC 32 at 363 K
167

Appendix
| Pressure (bar) Molarity (mol L *) | Mole Fraction1 2 2 0.64861 | 0.046
[ 150 0.76806 | 0.0511 185 0.80820 [ 0.052| 2 2 0 0.85666 | 0.053| 258 0.86390 I 0.054
Table 14. Solubility data for p-chlorophenol in HFC 32 at 363 K
1 Pressure (bar) Molarity (mol L 1) | Mole Fraction| 89 0.013214 | 0.00109| 111 0.016135 | 0.00119[ 132 0.029776 | 0.00207| 188 0.032882 | 0.00209
Table 15. Solubility data for p-aminophenol in HFC 32 at 363 K
| Pressure (bar) ^lolari y L-iy | Mole Fraction1 .. 0.00071 ~[ 70
f ........ ... 90(... "....... “1 2 0
0.004810.015040.01886
| 0.00124 “ | .."^00135
q;00167 —
[ 0.00231i 145r.... .. iso
0.02465
1 2 2 0 0.04034 | 0.00249| 250 0.04504 | 0.00271| 270 0.04799 | 0.00285
Table 16. Solubility data for p-acetamidophenol in HFC 32 at 363 K
168

Appendix
Pressure (bar) Molarity (mol L’1) | Mole Fraction65 0.01315 | 0.002775 0.03818 | 0.0041
1 0 0 0.09266 | 0.0071140 0.15870 1 0.0109180 0 2 1 2 0 1 0.01362 2 0 0.22888 j 0.0141
Table 17. Solubility data for acetyl salicylic acid in HFC 32 at 363 K
| Solvent Pressure (bar) Time (hrs) Extracted (g) Mole Fraction[ HFC 32 200 2 0.010 0.00018| HFC 32 220 4 0.015 0.00027| HFC 32 200 7 0.038 0.00070| HFC 32 180 14 0.073 0.00138j HFC 32 200 24 0.080 0.00148
I c o 2 220 4 0.002 0.00004
Table 18. Paracetamol extraction results as a function of time at 363 K
Solvent Pressure (bar) Time (hrs) Extracted (g)HFC 32HFC 32HFC 32 0.085HFC 32 0.092HFC 32 0.103HFC 32 0.107HFC 32 0.109
0.0160.048
Mole Fraction________o o o n T__________
0.00169_____
0.00033 0.00102
Table 19. Aspirin extraction results as a function of time at 363 K
169

Appendix
| Solvent | Pressure (bar) | Time (hrs) Extracted (g) | Mole Fraction| HFC 32 | 75 r 2 0 .0 0 1 | 0.00003| HFC 32 [ 1 1 0 2 0.045 | 0.00082| HFC 32 150 T 2
^ o o o o 9 9
1 HFC 32 190 ! 2 0.068 | 0.00106HFC 32 f 240 r 2 0.085 | 0 . 0 0 1 2 7
I 190 f 4 0016
Table 20. Aspirin extraction results as a function of pressure at 363 K
Solvent NR NR I 4N 4NExpt Calc | Expt Calc(kK) (kK) 1 (kK) (kK) 1
Dichloromethane 18.60 18.39 [ 28.67 28.73 |Cyclohexane 19.95 19.98 | 30.73 30.82 |
Toluene 19.14 19.10 [ [
Dichloroethane Hexane Anisole
Diethylether Acetonitrile
THF.._____MethanolEthanol
z'so-butanolPropan-2-olChloroform
/-butanol
NNExpt(kK)25.3228.0026.27
NNCalc(kK)25.1227.9626.1625.2718.72 25.34
30.83 31.03 28.3028.1728^54
28.15 25.50 25.5125.47 27.00
25 3527.0525748
27.292 5 . 6 1
26.9026.77_ _
2 6 A 0
27.41 26.06___ _
25787
26.0424.632 5 A 4
25j69
18. 4 25.5718.02 27.10
30.8218.4818.62
26.26 25.97 25.9325.7826.21
25.4718.66
Note: NR = Nile Red, 4N = 4-nitroaniline and NN = 7V,7V-dimethyl-4-nitroaniline
Table 21. Comparison between experimental and calculated vmax values
170

Appendix
| Solvent Pressure (bar) Conversion (%) Kx| HFC 32 70 42.64 0.74338| HFC 32 75 32.70 0.48588r HFC 32i 80 27.32 0.37589| HFC 32 1 0 0 25.02 0.33369| HFC 32 125 19.00 0.23457| HFC 32 145 1 2 .0 1 0.13649j HFC 32 165 9.24 0.10181| HFC 32 170 8.17 0.08897| HFC 32 2 0 0 5.28 0.05574| HFC 32 2 2 0 4.93 0.05186| DCE 1 16.77 0.20149| CH 1 16.10 0.19190
Table 22. Apparent equilibrium constants for the esterification reaction at 363 K
| Solvent ( Pressure (bar) Conversion (%) Kx1 HFC 32 [ 70 19.50 0 . 1 2 1 1 1
| HFC 32 | 90 1 0 .0 1 0.05561HFC 32 | 1 2 0 8.80 QQ4^2"4
| HFC 32 j 140 7.92___
| HFC 32 j 2 0 0 6.31 0.03367
Table 23. Apparent equilibrium constants for the aldol reaction at 363 K
j Temperature (K) 1/Temperature (K 1) Rate (m ol1 dm3 s r) f Ln kI " 363..............." j.............0.00275 ............. | 3.87x H F —........ |.. -7.858| " '373........... [.......... 0.00268 |......0.12x.10' 1..............|.. -7.000i 383......._ j “ 0.00261.................1 1 . 8 7x 10’.............. |...-6.282
Table 24. Parameters used to form an Arrhenius plot for the FC reaction of
anisole with f-BuCl at 260 ± 10 bar
171
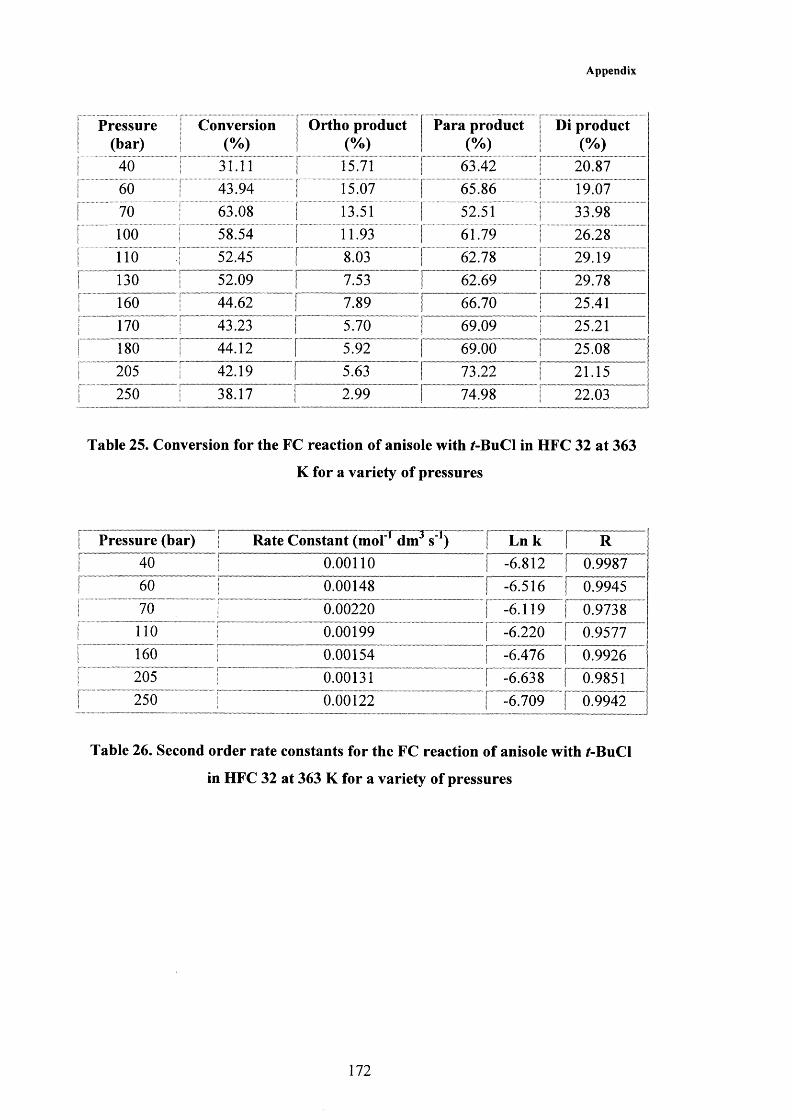
Appendix
j Pressure Conversion Ortho product Para product Di product| (bar) (%) (%) (%) (%)| 40 31.11 15.71 63.42 20.87| 60 43.94 15.07 65.86 19.07j 70 63.08 13.51 52.51 33.98| 1 0 0 58.54 11.93 61.79 26.28[ 1 1 0 52.45 8.03 62.78 29.19| 130 52.09 7.53 62.69 29.78| 160 44.62 7.89 66.70 25.41| 170 43.23 j 5.70 69.09 25.21| 180 44.12 | 5.92 69.00 25.08| 205 42.19 | 5.63 73.22 21.15| 250 38.17 2.99 74.98 22.03
Table 25. Conversion for the FC reaction of anisole with f-BuCl in HFC 32 at 363
K for a variety of pressures
j Pressure (bar)........... .. .................... .....—f—.— j
Rate Constant (mol' dm s'1) | Ln k | R
o i i
0 . 0 0 1 1 0 | 0.99871 60 0.00148 r ^ 5 i 6 [ 0.9945j 70 0 . 0 0 2 2 0 | -6.119 ^ ir 0 9 7 3 8 ^ "I 1 1 0 0.00199 | -6 . 2 2 0
1 1610 0.00154 1 ^ 6 ^ 7 6 ^i 205 0.00131 1 -6.638 1 0.9851! 250 0 . 0 0 1 2 2 f -6.709 i 0.9942
Table 26. Second order rate constants for the FC reaction of anisole with t-BuCl
in HFC 32 at 363 K for a variety of pressures
172

Appendix
| Pressure (bar) i Solvent (mf) Anisole (mf) j f-BuCl (mf) Rate Ln kj 55 0.97 0 .0 1 1 0 . 0 2 | 0.00190 -6.266| 72 0.97 0 .0 1 | 0 . 0 2 | 0 . 0 0 2 2 0 -6.119! 1 1 0 0.97
_“| 0 . 0 2 " ^ 2 2 0 T
| 1 2 0 ” | 0 97_ ^ _____
~ ^2 3 fT| 180 | 0.97
_ _____” 2 3 c r
| 2 1 0 0.97 0 .0 1 | Oj02 | 0.00198 -6.2251 DCE (1 bar) 0.97 0 .0 1 H .... 6 . 0 2 i 0.00057 -7.468
Table 27. Second order rate constants for the FC reaction of anisole with *-BuCl
in HFC 32 at 363 K for a variety of pressures at constant mole fraction
I Pressure | (bar)
| Conversion ! (%)
Ortho Product (%)
1 Para Product (%)
Di Product (%)
1 55 I 50.14 2 2 . 6 6!1 40.8 36.55
| 72 | 58.00 14.47 I 53.3_ _
[1 52.45 8.03 [ 62.8 29.19
| 1 2 0 1 51.80 7.29.!..| 64.7 27.97
| 180 f 52.10 5.17 j 72.7 2 2 . 2 0
Table 28. Conversion for the FC reaction of anisole with f-BuCl in HFC 32 at 363
K for a variety of pressures at constant mole fraction
| Pressure 1 (bar)
Conversion(%)
| Ortho Product1 (%)
|I
Para Product (%)
Di Product (%)
| 60 16.13 ! o i—1I 1 0 0 0
| 75 19.91 r ori 1 0 0 0
1 95 16.19 r o 1 1 0 0 0
| 1 0 0 15.69 [ 0 11 0 0 0
[ 155 10.62 f 0 s1 0 0 0
| 195 7.32 T . o . . “ . " 1 . . i o o o| 2 1 0 5.12 "[ 0
li 1 0 0 o
| 260 3.80 I 0 | 1 0 0 0
i 265 3.09 ! o j 1 0 0 0
Table 29. Conversion for the FC reaction of toluene with f-BuCl in HFC 32 at
363 K for a variety of pressures
173

Appendix
| Pressure (bar)i 60 — r
Rate Constant (mol' dm s ' )_ [ Ln k— f -7.851
[ R
| 75 5.02 x 10⁴ n ^ 6 0 4 “ fT 9 8 F ™1 95 3.90 x 1 O'4 j” -7.852 1 09 7 1
f 1 0 0 3.76 x 10‘4 | -7.890 1 0.989
m|
2.42x I O’4 | -8.335 | 0.973| 195 “T o o T i F [ -8.742 j 0.982| 2 1 0 [ 1.09 x 10⁻⁴ | -9.122 | 0.992| 260 7.99 x 10’5 | -9.434 | 0.9771 265 6.45 x 10'5 1 -9.655 | 0.975
Table 30. Second order rate constants for the FC reaction of toluene with *-BuCl
in HFC 32 at 363 K for a variety of pressures
Temperature (K) 1/Temperature (K 1)r ^ r ^
| Ln k363 0.00275 5 .92x10'3
! _ _ _
373 0.00268 2.64 x 1 O'4 [ -8.239383 0.00261 6.24 x 10'4 [ -7.379
Table 31. Parameters used to form an Arrhenius plot for the FC reaction of
toluene with f-BuCl at 260 ± 20 bar
[ Pressure (bar) Conversion (%) [ Rate (mol'1 dm3 s 1) [ Ln k| 50 ( 0 .[.......................o..._ ............. ‘. 0
| 1 0 0j _____
| 1.79x10'3 | -6.326| 1 2 0 | 45.74 | 1.42x10'3 [ -6.557| 165 37.81 1 9.87 x 10^ j" -6.921| 2 0 0 | 31.25 j 8 . 1 0 x KT4 f -7.118| 205 | 29.77 r 7.65x1 O'47' j -7.176
Table 32. Conversion for the FC reaction of anisole with f-BuCl in C 0 2 at 363 K
for a variety of pressures
174

Appendix
Pressure (bar) Solvent (mf) | Anisole (mf) | f-BuCl(mf) [ Rate [ Ln k1 2 0 0.965 r 0 . 0 1 | OJ025~^™ \ 7.06 x 10'4 f -7.256
_____0i965 ‘I i i i '| 0.025 | 7.00 x 10'* | -7.264
180 0.965 oToi f 0.025 [~7.48 x 10³r"[ -7.198205 0^965" 7 oToi 0.025 7 ~ 7 ^ 5 x T 6 ^ f"~-7T76”~
Table 33. Second order rate constants for the FC reaction of anisole with /-BuCI
in CO2 at 363 K for a variety of pressures at constant mole fraction
j Pressure [ Conversion Ortho Product Para Product I Di ProductI (bar) 1 (%) (%) (%) 1 (%)| 1 2 0 | 28.12 6.36 78.77 ] 14.87| 160 i 27.95 8.89 74.73
i
U4 OO
| 180 r 29.31 9.88 76.16 1 13.96205 • 29.77 6.15 78.10 | 15.75
Table 34. Conversion for the FC reaction of anisole with /-BuCl in CO2 at 363 K
for a variety of pressures at constant mole fraction
175