Reaction Dynamics in a Parallel Flow Channel PEM...
10
Reaction Dynamics in a Parallel Flow Channel PEM Fuel Cell Jay Benziger, z Joanne E. Chia, Erin Kimball, and Ioannis G. Kevrekidis Department of Chemical Engineering, Princeton University, Princeton, New Jersey 08544, USA The spatiotemporal dynamic response of a segmented anode parallel channel polymer electrolyte membrane PEM fuel cell was monitored following changes in flow rate, temperature and load resistance. Autohumidified operation with dry feeds at 1 bar pressure was achieved at temperatures below 70°C, where the convective transport of water vapor was less than the water production by the fuel cell current. The current could be “ignited” by a single injection of water into the anode feed, or by reducing the temperature and external load resistance. Co-current flow of the hydrogen and oxygen resulted in current ignition at the outlets of the flow channels, followed by a wave of high current density propagating toward the inlets. Counter-current flow of the hydrogen and the oxygen resulted in ignition near the center of the flow channels; over time the ignition front fanned out. The spatio-temporal dynamics of the current ignition along the flow channels can be effectively predicted from a model of a set of coupled differential fuel cells in series. Liquid water condensing in the flow channels gives rise to complex spatio-temporal variations in the current density; these variations are strongly dependent on orientation of the fuel cell with respect to gravity. © 2007 The Electrochemical Society. DOI: 10.1149/1.2745715 All rights reserved. Manuscript submitted October 13, 2006; revised manuscript received April 10, 2007. Available electronically June 15, 2007. Polymer electrolyte membrane PEM fuel cells are complex multiphase chemical reactors, whose principal products are water and an electric current. The basic operation of fuel cells has been reviewed extensively in the literature. Hydrogen and oxygen are fed on opposite sides of an ion-conducting polymer. Hydrogen is oxi- dized to protons at a catalytic anode and the protons are conducted across the membrane, where they react with oxygen and electrons to make water at a catalytic cathode. The proton current is driven by the chemical potential difference of hydrogen between the anode and cathode. When an external load is connected across the anode and cathode an electron current passes through the external load, matched by a proton current through the ion-conducting membrane. The current is limited by both the external load impedance and the internal resistance of the ion-conducting membrane. The internal resistance of the polymer electrolyte membrane de- pends on the water content of the membrane. The water ionizes acid moieties providing mobile protons. 1-4 Nafion, a Teflon/perfluoro- sulfonic acid copolymer, is the most frequently employed polymer electrolyte; it is chemically robust to oxidation and strongly acidic. 4-6 The electrodes are commonly Pt nanoparticles supported on a nanoporous carbon support and coated onto a microporous carbon cloth or paper. These structures provide high three-phase interface between the electrolyte/catalyst/reactant gas at both the anode and cathode. 7 There are multiple transport and reaction steps in a fuel cell. PEM fuel cell designs have been heuristically derived to achieve high power output. Many proprietary methods of making membrane-electrode assemblies have been developed, as well as complex patterns of the flow fields, to distribute the reactants to the fuel cell. 5,8,9 There is extensive effort to model PEM fuel cells; models vary in complexity from relatively simple single phase one- dimensional models to complex three-dimensional models that at- tempt to account for multiphase flow and spatial variations in the water content, current density and reactant concentrations. 3,10-16 Most fuel cell data is limited to steady state operation. We re- cently developed the stirred tank reactor STR fuel cell to study dynamic operation of PEM fuel cells. 17 The STR PEMFC is a one- dimensional differential cell; longitudinal gradients were minimized, which greatly simplified the analysis of dynamic operation. Ignition/ extinction of the fuel cell current and multiple steady states were demonstrated with autohumidified operation resulting from the bal- ance between water production and water removal. 18 “Current ig- nition” describes the situation where the steady-state current in- creases by more than an order of magnitude due to a small change in operating parameter such as the load resistance or reactant flow rate. Almost all large commercial fuel cells employ serpentine flow channels to distribute the gas flow across the active area of the gas diffusion layer. 5,6,14,16,19-21 The flow channels typically have a small cross-sectional area resulting in a high gas velocity that pushes liq- uid water drops through the flow channels to avoid flooding. As water is a product of the fuel cell reaction, the water concentration increases along the length of the flow channels from the inlet to the outlet. 22 The variable water and reactant concentrations cause the current density to vary throughout the fuel cell. Interpreting the integrated current density and average voltage to changes in feed flow rates and load becomes intricate with the serpentine flow chan- nels. To help identify the essential physics that should be included in PEM fuel cell modeling efforts, we developed a segmented anode parallel channel SAPC fuel cell reactor. The SAPC PEM fuel cell reactor has a simplified two-dimensional geometry. It can be easily modeled by a number of STR PEM fuel cell reactors in series that simplify the analysis of the dynamic operation. We present here data for autohumidified operation of the two-dimensional reactor demon- strating current ignition and reaction front propagation along the flow channels. Flow configurations impact the location of the initial current ignition in the flow channel and the direction of propagation. We show that large current fluctuations occur between different seg- ments along the flow channel that appear to be correlated with water droplet motion. Finally, we show the importance of gravity on liquid water flow in the gas flow channels. The Segmented Anode Parallel Channel PEM Fuel Cell To examine the current distribution along a PEM fuel cell flow channel, a two-dimensional fuel cell with parallel flow channels at the anode and cathode and a segmented anode was constructed; we refer to this reactor as the segmented anode parallel channel SAPC fuel cell. Local current densities were measured through each anode segment; the cathode was fabricated as a single unit. The membrane electrode assembly MEA was also fabricated as a single assembly. The reactor was designed with the lateral separation between anode segments 10 times the transverse separation between the anode and cathode, so that the transverse current is large compared to the lateral currents. We have built two versions of SAPC fuel cells. Version one had three parallel flow channels at both the anode and cathode. The cathode was a machined block of graphite with three parallel flow channels 2 2 30 mm long. The entire graphite block was press fit into a larger piece of Teflon for electrical isolation. The flow channels initiated and terminated in common manifolds in the Teflon block at both ends of the graphite flow channels. The anode had the same channel structure, except that it was made of six graphite pieces separated by Teflon spacers inserted into a Teflon block. Cop- per foils were pressed against the graphite plates and copper wires z E-mail: [email protected] Journal of The Electrochemical Society, 154 8 B835-B844 2007 0013-4651/2007/1548/B835/10/$20.00 © The Electrochemical Society B835 Downloaded 17 Jun 2010 to 128.112.35.148. Redistribution subject to ECS license or copyright; see http://www.ecsdl.org/terms_use.jsp
Transcript of Reaction Dynamics in a Parallel Flow Channel PEM...
Journal of The Electrochemical Society, 154 �8� B835-B844 �2007� B835
Reaction Dynamics in a Parallel Flow Channel PEM Fuel CellJay Benziger,z Joanne E. Chia, Erin Kimball, and Ioannis G. Kevrekidis
Department of Chemical Engineering, Princeton University, Princeton, New Jersey 08544, USA
The spatiotemporal dynamic response of a segmented anode parallel channel polymer electrolyte membrane �PEM� fuel cell wasmonitored following changes in flow rate, temperature and load resistance. Autohumidified operation with dry feeds at 1 barpressure was achieved at temperatures below 70°C, where the convective transport of water vapor was less than the waterproduction by the fuel cell current. The current could be “ignited” by a single injection of water into the anode feed, or by reducingthe temperature and external load resistance. Co-current flow of the hydrogen and oxygen resulted in current ignition at the outletsof the flow channels, followed by a wave of high current density propagating toward the inlets. Counter-current flow of thehydrogen and the oxygen resulted in ignition near the center of the flow channels; over time the ignition front fanned out. Thespatio-temporal dynamics of the current ignition along the flow channels can be effectively predicted from a model of a set ofcoupled differential fuel cells in series. Liquid water condensing in the flow channels gives rise to complex spatio-temporalvariations in the current density; these variations are strongly dependent on orientation of the fuel cell with respect to gravity.© 2007 The Electrochemical Society. �DOI: 10.1149/1.2745715� All rights reserved.
Manuscript submitted October 13, 2006; revised manuscript received April 10, 2007. Available electronically June 15, 2007.
0013-4651/2007/154�8�/B835/10/$20.00 © The Electrochemical Society
Polymer electrolyte membrane �PEM� fuel cells are complexmultiphase chemical reactors, whose principal products are waterand an electric current. The basic operation of fuel cells has beenreviewed extensively in the literature. Hydrogen and oxygen are fedon opposite sides of an ion-conducting polymer. Hydrogen is oxi-dized to protons at a catalytic anode and the protons are conductedacross the membrane, where they react with oxygen and electrons tomake water at a catalytic cathode. The proton current is driven bythe chemical potential difference of hydrogen between the anodeand cathode. When an external load is connected across the anodeand cathode an electron current passes through the external load,matched by a proton current through the ion-conducting membrane.The current is limited by both the external load impedance and theinternal resistance of the ion-conducting membrane.
The internal resistance of the polymer electrolyte membrane de-pends on the water content of the membrane. The water ionizes acidmoieties providing mobile protons.1-4 Nafion, a Teflon/perfluoro-sulfonic acid copolymer, is the most frequently employed polymerelectrolyte; it is chemically robust to oxidation and stronglyacidic.4-6 The electrodes are commonly Pt nanoparticles supportedon a nanoporous carbon support and coated onto a microporouscarbon cloth or paper. These structures provide high three-phaseinterface between the electrolyte/catalyst/reactant gas at both theanode and cathode.7
There are multiple transport and reaction steps in a fuel cell.PEM fuel cell designs have been heuristically derived to achievehigh power output. Many proprietary methods of makingmembrane-electrode assemblies have been developed, as well ascomplex patterns of the flow fields, to distribute the reactants to thefuel cell.5,8,9 There is extensive effort to model PEM fuel cells;models vary in complexity from relatively simple single phase one-dimensional models to complex three-dimensional models that at-tempt to account for multiphase flow and spatial variations in thewater content, current density and reactant concentrations.3,10-16
Most fuel cell data is limited to steady state operation. We re-cently developed the stirred tank reactor �STR� fuel cell to studydynamic operation of PEM fuel cells.17 The STR PEMFC is a one-dimensional differential cell; longitudinal gradients were minimized,which greatly simplified the analysis of dynamic operation. Ignition/extinction of the fuel cell current and multiple steady states weredemonstrated with autohumidified operation resulting from the bal-ance between water production and water removal.18 �“Current ig-nition” describes the situation where the steady-state current in-creases by more than an order of magnitude due to a small change inoperating parameter such as the load resistance or reactant flowrate.�
z E-mail: [email protected]
Downloaded 17 Jun 2010 to 128.112.35.148. Redistribution subject to E
Almost all large commercial fuel cells employ serpentine flowchannels to distribute the gas flow across the active area of the gasdiffusion layer.5,6,14,16,19-21 The flow channels typically have a smallcross-sectional area resulting in a high gas velocity that pushes liq-uid water drops through the flow channels to avoid flooding. Aswater is a product of the fuel cell reaction, the water concentrationincreases along the length of the flow channels from the inlet to theoutlet.22 The variable water and reactant concentrations cause thecurrent density to vary throughout the fuel cell. Interpreting theintegrated current density and average voltage to changes in feedflow rates and load becomes intricate with the serpentine flow chan-nels.
To help identify the essential physics that should be included inPEM fuel cell modeling efforts, we developed a segmented anodeparallel channel �SAPC� fuel cell reactor. The SAPC PEM fuel cellreactor has a simplified two-dimensional geometry. It can be easilymodeled by a number of STR PEM fuel cell reactors in series thatsimplify the analysis of the dynamic operation. We present here datafor autohumidified operation of the two-dimensional reactor demon-strating current ignition and reaction front propagation along theflow channels. Flow configurations impact the location of the initialcurrent ignition in the flow channel and the direction of propagation.We show that large current fluctuations occur between different seg-ments along the flow channel that appear to be correlated with waterdroplet motion. Finally, we show the importance of gravity on liquidwater flow in the gas flow channels.
The Segmented Anode Parallel Channel PEM Fuel Cell
To examine the current distribution along a PEM fuel cell flowchannel, a two-dimensional fuel cell with parallel flow channels atthe anode and cathode and a segmented anode was constructed; werefer to this reactor as the segmented anode parallel channel �SAPC�fuel cell. Local current densities were measured through each anodesegment; the cathode was fabricated as a single unit. The membraneelectrode assembly �MEA� was also fabricated as a single assembly.The reactor was designed with the lateral separation between anodesegments �10 times the transverse separation between the anodeand cathode, so that the transverse current is large compared to thelateral currents.
We have built two versions of SAPC fuel cells. Version one hadthree parallel flow channels at both the anode and cathode. Thecathode was a machined block of graphite with three parallel flowchannels 2 � 2 � 30 mm long. The entire graphite block was pressfit into a larger piece of Teflon for electrical isolation. The flowchannels initiated and terminated in common manifolds in the Teflonblock at both ends of the graphite flow channels. The anode had thesame channel structure, except that it was made of six graphitepieces separated by Teflon spacers inserted into a Teflon block. Cop-per foils were pressed against the graphite plates and copper wires
CS license or copyright; see http://www.ecsdl.org/terms_use.jsp

B836 Journal of The Electrochemical Society, 154 �8� B835-B844 �2007�B836
were attached to connect them to the external load resistor. Each ofthe graphite segments was connected individually to a lead wire andrun through a 0.1 � sensing resistor.
After a series of experiments with the first SAPC, we built asecond version with a single flow channel at both the anode andcathode. The flow channels were 1.6 mm wide � 3.2 mm deep� 75 mm long, machined out of polycarbonate. The cathode con-sisted of two stainless steel pieces 6.4 mm wide � 54 mm long, thatlined both sides of the flow channel as seen in Fig. 1a. A threadedrod was connected through the polycarbonate plate into the stainlesssteel pieces. The anode had twelve stainless steel pieces, 6.4 mmsquare, machined to fit into a polycarbonate plate separated by3.2 mm along the channel delineating the flow channel. Copperwires were soldered to the stainless steel leads from the electrodes.The stainless steel segments straddling the flow channel from eachother were jumpered together to form a single anode segment. Thelead wires from each anode segment were connected individually toa 0.1 � sensing resistor, Rsense. With external illumination it waspossible to see the MEA in the flow channel through the polycar-bonate.
The six leads from sensing resistors at the anode were connectedtogether, and the common lead was connected through a 0–20 �10-turn potentiometer to the cathode. The entire assembly wasmounted between two aluminum blocks that were temperature con-trolled using cartridge heaters. A computer DAQ board read the
Figure 1. �Color online� �a� Segmented anode fuel cell. The flow channelsand divisions of the anode are shown. The basic setup for temperature con-trol, reactant feed, and relative humidity and water flow measurements forthe segmented anode fuel cell was the same as the one employed with thedifferential PEM fuel cell.17 �b� Equivalent circuit for the segmented anodefuel cell. The current through each segment as well as the voltage dropacross the load resistance were monitored. The voltage across the load resis-tance was recorded as well as the currents through the six segments of theanode. The total current was determined by summing the individual currentsthrough the six segments of the anode.
Downloaded 17 Jun 2010 to 128.112.35.148. Redistribution subject to E
voltage drop across the potentiometer �that served as the load resis-tance� and the voltage drop across each of the sensing resistors. Thecurrents through each of the six segments of the anode were deter-mined by multiplying the voltage drop across the sensing resistorsby 10 �1/Rsense�. The electrical equivalent of the segmented anodefuel cell is shown in Fig. 1b.
An MEA was placed between the cathode and anode and sealed.We made our own MEA of a Nafion 115 membrane pressed between2 E-TEK electrodes �these consist of a carbon cloth coated on oneside with a Pt/C catalyst�. The catalyst weight loading was0.4 mg-Pt/cm2. The electrodes were brushed with solubilizedNafion solution to a loading of �1 mg-Nafion/cm2 before placingthe membrane between them.23 The assembly was hot pressed at130°C and 10 MPa. The Nafion membrane extended beyond thecarbon cloth by �3 mm and was pressed between silicon rubbersheet gaskets that sealed the MEA from the sides. The MEA in thesingle channel fuel cell �Version 2� was 12 mm wide and 75 mmlong.
Hydrogen and oxygen were supplied from commercial cylindersthrough mass flow controllers at flow rates, F = 1–20 cm3/min�sccm�. The effluents were bled into 10 mL graduated cylinders witha small hydrostatic head ��2 cm H2O�, so that the cell pressure waseffectively 1 bar. The water in the graduated cylinders also kept airfrom back diffusing into the flow channels. The flows at the anodeand cathode could be either co-current or counter-current. The fuelcell could be oriented with the flow channels either vertical or hori-zontal; we see below, the orientation of the flow channels has adramatic effect on the fuel cell operation.
Tees with relative humidity sensors �Honeywell 3610� were po-sitioned at the outlets from both the anode and cathode to measurethe water activity in the effluents. A tee with a septum was placed atthe inlet to the anode. This permitted direct injection of fixed ali-quots of water to the anode.
Dynamics of Start-up of a PEM Fuel Cell
The membrane water content must be sufficient for a PEM fuelcell to sustain an acceptable current density. Can the fuel cell makeenough water to keep the fuel cell functioning? Autohumidified fuelcell operation employs dry feeds; the water to humidify the electro-lyte membrane is provided by the fuel cell reaction.24-26 Two con-ditions must be satisfied for autohumidified operation of a fuel cell:water production must be sufficient to balance water removal, andthere must be sufficient water present in the membrane initially toignite the fuel cell current.27 A dry membrane will have a largeresistance and limit the fuel cell current, making it very small. Al-ternatively, if the external load being driven by the fuel cell is in-creased, it will reduce the current so that less water is produced; thiswill cause the membrane to dry and extinguish the current. Thetwo-dimensional fuel cell with flow channels results in lateral gra-dients in composition and current density. The local water balancealong the length of the flow channels is controlled by the localcurrent density, convective flow in the gas flow channels, and diffu-sion of water in the membrane. Ignition and extinction of the fuelcell current along the flow channels in a PEM fuel cell with dryfeeds �autohumidified operation� are presented below.
Ignition and extinction in co-current flow.— The initial watercontent in the polymer electrolyte membrane was set to a “dry state”before starting an experiment. The dry state was defined such thatthe current through each segment in the fuel cell was �1 mA whenthe fuel cell load was shorted out �RL � 0.5 ��. Initially, we pre-pared a dry state at 80°C. The polymer membrane was dried byflowing dry oxygen through the cathode chamber at 10 sccm anddry hydrogen through the anode chamber at 10 sccm for �12 h at80°C with the fuel cell at open circuit. With a dry membrane, a finiteload resistance of 0.2–20 � could be connected between the anodeand cathode and the fuel cell and the current through each anodesegment circuit was negligible ��1 mA�. We subsequently discov-ered that the “dry” state could be achieved by passing dry gases
CS license or copyright; see http://www.ecsdl.org/terms_use.jsp

B837Journal of The Electrochemical Society, 154 �8� B835-B844 �2007� B837
through the fuel cell at 25°C and open circuit for 16 h. A fuel cell inthe “dry” state had “zero” current through each segment of the fuelcell with a small load resistance �RL � 0.5 �� and dry feeds.
Once the membrane was dry, the set point on the temperaturecontroller was adjusted. After the fuel cell temperature stabilized,the external load resistance was set, the reactant flow was started,and data collection was initiated. Temperature, relative humidity inthe anode and cathode effluents, voltage drop across the load resis-tance, and the current through each anode segment were automati-cally logged every 1–100 s �the frequency was varied depending onthe specific experiment, with the concern to keep the files manage-able for data processing�.
With a “dry” membrane and fuel cell temperature �60°C theSAPC fuel cell current was always negligible ��1 mA total cur-rent�, even when the external load resistance was shorted out. Thefuel cell current was ignited by first shorting out the external load�RL � 0.5 �� and then either reducing the temperature or injectingan aliquot of liquid water into the anode feed. Figure 2 shows thecurrent ignition at 25°C following water injection. �Data file namesare listed with the figure. These data files are posted as supplementalinformation available at our web site.� The fuel cell was positionedwith the flow channels running vertically and the flows runningco-current from top to bottom. Segment 1 is at the inlet for theanode and cathode. The fuel cell current was near zero with a loadresistance of 0.5 � and flow rates of 3 sccm H2 at the anode and1.5 sccm O2 at the cathode. At time zero, 50 �L of liquid waterwere injected into the anode feed. About 150 s after the water injec-tion, the current in each segment increased to �3 mA. 1500 s afterthe water injection, the current began to rise rapidly approachingsteady state around 3000 s after the water injection and increased tosteady state currents between 20–50 mA in each segment. Thesteady state currents are highest near the inlet and fall off toward theoutlets of the flow channels.
The fuel cell current will only stay ignited as long as the waterproduced is greater than or equal to the water removed by convec-tion in the effluents. Water removal scales with the vapor pressure ofwater, hence it increases with temperature. Water production scaleswith the current, hence it decreases with increasing load resistance.Increasing the temperature and increasing the load resistance cancause the fuel cell current to extinguish. Figure 3 is an example ofextinction of the fuel cell current by increasing the load resistance.An ignited SAPC fuel cell was operated at 80°C with flow rates of6 sccm H at the anode and 3 sccm O at the cathode and a load
Figure 2. �Color online� Ignition of the SAPC fuel cell by water injection.Co-current flow of reactants at 25°C with a load of 0.5 �. 50 �L of waterwere injected into the anode feed stream at t = 0. �Data file name: MEA2-25C-constco-startup2�
2 2
Downloaded 17 Jun 2010 to 128.112.35.148. Redistribution subject to E
resistance of 0.5 �. The fuel cell was operated with co-current flowand was positioned vertically with the feeds entering at the top atsegment 1. At time zero, the load resistance was increased to 20 �.Approximately 1000 s after increasing the load, the current in seg-ment 1 began to drop to zero. The current in the other segmentsextinguished sequentially from the inlet �segment 1� to the outlet�segment 6� as the membrane dried out. Two unusual features of theextinction of the fuel cell current are evident in Fig. 3. The first isthat in segments 4, 5, and 6 the current increased before extinguish-ing. This is attributed to proton currents moving upstream on thecathode after the anode segments were extinguished. Second, thecurrents in segments 2 and 3 went negative while the currents rosein segments 4, 5, and 6. This is attributed to local potential differ-ences driving internal currents. The voltage across the load resis-tance is also plotted in Fig. 3. The voltage stays almost constantuntil the current in segment 6 of the fuel cell starts to extinguish, andthen the voltage drops to zero as the current through the load falls tozero. When the membrane is dry, most of the potential drop occursacross the membrane and there is negligible voltage drop across theload. However, as long as any one segment remained ignited, thevoltage drop across the load was almost independent of the activearea of the membrane-electrode-assembly.
Extinction of the fuel cell current depends on a balance of thewater production and water removal. When the flow rates of hydro-gen and oxygen were reduced from 6 and 3 sccm, respectively, to 3and 1.5 sccm, the time for the current extinction was 4000 s; it tooktwice as long for the current to extinguish when the flow rate washalved. Alternatively, it was observed that when the load resistancewas increased to 10 � instead of 20 �, the time for current extinc-tion was 2500 s; it took longer for the current to extinguish when theload resistance was halved because the water production rate wasgreater. There is a critical load resistance below which the currentwill not extinguish; it is a function of both temperature and flowrate, but we did not attempt to determine that condition experimen-tally.
After the fuel cell current is extinguished, the current can bereignited by reducing the load resistance and reducing the tempera-ture. Reducing the fuel cell temperature reduces the water removedby convection. The flows to the anode and cathode were shut offafter the fuel cell was extinguished and the temperature controllerwas reset from 80 to 25°C. By stopping the gas flow through the fuelcell the membrane was “dry” from the viewpoint of its resistivitybeing large enough to limit the current to �1 mA, but the mem-brane was not dried to where the resistivity became excessively highand limited the current to �1 �A. Once the temperature was at
Figure 3. �Color online� Fuel cell extinction at 80°C. The reactant flowswere co-current. At t = 0 the load resistance was increased from 0.5 to 20 �.The currents are designated by segment number. The voltage is the voltagedrop across the load impedance. �Data file name: MEA2-80C-constco-extinguish6�
CS license or copyright; see http://www.ecsdl.org/terms_use.jsp
B838 Journal of The Electrochemical Society, 154 �8� B835-B844 �2007�B838
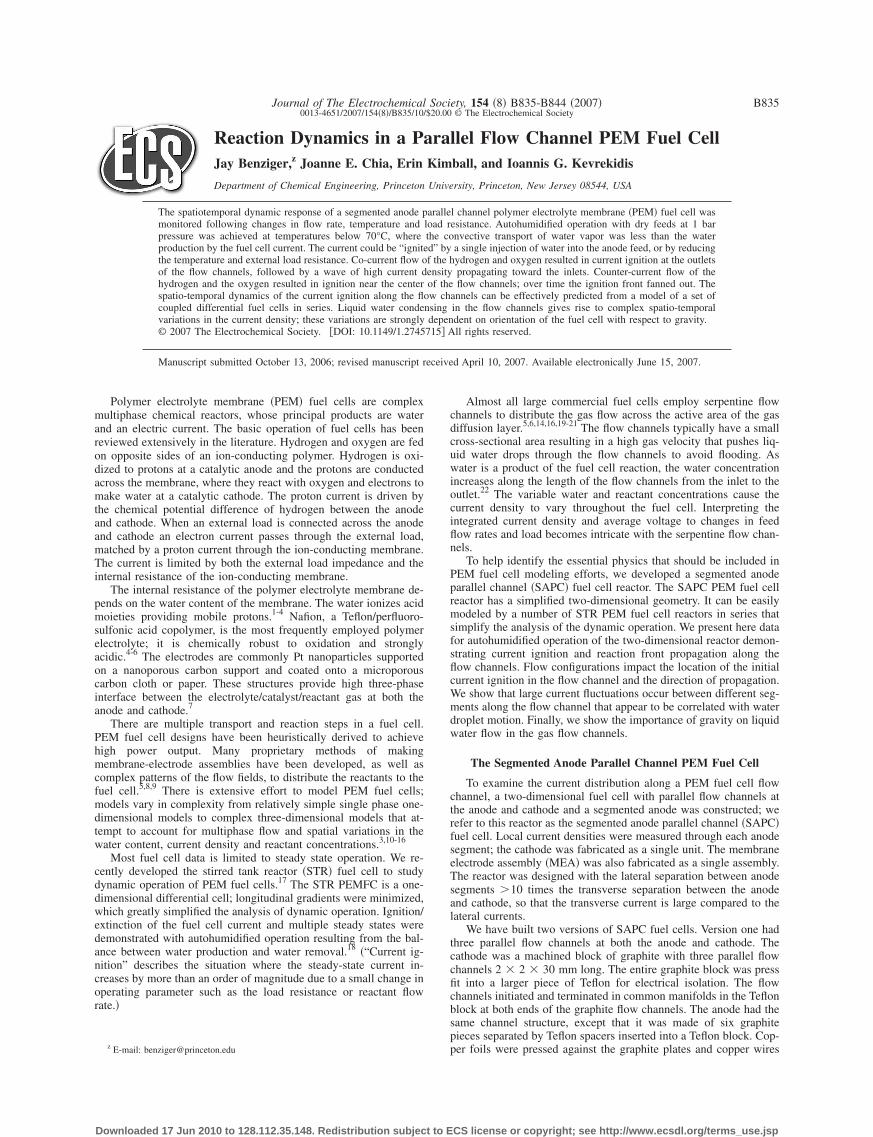
25°C, the load resistance was reduced to 0.5 � and the flow to thefuel cell was started up at 6 sccm H2 at the anode and 3 sccm O2 atthe cathode. The fuel cell was in a vertical orientation with the feedsentering at segment 1. The dynamic response during the start-up isshown in Fig. 4a and b. Figure 4a shows the first 100 s after the flowwas started, and Fig. 4b shows the response over 10,000 s.
Figure 4a and b show a two-step current ignition. The first cur-rent ignition started 50 s after the flow started with a small currentof 3 mA in segment 1, and then each segment ignited in sequenceover a period of 10 s. The first ignition step shows a peak in thecurrent that lasts for �10 s after which the current and voltage bothdecrease to a low value. This first ignition step occurred when thehydrogen and oxygen flows first reached the membrane-electrodeinterface. The first reaction front moves along the channel at�1 cm/s. The gas velocity in the flow channels is �10 cm/s. Thefirst current front propagates slower than the gas velocity because ofgas diffusion across the gas diffusion layers in the MEA. The secondignition step, depicted in Fig. 4b, begins after 1000 s and takes aperiod of �500 s for the currents to reach a steady state. The secondignition step is different from the first ignition step. The secondignition step shows the currents rising to a high value and remainingat those high values. The currents in segments 5 and 6 are the first toignite in the second stage of ignition, followed by segment 4. Seg-ments 1 and 2 appear to extinguish and segment 3 sustains only asmall current. The voltage across the load resistance rises coinciden-
Figure 4. �Color online� �a� First 100 s of reignition of the SAPC fuel cellafter extinction. Temperature was 25°C; load resistance was 0.5 �. The cur-rents are designated by segment number. The voltage is the voltage dropacross the load impedance. At t = 0 the reactant flows were started at 6 sccmH2 and 3 sccm O2. �Data file name: MEA2-25C-constco-startup4�. �b� Thecomplete reignition of the SAPC fuel cell after extinction. The first ignitionpoint is when hydrogen first flows into the flow channel; the second ignitioncorresponds to rehydration of the membrane.
Downloaded 17 Jun 2010 to 128.112.35.148. Redistribution subject to E
tally with both ignition steps. The second ignition step is ascribed tohydration of the membrane by the water produced in the fuel cell.
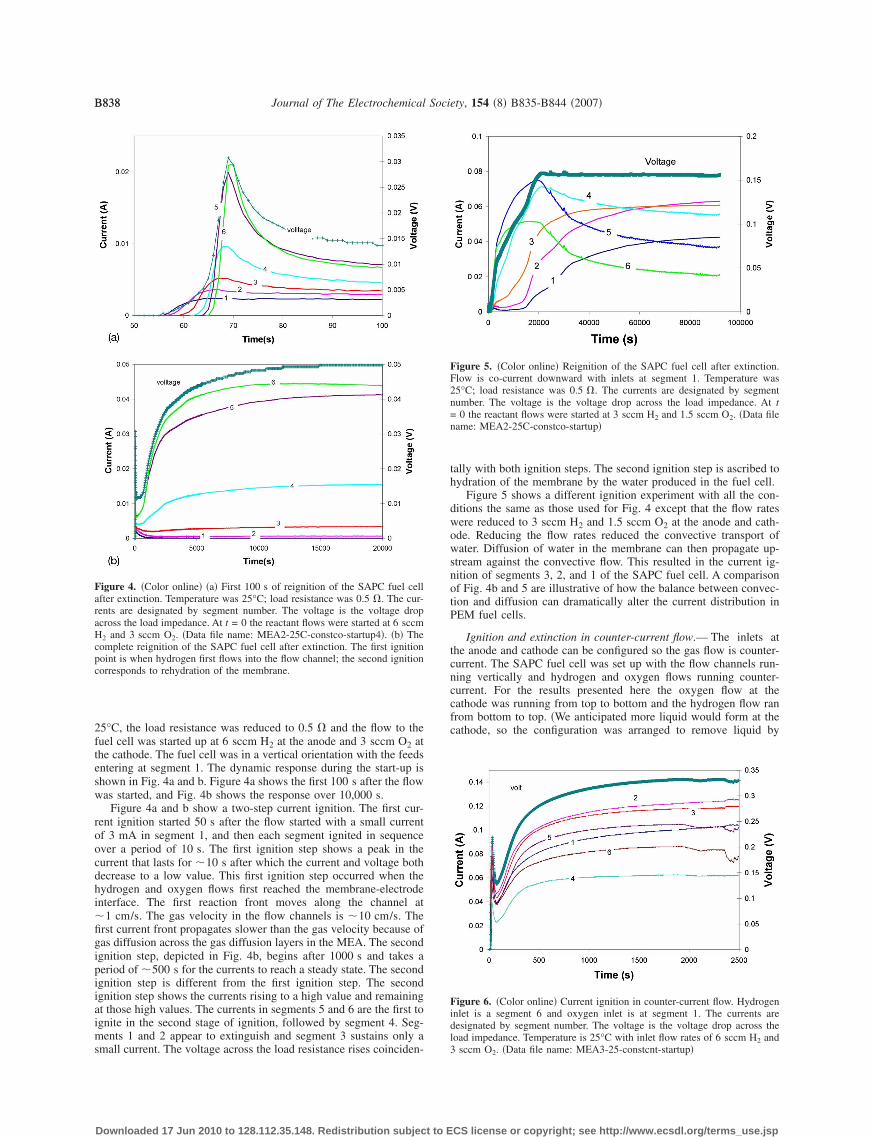
Figure 5 shows a different ignition experiment with all the con-ditions the same as those used for Fig. 4 except that the flow rateswere reduced to 3 sccm H2 and 1.5 sccm O2 at the anode and cath-ode. Reducing the flow rates reduced the convective transport ofwater. Diffusion of water in the membrane can then propagate up-stream against the convective flow. This resulted in the current ig-nition of segments 3, 2, and 1 of the SAPC fuel cell. A comparisonof Fig. 4b and 5 are illustrative of how the balance between convec-tion and diffusion can dramatically alter the current distribution inPEM fuel cells.
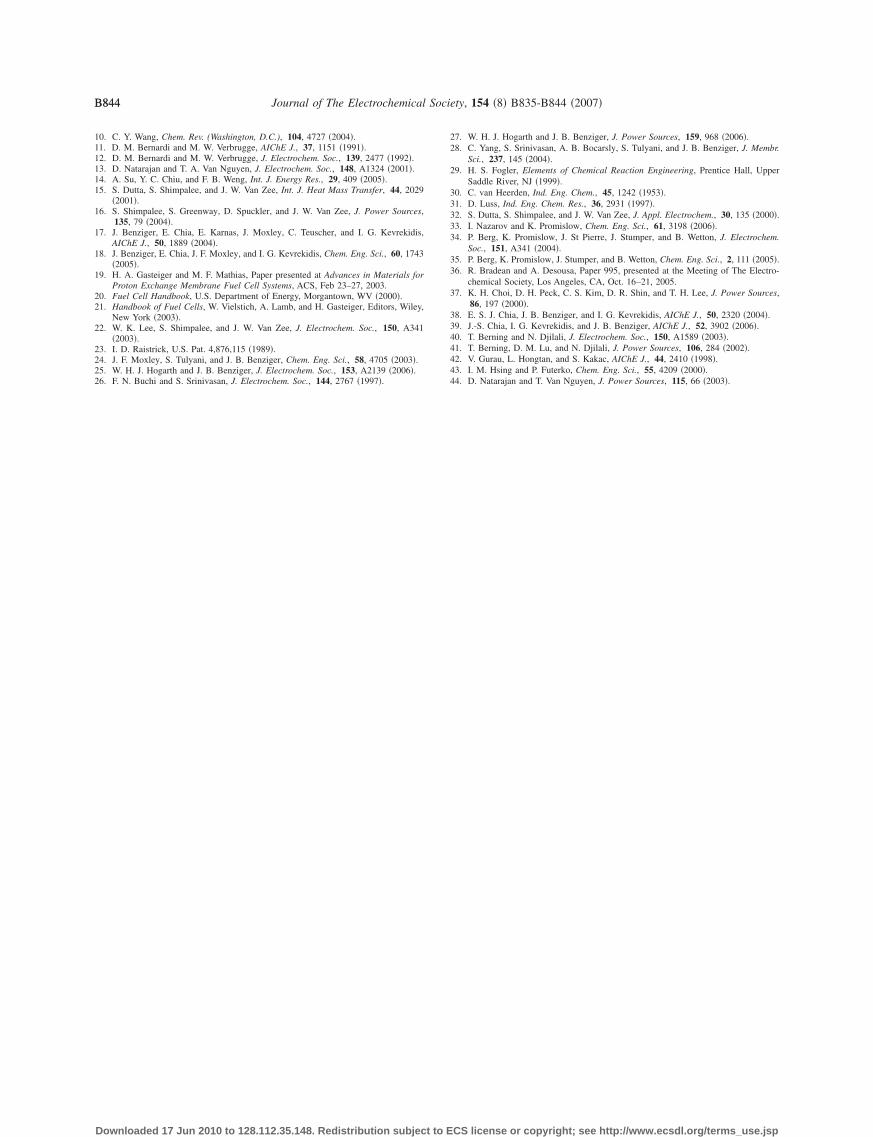
Ignition and extinction in counter-current flow.— The inlets atthe anode and cathode can be configured so the gas flow is counter-current. The SAPC fuel cell was set up with the flow channels run-ning vertically and hydrogen and oxygen flows running counter-current. For the results presented here the oxygen flow at thecathode was running from top to bottom and the hydrogen flow ranfrom bottom to top. �We anticipated more liquid would form at thecathode, so the configuration was arranged to remove liquid by
Figure 6. �Color online� Current ignition in counter-current flow. Hydrogeninlet is a segment 6 and oxygen inlet is at segment 1. The currents aredesignated by segment number. The voltage is the voltage drop across theload impedance. Temperature is 25°C with inlet flow rates of 6 sccm H2 and3 sccm O . �Data file name: MEA3-25-constcnt-startup�
Figure 5. �Color online� Reignition of the SAPC fuel cell after extinction.Flow is co-current downward with inlets at segment 1. Temperature was25°C; load resistance was 0.5 �. The currents are designated by segmentnumber. The voltage is the voltage drop across the load impedance. At t= 0 the reactant flows were started at 3 sccm H2 and 1.5 sccm O2. �Data filename: MEA2-25C-constco-startup�
2
CS license or copyright; see http://www.ecsdl.org/terms_use.jsp

B839Journal of The Electrochemical Society, 154 �8� B835-B844 �2007� B839
gravity at the cathode.� Figure 6 shows the ignition of the SAPC fuelcell with counter-current flows. The fuel cell was first extinguishedby operating with dry feeds at 80°C with a load resistance of 20 �.The flows were stopped, the fuel cell cooled down to 25°C, and theload resistance set to 0.5 �. After the temperature had equilibratedat 25°C the flows were initiated: 6 sccm H2: the anode and 3 sccmO2 at the cathode. Counter-current flow produced a different ignitionpattern than co-current flow. Ignition occurred near the center of theflow channel. And, after ignition, a current front fanned out in bothdirections with the all segments igniting over a period of �100 s. Asimple visual comparison of Fig. 5 and 6 shows that ignition oc-curred over a much shorter time period with counter-current flow ascompared to co-current flow.
The difference between co-current and counter-current flow isshown in Fig. 7, which is a 3-D plot of the local current density asa function of time. Co-current reactant flow ignites the proton cur-rent at the outlet of the flow channels; after ignition the protoncurrent ignition front propagates towards the inlet of the flow chan-nel. As the proton ignition front propagates upstream, the currentdrops off in the downstream section of the flow channel. In contrast,counter-current flow shows that the proton current ignition near thecenter of the flow channel, with the proton current front fanning outfrom there.
Extinction of the proton current with co-current flow was the
Figure 7. �Color online� Proton current ignition fronts in co-current andcounter-current flow. The current in each segment �in mA� is shown as afunction of time. Time is recorded from the start of flow after cooling downthe fuel cell. The 3-D graph to the left is for co-current flows at the anodeand cathode; the one to the right is for counter-current flows at the anode andcathode.
Downloaded 17 Jun 2010 to 128.112.35.148. Redistribution subject to E
reverse of ignition. Increasing the load resistance under co-currentflow conditions resulted in proton current extinction starting at theinlet, and the proton current front extinction front propagated to theoutlet. When the load resistance was increased with counter-currentflow, the proton current extinguished from both ends, narrowing theignition band to a region in the center of the flow channel until thefuel cell proton current finally extinguishes.
Effect of gravity on current stability.— The results in Fig. 2-5were obtained with the gas flows at the anode and cathode beingco-current downward in the direction of gravity. At 25°C, sufficientwater is formed that liquid water can condense in the flow channels,especially the cathode flow channel. When the gas flow is in thesame direction as gravity, any liquid water formed in the fuel cell isswept out by the gas flow. When we performed experiments withcounter-current gas flows, shown in Fig. 6 and 7, we had the cathodeflow going downward. Because most of the liquid water productends up at the cathode, the gas flow at the cathode swept out almostall the liquid water formed. In all of the experiments conducted withgas flow downward, the steady state proton current was stable; therewas little fluctuation of the proton current, independent of the inletgas flow rates.
When the gas flow at the cathode was upward, against gravity,we saw that the stability of the proton current depended on the gasflow rates. There were no significant differences in the proton cur-rent evolution during ignition of the fuel cell from a dry state be-tween upward and downward gas flows. However, after ignition,when liquid water began to accumulate in the flow channels, theflow direction relative to gravity made an enormous difference. Fig-ure 8 shows the proton current distribution when the gas flow rateswere reduced at 19000 s from 12 sccm H2 and 6 sccm O2 to 6 sccmH2 and 3 sccm O2. The gas flow in Fig. 8 enters at segment 6 andexits at segment 1. When the gas flow at the cathode was in thedirection of gravity the proton currents became steady after�4000 s, independent of flow rate �see Fig. 4b and 5�. However,when the flow was flipped so that the cathode gas flow opposedgravity, entering at the bottom and exiting at the top of the flowchannels, the proton currents in the ignited section of the fuel cellwere stable at the higher gas flow rates and then showed large fluc-tuations at the lower gas flow rate.
Figure 8 shows that when the inlet reactant gas flow rates werereduced, the average proton currents increased in the anode seg-ments near the inlet. As the gas flow rate is reduced, water diffusion
Figure 8. �Color online� Current distribution in the SAPC fuel cell withco-current flow upward. The flows enter at segment 6 and exit at segment 1.The fuel cell temperature was 25°C; load resistance was 0.5 �. The currentsare designated by segment number. The voltage is the voltage drop across theload impedance. At t � 19000 s the flow rates were 12 sccm H2 and 6 sccmO2; at t � 19000 s the reactant flows were reduced to 6 sccm H2 and 3 sccmO2. �Data file name: MEA3-25-constco-startup12�
CS license or copyright; see http://www.ecsdl.org/terms_use.jsp

B840 Journal of The Electrochemical Society, 154 �8� B835-B844 �2007�B840
in the membrane becomes more significant relative to water convec-tion, resulting in increased membrane hydration near the inlets. Thesame phenomenon was also seen in Fig. 4b and 5 when the gas flowwas downward.
The fluctuations in the proton current seen in Fig. 8 are attributedto slugs of liquid water in the flow channels that had to be pushedagainst gravity by the gas flow. We were able to see the water slugsin the cathode flow channel in the SAPC fuel cell constructed withpolycarbonate. With the inlet oxygen flow rate of 6 sccm waterslugs formed every 10 s and were swept through the flow channel in�3 s. The liquid slugs appeared to move at the velocity of the gas,and the water slugs exited the flow channel before the next slugformed. When the gas flow rate was reduced, a second liquid waterslug was formed in the channel before the first slug exited the chan-nel. When more than a single liquid water slug was in the cathodeflow channel, it affected the oxygen concentrations upstream of theslug, causing the current to fluctuate.
With counter-current flow, either the anode or cathode gas flowwill be in the direction of gravity. When the cathode flow was in thedirection of gravity we did not see any significant current fluctua-tions and the SAPC fuel cell operation was similar to that seen withco-current flow downward. However, when the cathode flow wasupward, against gravity, we saw qualitatively similar performance tothat shown in Fig. 8. The results indicate that more liquid is accu-mulated in the cathode flow channel.
Horizontal fuel cell orientation.— The SAPC fuel cell was oper-ated with the flow channels running horizontally and with the flowsrunning co-current and the inlets at segment 1. Ignition of the fuelcell proton current follows the same sequence for co-current flowsfor both horizontal and vertical orientations. Proton current ignitionwith counter-current flows was also the same for both horizontal andvertical orientations. When the fuel cell is horizontal and liquid wa-ter slugs form, they cause the proton current to fluctuate, but thefluctuations are different than those shown in Fig. 8 for the verticalorientation. Figure 9 shows the operation of the SAPC in the hori-zontal orientation with counter-current flow. The fuel cell currentignited and after ignition the currents in each segment were approxi-mately equal for �8000 s. After 8000 s, approximately 0.4 cm3
equivalent of liquid water has formed, comparable to the volume ofthe flow channel �0.375 cm3�. Because the vapor pressure of wateris low at 25°C �0.025 bar� most of the water remains as condensedliquid in the flow channel. The liquid water forms a plug that gets
Figure 9. �Color online� SAPC operated with counter-current flows in ahorizontal configuration. The initial flow rates were 10 sccm H2 and 10 sccmO2; at t = 5500 s the load resistance was reduced from 18 to 2 �, resultingin ignition of the fuel cell current. The currents are designated by segmentnumber. The voltage is the voltage drop across the load impedance. The fuelcell temperature was 25°C. At 21000 s the flow rates were reduced to 6 sccmH2 at the anode and 3 sccm O2 at the cathode. �Data file name: retesting.xls�
Downloaded 17 Jun 2010 to 128.112.35.148. Redistribution subject to E
pushed downstream, flooding the cathode flow channel at segments4–6. As more water is formed, slugs accumulate that block part ofthe upstream flow channel causing the current to drop. As the cur-rent drops, the gas pressure builds up until it eventually pushesforward pushing a slug of water out of the flow channel. The motionof the water plug can be followed by the rise and fall of currents ineach segment as the water droplets go past. This problem was notobserved when the fuel cell was in the vertical orientation and gasflow going in the direction of gravity. When the gas flow was down-ward, the water droplets fell to the bottom of the flow channel andwere swept out of the flow channel.
Local polarization curves.— The most common characterizationof fuel cells is the current-voltage response, commonly referred to asthe polarization curve. The polarization curve is obtained by mea-suring the current through and the voltage across the external loadresistance as the load resistance is varied. In the intermediate currentrange the slope of the polarization curve is approximately equal tothe negative of the membrane-electrolyte resistance. With the SAPCfuel cell we can obtain local polarization curves associated witheach segment of the anode.
Figure 10a shows the “instantaneous” polarization curves for theSAPC fuel cell operating counter-currently. The fuel cell was equili-brated at 25°C and with flow rates of 6 sccm H2 at the anode and3 sccm O2 at the cathode and a load resistance of 0.5 �. To obtainthe “instantaneous” polarization curve the external load resistancewas swept from 0–20 � over a period of �100 s. By completingthe sweep in a short time, the water content in the fuel cell remainsnearly constant; the total water production and water removal areboth small over 100 s relative to the total water inventory in the fuel
Figure 10. �Color online� �a� “Instantaneous” polarization curve for theSAPC fuel cell after ignition. This was obtained by sweeping the externalload from 0.2 to 20 � in �100 s. This sweep was taken for the counter-current flow shown in Fig. 8 1500 s after ignition. �Data file name:retesting2.xls� �b� “Steady state” polarization curves for the SAPC fuel cell.The steady state current and voltage were obtained by stabilizing the fuel cellfor �5000 s at fixed load resistance. The load resistance was increased step-wise by 2 � over the range 2–20 �. �Data file name: retesting2.xls�
CS license or copyright; see http://www.ecsdl.org/terms_use.jsp

B841Journal of The Electrochemical Society, 154 �8� B835-B844 �2007� B841
cell. The slopes of the polarization curves match our intuitive as-sumptions about the water content in the membrane; the lowest re-sistances are in segments 3, 4, and 2, near the center of the flowchannel, while the resistances are higher at the inlets because ofdrying from the feed streams. The resistances vary from 1.5 � insegment 3 to 2.8 � in segment 6.
Figure 10b shows the “steady state” polarization curves for theSAPC fuel cell operating autohumidified with counter-current flowsat 25°C and with flow rates of 8 sccm H2 at the anode and 4 sccmO2 at the cathode. Starting with a load resistance of 2 �, the currentand voltage were recorded as a function of time. The resistance wasincreased by 2 � every 2 h, and we plotted the steady state currentand voltage after 2 h. The most obvious difference between the in-stantaneous and steady state polarization curves is that at low cur-rents the voltage on the steady state polarization curves drop as thefuel cell membrane dehydrates. From Fig. 10b, we can identify thecritical load resistance of 6 � for autohumidified operation at thespecified conditions of temperature, flow rate, and flow configura-tion. At lower loads the fuel cell will sustain autohumidified opera-tion indefinitely. At loads �6 � the fuel cell current will begin toextinguish as water removal by convection exceeds water produc-tion.
Discussion
We previously reported the existence of ignition/extinction phe-nomena in an STR PEM fuel cell.17,24,25 The fuel cell current ignitedwhen the water production in the fuel cell exceeded the water re-moved by convection. Current ignition in a PEM fuel cell resultsfrom the positive feedback between the membrane resistivity andthe water produced in the fuel cell. The membrane resistivity de-creases exponentially with increasing water activity,28 consequentlythe water production increases exponentially with water activity�aw�, while the water removal increases linearly with water activity.This gives rise to steady state multiplicity and critical water activityfor current ignition. This is analogous to thermal ignition in an STRwith an exothermic reaction.29-31 The critical water activity for ig-nition is analogous to the critical temperature for ignition with anexothermic reaction in an STR.
In this paper, we have shown how the concepts of ignition andextinction can be extended to spatio-temporal reaction front propa-gation which is controlled by flow rate, temperature and load resis-tance. Qualitatively, we can describe how these parameters controlignition.
Increasing the flow rate dilutes the concentration of water in thegas streams, reducing the total amount of water that is absorbed intothe membrane. Only at low flow rates, when the gas streams aresufficiently humidified by the water formed upstream, will the fuelcell ignite.
Increasing the temperature increases the vapor pressure of water.For the same amount of water formed, less water is retained in themembrane at higher temperature; this dries out the membrane andextinguishes the fuel cell.
Increasing the load resistance reduces the current through thefuel cell circuit and, hence, decreases the water production. Withless water formed, the water activity decreases and, hence, the fuelcell extinguishes.
The STR is a one-dimensional reactor, with the gradients onlytransverse across the membrane. Larger area PEM fuel cells mustdistribute the reactants over a large area, generally involving com-plex flow channel arrangements.5,8,21 The gas distribution systemwill result in lateral gradients of water concentration and variationsin gas velocity.22,32 The SAPC is the simplest two-dimensional fuelcell system we can envision; it permits the study of lateral gradientsand transport on fuel cell performance in a simple and well-definedgeometry.
The SAPC fuel cell offers significant advantages to conventionalPEM fuel cells for the study of fuel cell dynamics. There have beenseveral numerical studies to predict dynamics of the current distri-butions in PEM fuel cells.33-36 These models have made predictions
Downloaded 17 Jun 2010 to 128.112.35.148. Redistribution subject to E
about the role of in-plane water diffusion in affecting the local cur-rent distributions in PEM fuel cells. These models and others havenot had direct verification because there have been no reports of thedynamics of current distributions in PEM fuel cells. The resultspresented here are the first experimental results showing the tempo-ral evolution of the current distribution in a 2-D fuel cell.
Ignition and extinction front propagation can be understood byconsidering the connection between the local water content in themembrane and the local current density �which is proportional towater production�, water convection by gas flow in the flow chan-nels and water diffusion in the membrane. When the flows are co-current, ignition occurs at the outlet of the flow channels because thewater produced in the fuel cell is convected downstream and accu-mulates fastest at the outlet. Provided that the temperature and flowrates are sufficiently low, the water can accumulate until the resis-tance in the membrane drops sufficiently for the current to ignite.After ignition, the water concentration increases in the downstreamsections of the membrane, which drives water diffusion upstreamthrough the membrane. The movement of the current ignition frontresults from a balance between the water transport downstream byconvection in the flow channel and water transport upstream bydiffusion in the membrane. Reducing the flow rates in the flow chan-nel will cause the front to propagate even further upstream, as seenin comparing Fig. 4b and 5.
Extinction of co-current flow is a result of the drying of themembrane by convection, when the current is too low to sustain thewater in the membrane. Drying is enhanced at higher temperature,higher load resistance, and higher flow rates. Drying proceeds fromthe inlet toward the outlet as water evaporates from the membraneinto the gas flowing in the flow channels.
Counter-current flow produces a different ignition pattern thanco-current flow because water is convected in opposite directions inthe anode and cathode flow channels. This results in water accumu-lating fastest at an interior position along the flow channel, a loca-tion determined by the relative flow rates at the anode and cathode.When the flow rates were nearly equal, we saw that the ignition wasclose to the center of the cell. Altering the flow rates pushes theignition point downstream in the direction of the higher flow. Thefanning of the ignition front in counter-current flow results fromwater diffusion in the membrane in both directions away from thehighest concentration, the ignition point.
The qualitative experimental trends of the sequence of currentignition and extinction along the length of the flow channel followour expectations. However, the steady state current profiles were notidentical to what we expected. The steady state current profiles wereaffected by nonuniformities in the membrane electrode assemblycaused by variations in compression. These variations altered thelocal resistances associated with the segmented electrode. We sus-pect that unitary assembly of commercial MEAs would show betteruniformity than we report here. Our concern here is to identify thegeneric fuel cell pathology that will be exhibited by PEM fuel cells,and we want to focus on that generic behavior.
We can get a semiquantitative match to the ignition/extinctionbehavior in the segmented anode parallel channel fuel cell with arelatively simple model. Our STR model can be extended to a“tanks-in-series” model, treating each segment of the anode as adifferential reactor.37-39 The dynamic time scales for the ignition andfront propagation are dictated by water sorption in the membrane,the convective flow rates in the anode and cathode channels, and thediffusion rate of water in the membrane.
Water sorbs into the polymer, ionizing sulfonic acid groups fa-cilitating proton transport; water sorption scales with the number ofsulfonic acid groups in the membrane and the proton conductivitydepends on the sulfonic acid density �NSO3� and the number ofwater molecules hydrating each sulfonic acid ���. Water is sorbedinto the membrane when the water activity in the gas flow channelsis greater than the water activity in the membrane, and water desorbswhen the water activity is greater in the membrane. We make thesimplifying assumption that the water activity in the membrane is in
CS license or copyright; see http://www.ecsdl.org/terms_use.jsp

B842 Journal of The Electrochemical Society, 154 �8� B835-B844 �2007�B842
local equilibrium with the water activity in the gas flow channels,and the only gradients are longitudinal along the channel. With theSTR PEM fuel cell, we found that water activity in the anode andcathode gas flow channels are nearly equilibrated with the mem-brane for current densities �1 A/cm2.18,25
The water balance in each differential element of the membraneis given by Eq. 1 �j = 1–6; j = 0 is the feed and because watercannot diffuse from outside the fuel cell aw7 = 0�. The water inven-tory is the balance between water produced �one-half the protoncurrent�, water convected in the gas flow, and longitudinal waterdiffusion �described by a lumped mass transfer coefficient betweendifferential elements�. The water inventory includes water in themembrane and water vapor in the flow channels; in general, thewater vapor in the flow channels is much less than water sorbed inthe membrane, in which case the second term on the left hand sideof Eq. 1 can be ignored. Equation 2 is an empirical fit to the numberof water molecules associated with each sulfonic acid group as afunction of water activity in a Nafion 115 membrane28,39
�NSO3
d��j�
daw�j�+
�VA + VC�Pwo
RT�daw�j�
dt=
i�j�
2F+ �FA�j−1�
+ FC�j−1��aw�j−1�Pw
o
PT− �FA�j� + FC�j��
aw�j�Pwo
PT+ km�aw�j−1�
+ aw�j+1� − 2aw�j�� �1�
��j� = 14.9aw�j� − 44.7aw�j�2 + 70aw�j�
3 − 26.5aw�j�4
+ 0.446aw�j�5 mol water � mol SO3 �2�
The total gas pressure is fixed and the local water activity in themembrane is assumed to be in equilibrium with the local gas phases,i.e., aw�j�Pw
o = Pw�j� and PH2�j� = PO2�j� = PT − Pw�j�. The molarflow rates change along the flow channel as water is formed andreactants are consumed; the molar flows are given by FA�j�= FA�j−1� − i�j�/4F and FC�j� = FC�j−1�. Finally, we assume the localpotential between the anode and cathode is the thermodynamic po-tential as given in Eq. 3, where Po is the standard state pressure �1bar� for hydrogen and oxygen. �The thermodynamic potential as-sumption neglects interfacial potential drops due to finite reactionrates, resulting in the predicted currents being about 20% larger thanthose found in real fuel cells.�
VFC�j� = 1.23 +RT
4Fln��PH2�j� � Po�2�PO2�j� � Po�
�aw�j��2 Volt �3�
Based on the equivalent electrical circuit, the differential ele-ments that are in series for gas flow are electrically connected inparallel to each other. The voltage across the external load resistancethus depends on the total current produced by all elements; the localcurrent is given by Eq. 4. The local membrane resistance, RM�j�,depends on the local water content in the membrane and the area ofthe differential element; the area of the membrane element wastaken to be one-sixth the total membrane area of total MEA area of1.2 cm2. For a Nafion 115 membrane employed in the SAPC fuelcell the membrane resistance as a function of water activity is givenby Eq. 5
i�j� =
VFC�j� − RLk�j
i�k�
RL + RM�j��4�
RM�j� =�5 � 105 exp�− 14aw�j�
0.2 �� − cm2�
�membrane area� � 6�5�
Ignition occurs when the local production of water in the fuelcell exceeds the water removed by convection. Water productiondepends on the load resistance and the membrane resistance. A dry
Downloaded 17 Jun 2010 to 128.112.35.148. Redistribution subject to E
membrane has a resistance of 500 k�-cm2, limiting the current den-sity to a maximum of 2.4 �A/cm2 � j = 1.2 V/R�; at 80°C the feedflow rates would have to be �10−3 cm3/min to ignite the fuel cell.Absorption of 10 �L/cm2, of water into the membrane reduces itsresistance to �10 �-cm2, increasing the maximum current densityto 100 mA/cm2. For gas flow rates of �10 cm3/min, this current issufficient for the fuel cell current to ignite at temperatures 50°C,as shown in Fig. 2.
The key elements that account for ignition are an exponentialincrease of proton conductivity in the PEM with membrane watercontent and the dynamics of water uptake into the PEM. The loca-tion of ignition and front propagation are consequences of convec-tion of water produced downstream where it can accumulate anddiffusion of water upstream through the polymer membrane. Thesimple model can capture the current ignition and current frontpropagation, though the model predicts larger currents than we ob-served experimentally. Figure 11 shows the model prediction of theignition front propagation for co-current and counter-current flowsand can be compared to the experimental data shown in Fig. 7. Thetime scales are approximately correct and the current densities arewithin 25% of the experimental values. The performance of thissimple model is satisfactory.
The model is only semiquantitative; it neglects finite mass trans-fer rates of water into the membrane and from the membrane intothe gas phase at the anode and cathode. The model also neglects theeffects of liquid water on hindering gas transport from the flowchannels to the membrane/electrode interface. More complex mod-els that incorporate these effects can give quantitative fits to theexperimental results, but do not alter the basic physics.
Figure 11. �Color online� Simple model fit to the current ignition and frontpropagation in the segmented anode parallel channel fuel cell. The modelgives a good semiquantitative account of current ignition. �a� Co-currentflow. �b� Counter-current flow. Simulated conditions: 5 sccm feed flow ratesof H2 at both anode and O2 at the cathode, 50°C, 5 � load resistance.
CS license or copyright; see http://www.ecsdl.org/terms_use.jsp

B843Journal of The Electrochemical Society, 154 �8� B835-B844 �2007� B843
For co-current flow, the water produced upstream is conductedtoward the outlet, where it slowly accumulates in the membrane.When the water content increases to the point where the local mem-brane resistance becomes comparable to the external load resistancethe current increases rapidly, hydrating the membrane and causingignition at the outlet of the flow channel. Water is also transportedupstream through diffusion in the membrane itself, causing upstreampropagation of the current ignition. The model did not capture thedecreases in the downstream current after the ignition propagated tothe inlet of the fuel cell. We attribute the decrease in downstreamproton current after ignition to liquid water accumulating in thecathode, inhibiting oxygen transfer to the catalyst and reducing thecurrent. A more complicated model that includes two phase flow ofwater liquid and vapor would be necessary to simulate these phe-nomena.
The two stage ignition with a current pulse at short times whenthe reactants first arrived at the membrane/electrode interface wasnot captured in the model. There are other complexities in the ex-periment that the model does not capture. The rise in current in thedownstream segments before extinction, and the negative currents inthe central segments are not predicted at all by the model. Thesephenomena result from electrical communication between segmentsthat we ignored. For example, the negative currents shown in theextinction data in Fig. 3 suggest that there are potential differencesbetween segments 4, 5, and 6 that drive local currents where hydro-gen is oxidized at the electrode on segments 5 and 6, and the protonsmove through the membrane to segment 4 where they are reduced tohydrogen.
Liquid water was observed leaving the flow channels 30–40 minafter ignition. Ignition takes the fuel cell from very low water activ-ity to water activity close to unity, followed by accumulation ofwater and, eventually, condensation of liquid water in the flow chan-nels. Gravity plays a key role in how such liquid water movesthrough the flow channels; the operation changes dramatically if gasflow in the channel is counter to gravity driven liquid water flow.When the fuel cell was vertical, gravity caused the liquid to drainand permitted good access for the reactants from the flow channelsto the electrode/electrolyte interface. We observed that when the fuelcell was positioned so that liquid water could freely drain undergravity, the steady state fuel cell operation was stable. However,when the fuel cell was oriented so that the gas flow needed to pushliquid water against gravity, there were large fluctuations in the localcurrent density, which appeared to show some correlation with waterdroplets exiting from the fuel cell. In the horizontal orientation,liquid water condensing in the flow channels could partially blockflow, and this hindered the reactants from getting to the electrode/electrolyte interface. The liquid drops were pushed along the flowchannels by the flowing gas, but in an irregular fashion, that gaverise to large fluctuations in the local current density. Transport ofliquid water in the flow channels is not accounted for at our level ofmodeling. We examined many published models for PEM fuel cellsand we found none that considered the effects of gravity on the twophase flow in PEM fuel cells.1,3,10,12,22,32,40-44 The role of gravity ontwo-phase flow in PEM fuel cells could play an essential role in thecontrol for PEM fuel cells systems.
Conclusions
Current ignition in PEM fuel cells is analogous to thermal igni-tion with exothermic reactions. The proton conductivity dependsexponentially on the water content in the membrane, similar to theArrhenius exponential dependence of the reaction rate constant ontemperature. When the PEM fuel cell is operated autohumidified,current ignition results from a balance between water productionand water removal; positive feedback between water produced andthe proton conductivity in the polymer membrane ignites the cur-rent. Current ignition in the two dimensional gas flow channel givesrise to spatio-temporal current density fronts that propagate. Thecurrent density fronts are analogous to flame fronts, but result fromnonlinear dynamics due to water concentration.
Downloaded 17 Jun 2010 to 128.112.35.148. Redistribution subject to E
We introduced a model fuel cell reactor with a segmented anodeand parallel flow channels. This model reactor permitted the mea-surement of local currents along the length of the flow channel.Current ignition and extinction were followed as functions of reactortemperature, feed flow rates, flow configuration, and load resistance.Co-current flow of the hydrogen at the anode and oxygen at thecathode ignited the current at the outlet from the flow channel; afterignition a current density front propagated toward the inlet due towater diffusion in the membrane. Counter-current hydrogen andoxygen flow resulted in current ignition toward the center of theflow channel with the current fanning out toward both ends. The keyphysical features of the ignition and front propagation can be cap-tured with a relatively simple “tanks-in-series” model of the SAPCfuel cell reactor.
The orientation of the reactant gas flows relative to gravity playsa key role in the long-term stability of the fuel cell operation. Whenthe reactant flows are assisted by gravity in draining liquid waterfrom the flow channels, the currents are stable. When the fuel cell isoriented so the liquid water must be pushed from the flow channelby gas flow against gravity, the local current densities fluctuate. Thecurrent density fluctuations appear periodic, where the period is�1 s for vertically oriented fuel cells and �104 s for horizontallyoriented fuel cells.
Acknowledgments
We thank the National Science Foundation �CTS-0354279 andDMR-0213707� for support of this work. J.E.C. and E.K. also thankthe Princeton University Program in Plasma Science and Technol-ogy for partial support under U.S. Department of Energy contractno. DE-AC02-76-CHO-3073.
Princeton University assisted in meeting the publication costs of thisarticle.
List of Symbols
aw�j� water activity in reactor element jF Faraday’s constant �96,458 c/mol�
FA�j� molar flow rate in anode flow channel at differential element jFC�j� molar flow rate in cathode flow channel at differential element j
i�j� current in reactor element jkm mass transport coefficient for diffusive water transport between
differential elementsNSO3 sulfonic acid density �1.8 � 10−3/cm2�
Pwo water vapor pressure at reactor temperature T
PO2�j� partial pressure of oxygen in cathode flow channel element jPH2�j� partial pressure of hydrogen in anode flow channel element jPw�j� partial pressure of water in element j
PT total pressure in the gas flow channelsR gas constant
RL external load resistanceRM�j� membrane resistance in element jRsense sensing resistor for current measurements
T fuel cell reactor temperatureVA volume of anode flow channel in a differential element of the
reactorVC volume of cathode flow channel in a differential element of the
reactorVFC�j� battery voltage in differential element j
��j� number of water molecules per sulfonic acid residue in themembrane
References1. T. Thampan, S. Malhotra, J. X. Zhang, and R. Datta, Catal. Today, 67, 15 �2001�.2. T. D. Gierke, G. E. Munn, and F. C. Wilson, ACS Symp. Ser., 180, 195 �1982�.3. A. Z. Weber and J. Newman, Chem. Rev. (Washington, D.C.), 104, 4679 �2004�.4. K. A. Mauritz and R. B. Moore, Chem. Rev. (Washington, D.C.), 104, 4535 �2004�.5. F. Barbir, PEM Fuel Cells: Theory and Practice, Elsevier Academic Press, Burl-
ington, MA �2005�.6. Fuel Cell Systems, L. Blomen and M. Mugerwa, Editors, Plenum, New York
�1993�.7. R. O’Hayre and F. B. Prinz, J. Electrochem. Soc., 151, A756 �2004�.8. J. Larminie and A. Dicks, Fuel Cell Systems Explained, 2nd ed., Wiley, New York
�2003�.9. http://www.ballard.com/be_a_customer/transportation/fuel_cell_modules/
mark_902#
CS license or copyright; see http://www.ecsdl.org/terms_use.jsp
B844 Journal of The Electrochemical Society, 154 �8� B835-B844 �2007�B844
10. C. Y. Wang, Chem. Rev. (Washington, D.C.), 104, 4727 �2004�.11. D. M. Bernardi and M. W. Verbrugge, AIChE J., 37, 1151 �1991�.12. D. M. Bernardi and M. W. Verbrugge, J. Electrochem. Soc., 139, 2477 �1992�.13. D. Natarajan and T. A. Van Nguyen, J. Electrochem. Soc., 148, A1324 �2001�.14. A. Su, Y. C. Chiu, and F. B. Weng, Int. J. Energy Res., 29, 409 �2005�.15. S. Dutta, S. Shimpalee, and J. W. Van Zee, Int. J. Heat Mass Transfer, 44, 2029
�2001�.16. S. Shimpalee, S. Greenway, D. Spuckler, and J. W. Van Zee, J. Power Sources,
135, 79 �2004�.17. J. Benziger, E. Chia, E. Karnas, J. Moxley, C. Teuscher, and I. G. Kevrekidis,
AIChE J., 50, 1889 �2004�.18. J. Benziger, E. Chia, J. F. Moxley, and I. G. Kevrekidis, Chem. Eng. Sci., 60, 1743
�2005�.19. H. A. Gasteiger and M. F. Mathias, Paper presented at Advances in Materials for
Proton Exchange Membrane Fuel Cell Systems, ACS, Feb 23–27, 2003.20. Fuel Cell Handbook, U.S. Department of Energy, Morgantown, WV �2000�.21. Handbook of Fuel Cells, W. Vielstich, A. Lamb, and H. Gasteiger, Editors, Wiley,
New York �2003�.22. W. K. Lee, S. Shimpalee, and J. W. Van Zee, J. Electrochem. Soc., 150, A341
�2003�.23. I. D. Raistrick, U.S. Pat. 4,876,115 �1989�.24. J. F. Moxley, S. Tulyani, and J. B. Benziger, Chem. Eng. Sci., 58, 4705 �2003�.25. W. H. J. Hogarth and J. B. Benziger, J. Electrochem. Soc., 153, A2139 �2006�.26. F. N. Buchi and S. Srinivasan, J. Electrochem. Soc., 144, 2767 �1997�.
Downloaded 17 Jun 2010 to 128.112.35.148. Redistribution subject to E
27. W. H. J. Hogarth and J. B. Benziger, J. Power Sources, 159, 968 �2006�.28. C. Yang, S. Srinivasan, A. B. Bocarsly, S. Tulyani, and J. B. Benziger, J. Membr.
Sci., 237, 145 �2004�.29. H. S. Fogler, Elements of Chemical Reaction Engineering, Prentice Hall, Upper
Saddle River, NJ �1999�.30. C. van Heerden, Ind. Eng. Chem., 45, 1242 �1953�.31. D. Luss, Ind. Eng. Chem. Res., 36, 2931 �1997�.32. S. Dutta, S. Shimpalee, and J. W. Van Zee, J. Appl. Electrochem., 30, 135 �2000�.33. I. Nazarov and K. Promislow, Chem. Eng. Sci., 61, 3198 �2006�.34. P. Berg, K. Promislow, J. St Pierre, J. Stumper, and B. Wetton, J. Electrochem.
Soc., 151, A341 �2004�.35. P. Berg, K. Promislow, J. Stumper, and B. Wetton, Chem. Eng. Sci., 2, 111 �2005�.36. R. Bradean and A. Desousa, Paper 995, presented at the Meeting of The Electro-
chemical Society, Los Angeles, CA, Oct. 16–21, 2005.37. K. H. Choi, D. H. Peck, C. S. Kim, D. R. Shin, and T. H. Lee, J. Power Sources,
86, 197 �2000�.38. E. S. J. Chia, J. B. Benziger, and I. G. Kevrekidis, AIChE J., 50, 2320 �2004�.39. J.-S. Chia, I. G. Kevrekidis, and J. B. Benziger, AIChE J., 52, 3902 �2006�.40. T. Berning and N. Djilali, J. Electrochem. Soc., 150, A1589 �2003�.41. T. Berning, D. M. Lu, and N. Djilali, J. Power Sources, 106, 284 �2002�.42. V. Gurau, L. Hongtan, and S. Kakac, AIChE J., 44, 2410 �1998�.43. I. M. Hsing and P. Futerko, Chem. Eng. Sci., 55, 4209 �2000�.44. D. Natarajan and T. Van Nguyen, J. Power Sources, 115, 66 �2003�.
CS license or copyright; see http://www.ecsdl.org/terms_use.jsp