Re Seng Covers
19
Ref. No.RE/1, Version 1.0 'Proven + Probable' Probability that the reserve is at least as large as indicated. 'Proven + Proable + Possible' 0.5 0.1 0 Recoverable Reserve 47/7 A4 A2 47/8-1 47/8-2 47/2 47/3 47/8 A3 A6 A5 x x x GwC GwC 9550 9500 9500 9500 9600 9450 9400 9350 9300 9250 9200 9100 9150 9350 9300 9250 9200 8 8 8 Platform A Completed Producers Proposed Well Locations Abandoned Wells C.I. = 50ft. 8 8 8 8 8 B 8 8 8 A A A A A 1 Introduction To Reservoir Engineering 1
description
HW reserv
Transcript of Re Seng Covers

Ref. No. RE/1, Version 1.0
'Proven'
'Proven + Probable'
Pro
babi
lity
that
the
rese
rve
is a
t lea
stas
larg
e as
indi
cate
d.
'Proven + Proable+ Possible'
1.0
0.9
0.5
0.1
0Recoverable Reserve
47/7 A4
A2
47/8-1
47/8-2
47/2 47/3
47/8
A3
A6
A5x
x
x
Gw
C
GwC
95509500
95009500
9600
9450940093509300
9250
9200
9100
91509350
9300
9250
9200
8
88
Platform A
Completed Producers
Proposed Well Locations
Abandoned Wells
C.I. = 50ft.
88
888
B
88
8 A
AA
A
A
1Introduction To Reservoir Engineering1

Ref. No. RE/1, Version 1.0
22Reservoir Pressures and Temperatures
4000
8100
8200
8300
8400
8500
8600
8700
8800
2500
2550
2600
2650
Layer 4
Layer 1
Layer 2
Layer 3
Layer 5
2500 3000 3500
14 16 18 20 22 24 26
True
ver
tical
sub
sea
dept
h -
met
res
True
ver
tical
sub
sea
dept
h -
feet
Reservoir pressure - MPa
Reservoir pressure - psig
Perforations Originalpressuregradient
Top paleocene
Gr%0 100
Sw%100 0
θ%0 50
4
21
3
5
Note: Water gradient lines drawn through known or projected oil/water contacts
Alwyn
Lyell
NinianOWC
HeatherOWC
CormorantOWC
S.W> Ninian
N.W. Alwyn
Thistle OWC
Brent OWC
Statfjord OWC
5000 6000 7000 8000 9000 10,000
13,000
12,000
11,000
10,000
9,000
8,000
Pressure, psig
Sub
sea
Dep
th (
Fee
t)

Ref. No. RE/1, Version 1.0
33Reservoir Fluids Composition
Reservoir Fluid Gas at Surface Conditions
Oil at Surface Conditions
C1 C2 C3 C4 C5 C6 C7+
The relative amounts of C1 - C7+ are afunction of :
Temperature, Pressure, Composition (particularly at high temperature)

Ref. No. RE/1, Version 1.0
Bubble
Poin
t Lin
e
Dew Point Line
% Liq.
100
75
50
25
510
0
Pre
ssur
e
Temperature
Liquid
Gas
1
2
3
Cricondenbar
Cric
onde
nthe
rm
Region of retrograde condensation
44Phase Behaviour of Hydrocarbon Systems
0
1000
2000
3000
4000
5000
6000
0 -100 0 100 200 300 400 500 600 700
Temperature º F
Pre
ssur
e Lb
s. (
psia
)
M
etha
ne
Ethane
PropaneN-Butane
N- Pentane
N-HexaneN-Heptane
N-Decane
Two Phases
Single Phase
Ref. No. RE/1, Version 1.0
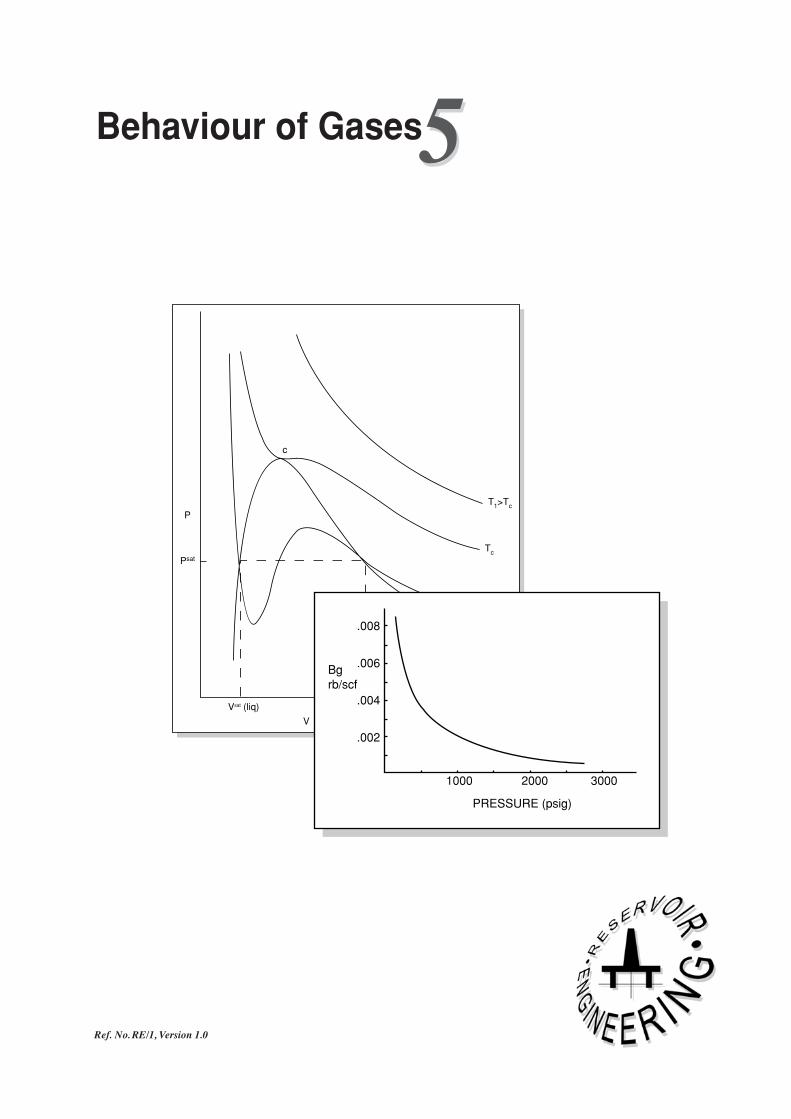
55Behaviour of Gases
Vsat (liq) Vsat (vap)
V
P
Psat
c
T1>Tc
Tc
T2<Tc
.008
.006
.004
.002
1000 2000 3000
Bgrb/scf
PRESSURE (psig)
Ref. No. RE/1, Version 1.0
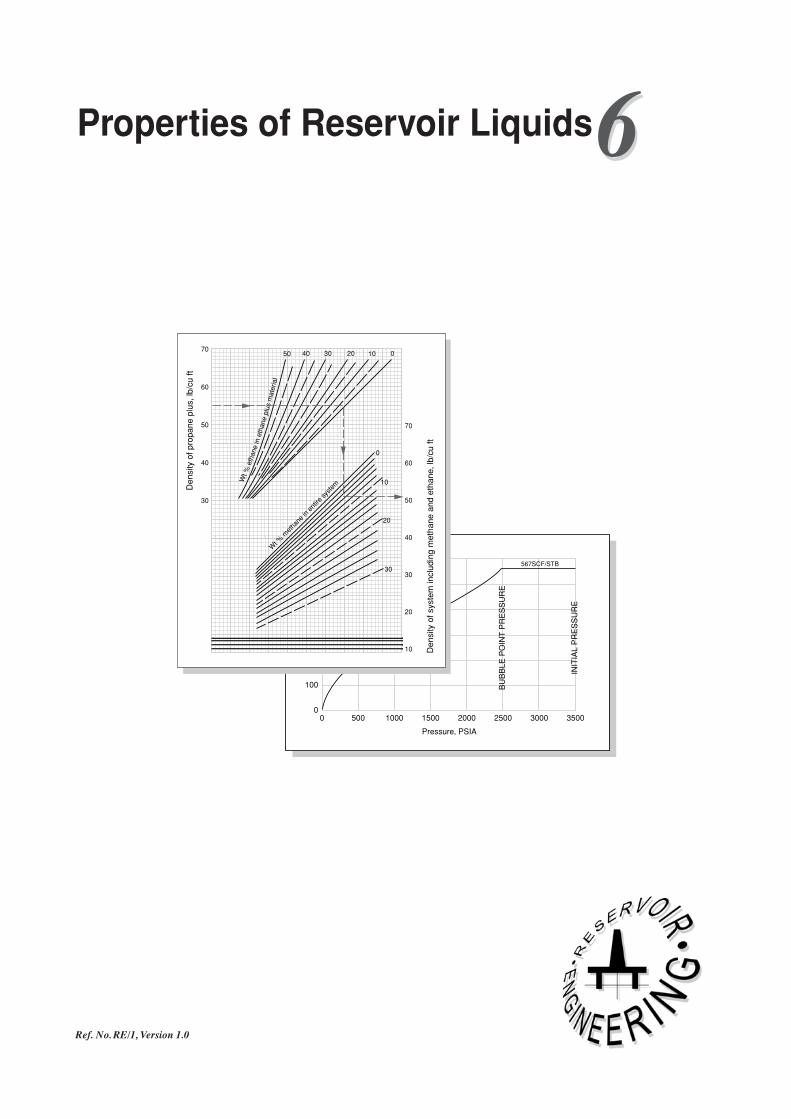
6Properties of Reservoir Liquids6
567SCF/STB
AT 1200 PSIARS = 337
BU
BB
LE P
OIN
T P
RE
SS
UR
E
INIT
IAL
PR
ES
SU
RE
Sol
utio
n G
as, S
CF
/ST
B
600
500
400
300
200
100
00 500 1000 1500 2000
Pressure, PSIA
2500 3000 3500
70
60
50
40
30
10
20
30
40
50
60
70D
ensi
ty o
f sys
tem
incl
udin
g m
etha
ne a
nd e
than
e, lb
/cu
ft
Den
sity
of p
ropa
ne p
lus,
lb/c
u ft
Wt %
etha
nein
etha
nepl
usm
ater
ial
01020304050
Wt %
met
hane
inen
tire
syste
m
0
10
20
30

Ref. No. RE/1, Version 1.0
77Fundamental Properties of Reservoir Rocks
100
80
0 5
Reciprocal Mean Pressure: (Atm.)
Ga
s P
erm
ea
bili
ty:
Mill
ida
rcie
s
60
40
20
01 2 3 4
Hydrogen
Nitrogen
Carbon Dioxide
Liquid permeability
Whole core
Core plugfor horizontal k measurement
4 Inch
Formation
Core plugfor vertical k measurement
Ref. No. RE/1, Version 1.0
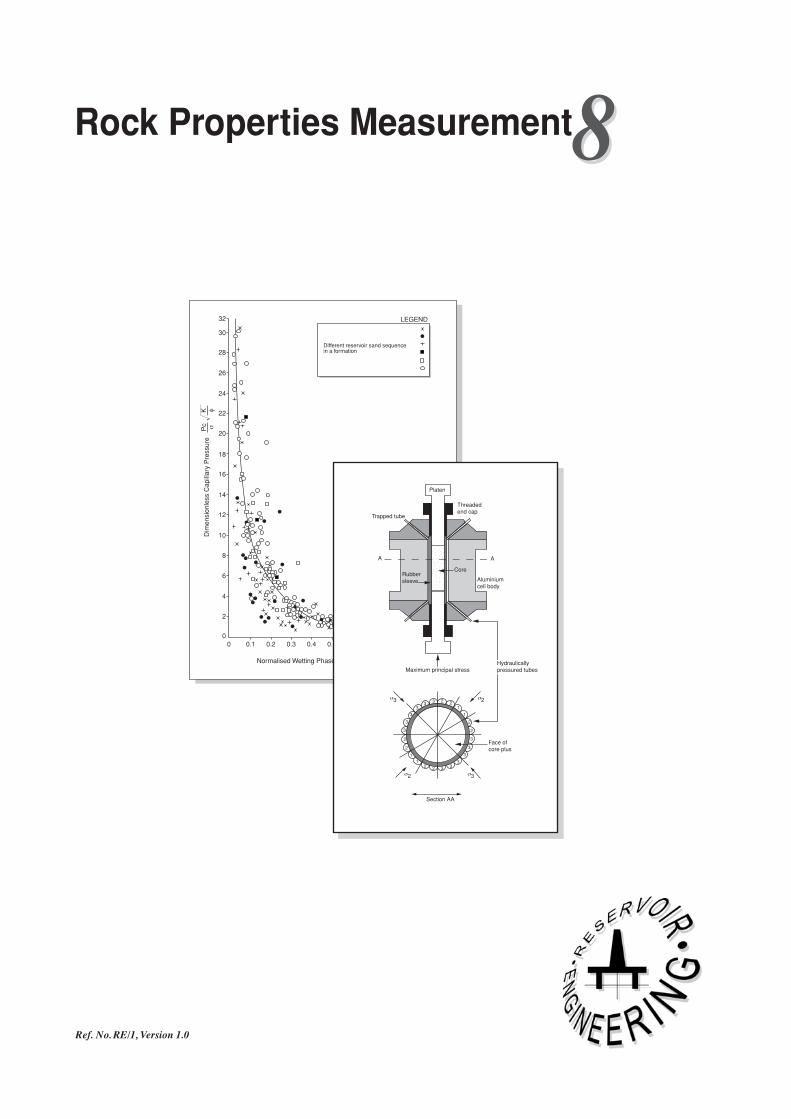
88Rock Properties Measurement
0 0.1
2
0
4
6
8
10
12
14
16
18
20
22
24
26
28
30
32
0.2 0.3 0.4 0.5 0.6 0.7 0.8 0.9 1.0
Normalised Wetting Phase Saturation Sw* ( (Sw-Swc1-Swc
=
Dim
ensi
onle
ss C
apill
ary
Pre
ssur
eP
cK
σφ
LEGEND
Different reservoir sand sequence in a formation
Platen
Threadedend cap
Trapped tube
CoreRubbersleeve Aluminium
cell body
Maximum principal stress
σ2
σ2 σ3
σ3
1
23
332
2 2
2
2
2
2
11
1
3
3
3
3
3
3
33 3
AA
Section AA
Hydraulicallypressured tubes
Face ofcore plus

Ref. No. RE/1, Version 1.0
99Permeability - Its Variations
Reservoir
InjectionPump
Separation
Limited flaringRe-inject
qwi
Seawaterfor injection
Sea Level
Sea Bed
qo + qwpqwp
Purify /Dump /inject
Gas
qo sales
Normal log scale
Permeability (mD)
Log (Permeability mD)10 20 30 40
20
40
60
80
20
40
60
80
1000 2000 3000 4000 5000
Linear scale
Thickness (ft)
Thickness (ft)
Permeability Distributions
Ref. No. RE/1, Version 1.0
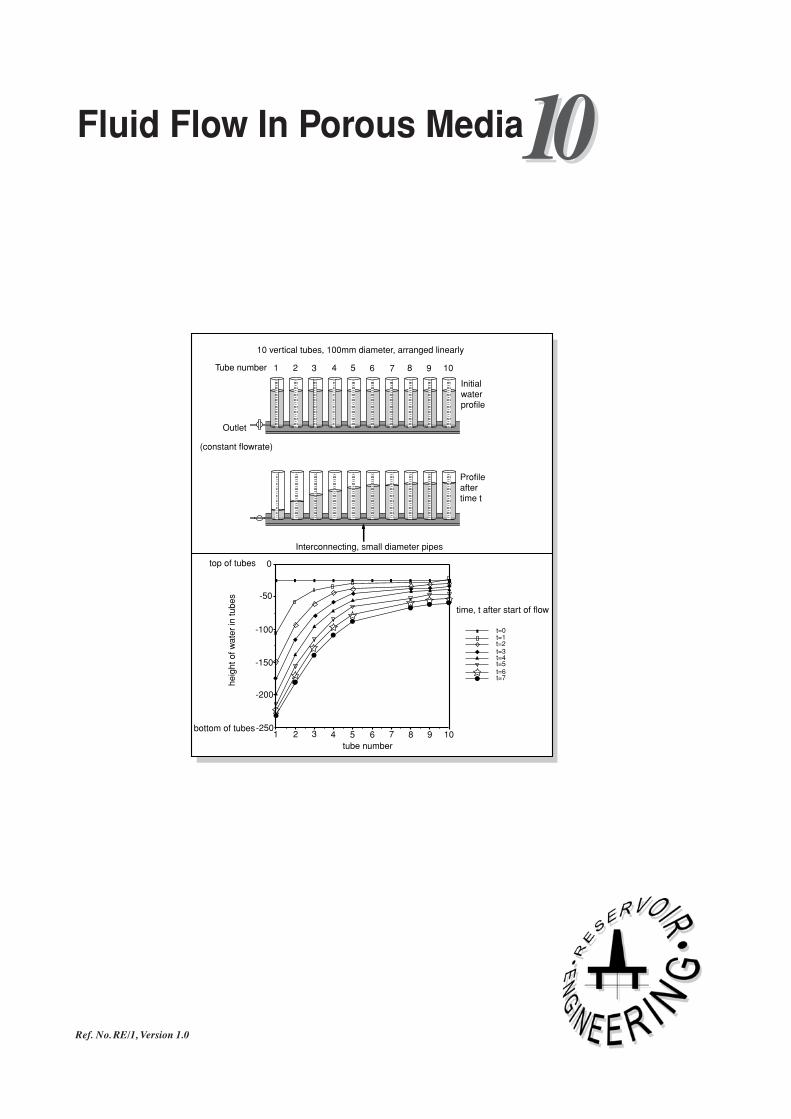
1010Fluid Flow In Porous Media
1 2 3 4 5 6 7 8 9 10
Outlet
(constant flowrate)
Initialwaterprofile
Profileaftertime t
Tube number
Interconnecting, small diameter pipes
10 vertical tubes, 100mm diameter, arranged linearly
time, t after start of flow
top of tubes 0
-50
-100
-150
-200
-2501 2 3 4 5 6 7 8 9 10
tube number
bottom of tubes
heig
ht o
f wat
er in
tube
s
t=0t=1t=2t=3t=4t=5t=6t=7
Ref. No. RE/1, Version 1.0
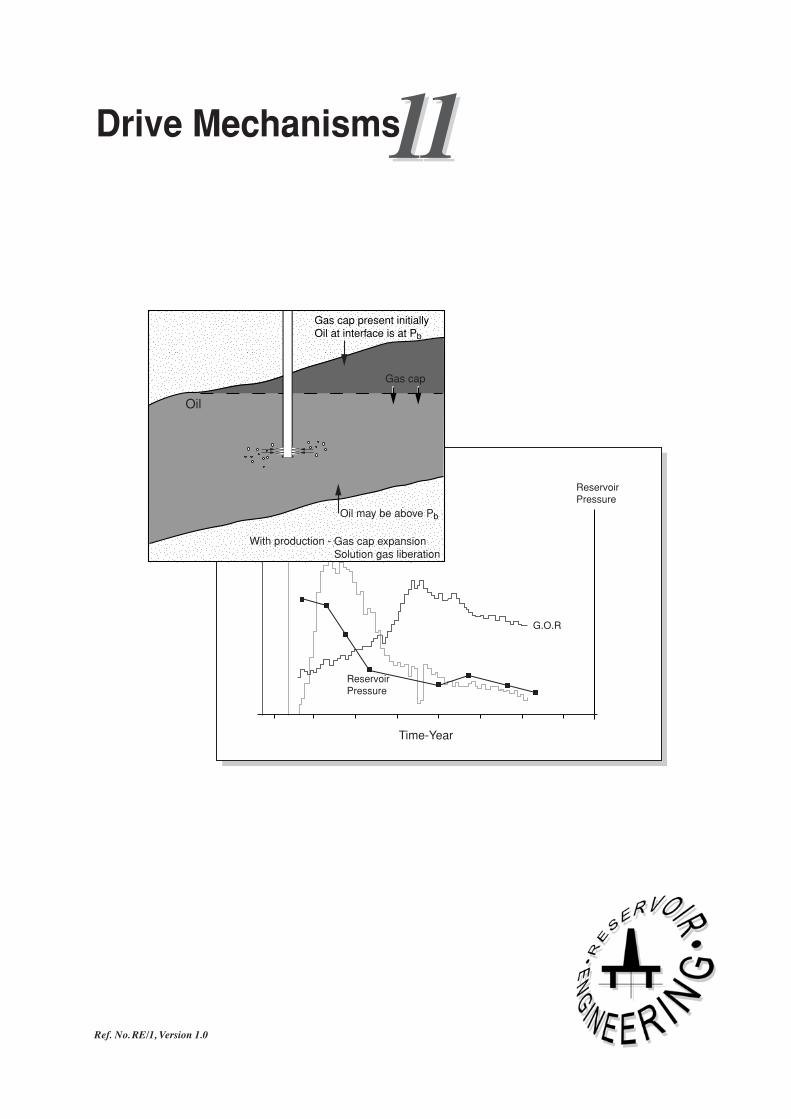
1111Drive Mechanisms
Time-Year
ReservoirPressure
ReservoirPressure
OilProd
OilProd
G.O.R
G.O.R
Gas cap
Gas cap expansionSolution gas liberation
With production -
Oil may be above Pb
Gas cap present initiallyOil at interface is at Pb
Oil
Ref. No. RE/1, Version 1.0
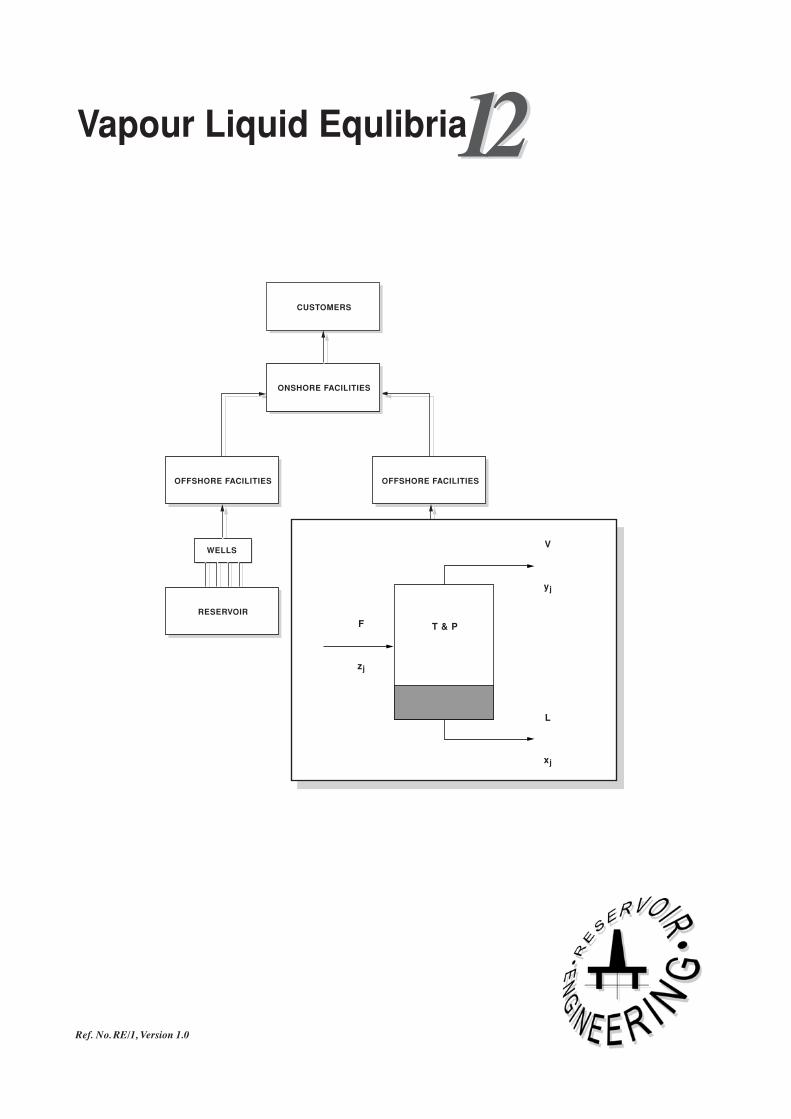
1212Vapour Liquid Equlibria
CUSTOMERS
ONSHORE FACILITIES
OFFSHORE FACILITIESOFFSHORE FACILITIES
RESERVOIRRESERVOIR
WELLS WELLS
T & PF
zj
V
yj
L
xj

Ref. No. RE/1, Version 1.0
1313Equilibrium Ratio Prediction and Calculation
500400300250200
10080
604020
0-20-40
-60
Temperature °F
10 30 50 100 300 500 1,000 3,000 10,0002 4 6 7 8 9 2 4 6 7 8 9 2 4 6 7 8 9
10 30 50 100 300 500 1,000 3,000 10,0002 4 6 7 8 9 2 4 6 7 8 9 2 4 6 7 8 9 1,0009876
5
4
3
2
1009876
5
4
3
2
109876
5
4
3
2
1.09876
5
4
3
2
0.19876
5
4
3
2
1,0009876
5
4
3
2
1009876
5
4
3
2
109876
5
4
3
2
1.09876
5
4
3
2
0.19876
5
4
3
2
Pressure, PSIA
Pressure, PSIA
K= y/x K= y/x
ETHANECONV. PRESS. 5000 PSIA
Plotted from 1947 tabulationof G. G. Brown, University of Michigan. Extrapolated and drawn by The Fluor Corp. Ltd.in 1957.
Component 1
CONSTANT TEMPERATURE
Component 2
In Pc
In P
In Kj
Kj - 1.0

Ref. No. RE/1, Version 1.0
1414PVT Analysis
P = Pb P1 < Pb P = P1 P < P1
GasOil
GasOilMercury / displacing fluid
Gas Oil
At each stage - volume of oil and gas, density andcomposition of gas measured.Remaining oil is called RESIDUAL OIL
Valve 1
PVT Cell
closed
Pump
P
Tres
P
Pb
VbV
V

Ref. No. RE/1, Version 1.0
1515Material Balance Equation
Prim. Gas cap
Oil + originallydissolved gas
Connate water
Initial volumesat pressure Pi
New pore volumeat pressure p
FLUID VOLUMES
PORE VOLUMES
Total pore volumeat pressure Pi
Reduction in totalpore volume down topressure P
Fluid expansionsdown to pressure P
Water influx We

Ref. No. RE/1, Version 1.0
1616Material Balance Equation Application
Strong water drive
Moderate water drive
Volumetric depletion
G = initial gas in place
F/Eg
Gp
Cumulative Production, MMMSCF
5000
4000
3000
2000
1000
0
Pre
ssur
e or
P/Z
1 2 3 4 5 6 7
Water drive
VolumetricGp vs p/z
VolumetricGp vs p
Wrongextrapolation
Initi
al g
as in
pla
ce

Ref. No. RE/1, Version 1.0
1717Water Influx
∆P1 = 1/2 (Pi - P1)
∆P2 = 1/2 (Pi - P2)
∆P3 = 1/2 (P1 - P3)
∆P4 = 1/2 (P2 - P4)
∆P2∆P1
∆P3
∆P4
∆P5
PiP1
P2
P3
P4
0 1 2 3 4 5
TIME PERIODS
AV
ER
AG
E B
OU
ND
AR
Y P
RE
SS
UR
ES
θ
Reservoir
Aquifer
OWC

Ref. No. RE/1, Version 1.0
1818Immiscible Displacement
WaterOil
Core Plug
Saturations:Water 1- SorOil Sor
Mobility:Krw'/µwO
Saturations:Water SwiOil 1- Swi
Mobility:OKro'/µo

Ref. No. RE/1, Version 1.0
Examination and Model Solutions
• graph made of P vs V and intersection of two slopes indicates
bubble point pressure
• used to determine Pb and Bo above bubble point and BT over total
pressure
P
Gas
Oil
Hg
VVb
Pb
P
b) Separator Test
• oil from PVT cell at reservoir temperature and at bubble point
pressure released to surface conditions
• gas collected from each stage collected and final volume of oil at
standard conditions measured
• volume of oil removed from PVT cell at bubble point and
reservoir temperature measured
• used to determine GOR and Bob as a function of separator
conditions
����������������
yyyyyyyyyyyyyyyy
Date:
1. Complete the sections above but do not seal until the examination is finished.
2. Insert in box on right the numbers of the questions attempted.
3. Start each question on a new page.
4. Rough working should be confined to left hand pages.
5. This book must be handed in entire with the top corner sealed.
6. Additional books must bear the name of the candidate, be sealed and be affixed to the first book by means of a tag provided
Subject:
INSTRUCTIONS TO CANDIDATES
8 Pages
PLEASE READ EXAMINATION REGULATIONS ON BACK COVER
No. Mk.
NAM
E:REGISTRATION N
O.:
COURSE:
YEAR:
SIGNATURE:Complete this section but do not
seal until the examination
is finished