Re-mapping the Cliffs of Mount Everest: Deriving a ... the Cliffs of Mount Everest: Deriving a...
13
Re-mapping the Cliffs of Mount Everest: Deriving a Synoptic Map from Large-scale Mountain Map Data Lorenz Hurni, Angeliki Tsorlini, Patrick Lehmann, Roland Schenkel, Roman Geisthövel ETH Zurich, Institute of Cartography and Geoinformation, Stefano- Franscini-Platz 5, 8093 Zurich, Switzerland Abstract. This papers describes first the history of mapping and carto- graphic depiction of Mount Everest, the highest peak in the world. The qual- ity of the map and geodata of the area has significantly increased over the last hundred years. It may now serve as a precise source to derive educational maps, such as the Everest map in the SWISS WORLD ATLAS, the Swiss school atlas. We first describe the history of mapping Mount Everest and then the production steps for the new atlas map, with a special focus on terrain repre- sentation (relief, rock depiction). Keywords: Atlas cartography, topographic maps, relief and rock depiction. 1. Introduction The area of Mount Everest has changed from an unmapped place to one of the best mapped areas of the world within a bit more than a hundred years. The number of high quality maps of Everest has increased in the last years and today there are also precise coordinates of summits as well as high reso- lution digital elevation models available. Due to its geographic uniqueness, the area of Mount Everest has become a highly frequented area for both tour- ists and mountaineers. For educational purposes, showing the topography, morphology and economic use of the area, school atlas maps are an adequate means to communicate spatially related information and phenomena. After the history of mapping Everest, we describe the editorial and technical work- flow for a new Everest map in the SWISS WORLD ATLAS, the Swiss school atlas, based on existing maps and geo-data.
Transcript of Re-mapping the Cliffs of Mount Everest: Deriving a ... the Cliffs of Mount Everest: Deriving a...
Re-mapping the Cliffs of Mount Everest: Deriving a Synoptic Map from Large-scale Mountain Map Data
Lorenz Hurni, Angeliki Tsorlini, Patrick Lehmann, Roland Schenkel, Roman Geisthövel
ETH Zurich, Institute of Cartography and Geoinformation, Stefano-Franscini-Platz 5, 8093 Zurich, Switzerland
Abstract. This papers describes first the history of mapping and carto-graphic depiction of Mount Everest, the highest peak in the world. The qual-ity of the map and geodata of the area has significantly increased over the last hundred years. It may now serve as a precise source to derive educational maps, such as the Everest map in the SWISS WORLD ATLAS, the Swiss school atlas. We first describe the history of mapping Mount Everest and then the production steps for the new atlas map, with a special focus on terrain repre-sentation (relief, rock depiction).
Keywords: Atlas cartography, topographic maps, relief and rock depiction.
1. Introduction The area of Mount Everest has changed from an unmapped place to one of the best mapped areas of the world within a bit more than a hundred years. The number of high quality maps of Everest has increased in the last years and today there are also precise coordinates of summits as well as high reso-lution digital elevation models available. Due to its geographic uniqueness, the area of Mount Everest has become a highly frequented area for both tour-ists and mountaineers. For educational purposes, showing the topography, morphology and economic use of the area, school atlas maps are an adequate means to communicate spatially related information and phenomena. After the history of mapping Everest, we describe the editorial and technical work-flow for a new Everest map in the SWISS WORLD ATLAS, the Swiss school atlas, based on existing maps and geo-data.
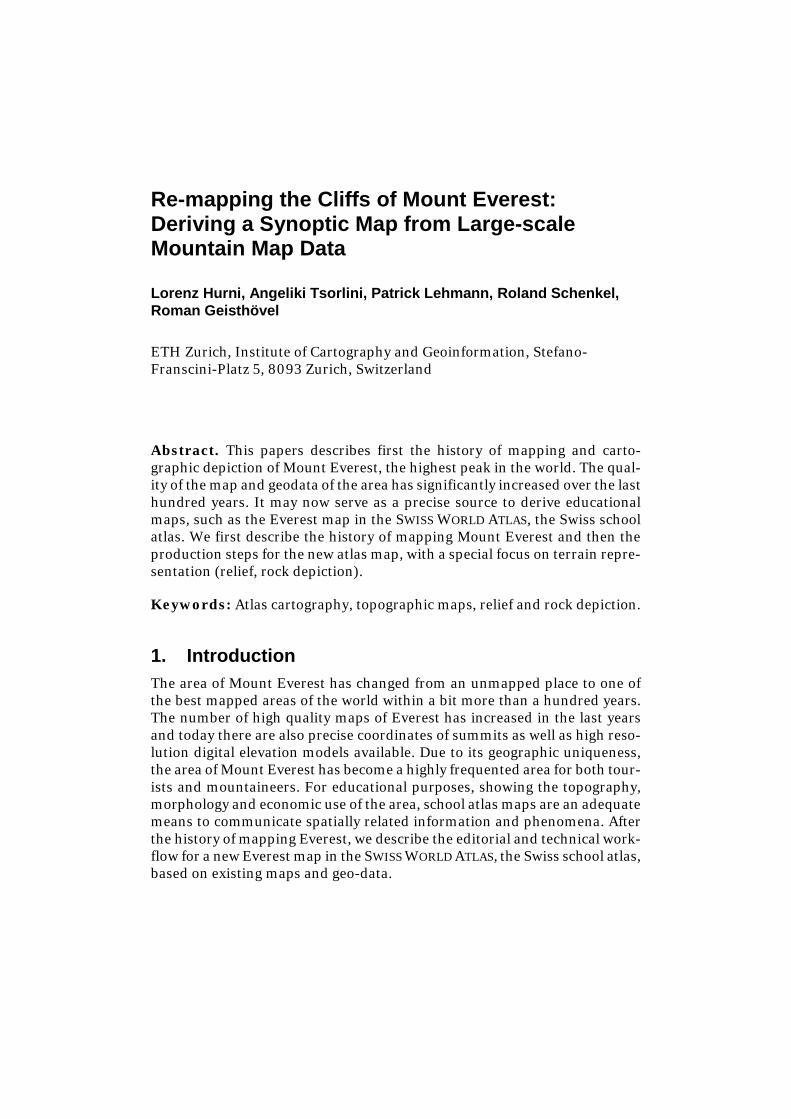
2. The History of Mapping Mount Everest The first attempts to map the Mount Everest area date from the 18th century, the results however cannot yet be compared to the triangulation of Himala-yan peaks performed in the framework of the British Survey of India in the mid-19th century (Ward, 1994). In 1856, it was first suggested to the Royal Geographical Society (RGS), that the now-called Mount Everest could be the highest peak of the world with a height of 29,000 feet (Hughes, 2009/2012). Measurements, however were taken at distance from India, and it took an-other 60 years until surveyors could enter in forbidden Nepal for more pre-cise surveys. First high quality surveys were actually carried out from the Ti-betan side, leading to a first map of H. F. Milne from panoramic photographs (Howard-Bury, 1922) (Figure 1).
Figure 1. Synoptic map of Mount Everest area, based on field work of the Morshead/Wheeler expedition, compiled by H.F. Milne, 1922.
Based on almost the same sources recorded by the Morshead/Wheeler expe-dition, the Royal Geographical Society compiled a new map. The Swiss car-tographer Charles Jacot-Guillarmod (Feldmann, 2008), who was one of the co-developers and “users” of the famous Swiss style rock depiction (Jenny, Gilgen, Geisthövel, Marston, & Hurni, 2014), draw the map in London, shortly before his sudden death while surveying in Switzerland in 1925. Fig-ure 2 shows an extract of that map, originally at the scale of 1:63,360 (1 mile = 1 inch). Charles Jacot-Guillarmod was also the cousin of Jules Jacot-Guil-larmod, who explored K2 at the beginning of the 20th century. Charles com-piled a map of K2 based on the field work of Jules (Buffet, 2012; Feldmann, 2005).
In 1933, a reconnaissance flight from the south brought first reliable aerial images from the Nepalese side (Ward, 1994). Two years later an expedition under Eric Shipton explored the north side from the ground (Shipton, 1936). The material from both expeditions was then combined by A.R. Hinks and

cartographer H. F. Milne of the RGS to compile a new Everest map (Figure 3), published in 1952 (Ward & Clark, 1992).
Figure 2. Everest map 1:63,360 published by the Royal Geographical Soci-ety, drawn by Charles Jacot-Guillarmod, 1925.
Figure 3. Hinks/Milne map of Mount Everest from 1952 (b/w representa-tion from Ward and Clark (1992)).
Figure 4. Map of Mount Everest 1:25,000 by Erwin Schneider and Fritz Eb-ster (cartography) from 1956.
In the early 1950ies, several expeditions attempted to climb Mount Everest, finally leading to the successful attempt by Edmund Hillary and Tenzing
Norgay in 1953. However, mapping of Everest was not complete at that time, and much remained to be done to cover the region with accurate and reliable maps (Hughes, 2009).
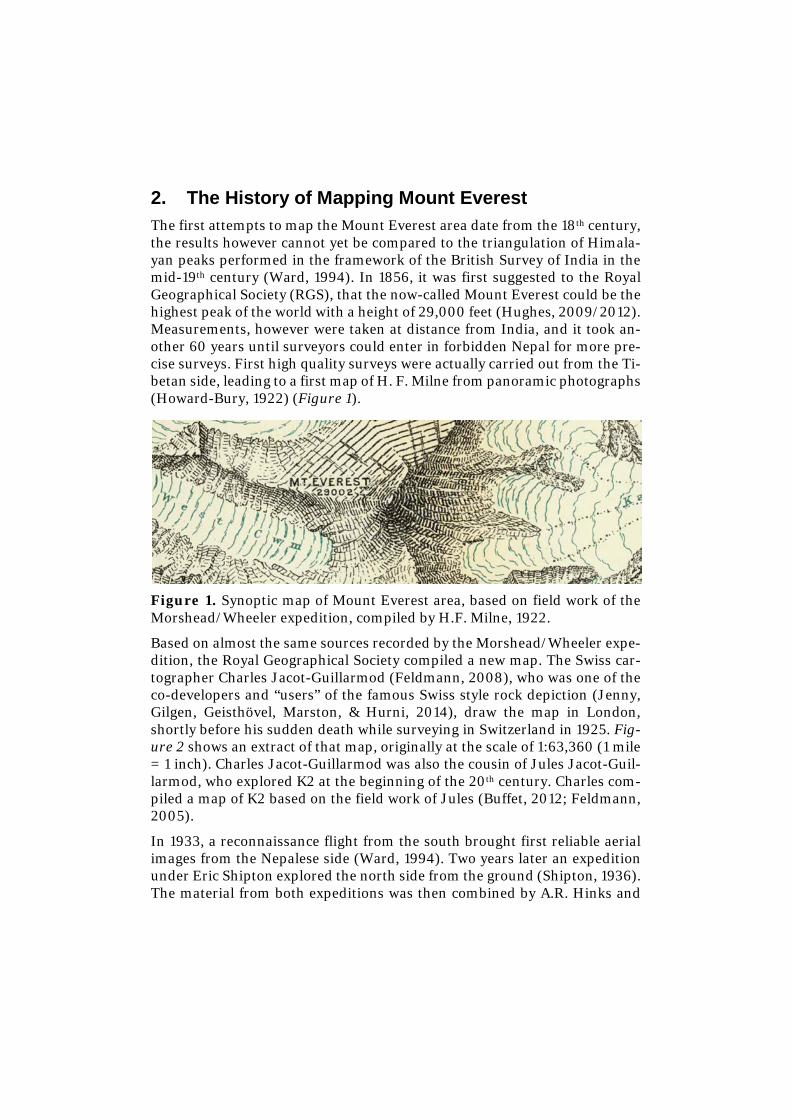
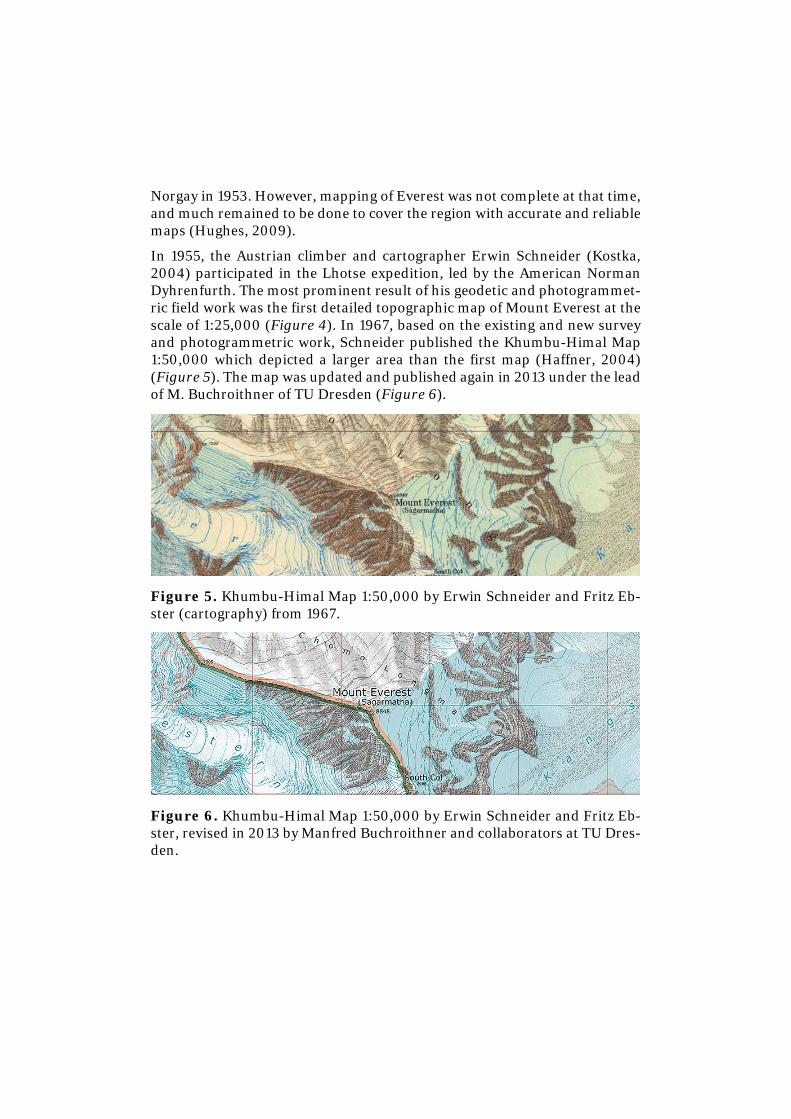
In 1955, the Austrian climber and cartographer Erwin Schneider (Kostka, 2004) participated in the Lhotse expedition, led by the American Norman Dyhrenfurth. The most prominent result of his geodetic and photogrammet-ric field work was the first detailed topographic map of Mount Everest at the scale of 1:25,000 (Figure 4). In 1967, based on the existing and new survey and photogrammetric work, Schneider published the Khumbu-Himal Map 1:50,000 which depicted a larger area than the first map (Haffner, 2004) (Figure 5). The map was updated and published again in 2013 under the lead of M. Buchroithner of TU Dresden (Figure 6).
Figure 5. Khumbu-Himal Map 1:50,000 by Erwin Schneider and Fritz Eb-ster (cartography) from 1967.
Figure 6. Khumbu-Himal Map 1:50,000 by Erwin Schneider and Fritz Eb-ster, revised in 2013 by Manfred Buchroithner and collaborators at TU Dres-den.
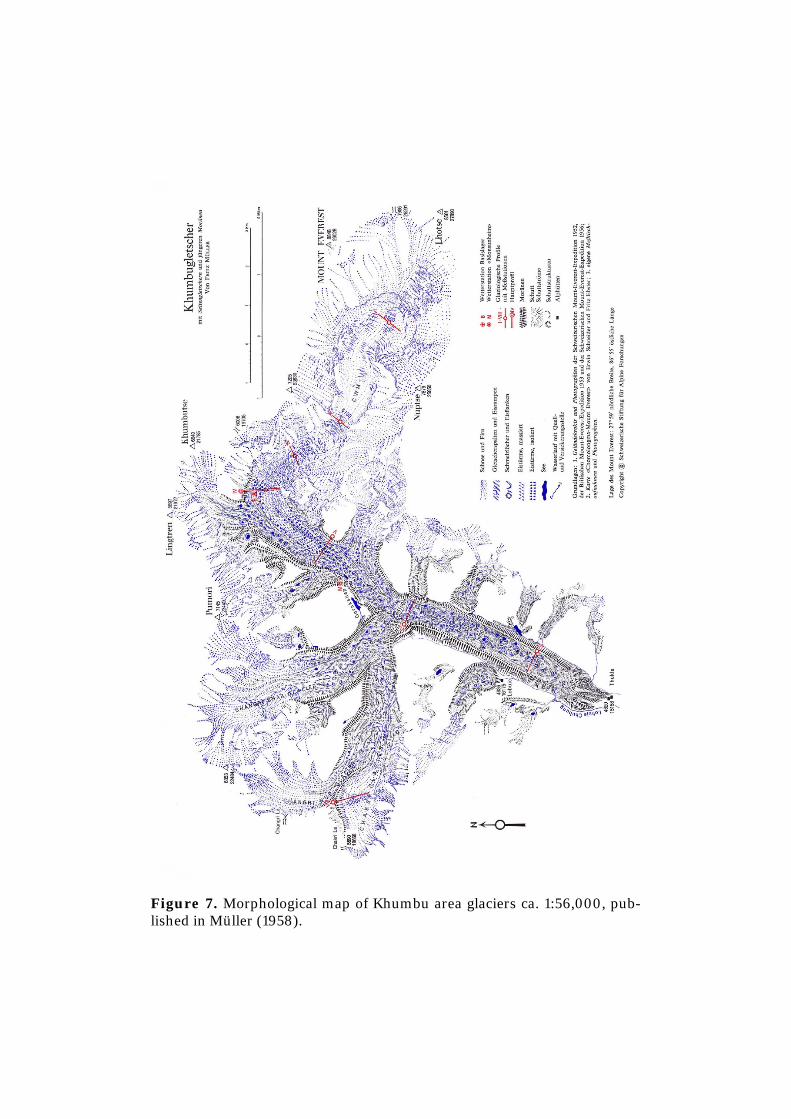
Figure 7. Morphological map of Khumbu area glaciers ca. 1:56,000, pub-lished in Müller (1958).
In 1956, members of a Swiss expedition reached the summit of Mount Ever-est for the second time and made the first ascent to Lhotse. In the framework of this expedition, the Swiss glaciologist Fritz Müller made extensive glacio-logical measurements of the glaciers in the Khumbu area (Eggler, 1956; Oelz, 2006). Based on existing topographical maps and on own surveys, he pub-lished a morphological map of those glaciers, which can however not be com-pared to a full-fledged topographical map (Figure 7) (Müller, 1958). Several authors have published special thematic maps in the following years, such as e.g. geological maps (Haffner, 2004).
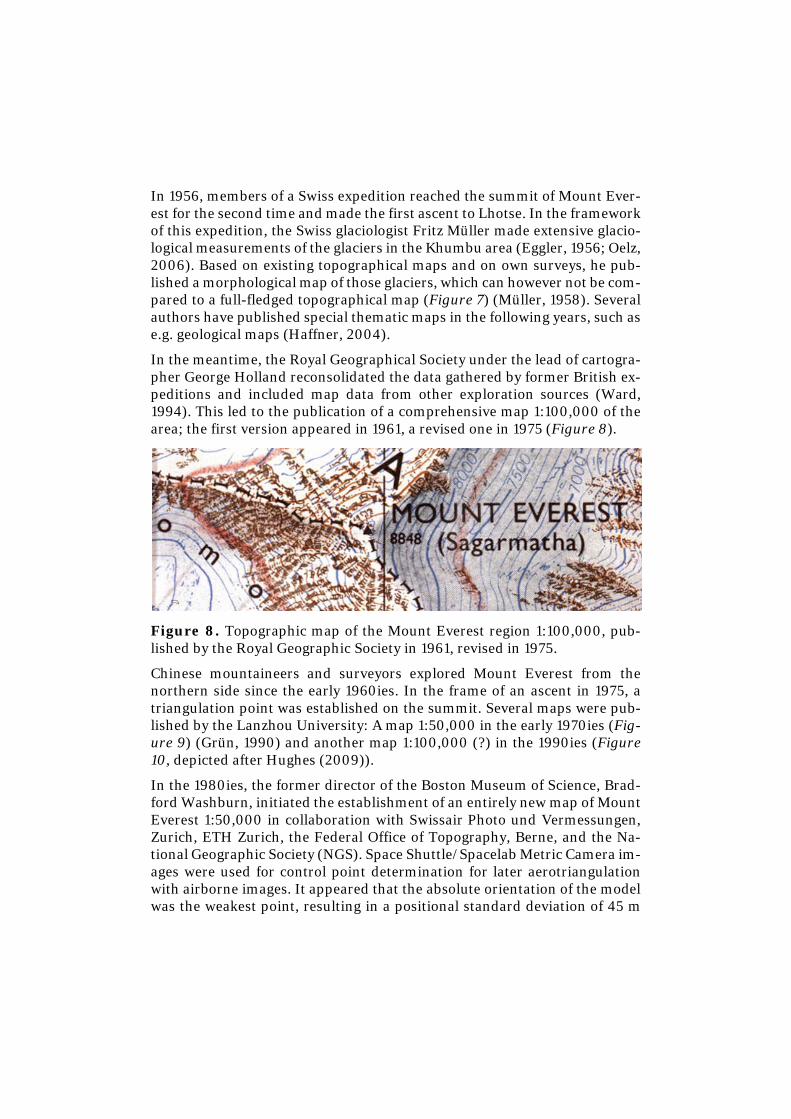
In the meantime, the Royal Geographical Society under the lead of cartogra-pher George Holland reconsolidated the data gathered by former British ex-peditions and included map data from other exploration sources (Ward, 1994). This led to the publication of a comprehensive map 1:100,000 of the area; the first version appeared in 1961, a revised one in 1975 (Figure 8).
Figure 8. Topographic map of the Mount Everest region 1:100,000, pub-lished by the Royal Geographic Society in 1961, revised in 1975.
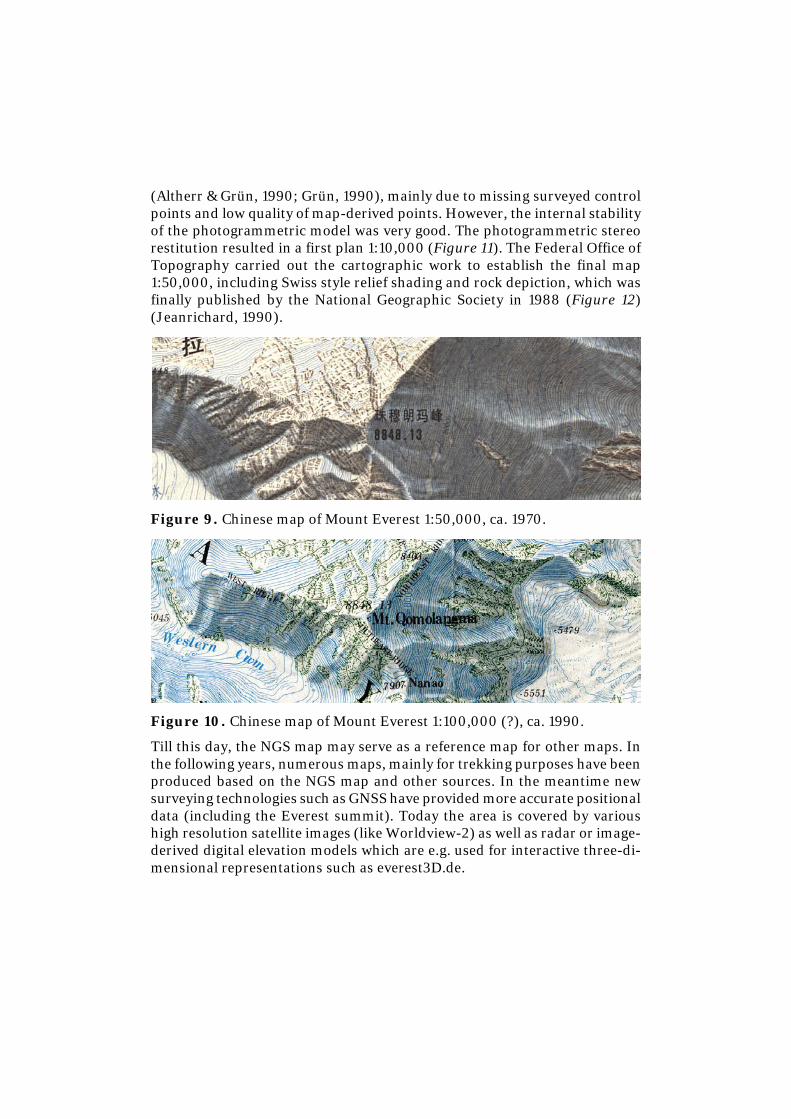
Chinese mountaineers and surveyors explored Mount Everest from the northern side since the early 1960ies. In the frame of an ascent in 1975, a triangulation point was established on the summit. Several maps were pub-lished by the Lanzhou University: A map 1:50,000 in the early 1970ies (Fig-ure 9) (Grün, 1990) and another map 1:100,000 (?) in the 1990ies (Figure 10, depicted after Hughes (2009)).
In the 1980ies, the former director of the Boston Museum of Science, Brad-ford Washburn, initiated the establishment of an entirely new map of Mount Everest 1:50,000 in collaboration with Swissair Photo und Vermessungen, Zurich, ETH Zurich, the Federal Office of Topography, Berne, and the Na-tional Geographic Society (NGS). Space Shuttle/Spacelab Metric Camera im-ages were used for control point determination for later aerotriangulation with airborne images. It appeared that the absolute orientation of the model was the weakest point, resulting in a positional standard deviation of 45 m
(Altherr & Grün, 1990; Grün, 1990), mainly due to missing surveyed control points and low quality of map-derived points. However, the internal stability of the photogrammetric model was very good. The photogrammetric stereo restitution resulted in a first plan 1:10,000 (Figure 11). The Federal Office of Topography carried out the cartographic work to establish the final map 1:50,000, including Swiss style relief shading and rock depiction, which was finally published by the National Geographic Society in 1988 (Figure 12) (Jeanrichard, 1990).
Figure 9. Chinese map of Mount Everest 1:50,000, ca. 1970.
Figure 10. Chinese map of Mount Everest 1:100,000 (?), ca. 1990.
Till this day, the NGS map may serve as a reference map for other maps. In the following years, numerous maps, mainly for trekking purposes have been produced based on the NGS map and other sources. In the meantime new surveying technologies such as GNSS have provided more accurate positional data (including the Everest summit). Today the area is covered by various high resolution satellite images (like Worldview-2) as well as radar or image-derived digital elevation models which are e.g. used for interactive three-di-mensional representations such as everest3D.de.

Figure 11. Photogrammetric stereo restitution 1:10,000 by Swissair Photo und Vermessungen, Zurich, ca. 1985. Equidistance of contour lines 20 m.
Figure 12. National Geographic Society map of Mount Everest 1:50,000 of 1988, cartographic production by Federal Office of Topography, Berne.
3. A Synoptic Map of Mount Everest for the SWISS WORLD ATLAS
The SWISS WORLD ATLAS (SWA) is the most widely-used Swiss secondary level school atlas. The work for the atlas started in 1898 by mandate of the Swiss Conference of Cantonal Ministers of Education (EDK) to the Institute of Cartography and Geoinformation at ETH Zurich. The first German edition was published in 1910, followed by a French edition in 1912 and an Italian one in 1915. Major revisions were carried out in 1928, 1962, 1981, 1993 and 2002. Until 1980, the name of the atlas was SCHWEIZERISCHER MITTELSCHU-LATLAS (SWISS SECONDARY SCHOOL ATLAS), since 1981 SCHWEIZER WELTAT-LAS (SWISS WORLD ATLAS, SWA). With the edition of 2002, the production was converted entirely to a digital workflow. A completely revised edition of the SWA will be published in 2017.
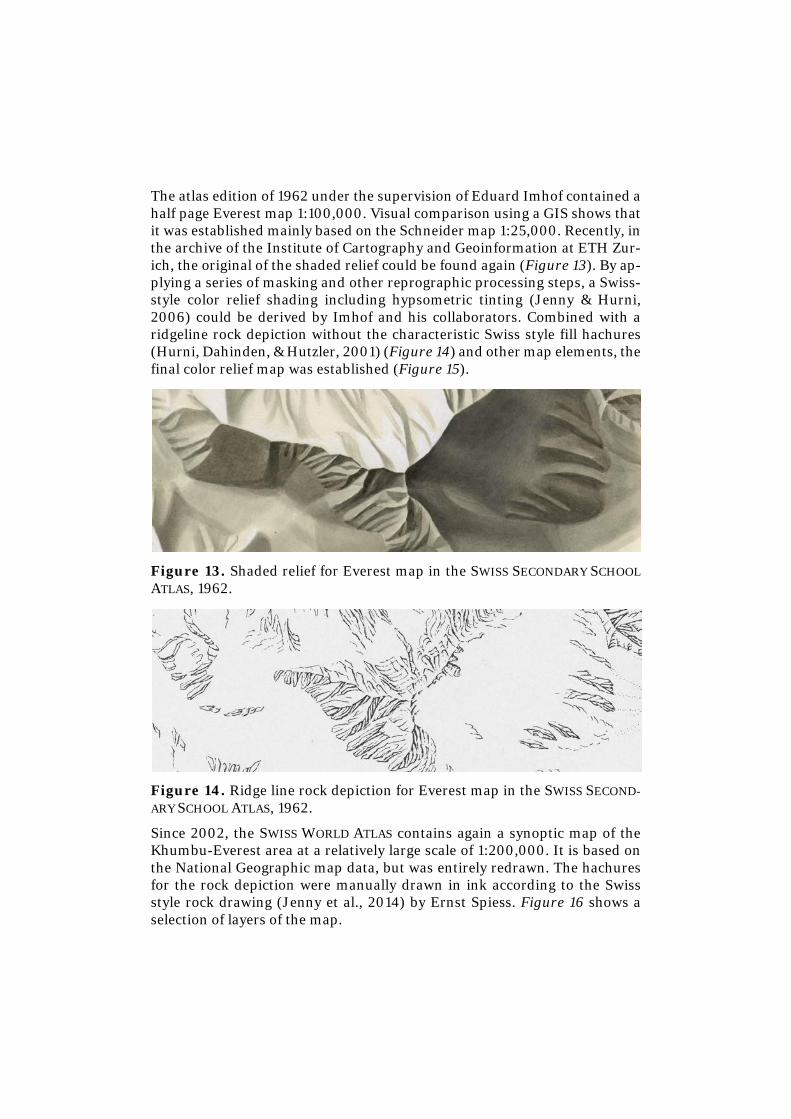
The atlas edition of 1962 under the supervision of Eduard Imhof contained a half page Everest map 1:100,000. Visual comparison using a GIS shows that it was established mainly based on the Schneider map 1:25,000. Recently, in the archive of the Institute of Cartography and Geoinformation at ETH Zur-ich, the original of the shaded relief could be found again (Figure 13). By ap-plying a series of masking and other reprographic processing steps, a Swiss-style color relief shading including hypsometric tinting (Jenny & Hurni, 2006) could be derived by Imhof and his collaborators. Combined with a ridgeline rock depiction without the characteristic Swiss style fill hachures (Hurni, Dahinden, & Hutzler, 2001) (Figure 14) and other map elements, the final color relief map was established (Figure 15).
Figure 13. Shaded relief for Everest map in the SWISS SECONDARY SCHOOL ATLAS, 1962.
Figure 14. Ridge line rock depiction for Everest map in the SWISS SECOND-ARY SCHOOL ATLAS, 1962.
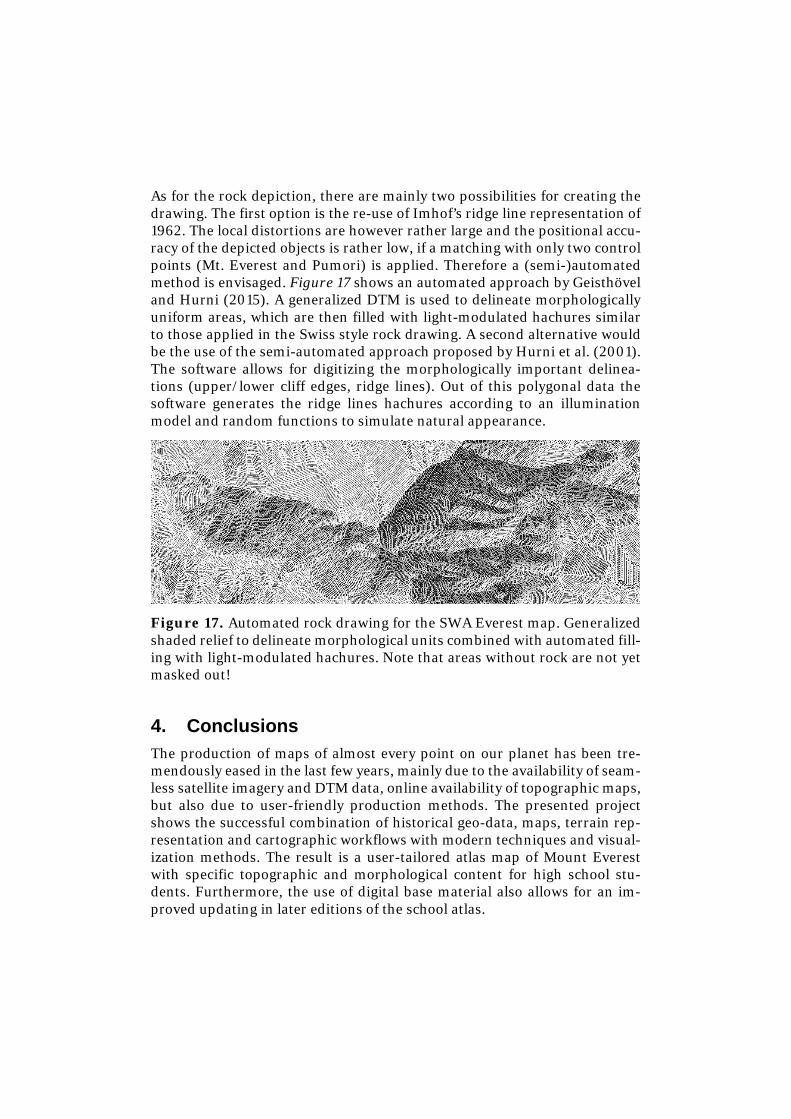
Since 2002, the SWISS WORLD ATLAS contains again a synoptic map of the Khumbu-Everest area at a relatively large scale of 1:200,000. It is based on the National Geographic map data, but was entirely redrawn. The hachures for the rock depiction were manually drawn in ink according to the Swiss style rock drawing (Jenny et al., 2014) by Ernst Spiess. Figure 16 shows a selection of layers of the map.
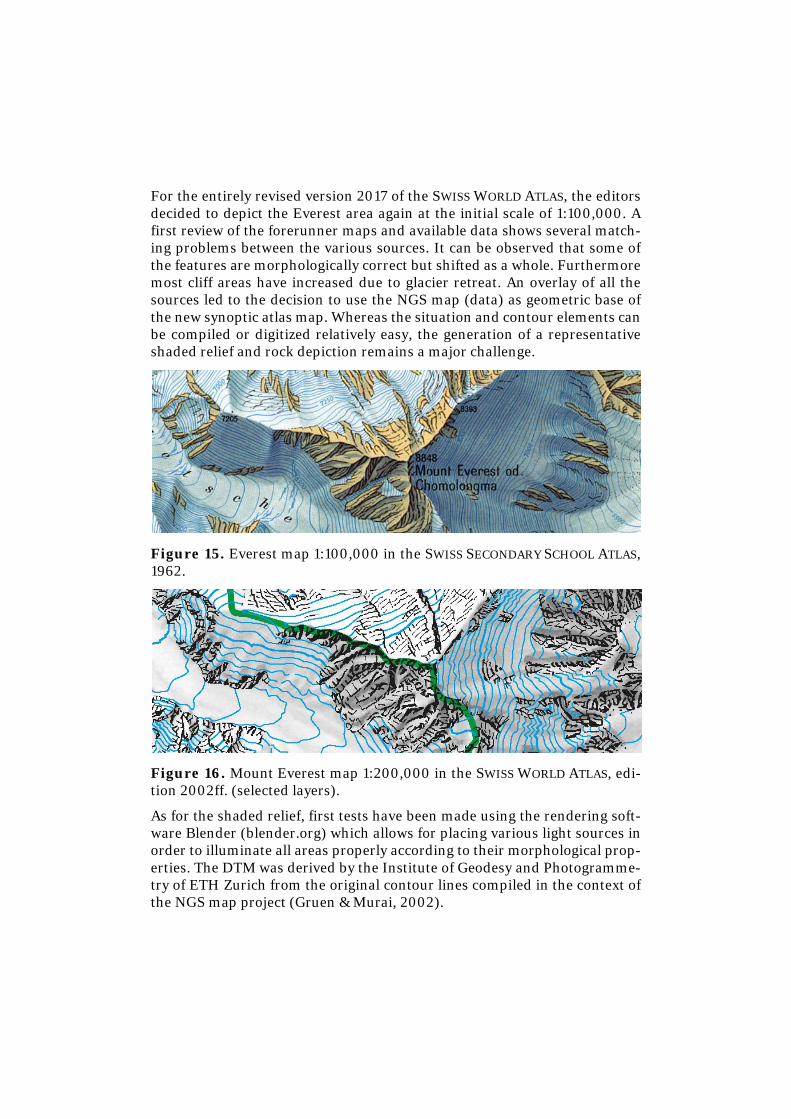
For the entirely revised version 2017 of the SWISS WORLD ATLAS, the editors decided to depict the Everest area again at the initial scale of 1:100,000. A first review of the forerunner maps and available data shows several match-ing problems between the various sources. It can be observed that some of the features are morphologically correct but shifted as a whole. Furthermore most cliff areas have increased due to glacier retreat. An overlay of all the sources led to the decision to use the NGS map (data) as geometric base of the new synoptic atlas map. Whereas the situation and contour elements can be compiled or digitized relatively easy, the generation of a representative shaded relief and rock depiction remains a major challenge.
Figure 15. Everest map 1:100,000 in the SWISS SECONDARY SCHOOL ATLAS, 1962.
Figure 16. Mount Everest map 1:200,000 in the SWISS WORLD ATLAS, edi-tion 2002ff. (selected layers).
As for the shaded relief, first tests have been made using the rendering soft-ware Blender (blender.org) which allows for placing various light sources in order to illuminate all areas properly according to their morphological prop-erties. The DTM was derived by the Institute of Geodesy and Photogramme-try of ETH Zurich from the original contour lines compiled in the context of the NGS map project (Gruen & Murai, 2002).
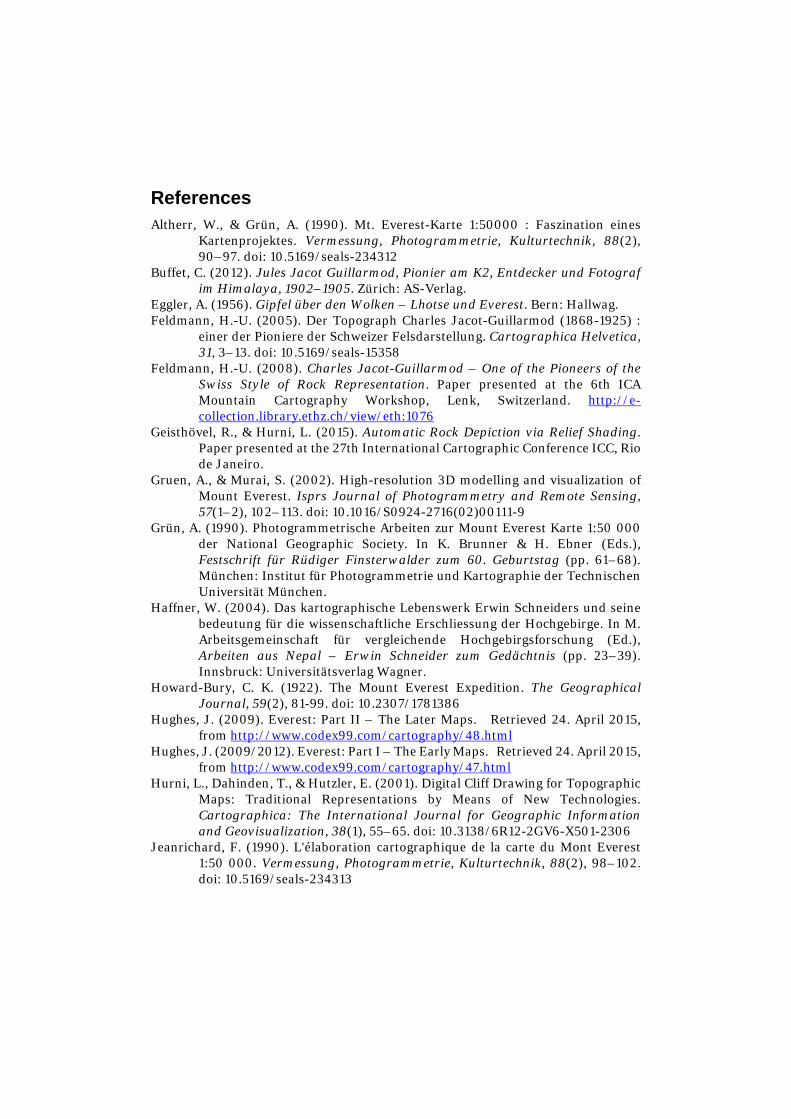
As for the rock depiction, there are mainly two possibilities for creating the drawing. The first option is the re-use of Imhof’s ridge line representation of 1962. The local distortions are however rather large and the positional accu-racy of the depicted objects is rather low, if a matching with only two control points (Mt. Everest and Pumori) is applied. Therefore a (semi-)automated method is envisaged. Figure 17 shows an automated approach by Geisthövel and Hurni (2015). A generalized DTM is used to delineate morphologically uniform areas, which are then filled with light-modulated hachures similar to those applied in the Swiss style rock drawing. A second alternative would be the use of the semi-automated approach proposed by Hurni et al. (2001). The software allows for digitizing the morphologically important delinea-tions (upper/lower cliff edges, ridge lines). Out of this polygonal data the software generates the ridge lines hachures according to an illumination model and random functions to simulate natural appearance.
Figure 17. Automated rock drawing for the SWA Everest map. Generalized shaded relief to delineate morphological units combined with automated fill-ing with light-modulated hachures. Note that areas without rock are not yet masked out!
4. Conclusions The production of maps of almost every point on our planet has been tre-mendously eased in the last few years, mainly due to the availability of seam-less satellite imagery and DTM data, online availability of topographic maps, but also due to user-friendly production methods. The presented project shows the successful combination of historical geo-data, maps, terrain rep-resentation and cartographic workflows with modern techniques and visual-ization methods. The result is a user-tailored atlas map of Mount Everest with specific topographic and morphological content for high school stu-dents. Furthermore, the use of digital base material also allows for an im-proved updating in later editions of the school atlas.
References Altherr, W., & Grün, A. (1990). Mt. Everest-Karte 1:50000 : Faszination eines
Kartenprojektes. Vermessung, Photogrammetrie, Kulturtechnik, 88(2), 90–97. doi: 10.5169/seals-234312
Buffet, C. (2012). Jules Jacot Guillarmod, Pionier am K2, Entdecker und Fotograf im Himalaya, 1902–1905. Zürich: AS-Verlag.
Eggler, A. (1956). Gipfel über den Wolken – Lhotse und Everest. Bern: Hallwag. Feldmann, H.-U. (2005). Der Topograph Charles Jacot-Guillarmod (1868-1925) :
einer der Pioniere der Schweizer Felsdarstellung. Cartographica Helvetica, 31, 3–13. doi: 10.5169/seals-15358
Feldmann, H.-U. (2008). Charles Jacot-Guillarmod – One of the Pioneers of the Swiss Style of Rock Representation. Paper presented at the 6th ICA Mountain Cartography Workshop, Lenk, Switzerland. http://e-collection.library.ethz.ch/view/eth:1076
Geisthövel, R., & Hurni, L. (2015). Automatic Rock Depiction via Relief Shading. Paper presented at the 27th International Cartographic Conference ICC, Rio de Janeiro.
Gruen, A., & Murai, S. (2002). High-resolution 3D modelling and visualization of Mount Everest. Isprs Journal of Photogrammetry and Remote Sensing, 57(1–2), 102–113. doi: 10.1016/S0924-2716(02)00111-9
Grün, A. (1990). Photogrammetrische Arbeiten zur Mount Everest Karte 1:50 000 der National Geographic Society. In K. Brunner & H. Ebner (Eds.), Festschrift für Rüdiger Finsterwalder zum 60. Geburtstag (pp. 61–68). München: Institut für Photogrammetrie und Kartographie der Technischen Universität München.
Haffner, W. (2004). Das kartographische Lebenswerk Erwin Schneiders und seine bedeutung für die wissenschaftliche Erschliessung der Hochgebirge. In M. Arbeitsgemeinschaft für vergleichende Hochgebirgsforschung (Ed.), Arbeiten aus Nepal – Erwin Schneider zum Gedächtnis (pp. 23–39). Innsbruck: Universitätsverlag Wagner.
Howard-Bury, C. K. (1922). The Mount Everest Expedition. The Geographical Journal, 59(2), 81-99. doi: 10.2307/1781386
Hughes, J. (2009). Everest: Part II – The Later Maps. Retrieved 24. April 2015, from http://www.codex99.com/cartography/48.html
Hughes, J. (2009/2012). Everest: Part I – The Early Maps. Retrieved 24. April 2015, from http://www.codex99.com/cartography/47.html
Hurni, L., Dahinden, T., & Hutzler, E. (2001). Digital Cliff Drawing for Topographic Maps: Traditional Representations by Means of New Technologies. Cartographica: The International Journal for Geographic Information and Geovisualization, 38(1), 55–65. doi: 10.3138/6R12-2GV6-X501-2306
Jeanrichard, F. (1990). L'élaboration cartographique de la carte du Mont Everest 1:50 000. Vermessung, Photogrammetrie, Kulturtechnik, 88(2), 98–102. doi: 10.5169/seals-234313

Jenny, B., Gilgen, J., Geisthövel, R., Marston, B. E., & Hurni, L. (2014). Design Principles for Swiss-style Rock Drawing. Cartographic Journal, 51(4), 360-371. doi: 10.1179/1743277413y.0000000052
Jenny, B., & Hurni, L. (2006). Swiss-style colour relief shading modulated by elevation and by exposure to illumination. Cartographic Journal, 43(3), 198-207. doi: Doi 10.1179/000870406x158164
Kostka, R. (2004). Erwin Schneider, 1906–1987, Leben und Arbeit. In M. Arbeitsgemeinschaft für vergleichende Hochgebirgsforschung (Ed.), Arbeiten aus Nepal – Erwin Schneider zum Gedächtnis (pp. 9–22). Innsbruck: Universitätsverlag Wagner.
Müller, F. (1958). Acht Monate Gletscher- und Bodenforschung im Everestgebiet. Berge der Welt, 12 (1958/59), 199–216.
Oelz, O. (2006). Everest, Lhotse – Schweizer am Everest 1952 und 1956. Zürich: AS-Verlag.
Shipton, E. (1936). The Mount Everest Reconnaissance. The Geographical Journal, 87(2), 98-107. doi: 10.2307/1786147
Ward, M. P. (1994). Mapping Everest. Cartographic Journal, 31(1), 33–44. Ward, M. P., & Clark, P. K. (1992). Everest, 1951: Cartographic and Photographic
Evidence of a New Route from Nepal. The Geographical Journal, 158(1), 47-56. doi: 10.2307/3060016


![EVEREST Ultimate Edition ]------------------------------------------------------------------------------------ Version EVEREST v5.50.2100/fr Module de ...](https://static.fdocuments.us/doc/165x107/5aa972ce7f8b9a90188cd90e/everest-ultimate-edition-.jpg)


![FLAMING CLIFFS 2 - 185th VFS Cliffs/lockon_fc2_gui_manual_en.pdf · LOCKON [FLAMING CLIFFS 2] 0 TABLE OF CONTENTS | GRAPHICAL USER INTERFACE Lock On: Flaming Cliffs 2 Graphical User](https://static.fdocuments.us/doc/165x107/5b18f3197f8b9a46258c28cd/flaming-cliffs-2-185th-vfs-cliffslockonfc2guimanualenpdf-lockon-flaming.jpg)