RE: Invasive Plant Species Surveys and Mapping Services at ...
21
1 Brad Semel Illinois Department of Natural Resources Chain O’ Lakes, 8916 Wilmot Road Spring Grove, IL 60081 RE: Invasive Plant Species Surveys and Mapping Services at Illinois Beach State Park, Lake County, Illinois Dear Brad: Cardno ENTRIX is pleased to submit this final report, “Invasive Plant Species Surveys and Mapping of Cattail Populations at Illinois Beach State Park, Lake County, Illinois” as partial fulfillment of the deliverables required under Contract Number RC10L06W granted from the Office of Resource Conservation, Division of Natural Heritage, Wildlife Preservation Fund Program and entered into by Illinois Department of Natural Resources (IDNR) and Cardno ENRTRIX on 23 April, 2010. The draft report includes a hard copy and an electronic version of the data, maps and text. We have enjoyed working with you on this project and are confident our product has enabled the IDNR to move forward with invasive species control projects at Illinois Beach State Park. We appreciate your flexibility in our time of emergency with other projects. We hope that you will consider Cardno ENTRIX for future work in Illinois Beach State Park as well as throughout Illinois. If you have any question or further needs, please contact me at 207-276-3311. Sincerely, Patti Reilly CC: Barry Stuedemann Maggie Cole
Transcript of RE: Invasive Plant Species Surveys and Mapping Services at ...

1
Brad Semel
Illinois Department of Natural Resources
Chain O’ Lakes, 8916 Wilmot Road
Spring Grove, IL 60081
RE: Invasive Plant Species Surveys and Mapping Services at
Illinois Beach State Park, Lake County, Illinois
Dear Brad:
Cardno ENTRIX is pleased to submit this final report, “Invasive Plant Species Surveys and
Mapping of Cattail Populations at Illinois Beach State Park, Lake County, Illinois” as partial
fulfillment of the deliverables required under Contract Number RC10L06W granted from the
Office of Resource Conservation, Division of Natural Heritage, Wildlife Preservation Fund
Program and entered into by Illinois Department of Natural Resources (IDNR) and Cardno
ENRTRIX on 23 April, 2010. The draft report includes a hard copy and an electronic version of
the data, maps and text.
We have enjoyed working with you on this project and are confident our product has enabled the
IDNR to move forward with invasive species control projects at Illinois Beach State Park. We
appreciate your flexibility in our time of emergency with other projects. We hope that you will
consider Cardno ENTRIX for future work in Illinois Beach State Park as well as throughout
Illinois.
If you have any question or further needs, please contact me at 207-276-3311.
Sincerely,
Patti Reilly
CC: Barry Stuedemann
Maggie Cole

2
Invasive Plant Species Surveys and Mapping of Cattail Populations at Illinois
Beach State Park, Lake County, Illinois
Prepared for the
Illinois Department of Natural Resources
One Natural Resources Way
Springfield, IL 60712
by
Cardno ENTRIX
1000 Hart Road, Suite 130, Barrington, IL 60010
August 12, 2011
www.cardno.com
3
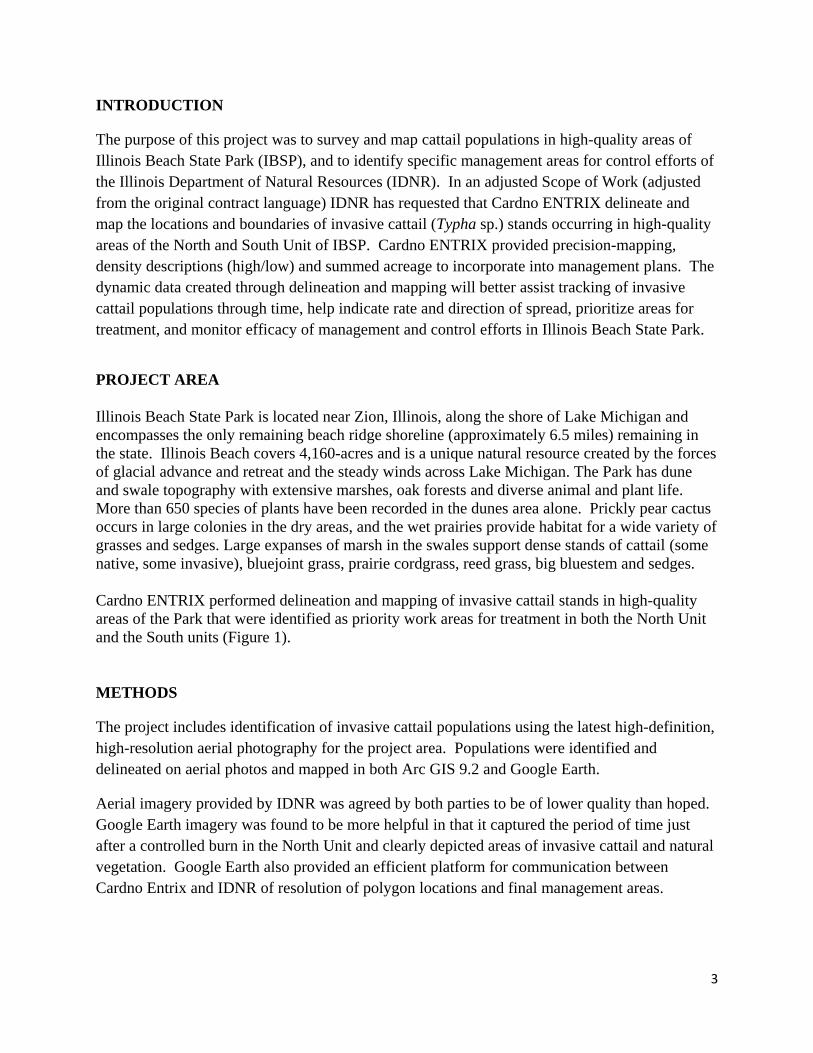
INTRODUCTION
The purpose of this project was to survey and map cattail populations in high-quality areas of
Illinois Beach State Park (IBSP), and to identify specific management areas for control efforts of
the Illinois Department of Natural Resources (IDNR). In an adjusted Scope of Work (adjusted
from the original contract language) IDNR has requested that Cardno ENTRIX delineate and
map the locations and boundaries of invasive cattail (Typha sp.) stands occurring in high-quality
areas of the North and South Unit of IBSP. Cardno ENTRIX provided precision-mapping,
density descriptions (high/low) and summed acreage to incorporate into management plans. The
dynamic data created through delineation and mapping will better assist tracking of invasive
cattail populations through time, help indicate rate and direction of spread, prioritize areas for
treatment, and monitor efficacy of management and control efforts in Illinois Beach State Park.
PROJECT AREA
Illinois Beach State Park is located near Zion, Illinois, along the shore of Lake Michigan and
encompasses the only remaining beach ridge shoreline (approximately 6.5 miles) remaining in
the state. Illinois Beach covers 4,160-acres and is a unique natural resource created by the forces
of glacial advance and retreat and the steady winds across Lake Michigan. The Park has dune
and swale topography with extensive marshes, oak forests and diverse animal and plant life.
More than 650 species of plants have been recorded in the dunes area alone. Prickly pear cactus
occurs in large colonies in the dry areas, and the wet prairies provide habitat for a wide variety of
grasses and sedges. Large expanses of marsh in the swales support dense stands of cattail (some
native, some invasive), bluejoint grass, prairie cordgrass, reed grass, big bluestem and sedges.
Cardno ENTRIX performed delineation and mapping of invasive cattail stands in high-quality
areas of the Park that were identified as priority work areas for treatment in both the North Unit
and the South units (Figure 1).
METHODS
The project includes identification of invasive cattail populations using the latest high-definition,
high-resolution aerial photography for the project area. Populations were identified and
delineated on aerial photos and mapped in both Arc GIS 9.2 and Google Earth.
Aerial imagery provided by IDNR was agreed by both parties to be of lower quality than hoped.
Google Earth imagery was found to be more helpful in that it captured the period of time just
after a controlled burn in the North Unit and clearly depicted areas of invasive cattail and natural
vegetation. Google Earth also provided an efficient platform for communication between
Cardno Entrix and IDNR of resolution of polygon locations and final management areas.
4
Cardno ENTRIX staff conducted field surveys of the map-delineated locations to refine
boundaries of cattail stands and assess priority rankings for treatment. A 200 ft X 200 ft grid
was overlain onto aerial images using Arc GIS and the coordinates of center points of each cell
were uploaded to a pocket GPS unit to be used in ground-truthing. Staff navigated in the field
using GPS coordinates of grid center points to keep oriented among the cattail stands. This
orientation method allowed for efficient navigation and fine-tuning boundaries of cattail stands
in the field.
Staff also recorded the GPS coordinates of any small outlier populations of cattail that were not
identified from the aerial photography. Each ground-thruthed stand was delineated as a polygon
tracked on the GPS unit, uploaded into Arc GIS, given a unique identifier name and its acreage
calculated.
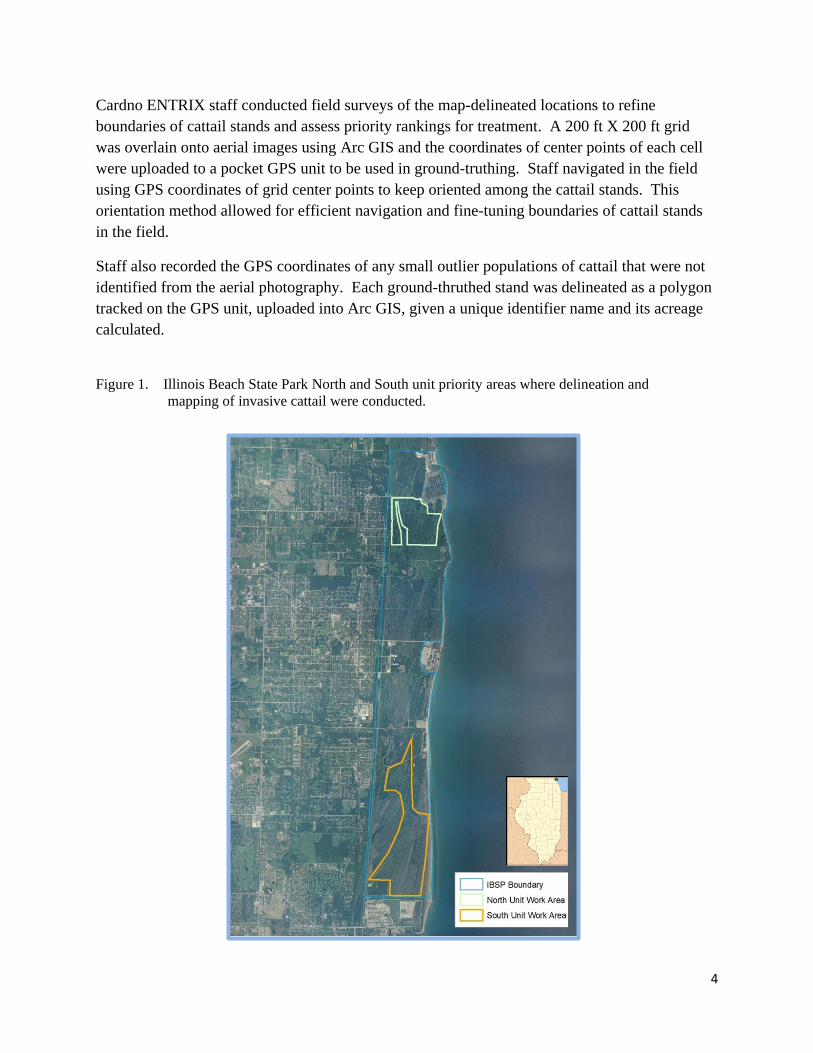
Figure 1. Illinois Beach State Park North and South unit priority areas where delineation and
mapping of invasive cattail were conducted.

5
A preliminary map was produced for IDNR in Arc GIS and exported into Google Earth to
facilitate review. After initial review by IDNR, revised maps and an acreage table were
produced. This information will be used to assist in prioritizing invasive stands for contracting
of treatment in these specific polygon areas of the North and South units (Appendix 1).
Protocols for conducting the fieldwork are included in Appendix 2. North and South unit maps
were finalized for review after: 1) ground-truthing, 2) identifying priority stands in the field, and
3) identifying the maximize number of acres that could be included per dollar of the treatment
(Appendix 3). Through this process Cardno ENTRIX provided IDNR with hard copy maps of
cattail population locations, acreages and Google Earth and Arc GIS shapefiles to accompany the
bid document and negotiate a separate treatment contract.
Fieldwork and ground-truthing were delayed due to Cardno ENTRIXstaff being required to
assist on the BP oil spill in the Gulf of Mexico. Field work was further delayed due to snowfall
during winter months. No permits were required from IDNR and INPC to access public lands.
RESULTS AND DISCUSSION
Cardno ENTRIX identified, delineated and mapped a total of 101 invasive cattail stands
accounting for approximately 204 acres of area in the North and South units of IBSP during this
project. Acreage of cattail areas was totaled and prioritized into management areas for control
efforts. In the North Unit work area Cardno ENTRIX identified and delineated 46 invasive
cattail stands totaling approximately 33 acres, of which 26.6 acres were high-density
monocultures and 6.3 acres were low density (Appendix 3). All 46 stands in the North Unit were
prioritized for treatment.
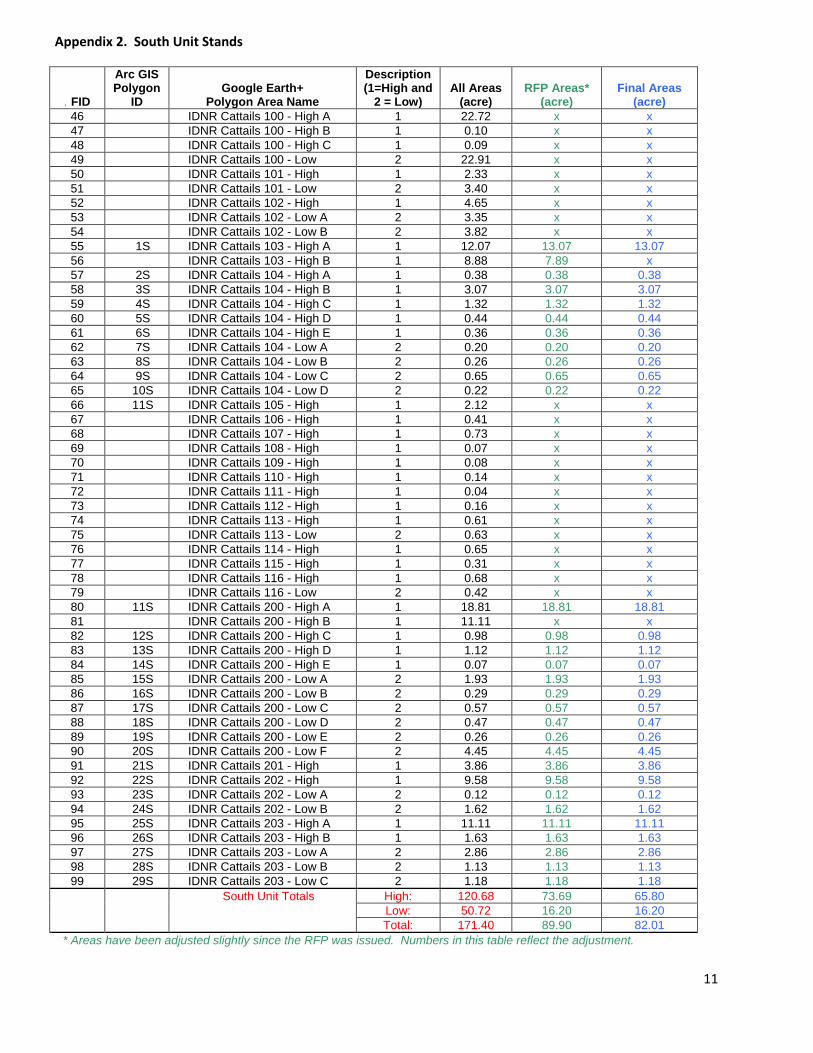
In the South Unit 55 cattail stands were delineated for a total of approximately 171 acres of
which 29 stands were prioritized for treatment; 68.8 acres of high-density monoculture and 16.2
acres of low-density stands.
The objective for an upcoming IDNR RFP to treat invasive cattail stands in IBSP to include the
most acres of the highest priority areas for herbicide application in 2011. The number of priority
sites identified by this project were adjusted by the IDNR to meet the RFP requirements. The
final report identifies 75 priority stands, of approximately 85 high-density acres and 23 acres of
low-density, for a total of 118 acres of invasive cattail to be treated in the North and South units
of IBSP.
PROJECT COSTS
Cardno ENTRIX has included an itemized accounting of costs associated with this project and
the lump sum “not-to exceed” fee of $9,925 to be paid upon receipt of this report package
6
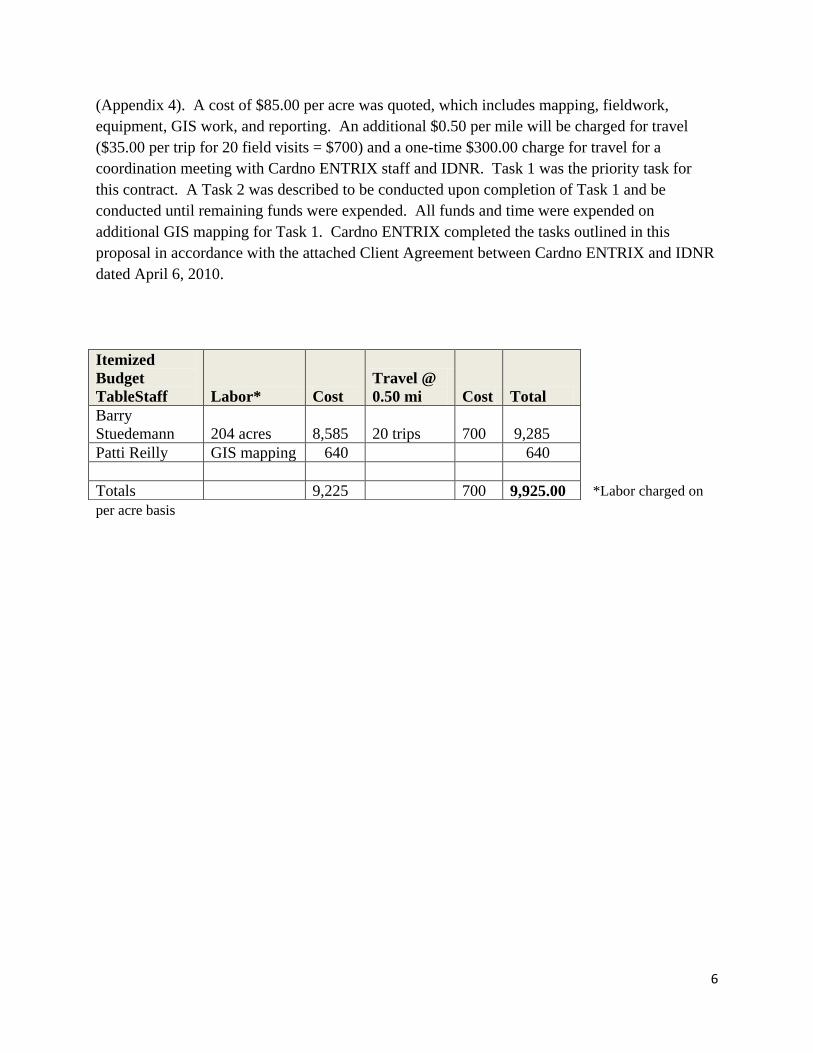
(Appendix 4). A cost of $85.00 per acre was quoted, which includes mapping, fieldwork,
equipment, GIS work, and reporting. An additional $0.50 per mile will be charged for travel
($35.00 per trip for 20 field visits = $700) and a one-time $300.00 charge for travel for a
coordination meeting with Cardno ENTRIX staff and IDNR. Task 1 was the priority task for
this contract. A Task 2 was described to be conducted upon completion of Task 1 and be
conducted until remaining funds were expended. All funds and time were expended on
additional GIS mapping for Task 1. Cardno ENTRIX completed the tasks outlined in this
proposal in accordance with the attached Client Agreement between Cardno ENTRIX and IDNR
dated April 6, 2010.
*Labor charged on
per acre basis
Itemized
Budget
TableStaff Labor* Cost
Travel @
0.50 mi Cost Total
Barry
Stuedemann 204 acres 8,585 20 trips 700 9,285
Patti Reilly GIS mapping 640 640
Totals 9,225 700 9,925.00

7
Appendices
Appendix 1. Maps of cattail polygon identification and delineation for the North and South unit
work areas (following 2 pages).

8

9

10
+ Polygon IDs different in Arc GIS shapefiles. These names are for Google Earth viewing. * Areas have been adjusted slightly since the RFP was issued. Numbers in this table reflect the adjustment.
FID Arc GIS Polygon
ID
Google Earth+ Polygon Area Name
Description (1=High and 2 =
Low)
All Areas (acre)
RFP Areas* (acre)
Final Areas (acre)
0 1 IDNR Cattails 1 - High 1 3.49 3.49 3.49
1 2 IDNR Cattails 3 - High 1 1.52 1.52 1.52
2 3 IDNR Cattails 4 - High 1 4.46 4.46 4.46
3 4 IDNR Cattails 4 - Low 2 0.56 0.56 0.56
4 5 IDNR Cattails 5 - Low 2 0.49 0.49 0.49
5 6 IDNR Cattails 6 - High 1 0.12 0.12 0.12
6 7 IDNR Cattails 7 - High 1 0.09 0.09 0.09
7 8 IDNR Cattails 7 - Low 2 0.06 0.06 0.06
8 9 IDNR Cattails 8 - High 1 0.18 0.18 0.18
9 10 IDNR Cattails 8 - Low 2 2.81 2.81 2.81
10 11 IDNR Cattails 9 - High 1 1.30 1.30 1.30
11 12 IDNR Cattails 10 - High 1 1.84 1.84 1.84
12 13 IDNR Cattails 10 - Low 2 0.13 0.13 0.13
13 14 IDNR Cattails 11 - High 1 0.22 0.22 0.22
14 15 IDNR Cattails 12 - High 1 0.15 0.15 0.15
15 16 IDNR Cattails 13 - High 1 0.09 0.09 0.09
16 17 IDNR Cattails 13 - Low 2 0.42 0.42 0.42
17 18 IDNR Cattails 14 - High 1 0.02 0.02 0.02
18 19 IDNR Cattails 15 - High 1 0.11 0.11 0.11
19 20 IDNR Cattails 16 - High 1 0.09 0.09 0.09
20 21 IDNR Cattails 16 - Low 2 0.31 0.31 0.31
21 22 IDNR Cattails 17 - High 1 0.04 0.04 0.04
22 23 IDNR Cattails 18 - High 1 1.82 1.82 1.82
23 24 IDNR Cattails 19 - High 1 0.29 0.29 0.29
24 25 IDNR Cattails 20 - High 1 0.14 0.14 0.14
25 26 IDNR Cattails 21 - High 1 0.03 0.03 0.03
26 27 IDNR Cattails 22 - High 1 0.11 0.11 0.11
27 28 IDNR Cattails 23 - High 1 0.35 0.35 0.35
28 29 IDNR Cattails 24 - High 1 0.09 0.09 0.09
29 30 IDNR Cattails 24 - Low 2 0.71 0.71 0.71
30 31 IDNR Cattails 25 - High 1 0.47 0.47 0.47
31 32 IDNR Cattails 25 - Low 2 0.13 0.13 0.13
32 33 IDNR Cattails 26 - High 1 0.43 0.43 0.43
33 34 IDNR Cattails 26 - Low 2 0.10 0.10 0.10
34 35 IDNR Cattails 27 - High 1 0.19 0.19 0.19
35 36 IDNR Cattails 27 - Low 2 0.16 0.16 0.16
36 37 IDNR Cattails 28 - High 1 6.99 6.99 6.99
37 38 IDNR Cattails 28 - Low 2 0.43 0.43 0.43
38 39 IDNR Cattails 29 - High 1 0.27 0.27 0.27
39 40 IDNR Cattails 30 - High 1 0.01 0.01 0.01
40 41 IDNR Cattails 31 - High 1 0.14 0.14 0.14
41 42 IDNR Cattails 32 - High 1 0.07 0.07 0.07
42 43 IDNR Cattails 33 - High 1 0.73 0.73 0.73
43 44 IDNR Cattails 34 - High 1 0.03 0.03 0.03
44 45 IDNR Cattails 35 - High 1 0.09 0.09 0.09
45 46 IDNR Cattails 36 - High 1 0.60 0.60 0.60
North Unit Totals High: 26.58 26.58 26.58
Low: 6.31 6.31 6.31
Total: 32.89 32.89 32.89
Appendix 2. Tables developed for cattail stands to identify polygons, density, acreage and prioritization.
North Unit Stands
11
. FID
Arc GIS Polygon
ID Google Earth+
Polygon Area Name
Description (1=High and
2 = Low) All Areas
(acre) RFP Areas*
(acre) Final Areas
(acre)
46 IDNR Cattails 100 - High A 1 22.72 x x
47 IDNR Cattails 100 - High B 1 0.10 x x
48 IDNR Cattails 100 - High C 1 0.09 x x
49 IDNR Cattails 100 - Low 2 22.91 x x
50 IDNR Cattails 101 - High 1 2.33 x x
51 IDNR Cattails 101 - Low 2 3.40 x x
52 IDNR Cattails 102 - High 1 4.65 x x
53 IDNR Cattails 102 - Low A 2 3.35 x x
54 IDNR Cattails 102 - Low B 2 3.82 x x
55 1S IDNR Cattails 103 - High A 1 12.07 13.07 13.07
56 IDNR Cattails 103 - High B 1 8.88 7.89 x
57 2S IDNR Cattails 104 - High A 1 0.38 0.38 0.38
58 3S IDNR Cattails 104 - High B 1 3.07 3.07 3.07
59 4S IDNR Cattails 104 - High C 1 1.32 1.32 1.32
60 5S IDNR Cattails 104 - High D 1 0.44 0.44 0.44
61 6S IDNR Cattails 104 - High E 1 0.36 0.36 0.36
62 7S IDNR Cattails 104 - Low A 2 0.20 0.20 0.20
63 8S IDNR Cattails 104 - Low B 2 0.26 0.26 0.26
64 9S IDNR Cattails 104 - Low C 2 0.65 0.65 0.65
65 10S IDNR Cattails 104 - Low D 2 0.22 0.22 0.22
66 11S IDNR Cattails 105 - High 1 2.12 x x
67 IDNR Cattails 106 - High 1 0.41 x x
68 IDNR Cattails 107 - High 1 0.73 x x
69 IDNR Cattails 108 - High 1 0.07 x x
70 IDNR Cattails 109 - High 1 0.08 x x
71 IDNR Cattails 110 - High 1 0.14 x x
72 IDNR Cattails 111 - High 1 0.04 x x
73 IDNR Cattails 112 - High 1 0.16 x x
74 IDNR Cattails 113 - High 1 0.61 x x
75 IDNR Cattails 113 - Low 2 0.63 x x
76 IDNR Cattails 114 - High 1 0.65 x x
77 IDNR Cattails 115 - High 1 0.31 x x
78 IDNR Cattails 116 - High 1 0.68 x x
79 IDNR Cattails 116 - Low 2 0.42 x x
80 11S IDNR Cattails 200 - High A 1 18.81 18.81 18.81
81 IDNR Cattails 200 - High B 1 11.11 x x
82 12S IDNR Cattails 200 - High C 1 0.98 0.98 0.98
83 13S IDNR Cattails 200 - High D 1 1.12 1.12 1.12
84 14S IDNR Cattails 200 - High E 1 0.07 0.07 0.07
85 15S IDNR Cattails 200 - Low A 2 1.93 1.93 1.93
86 16S IDNR Cattails 200 - Low B 2 0.29 0.29 0.29
87 17S IDNR Cattails 200 - Low C 2 0.57 0.57 0.57
88 18S IDNR Cattails 200 - Low D 2 0.47 0.47 0.47
89 19S IDNR Cattails 200 - Low E 2 0.26 0.26 0.26
90 20S IDNR Cattails 200 - Low F 2 4.45 4.45 4.45
91 21S IDNR Cattails 201 - High 1 3.86 3.86 3.86
92 22S IDNR Cattails 202 - High 1 9.58 9.58 9.58
93 23S IDNR Cattails 202 - Low A 2 0.12 0.12 0.12
94 24S IDNR Cattails 202 - Low B 2 1.62 1.62 1.62
95 25S IDNR Cattails 203 - High A 1 11.11 11.11 11.11
96 26S IDNR Cattails 203 - High B 1 1.63 1.63 1.63
97 27S IDNR Cattails 203 - Low A 2 2.86 2.86 2.86
98 28S IDNR Cattails 203 - Low B 2 1.13 1.13 1.13
99 29S IDNR Cattails 203 - Low C 2 1.18 1.18 1.18
South Unit Totals High: 120.68 73.69 65.80
Low: 50.72 16.20 16.20
Total: 171.40 89.90 82.01
* Areas have been adjusted slightly since the RFP was issued. Numbers in this table reflect the adjustment.
Appendix 2. South Unit Stands

12
Appendix 2 (continue) Summary tables of North and South unit acreage prioritized to satisfy the IDNR RFP requirements for invasive cattail control.
Illinois Department of Natural Resources Illinois Beach State Park North Unit and South Unit Cattails
March 29, 2011
Cattail Area Summary
Unit Area Name Description (1=High and 2 = Low)
All Areas (acre)
RFP Areas* (acre) Final Areas (acre)
North Unit Totals High: Low: Total:
26.58 6.31 32.89
26.58 6.31 32.89
26.58 6.31 32.89
South Unit Totals High: Low: Total:
120.68 50.72 171.40
73.69 16.20 89.90
65.80 16.20 82.01
Unit Totals High: Low:
Total:
147.26 57.03 204.29
100.27 22.52 122.79
92.38 22.52 114.90
* Areas have been adjusted slightly since the RFP was issued. RFP area numbers in table reflect this adjustment.
High: $804.55 per acre Low: $604.85 per acre High Area: 84.3 acres Low Area: 40.7 acres Total Area: 125.0 acres High Cost: $67,823.57 Low Cost: $24,617.40 Total Cost: $92,440.96
Cattail Cost Summary
Unit Area Name Description (1=High and 2 = Low)
All Areas (Cost) RFP Areas* (Cost) Final Areas (Cost)
North Unit Totals High: Low: Total:
$21,382.17 $5,079.50 $26,461.67
$21,382.17 $5,079.50 $26,461.67
$21,382.17 $5,079.50 $26,461.67
South Unit Totals High: Low: Total:
$97,092.93 $40,803.26 $137,896.19
$59,291.15 $13,035.65 $72,326.81
$52,943.25 $13,035.65 $65,978.91
Unit Totals High: Low:
Total:
$118,475.10 $45,882.77 $164,357.86
$80,673.32 $18,115.16 $98,788.48
$74,325.42 $18,115.16 $92,440.58
* Areas have been adjusted slightly since the RFP was issued. RFP area numbers in table reflect this adjustment.
Winning Bid

13
Appendix 3. Protocol in Developing Cattail (Typha sp.) Management Areas:
1) Identify management area;
a. Areas specified in North Unit (NU) and South Unit (SU).
2) Review cattail identification resources:
a. Aerial photography;
b. Two-foot topographic survey;
c. Coordinate grid with center-point lat./long. for location referencing; and
d. Previous cattail management transect information.
3) Delineate preliminary cattail communities on Google Earth and prepare Preliminary Cattail
Management Area Figures.
4) Conduct initial field verification of Preliminary Cattail Management Area Figures:
a. Identify on-site;
i. Cattail areas,
ii. High density cattail areas (monocultures),
iii. Low density cattail areas (any Typha sp. present), and
iv. Previously managed cattail areas.
b. Collect on-site vegetation densities, cattail limits, and GPS tracklog.
5) Adjust cattail management areas in Google Earth based on initial field visit and prepare Pre-
Final Cattail Management Area Figures.
6) Conduct field verification of Pre-Final Cattail Management Area Figures:
a. Edit cattail areas:
i. Using coordinate grids with center-point lat./long. for longitudinal transect
verification where possible; and
ii. Using topographic survey and historic lake shoreline sandy ridges for perimeter
cattail area delineation.
b. Verify cattail limits for High and Low Densities and collect GPS tracklog.
7) Adjust cattail management areas in Google Earth based on pre-final verification field visit
and prepare Final Cattail Management Area Figures.
Protocol in Determining Management Area from Winning Bid and Developing Cattail Table
1) Resources for determining final area for cattail management:
a. Final Cattail Management Area Figures;
b. Google Earth cattail area acreages;
c. Winning bid areas and unit costs;
d. Excel spreadsheet to calculate High and Low Density areas, their associated costs, and
the total cost.
2) Create Cattail Table in Excel and include Google Earth cattail areas per density designation.
3) Add areas based on acreage and winning bid cost per acre, per density.
4) Include areas for final cattail management area in the final Cattail Table:
a. First exclude cattail areas adjacent to other large cattail areas not proposed for
management; and
b. Include isolated cattail areas where management may be most effective; and
c. Sum areas until the target Winning Bid costs are met.
Final Cattail Management Area Figures and Cattail Table
1) Using the Final Cattail Management Area Figures and the final Cattail Table, tweak the figures to
create the Final Cattail Management Area Figures for submittal to Contractor.
2) contractor and corresponding shapefiles in UTMNAD83Z16 projection that are useable by ESRI
ArcGIS programs, including ArcView 3.3 thru current versions.

14
Appendix 4. Arc GIS metadata
ENTRIX deliverables will include electronic copies of shapefiles that are readable and editable
by ESRI ArcGIS programs, including ArcView 3.3 thru current versions in UTMNAD83Z16
projection
Metadata Illinois Beach State Park Invasive Cattail Polygons Arc GIS 9.2
Description
These data were collected from aerial photographs and on the ground methods, and include
polygons delineated for invasive cattail stands in both the North and South units of IBSP in
priority high-quality areas.
Purpose
The purpose of these data are to provide guidance and assist in the management of invasive
cattail (Typha sp) in IBSP
Status of the data: These data are part of a dynamic dataset that can be added or subtracted to as
cattail populations decrease, increase or change locations within IBSP.
Time period for which the data is relevant: 2010 and 2011
Data storage and access information: These data are the property of the Illinois Department of
Natural Resources and include attributed shapefiles and kmz files.
Coordinate System and Projection
UTMNAD83Z16
Datum: D_North_American_1927
NAD_1983_UTM_Zone_16N
Projection: Transverse_Mercator
false_easting: 500000.000000
false_northing: 0.000000
central_meridian: -87.000000
scale_factor: 0.999600
latitude_of_origin: 0.000000
Linear Unit: Meter
Details about this document
Prepared by Cardno ENTRIX for the Illinois Department of Natural Resources 20110808
IDNR #RC10L06W

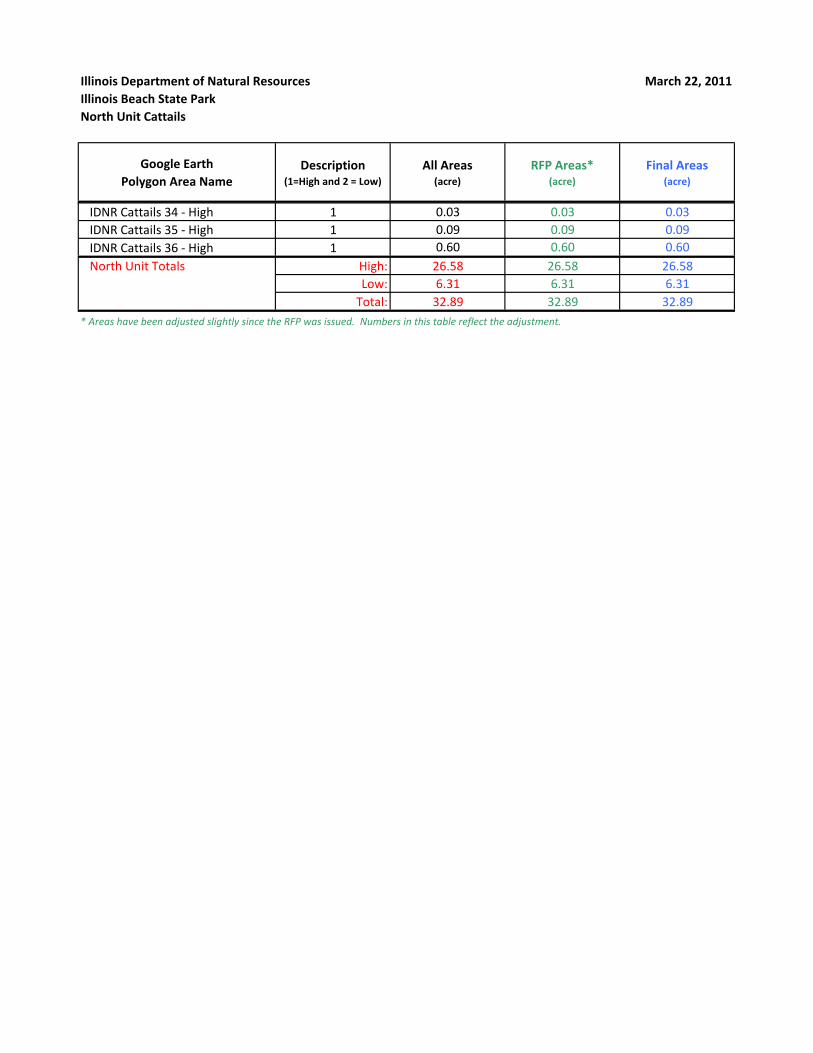
Illinois Department of Natural Resources March 22, 2011Illinois Beach State ParkNorth Unit Cattails
Google EarthPolygon Area Name
Description(1=High and 2 = Low)
All Areas(acre)
RFP Areas*(acre)
Final Areas(acre)
IDNR Cattails 1 ‐ High 1 3.49 3.49 3.49IDNR Cattails 3 ‐ High 1 1.52 1.52 1.52IDNR Cattails 4 ‐ High 1 4.46 4.46 4.46IDNR Cattails 4 ‐ Low 2 0.56 0.56 0.56IDNR Cattails 5 ‐ Low 2 0.49 0.49 0.49IDNR Cattails 6 ‐ High 1 0.12 0.12 0.12IDNR Cattails 7 ‐ High 1 0.09 0.09 0.09IDNR Cattails 7 ‐ Low 2 0.06 0.06 0.06IDNR Cattails 8 ‐ High 1 0.18 0.18 0.18IDNR Cattails 8 ‐ Low 2 2.81 2.81 2.81IDNR Cattails 9 ‐ High 1 1.30 1.30 1.30IDNR Cattails 10 ‐ High 1 1.84 1.84 1.84IDNR Cattails 10 ‐ Low 2 0.13 0.13 0.13IDNR Cattails 11 ‐ High 1 0.22 0.22 0.22IDNR Cattails 12 ‐ High 1 0.15 0.15 0.15IDNR Cattails 13 ‐ High 1 0.09 0.09 0.09IDNR Cattails 13 ‐ Low 2 0.42 0.42 0.42IDNR Cattails 14 ‐ High 1 0.02 0.02 0.02IDNR Cattails 15 ‐ High 1 0.11 0.11 0.11IDNR Cattails 16 ‐ High 1 0.09 0.09 0.09IDNR Cattails 16 Low 2 0 31 0 31 0 31IDNR Cattails 16 ‐ Low 2 0.31 0.31 0.31IDNR Cattails 17 ‐ High 1 0.04 0.04 0.04IDNR Cattails 18 ‐ High 1 1.82 1.82 1.82IDNR Cattails 19 ‐ High 1 0.29 0.29 0.29IDNR Cattails 20 ‐ High 1 0.14 0.14 0.14IDNR Cattails 21 ‐ High 1 0.03 0.03 0.03IDNR Cattails 22 ‐ High 1 0.11 0.11 0.11IDNR Cattails 23 ‐ High 1 0.35 0.35 0.35IDNR Cattails 24 ‐ High 1 0.09 0.09 0.09IDNR Cattails 24 ‐ Low 2 0.71 0.71 0.71IDNR Cattails 25 ‐ High 1 0.47 0.47 0.47IDNR Cattails 25 ‐ Low 2 0.13 0.13 0.13IDNR Cattails 26 ‐ High 1 0.43 0.43 0.43IDNR Cattails 26 ‐ Low 2 0.10 0.10 0.10IDNR Cattails 27 ‐ High 1 0.19 0.19 0.19IDNR Cattails 27 ‐ Low 2 0.16 0.16 0.16IDNR Cattails 28 ‐ High 1 6.99 6.99 6.99IDNR Cattails 28 ‐ Low 2 0.43 0.43 0.43IDNR Cattails 29 ‐ High 1 0.27 0.27 0.27IDNR Cattails 30 ‐ High 1 0.01 0.01 0.01IDNR Cattails 31 ‐ High 1 0.14 0.14 0.14IDNR Cattails 32 ‐ High 1 0.07 0.07 0.07IDNR Cattails 33 ‐ High 1 0.73 0.73 0.73
Illinois Department of Natural Resources March 22, 2011Illinois Beach State ParkNorth Unit Cattails
Google EarthPolygon Area Name
Description(1=High and 2 = Low)
All Areas(acre)
RFP Areas*(acre)
Final Areas(acre)
IDNR Cattails 34 ‐ High 1 0.03 0.03 0.03IDNR Cattails 35 ‐ High 1 0.09 0.09 0.09IDNR Cattails 36 ‐ High 1 0.60 0.60 0.60North Unit Totals High: 26.58 26.58 26.58
Low: 6.31 6.31 6.31Total: 32.89 32.89 32.89
* Areas have been adjusted slightly since the RFP was issued. Numbers in this table reflect the adjustment.

Illinois Department of Natural Resources March 22, 2011Illinois Beach State ParkNorth Unit Cattails
Google EarthPolygon Area Name
Description(1=High and 2 = Low)
All Areas(acre)
RFP Areas*(acre)
Final Areas(acre)
IDNR Cattails 100 ‐ High A 1 22.72 x xIDNR Cattails 100 ‐ High B 1 0.10 x xIDNR Cattails 100 ‐ High C 1 0.09 x xIDNR Cattails 100 ‐ Low 2 22.91 x xIDNR Cattails 101 ‐ High 1 2.33 x xIDNR Cattails 101 ‐ Low 2 3.40 x xIDNR Cattails 102 ‐ High 1 4.65 x xIDNR Cattails 102 ‐ Low A 2 3.35 x xIDNR Cattails 102 ‐ Low B 2 3.82 x xIDNR Cattails 103 ‐ High A 1 12.07 13.07 13.07IDNR Cattails 103 ‐ High B 1 8.88 7.89 xIDNR Cattails 104 ‐ High A 1 0.38 0.38 0.38IDNR Cattails 104 ‐ High B 1 3.07 3.07 3.07IDNR Cattails 104 ‐ High C 1 1.32 1.32 1.32IDNR Cattails 104 ‐ High D 1 0.44 0.44 0.44IDNR Cattails 104 ‐ High E 1 0.36 0.36 0.36IDNR Cattails 104 ‐ Low A 2 0.20 0.20 0.20IDNR Cattails 104 ‐ Low B 2 0.26 0.26 0.26IDNR Cattails 104 ‐ Low C 2 0.65 0.65 0.65IDNR Cattails 104 ‐ Low D 2 0.22 0.22 0.22IDNR C tt il 105 Hi h 1 2 12IDNR Cattails 105 ‐ High 1 2.12 x xIDNR Cattails 106 ‐ High 1 0.41 x xIDNR Cattails 107 ‐ High 1 0.73 x xIDNR Cattails 108 ‐ High 1 0.07 x xIDNR Cattails 109 ‐ High 1 0.08 x xIDNR Cattails 110 ‐ High 1 0.14 x xIDNR Cattails 111 ‐ High 1 0.04 x xIDNR Cattails 112 ‐ High 1 0.16 x xIDNR Cattails 113 ‐ High 1 0.61 x xIDNR Cattails 113 ‐ Low 2 0.63 x xIDNR Cattails 114 ‐ High 1 0.65 x xIDNR Cattails 115 ‐ High 1 0.31 x xIDNR Cattails 116 ‐ High 1 0.68 x xIDNR Cattails 116 ‐ Low 2 0.42 x xIDNR Cattails 200 ‐ High A 1 18.81 18.81 18.81IDNR Cattails 200 ‐ High B 1 11.11 x xIDNR Cattails 200 ‐ High C 1 0.98 0.98 0.98IDNR Cattails 200 ‐ High D 1 1.12 1.12 1.12IDNR Cattails 200 ‐ High E 1 0.07 0.07 0.07IDNR Cattails 200 ‐ Low A 2 1.93 1.93 1.93IDNR Cattails 200 ‐ Low B 2 0.29 0.29 0.29IDNR Cattails 200 ‐ Low C 2 0.57 0.57 0.57IDNR Cattails 200 ‐ Low D 2 0.47 0.47 0.47

Illinois Department of Natural Resources March 22, 2011Illinois Beach State ParkNorth Unit Cattails
Google EarthPolygon Area Name
Description(1=High and 2 = Low)
All Areas(acre)
RFP Areas*(acre)
Final Areas(acre)
IDNR Cattails 200 ‐ Low E 2 0.26 0.26 0.26IDNR Cattails 200 ‐ Low F 2 4.45 4.45 4.45IDNR Cattails 201 ‐ High 1 3.86 3.86 3.86IDNR Cattails 202 ‐ High 1 9.58 9.58 9.58IDNR Cattails 202 ‐ Low A 2 0.12 0.12 0.12IDNR Cattails 202 ‐ Low B 2 1.62 1.62 1.62IDNR Cattails 203 ‐ High A 1 11.11 11.11 11.11IDNR Cattails 203 ‐ High B 1 1.63 1.63 1.63IDNR Cattails 203 ‐ Low A 2 2.86 2.86 2.86IDNR Cattails 203 ‐ Low B 2 1.13 1.13 1.13IDNR Cattails 203 ‐ Low C 2 1.18 1.18 1.18South Unit Totals High: 120.68 73.69 65.80
Low: 50.72 16.20 16.20Total: 171.40 89.90 82.01
* Areas have been adjusted slightly since the RFP was issued. Numbers in this table reflect the adjustment.