Re: Final Report Field Investigation of Heating Energy...
29
Building Science Consulting Inc. P: 519.342.4731 1 167 Lexington Court, Unit 5, Waterloo, Ontario, N2J 4R9 www.buildingscience.com 25 2010.07.26 Dan Clayton Polyurethane Foam Systems Inc. 440 Conestogo Road Waterloo, Ontario, N2L 4E2 Via email: [email protected] Re: Final Report Field Investigation of Heating Energy Consumption of Test Huts Insulated with Spray Foam and Fiberglass Batt Mr. Clayton, BSCI designed and constructed a pair of identical test huts on the outskirts of Waterloo, Ontario Canada to allow the comparison of real-world heating energy performance when different insulation types are used. One of the two identical huts was insulated with fiberglass batt insulation and the other with closed cell spray polyurethane foam (Polarfoam Soya) with the same target R-value. The heating energy consumption of the two huts over the winter has been collected and analyzed. The purpose of this report is to provide a summary documentation of the construction details, to present and analyse the infrared imaging, and to record the analysis of the heating energy use of the two huts. The data used for this report was from February and March 2010. The 2009/2010 winter was warmer than normal and the testing did not commence until after the coldest parts of winter had occurred. The limited data analyzed in this report shows clear heating energy savings if SPUF insulation of the same R-value as fiberglass batt is used, even if the buildings have the same airtightness. Long-term data could provide continued evidence of the savings and comparison in colder periods could provide evidence of a larger difference in energy performance. It is not clear what the reasons for the reduced heating energy requirements are: numerous mechanisms and reasons are possible, but none could be proven definitively given the data available. Please feel free to contact me if you have any questions or would like to discuss this report. Thanks, Aaron Grin M.A.Sc., P.Eng. Dr. John Straube Ph.D., P.Eng. Building Science Consulting 167 Lexington Court, Unit 5 Waterloo ON, N2J 4R9 phone: 519.342.4731
-
Upload
nguyenminh -
Category
Documents
-
view
216 -
download
1
Transcript of Re: Final Report Field Investigation of Heating Energy...
Building Science Consulting Inc. P: 519.342.4731 1 167 Lexington Court, Unit 5, Waterloo, Ontario, N2J 4R9 www.buildingscience.com 25
2010.07.26
Dan Clayton Polyurethane Foam Systems Inc. 440 Conestogo Road Waterloo, Ontario, N2L 4E2
Via email: [email protected]
Re: Final Report
Field Investigation of Heating Energy Consumption of Test Huts Insulated with Spray Foam and Fiberglass Batt
Mr. Clayton,
BSCI designed and constructed a pair of identical test huts on the outskirts of Waterloo, Ontario Canada to allow the comparison of real-world heating energy performance when different insulation types are used. One of the two identical huts was insulated with fiberglass batt insulation and the other with closed cell spray polyurethane foam (Polarfoam Soya) with the same target R-value. The heating energy consumption of the two huts over the winter has been collected and analyzed. The purpose of this report is to provide a summary documentation of the construction details, to present and analyse the infrared imaging, and to record the analysis of the heating energy use of the two huts.
The data used for this report was from February and March 2010. The 2009/2010 winter was warmer than normal and the testing did not commence until after the coldest parts of winter had occurred. The limited data analyzed in this report shows clear heating energy savings if SPUF insulation of the same R-value as fiberglass batt is used, even if the buildings have the same airtightness. Long-term data could provide continued evidence of the savings and comparison in colder periods could provide evidence of a larger difference in energy performance. It is not clear what the reasons for the reduced heating energy requirements are: numerous mechanisms and reasons are possible, but none could be proven definitively given the data available.
Please feel free to contact me if you have any questions or would like to discuss this report.
Thanks,
Aaron Grin M.A.Sc., P.Eng. Dr. John Straube Ph.D., P.Eng. Building Science Consulting 167 Lexington Court, Unit 5 Waterloo ON, N2J 4R9 phone: 519.342.4731
Field Investigation of Heating Energy Consumption of Test Huts Insulated with Spray Foam and Fiberglass Batt
Building Science Consulting Inc. P: 519.342.4731 2 167 Lexington Court, Unit 5, Waterloo, Ontario, N2J 4R9 www.buildingscience.com 25
PFSI TWO HUT FIELD EXPOSURE COMPARISON
Final Report
July 26, 2010
Prepared for Polyurethane Foam Systems Inc. 440 Conestogo Road Waterloo, Ontario, N2L 4E2
Prepared by Building Science Consulting Inc.167 Lexington Court, Unit 5 Waterloo, Ontario Canada N2J 4R9 www.buildingscience.com

Field Investigation of Heating Energy Consumption of Test Huts Insulated with Spray Foam and Fiberglass Batt
Building Science Consulting Inc. P: 519.342.4731 3 167 Lexington Court, Unit 5, Waterloo, Ontario, N2J 4R9 www.buildingscience.com 25

Field Investigation of Heating Energy Consumption of Test Huts Insulated with Spray Foam and Fiberglass Batt
Building Science Consulting Inc. P: 519.342.4731 4 167 Lexington Court, Unit 5, Waterloo, Ontario, N2J 4R9 www.buildingscience.com 25
Introduction This report documents a field study of the heating energy consumption of two structurally identical huts exposed to real Waterloo winter weather conditions
The purpose of the comparison is to determine the difference in space-heating energy consumption between two structurally identical huts exposed to real winter weather conditions. One hut is insulated with fiberglass batt and air-sealed with polyethylene sheet, and one is insulated with Polarfoam Soya 2.0 pcf Spray Polyurethane Foam (SPUF). The insulation levels were both the minimum required by the 2009 Ontario Building Code (OBC Part 9). Both huts are located in an exposed field on Berlett’s Road outside of Waterloo, Ontario. The huts were positioned offset and far enough apart that one will not affect the solar or wind influences on the other.
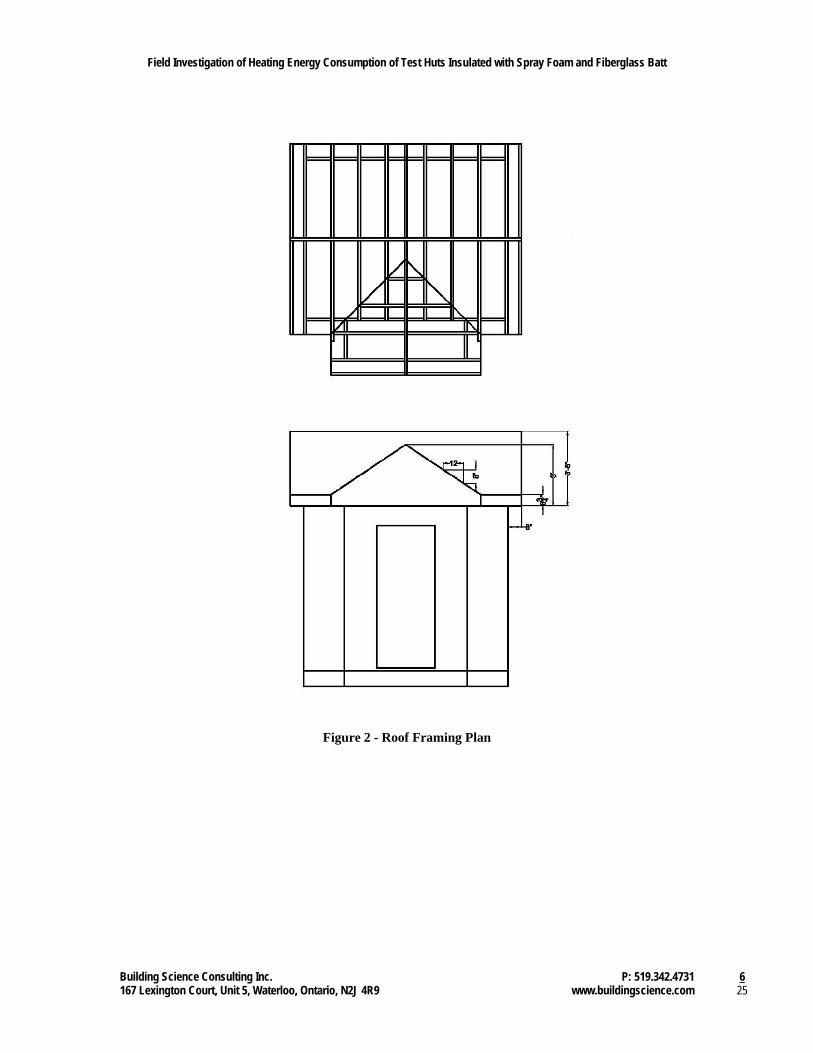
Design and Specifications The huts were designed to represent normal wood-frame housing construction practices in Ontario. Each building has a roughly rectangular plan shape encompassing 92 square feet of interior space and a ceiling height of 8 feet. The huts are raised on a wood frame to a height of 3 feet above the surrounding grade to ensure full exposure of the floor to the weather. Framing is 2x6 at 16” on centre, with double top plates and single bottom plates. The roof is a ventilated gable style at an 8:12 pitch. There is a door on the south side and windows on the north and west sides. The north window is an operable casement window and the west-facing window is fixed. All windows are OBC compliant double-glazed Low-E units. The walls were insulated to nominal R19 and the floors were insulated to R28 with either fiberglass batt or SPUF insulation. The ceilings of both huts were insulated with blown cellulose insulation to R40 through a gable access.
To ensure that the huts were built in accordance with standard construction practices a local builder was chosen to construct the huts. Way-Mar Incorporated was chosen in conjunction with PFSI during the planning stages of the project. Figures 1 and 2 were submitted to Way-Mar as construction drawings.

Field Investigation of Heating Energy Consumption of Test Huts Insulated with Spray Foam and Fiberglass Batt
Building Science Consulting Inc. P: 519.342.4731 5 167 Lexington Court, Unit 5, Waterloo, Ontario, N2J 4R9 www.buildingscience.com 25
Figure 1 - Wall and Floor Framing Plan
Field Investigation of Heating Energy Consumption of Test Huts Insulated with Spray Foam and Fiberglass Batt
Building Science Consulting Inc. P: 519.342.4731 6 167 Lexington Court, Unit 5, Waterloo, Ontario, N2J 4R9 www.buildingscience.com 25
Figure 2 - Roof Framing Plan

Field Investigation of Heating Energy Consumption of Test Huts Insulated with Spray Foam and Fiberglass Batt
Building Science Consulting Inc. P: 519.342.4731 7 167 Lexington Court, Unit 5, Waterloo, Ontario, N2J 4R9 www.buildingscience.com 25
Construction and Instrumentation A detailed Construction and Instrumentation report was submitted on March 1st, 2010. Refer to this report for further information.
The two huts were constructed in an exposed field on Berlett’s Road outside of Waterloo, Ontario. The location is mapped in Figure 3 below.
Figure 3 - Location of Testing Site
The electrical supply for the huts was trenched in December 2009, and construction of the panelized wall construction began in the Way-Mar warehouse on January 16th, 2010. The walls were completely framed and sheathed then loaded onto a trailer for transport to the site. Panelized walls were used to simplify construction and limit the amount of time outdoors for the labourers. The construction process was as follows:
The level gravel pads were placed and the raised wood platforms were built by BSC staff.
Southerly orientation of the bases was verified with a compass. Floors were sheathed onsite Walls were placed and fastened Roofs were framed then sheathed and shingled Tyvek was applied Windows and doors were installed Siding and soffit were then applied Fiberglass insulation was installed in the west hut SPUF insulation was installed in the east hut OSB was installed beneath the floors Drywall was installed, taped and mudded. Primer, paint and trim were installed over the next week. The installation of the data acquisition system was completed on February 23rd

Field Investigation of Heating Energy Consumption of Test Huts Insulated with Spray Foam and Fiberglass Batt
Building Science Consulting Inc. P: 519.342.4731 8 167 Lexington Court, Unit 5, Waterloo, Ontario, N2J 4R9 www.buildingscience.com 25
Figure 4 though Figure 9 show a summary of photos in chronological order through the construction of the two huts. Where possible, photos of the two huts are shown side by side for comparison.
Figure 4 - East and West Hut Raised Base Orientation Verification
Figure 5 - East and West Hut Floor Framing and Sheathing
Figure 6 - East and West Hut Completed Floors and Walls

Field Investigation of Heating Energy Consumption of Test Huts Insulated with Spray Foam and Fiberglass Batt
Building Science Consulting Inc. P: 519.342.4731 9 167 Lexington Court, Unit 5, Waterloo, Ontario, N2J 4R9 www.buildingscience.com 25
Figure 7 - East and West Hut 2-Stud Corners
Figure 8 - East and West Hut West Facing Window Framing
Field Investigation of Heating Energy Consumption of Test Huts Insulated with Spray Foam and Fiberglass Batt
Building Science Consulting Inc. P: 519.342.4731 10 167 Lexington Court, Unit 5, Waterloo, Ontario, N2J 4R9 www.buildingscience.com 25
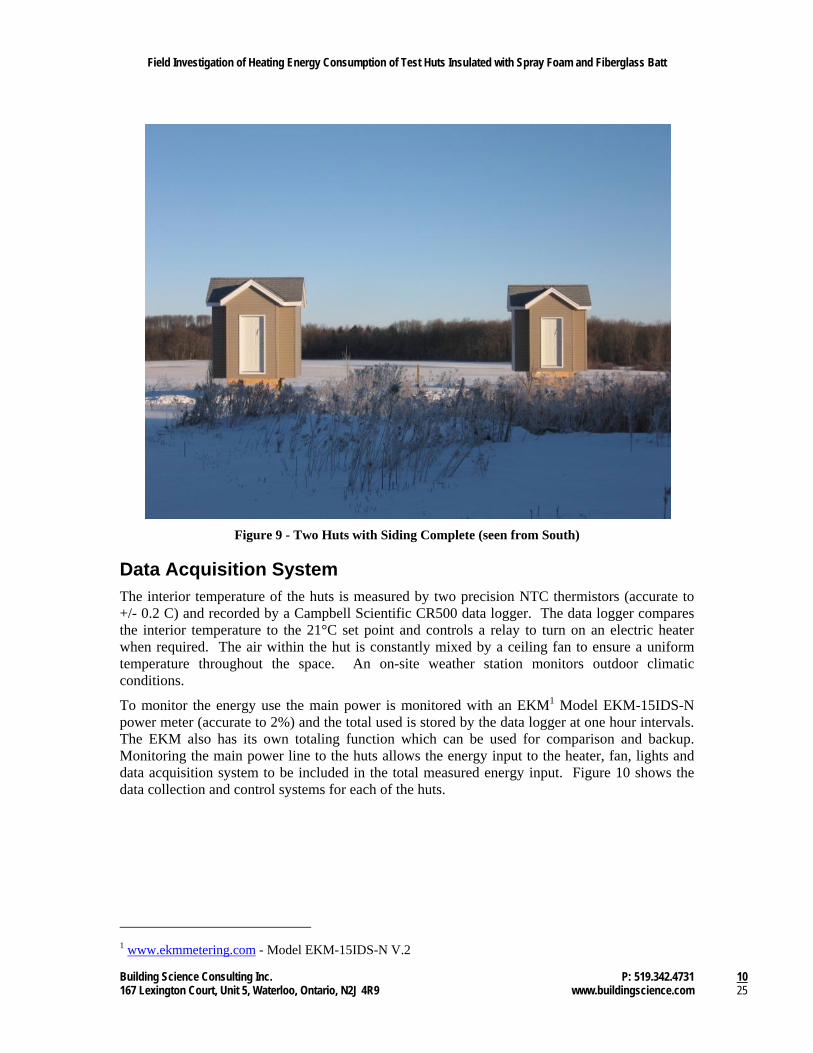
Figure 9 - Two Huts with Siding Complete (seen from South)
Data Acquisition System The interior temperature of the huts is measured by two precision NTC thermistors (accurate to +/- 0.2 C) and recorded by a Campbell Scientific CR500 data logger. The data logger compares the interior temperature to the 21°C set point and controls a relay to turn on an electric heater when required. The air within the hut is constantly mixed by a ceiling fan to ensure a uniform temperature throughout the space. An on-site weather station monitors outdoor climatic conditions.
To monitor the energy use the main power is monitored with an EKM1 Model EKM-15IDS-N power meter (accurate to 2%) and the total used is stored by the data logger at one hour intervals. The EKM also has its own totaling function which can be used for comparison and backup. Monitoring the main power line to the huts allows the energy input to the heater, fan, lights and data acquisition system to be included in the total measured energy input. Figure 10 shows the data collection and control systems for each of the huts.
1 www.ekmmetering.com - Model EKM-15IDS-N V.2

Field Investigation of Heating Energy Consumption of Test Huts Insulated with Spray Foam and Fiberglass Batt
Building Science Consulting Inc. P: 519.342.4731 11 167 Lexington Court, Unit 5, Waterloo, Ontario, N2J 4R9 www.buildingscience.com 25
Figure 10 - East and West Hut Data Acquisition Systems
Field Investigation of Heating Energy Consumption of Test Huts Insulated with Spray Foam and Fiberglass Batt
Building Science Consulting Inc. P: 519.342.4731 12 167 Lexington Court, Unit 5, Waterloo, Ontario, N2J 4R9 www.buildingscience.com 25
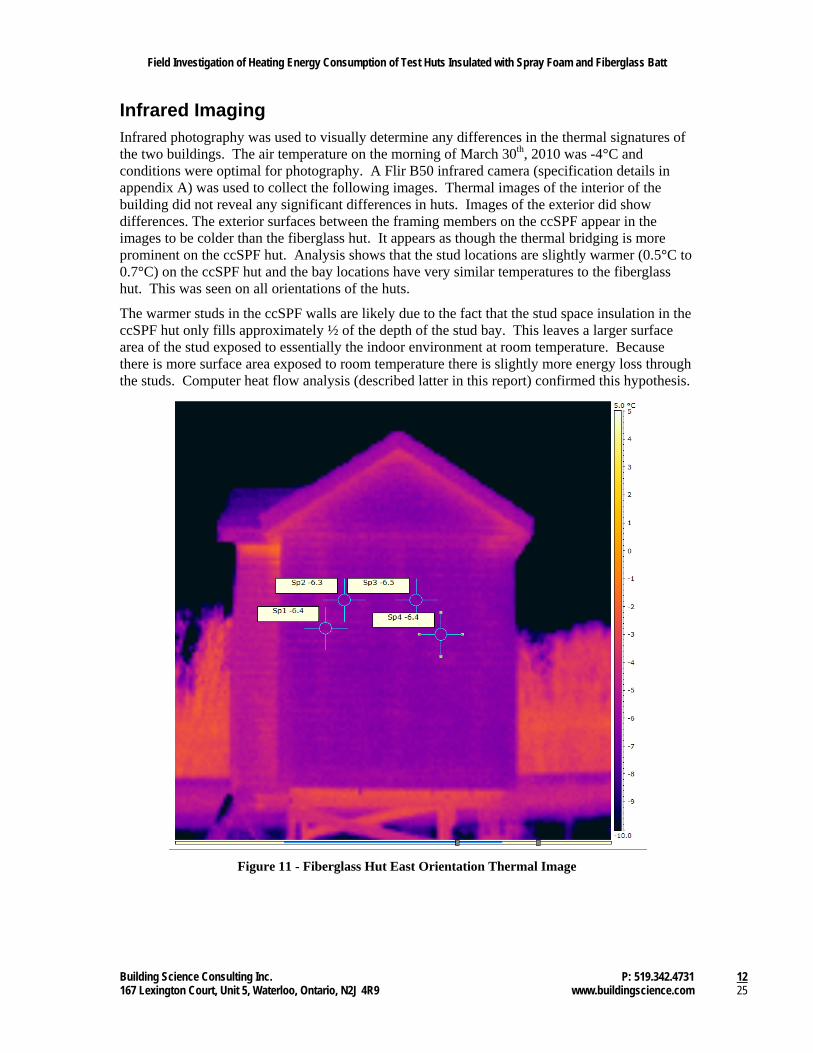
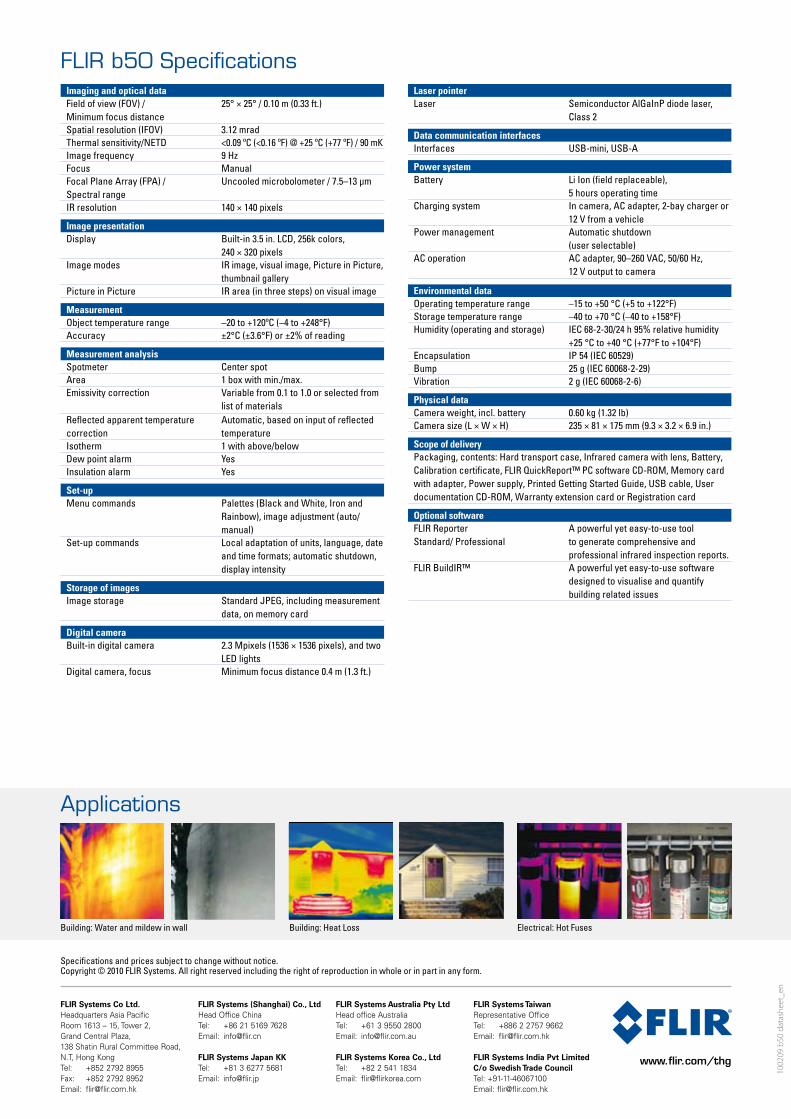
Infrared Imaging Infrared photography was used to visually determine any differences in the thermal signatures of the two buildings. The air temperature on the morning of March 30th, 2010 was -4°C and conditions were optimal for photography. A Flir B50 infrared camera (specification details in appendix A) was used to collect the following images. Thermal images of the interior of the building did not reveal any significant differences in huts. Images of the exterior did show differences. The exterior surfaces between the framing members on the ccSPF appear in the images to be colder than the fiberglass hut. It appears as though the thermal bridging is more prominent on the ccSPF hut. Analysis shows that the stud locations are slightly warmer (0.5°C to 0.7°C) on the ccSPF hut and the bay locations have very similar temperatures to the fiberglass hut. This was seen on all orientations of the huts.
The warmer studs in the ccSPF walls are likely due to the fact that the stud space insulation in the ccSPF hut only fills approximately ½ of the depth of the stud bay. This leaves a larger surface area of the stud exposed to essentially the indoor environment at room temperature. Because there is more surface area exposed to room temperature there is slightly more energy loss through the studs. Computer heat flow analysis (described latter in this report) confirmed this hypothesis.
Figure 11 - Fiberglass Hut East Orientation Thermal Image

Field Investigation of Heating Energy Consumption of Test Huts Insulated with Spray Foam and Fiberglass Batt
Building Science Consulting Inc. P: 519.342.4731 13 167 Lexington Court, Unit 5, Waterloo, Ontario, N2J 4R9 www.buildingscience.com 25
Figure 12 - CCSPF Hut East Orientation Thermal Image
Figure 13 – CCSPF and Fiberglass South Orientation Thermal Images
Field Investigation of Heating Energy Consumption of Test Huts Insulated with Spray Foam and Fiberglass Batt
Building Science Consulting Inc. P: 519.342.4731 14 167 Lexington Court, Unit 5, Waterloo, Ontario, N2J 4R9 www.buildingscience.com 25
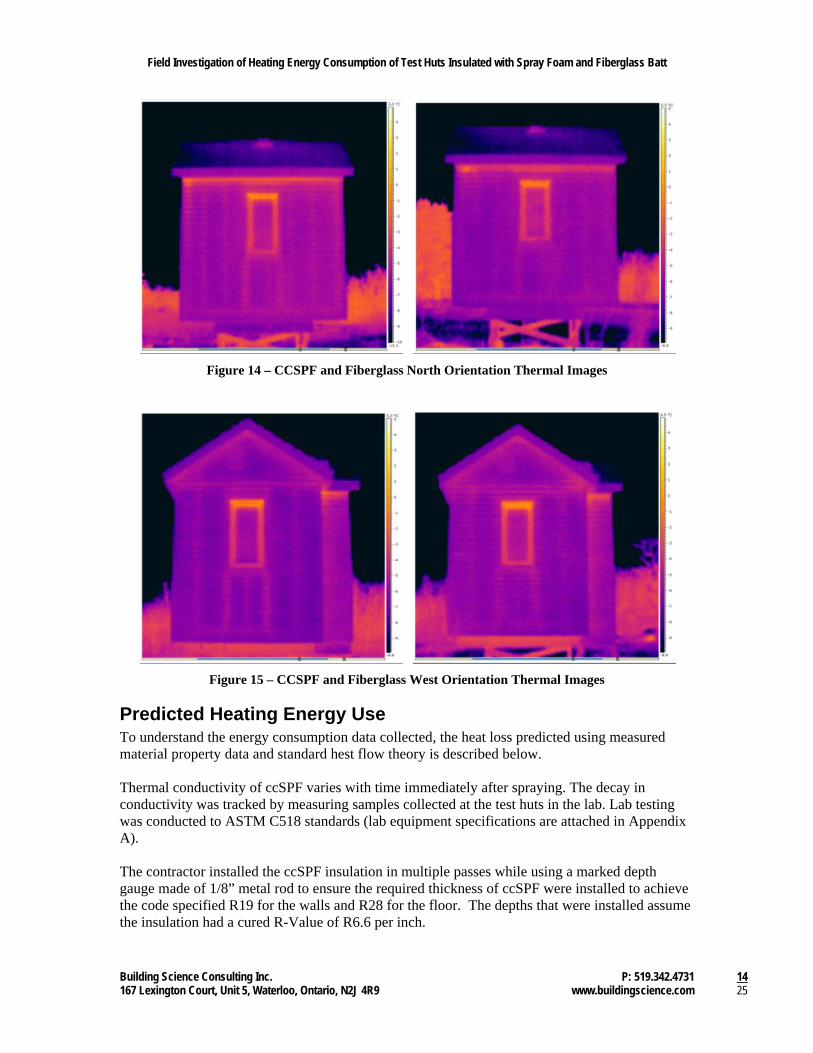
Figure 14 – CCSPF and Fiberglass North Orientation Thermal Images
Figure 15 – CCSPF and Fiberglass West Orientation Thermal Images
Predicted Heating Energy Use To understand the energy consumption data collected, the heat loss predicted using measured material property data and standard hest flow theory is described below. Thermal conductivity of ccSPF varies with time immediately after spraying. The decay in conductivity was tracked by measuring samples collected at the test huts in the lab. Lab testing was conducted to ASTM C518 standards (lab equipment specifications are attached in Appendix A). The contractor installed the ccSPF insulation in multiple passes while using a marked depth gauge made of 1/8” metal rod to ensure the required thickness of ccSPF were installed to achieve the code specified R19 for the walls and R28 for the floor. The depths that were installed assume the insulation had a cured R-Value of R6.6 per inch.
Field Investigation of Heating Energy Consumption of Test Huts Insulated with Spray Foam and Fiberglass Batt
Building Science Consulting Inc. P: 519.342.4731 15 167 Lexington Court, Unit 5, Waterloo, Ontario, N2J 4R9 www.buildingscience.com 25
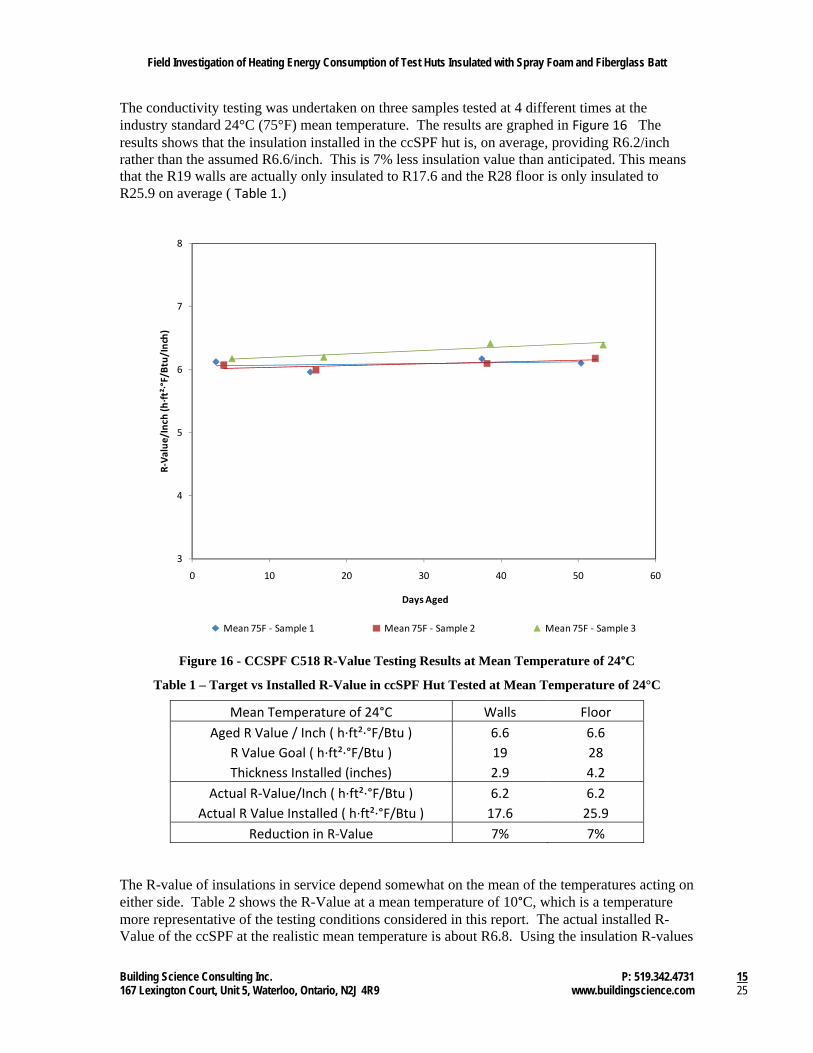
The conductivity testing was undertaken on three samples tested at 4 different times at the industry standard 24°C (75°F) mean temperature. The results are graphed in Figure 16 The results shows that the insulation installed in the ccSPF hut is, on average, providing R6.2/inch rather than the assumed R6.6/inch. This is 7% less insulation value than anticipated. This means that the R19 walls are actually only insulated to R17.6 and the R28 floor is only insulated to R25.9 on average ( Table 1.)
Figure 16 - CCSPF C518 R-Value Testing Results at Mean Temperature of 24°C
Table 1 – Target vs Installed R-Value in ccSPF Hut Tested at Mean Temperature of 24°C
Mean Temperature of 24°C Walls Floor
Aged R Value / Inch ( h∙ft²∙°F/Btu ) 6.6 6.6
R Value Goal ( h∙ft²∙°F/Btu ) 19 28
Thickness Installed (inches) 2.9 4.2
Actual R‐Value/Inch ( h∙ft²∙°F/Btu ) 6.2 6.2
Actual R Value Installed ( h∙ft²∙°F/Btu ) 17.6 25.9
Reduction in R‐Value 7% 7%
The R-value of insulations in service depend somewhat on the mean of the temperatures acting on either side. Table 2 shows the R-Value at a mean temperature of 10°C, which is a temperature more representative of the testing conditions considered in this report. The actual installed R-Value of the ccSPF at the realistic mean temperature is about R6.8. Using the insulation R-values
3
4
5
6
7
8
0 10 20 30 40 50 60
R‐Value/Inch
(h∙ft²∙°F/Btu/Inch)
Days Aged
Mean 75F ‐ Sample 1 Mean 75F ‐ Sample 2 Mean 75F ‐ Sample 3

Field Investigation of Heating Energy Consumption of Test Huts Insulated with Spray Foam and Fiberglass Batt
Building Science Consulting Inc. P: 519.342.4731 16 167 Lexington Court, Unit 5, Waterloo, Ontario, N2J 4R9 www.buildingscience.com 25
from Table 2, the hut’s heat loss can be calculated while accounting for air films, OSB sheathing, drywall, and the thermal bridging of the framing. The actual heat loss predicted, including temperature effects and thermal bridging is 319 Watts when it is 0 C outdoors and 21C indoors.
Table 2 - Reduction of Installed R-Value in ccSPF Hut tested at Mean Temperature of 10°C
Mean Temperature of 10°C Walls Floor
Aged R Value / Inch ( h∙ft²∙°F/Btu ) 6.6 6.6
R Value Goal ( h∙ft²∙°F/Btu ) 19 28
Thickness Installed (inches) 2.9 4.2
Actual R‐Value/Inch ( h∙ft²∙°F/Btu ) 6.8 6.8
Actual R Value Installed ( h∙ft²∙°F/Btu ) 19.6 28.9
Increase in R‐Value 3% 3%
Table 3 - Heat Loss compared to Installed R-Values in ccSPF Hut
Insulation Heat Loss at 0°C
Ambient (Watts)
Percent Change
in Heating Load
Assumed R 6.6/inch (at 24°C Mean) 323
As Installed and Tested R 6.2/inch (at 24°C Mean) 331 2.5%
As Installed and Tested R 6.8/inch (at 10°C Mean) 319 ‐1.3%
The R-value of the fiberglass batts in the wall cavity were reduced from their nominal value due to the fact that they are compressed during installation into 5.5” deep stud bays. The reduction in mean temperature in service resulted in an increase in performance (as for the SPF). The ccSPF was installed at R6.2 per inch, but the mean temperature reduction showed an effective R6.8 per inch. The installed insulation R-values at a mean temperature of 10°C were used to calculated the heat losses shown in Table 4 and Table 5.
Field Investigation of Heating Energy Consumption of Test Huts Insulated with Spray Foam and Fiberglass Batt
Building Science Consulting Inc. P: 519.342.4731 17 167 Lexington Court, Unit 5, Waterloo, Ontario, N2J 4R9 www.buildingscience.com 25
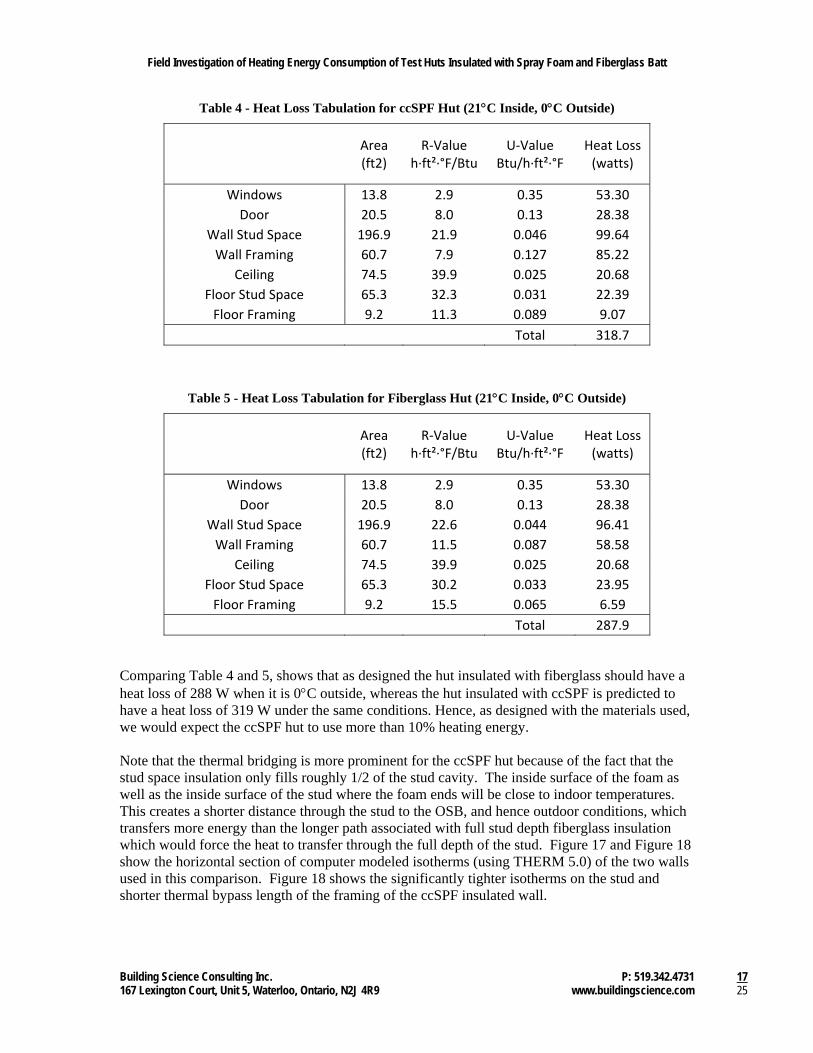
Table 4 - Heat Loss Tabulation for ccSPF Hut (21C Inside, 0C Outside)
Area (ft2)
R‐Value h∙ft²∙°F/Btu
U‐Value Btu/h∙ft²∙°F
Heat Loss (watts)
Windows 13.8 2.9 0.35 53.30
Door 20.5 8.0 0.13 28.38
Wall Stud Space 196.9 21.9 0.046 99.64
Wall Framing 60.7 7.9 0.127 85.22
Ceiling 74.5 39.9 0.025 20.68
Floor Stud Space 65.3 32.3 0.031 22.39
Floor Framing 9.2 11.3 0.089 9.07
Total 318.7
Table 5 - Heat Loss Tabulation for Fiberglass Hut (21C Inside, 0C Outside)
Area (ft2)
R‐Value h∙ft²∙°F/Btu
U‐Value Btu/h∙ft²∙°F
Heat Loss (watts)
Windows 13.8 2.9 0.35 53.30
Door 20.5 8.0 0.13 28.38
Wall Stud Space 196.9 22.6 0.044 96.41
Wall Framing 60.7 11.5 0.087 58.58
Ceiling 74.5 39.9 0.025 20.68
Floor Stud Space 65.3 30.2 0.033 23.95
Floor Framing 9.2 15.5 0.065 6.59
Total 287.9
Comparing Table 4 and 5, shows that as designed the hut insulated with fiberglass should have a heat loss of 288 W when it is 0C outside, whereas the hut insulated with ccSPF is predicted to have a heat loss of 319 W under the same conditions. Hence, as designed with the materials used, we would expect the ccSPF hut to use more than 10% heating energy. Note that the thermal bridging is more prominent for the ccSPF hut because of the fact that the stud space insulation only fills roughly 1/2 of the stud cavity. The inside surface of the foam as well as the inside surface of the stud where the foam ends will be close to indoor temperatures. This creates a shorter distance through the stud to the OSB, and hence outdoor conditions, which transfers more energy than the longer path associated with full stud depth fiberglass insulation which would force the heat to transfer through the full depth of the stud. Figure 17 and Figure 18 show the horizontal section of computer modeled isotherms (using THERM 5.0) of the two walls used in this comparison. Figure 18 shows the significantly tighter isotherms on the stud and shorter thermal bypass length of the framing of the ccSPF insulated wall.

Field Investigation of Heating Energy Consumption of Test Huts Insulated with Spray Foam and Fiberglass Batt
Building Science Consulting Inc. P: 519.342.4731 18 167 Lexington Court, Unit 5, Waterloo, Ontario, N2J 4R9 www.buildingscience.com 25
Outdoors at 0°C
Indoors at 21°C
Figure 17 - Thermal Gradients of Fiberglass Insulated Wall
Because thermal bridging of the ccSPF hut is a significant portion of the heating load, the thermal bypass path length (and hence resistance to heat flow) is important. To determine the path length, a THERM model was created and the path length was estimated based on the thermal gradients through the wall. The location was chosen as the point where the gradients start more prominently and was measured from the face of the ccSPF. The length was found to be approximately 0.5” in front of the finished ccSPF insulation. To confirm that the path length chosen for the heat load calculations was logical, another THERM model was created and the clear wall R-value was compared to a parallel path calculated R-value using the assumed path length through the stud. The two calculations coincided and the thermal bypass length was used for the heat load calculations.
The thermal bridging identified by the infrared photography reported earlier was confirmed by the THERM modeling. The results are presented in Table 6. The ccSPF insulated hut shows significantly warmer exterior stud temperatures, while it showed warmer drywall interface temperatures on the interior.

Field Investigation of Heating Energy Consumption of Test Huts Insulated with Spray Foam and Fiberglass Batt
Building Science Consulting Inc. P: 519.342.4731 19 167 Lexington Court, Unit 5, Waterloo, Ontario, N2J 4R9 www.buildingscience.com 25
Outdoors at 0°C
Indoors at 21°C
Figure 18 - Thermal Gradients of ccSPF Insulated Wall
The fiberglass batt R-Values were also adjusted for the fact that at lower testing temperatures the batts also perform at a higher R-value. The fiberglass batt R-values were determined from ASTM C518 testing as for the ccSPF values.
Table 6 - Installed R-Value and Surface Temperatures in THERM Modeling
Installed R‐value
U‐ValueClear Wall
W/m2K
R‐Value Clear Wall h∙ft²∙°F/Btu
Interior Stud Temp at Drywall
(°C)
Exterior Stud
Temp at OSB (°C)
As Built Fiberglass Batt at Mean 10°C
20.5 0.2805 20.2 19.3 1.1
As Built ccSPF at R6.8/inch and Mean 10°C
19.7 0.2955 19.2 19.8 2.0
Air tightness tests were completed to verify that the huts have similar air leakage characteristics. Ensuring the huts have similar air leakage characteristics removes the possibility that either hut has more or less heating requirements due to the air leakage. The test results show that the air leakage at 50Pa pressure difference of the two huts is within 2% of one another. The ccSPF tested at 54 CFM 50 with 99.99% correlation while the fiberglass hut tested at 55 CFM50 with 99.99% correlation. At the test pressure, the air leakage values correlate to 0.11 CFM per ft2 for the CCSPF hut and 0.12 CFM per ft2 for the fiberglass hut. The huts were both very well air sealed: the Canadian ENERGY STAR for Homes requirement for air tightness is 0.2 CFM per ft2, meaning these huts are almost twice as airtight as a Canadian ENERGY STAR single detached home. The heating load due to air leakage, at a more realistic estimated in-service pressure gradient of approximately 1Pa, is 39 watts for the fiberglass hut and 38 watts for the ccSPF hut as shown in Table 7, a 1.8% difference. Note that air leakage comprises about 12.5% of the heat loss of the huts.
Field Investigation of Heating Energy Consumption of Test Huts Insulated with Spray Foam and Fiberglass Batt
Building Science Consulting Inc. P: 519.342.4731 20 167 Lexington Court, Unit 5, Waterloo, Ontario, N2J 4R9 www.buildingscience.com 25
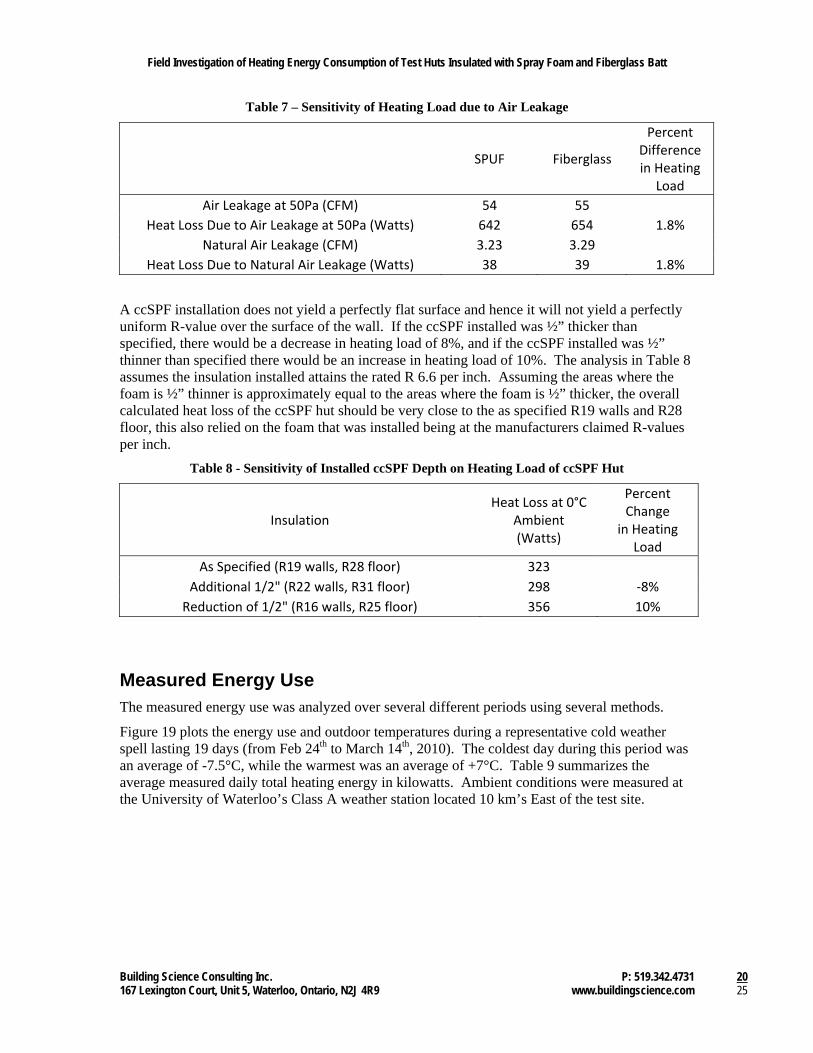
Table 7 – Sensitivity of Heating Load due to Air Leakage
SPUF Fiberglass
Percent Difference in Heating
Load
Air Leakage at 50Pa (CFM) 54 55
Heat Loss Due to Air Leakage at 50Pa (Watts) 642 654 1.8%
Natural Air Leakage (CFM) 3.23 3.29
Heat Loss Due to Natural Air Leakage (Watts) 38 39 1.8%
A ccSPF installation does not yield a perfectly flat surface and hence it will not yield a perfectly uniform R-value over the surface of the wall. If the ccSPF installed was ½” thicker than specified, there would be a decrease in heating load of 8%, and if the ccSPF installed was ½” thinner than specified there would be an increase in heating load of 10%. The analysis in Table 8 assumes the insulation installed attains the rated R 6.6 per inch. Assuming the areas where the foam is ½” thinner is approximately equal to the areas where the foam is ½” thicker, the overall calculated heat loss of the ccSPF hut should be very close to the as specified R19 walls and R28 floor, this also relied on the foam that was installed being at the manufacturers claimed R-values per inch.
Table 8 - Sensitivity of Installed ccSPF Depth on Heating Load of ccSPF Hut
Insulation Heat Loss at 0°C
Ambient (Watts)
Percent Change
in Heating Load
As Specified (R19 walls, R28 floor) 323
Additional 1/2" (R22 walls, R31 floor) 298 ‐8%
Reduction of 1/2" (R16 walls, R25 floor) 356 10%
Measured Energy Use The measured energy use was analyzed over several different periods using several methods.
Figure 19 plots the energy use and outdoor temperatures during a representative cold weather spell lasting 19 days (from Feb 24th to March 14th, 2010). The coldest day during this period was an average of -7.5°C, while the warmest was an average of +7°C. Table 9 summarizes the average measured daily total heating energy in kilowatts. Ambient conditions were measured at the University of Waterloo’s Class A weather station located 10 km’s East of the test site.

Field Investigation of Heating Energy Consumption of Test Huts Insulated with Spray Foam and Fiberglass Batt
Building Science Consulting Inc. P: 519.342.4731 21 167 Lexington Court, Unit 5, Waterloo, Ontario, N2J 4R9 www.buildingscience.com 25
Figure 19 - Daily Total Heating Energy Comparison February 24th to March 14th
Over this entire 19 day period, the energy consumption of the huts was 101.2 kWh and 110.2 kWh. The fiberglass insulated hut used 9% more heating energy.
Table 9 - Daily Total Heating Energy Comparison February 24th to March 14th
ccSPF Hut Fiberglass Hut
Average Measured Daily Total Heating Energy (kWh) (Feb 24th ‐ Mar 14th, Avg Outdoor T of ‐0.6°C)
101.2 110.2
When considering a longer analysis period, including the entire month of March, heating the fiberglass hut required 10% more energy than the ccSPF hut. This is shown in Table 10.
Table 10- Daily Total Heating Energy Comparison February 24th to March 31st
ccSPF Hut Fiberglass Hut
Average Measured Daily Total Heating Energy (kWh) (Feb 24th ‐ Mar 31st, Avg Outdoor T of +1.5°C)
171.7 190.3
‐10
‐5
0
5
10
15
20
25
30
0
1
2
3
4
5
6
7
8
9
10
Average
Daily Ambient Temperature (C)
Daily Total Heating Energy (kWhr)
SPUF Daily Energy Use Fibreglass Daily Energy Use Ambient T
Field Investigation of Heating Energy Consumption of Test Huts Insulated with Spray Foam and Fiberglass Batt
Building Science Consulting Inc. P: 519.342.4731 22 167 Lexington Court, Unit 5, Waterloo, Ontario, N2J 4R9 www.buildingscience.com 25
Solar gain through the windows in the huts contributed to heating during the daylight hours. In general, the heat demand by the electric heaters showed significant drops during the daylight hours on sunny days. This solar gain should benefit each of the huts identically, and such solar gains also provide a benefit in real buildings. However, to compare measured results to the predictions made in the previous section, it is necessary to eliminate the impact of solar heating.
To achieve this goal, only the heating need during the hours between midnight and 6 am were considered (this should avoid any stored solar heat from the daytime, and eliminate any solar gain from the sun in the morning).
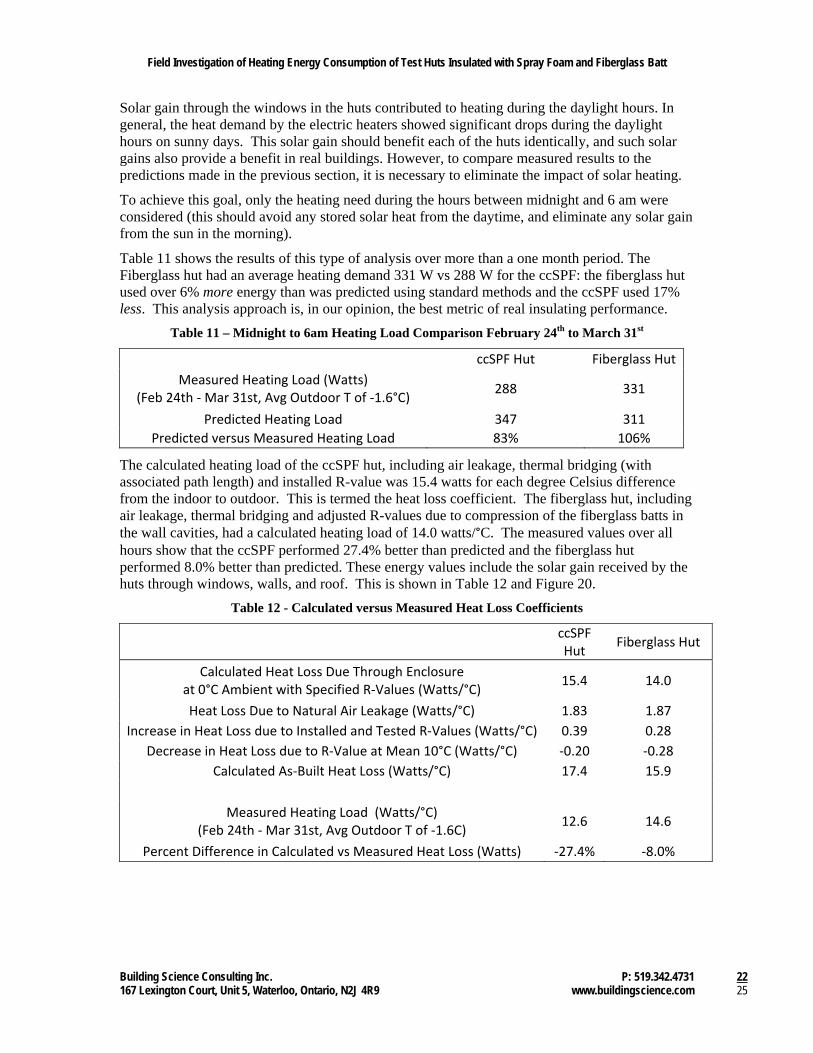
Table 11 shows the results of this type of analysis over more than a one month period. The Fiberglass hut had an average heating demand 331 W vs 288 W for the ccSPF: the fiberglass hut used over 6% more energy than was predicted using standard methods and the ccSPF used 17% less. This analysis approach is, in our opinion, the best metric of real insulating performance.
Table 11 – Midnight to 6am Heating Load Comparison February 24th to March 31st
ccSPF Hut Fiberglass Hut
Measured Heating Load (Watts) (Feb 24th ‐ Mar 31st, Avg Outdoor T of ‐1.6°C)
288 331
Predicted Heating Load 347 311
Predicted versus Measured Heating Load 83% 106%
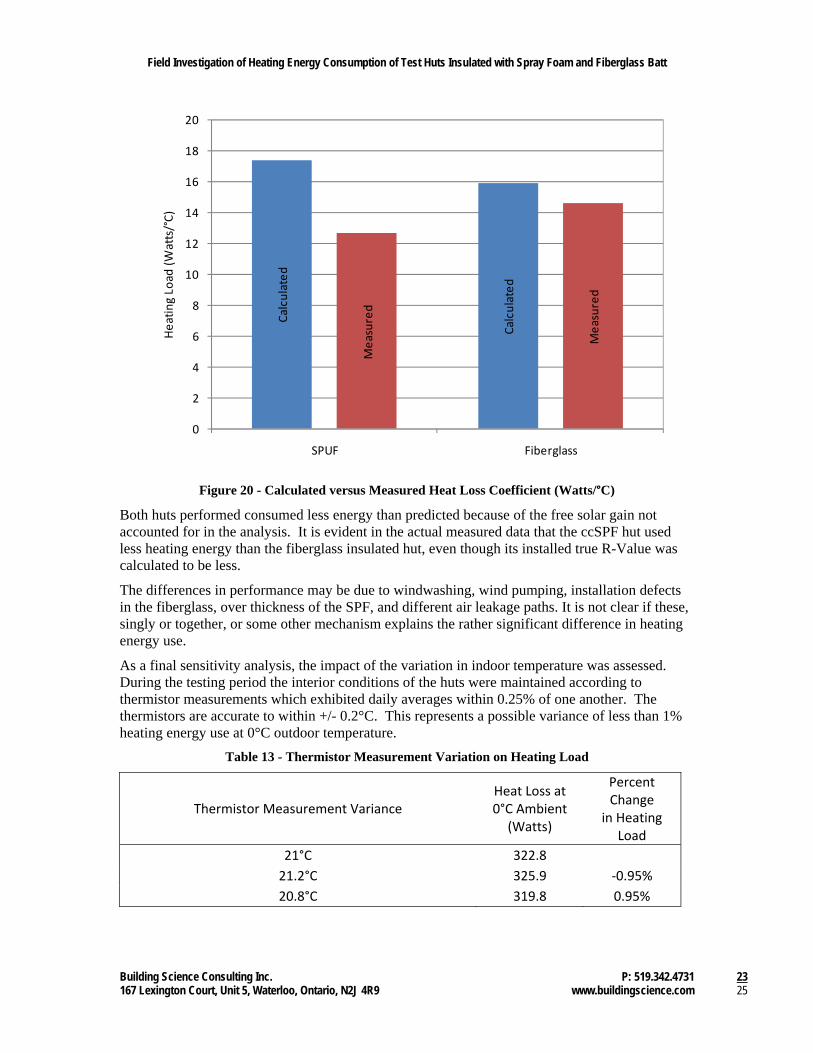
The calculated heating load of the ccSPF hut, including air leakage, thermal bridging (with associated path length) and installed R-value was 15.4 watts for each degree Celsius difference from the indoor to outdoor. This is termed the heat loss coefficient. The fiberglass hut, including air leakage, thermal bridging and adjusted R-values due to compression of the fiberglass batts in the wall cavities, had a calculated heating load of 14.0 watts/°C. The measured values over all hours show that the ccSPF performed 27.4% better than predicted and the fiberglass hut performed 8.0% better than predicted. These energy values include the solar gain received by the huts through windows, walls, and roof. This is shown in Table 12 and Figure 20.
Table 12 - Calculated versus Measured Heat Loss Coefficients
ccSPF Hut
Fiberglass Hut
Calculated Heat Loss Due Through Enclosure at 0°C Ambient with Specified R‐Values (Watts/°C)
15.4 14.0
Heat Loss Due to Natural Air Leakage (Watts/°C) 1.83 1.87
Increase in Heat Loss due to Installed and Tested R‐Values (Watts/°C) 0.39 0.28
Decrease in Heat Loss due to R‐Value at Mean 10°C (Watts/°C) ‐0.20 ‐0.28
Calculated As‐Built Heat Loss (Watts/°C) 17.4 15.9
Measured Heating Load (Watts/°C) (Feb 24th ‐ Mar 31st, Avg Outdoor T of ‐1.6C)
12.6 14.6
Percent Difference in Calculated vs Measured Heat Loss (Watts) ‐27.4% ‐8.0%
Field Investigation of Heating Energy Consumption of Test Huts Insulated with Spray Foam and Fiberglass Batt
Building Science Consulting Inc. P: 519.342.4731 23 167 Lexington Court, Unit 5, Waterloo, Ontario, N2J 4R9 www.buildingscience.com 25
Figure 20 - Calculated versus Measured Heat Loss Coefficient (Watts/°C)
Both huts performed consumed less energy than predicted because of the free solar gain not accounted for in the analysis. It is evident in the actual measured data that the ccSPF hut used less heating energy than the fiberglass insulated hut, even though its installed true R-Value was calculated to be less.
The differences in performance may be due to windwashing, wind pumping, installation defects in the fiberglass, over thickness of the SPF, and different air leakage paths. It is not clear if these, singly or together, or some other mechanism explains the rather significant difference in heating energy use.
As a final sensitivity analysis, the impact of the variation in indoor temperature was assessed. During the testing period the interior conditions of the huts were maintained according to thermistor measurements which exhibited daily averages within 0.25% of one another. The thermistors are accurate to within +/- 0.2°C. This represents a possible variance of less than 1% heating energy use at 0°C outdoor temperature.
Table 13 - Thermistor Measurement Variation on Heating Load
Thermistor Measurement Variance Heat Loss at 0°C Ambient
(Watts)
Percent Change
in Heating Load
21°C 322.8
21.2°C 325.9 ‐0.95%
20.8°C 319.8 0.95%
Calculated
Calculated
Measured
Measured
0
2
4
6
8
10
12
14
16
18
20
SPUF Fiberglass
Heating Load
(Watts/°C)
Field Investigation of Heating Energy Consumption of Test Huts Insulated with Spray Foam and Fiberglass Batt
Building Science Consulting Inc. P: 519.342.4731 24 167 Lexington Court, Unit 5, Waterloo, Ontario, N2J 4R9 www.buildingscience.com 25
Conclusions and Recommendations Two structurally identical test huts were constructed with details typical of residential wood frame construction in Ontario. One of the huts was insulated with fiberglass batt insulation and the other with ccSPF. The huts were tested and shown to have almost identical air leakage characteristics, and were accurately maintained at the same temperature during the winter test period while the heating energy consumption was monitored.
Thermal images of the exterior of the huts showed differences in thermal signatures. Thermal bridging is more prominent on the ccSPF hut because the foam does not fill the stud bay. This leaves a larger surface area of the stud exposed to essentially the indoor environment at room temperature. Because there is more surface area exposed, and the thermal bypass length is shorter, there is slightly more energy loss through the studs.
Laboratory C518 thermal conductivity testing showed that the insulation installed in the ccSPF hut is (averaged over three samples), providing R6.2/inch, which is 7% less insulation value than anticipated (R6.6/inch) at the industry standard 24°C (75°F) mean temperature. This means that the planned R19 wall insulation layer is actually R17.6 in the hut and the R28 floor insulation layer is actually R25.9.
Both huts were framed identically, had nearly identical tested air leakage rates, and the same attic insulation material and quantity. The ccSPF insulated hut with R17.6 ccSPF in the walls and R25.9 ccSPF in the floor consumed 9.7% less heating energy than the otherwise-identical fiberglass batt insulated hut with R19 batt in the walls and R28 batt in the floor over a cold weather period lasting 35 days. The measured heating energy values show that the ccSPF consumed 27.4% less heating energy than predicted (when the actual installed R-values are considered) and the fiberglass hut consumed 8.0% less than predicted. The predicted heating energy comparison used measured material R-values for mean temperatures of 10°C for both the ccSPF and the fiberglass insulation, and included all thermal bridging effects. Solar heat gain through windows and on hut surfaces provided some free heat and helped explain the deviations from theory.
To remove the effect of solar gain, the heating energy consumption patterns was analyzed using data from nighttime periods only. Using this method, the fiberglass hut had an average heating demand of 331 W vs 288 W for the ccSPF: the fiberglass hut used almost 6% more energy than was predicted using standard prediction methods and the ccSPF used 17% less. This analysis approach is, in our opinion, the best metric of real insulating performance.
The evidence from these carefully controlled real field exposure test huts is that ccSPF exceeds its expected performance (when the installed R-value is known). The reasons for the improved performance are uncertain: it may be because of less convective looping and/or less wind washing, the impact of temperature, or some other cause. However, the experimental approach taken did aim to eliminate the impact of thermal bridging and air leakage, the two largest causes of performance variation in real houses. Further research would be necessary to identify the reasons.

Field Investigation of Heating Energy Consumption of Test Huts Insulated with Spray Foam and Fiberglass Batt
Building Science Consulting Inc. P: 519.342.4731 25 167 Lexington Court, Unit 5, Waterloo, Ontario, N2J 4R9 www.buildingscience.com 25
Appendix A
FLIR Specifications
C518 Testing Equipment Specification

VISUAL IR
FLIR b-Series
FLIR b50
Fusion (3 steps Picture in Picture)Allows for easier identification and interpretation of infrared images. This advanced technology enhances the value of an infrared image by allowing you to overlay it directly over the corresponding visible image. This functionality combines the benefits of both the infrared image and visual picture at the push of a button.
Digital Camera• — 2.3 Megapixels with built-in LED lights provides sharp images regardless of lighting conditions
Picture in Picture (PiP)• — Displays resizable IR image super-imposed over a digital image
Wide Temperature Range• — Measures from -20 °C to +120 °C targeting building applications
± 2% Accuracy• — Reliable temperature measurement
Insulation alarm• — Shows the insulation performance of the building structure
Dew point alarm • — Alerts you to the areas where there is a risk of condensation
Thumbnail Image Gallery• — Allows quick search of stored images
Laser Pointer• — Pinpoints the hot spot on the IR image with the real physical target
Micro SD Card• — Stores more than 2000 radiometric JPEG images
FLIR b50 Features
140 x 140 pixel resolution Fusion (3 steps PiP)
FLIR b50 a lightweight, competent infrared camera. Li Ion batteries allow work for 5 hours without interruption of charging. The FLIR LED lights make it possible to work even in dark environments. Insulation alarm and Dew point alarm are perfect in a building site. The visual 2.3 Mpixel digital camera and three step Fusion Picture in Picture functionality helps produce radiometric JPEG images in a professional way. FLIR QuickReport™ software makes it possible to analyze IR and visual pictures captured in field back in the office.
Built-in LED lights Thumbnail Image Gallery
IR resolution 140 x 140 pixels
Digital camera 1536 x 1536 pixels
Lightweight 600 g
Laser Pointer
Copy to USB
Fusion (3 steps Picture in Picture)
5 hours battery
LED lights
21 languages
Dew point & Insulation alarm
NETD 90 mK
5 hours
140140
x
2.3MEGAPIXELS
HIGH SENSITIVITY
< 90 mK
FLIR b50 SpecificationsImaging and optical dataField of view (FOV) / Minimum focus distance
25° × 25° / 0.10 m (0.33 ft.)
Spatial resolution (IFOV) 3.12 mradThermal sensitivity/NETD <0.09 ºC (<0.16 ºF) @ +25 ºC (+77 ºF) / 90 mKImage frequency 9 HzFocus ManualFocal Plane Array (FPA) / Spectral range
Uncooled microbolometer / 7.5–13 µm
IR resolution 140 × 140 pixels
Image presentationDisplay Built-in 3.5 in. LCD, 256k colors,
240 × 320 pixelsImage modes IR image, visual image, Picture in Picture,
thumbnail galleryPicture in Picture IR area (in three steps) on visual image
MeasurementObject temperature range –20 to +120ºC (–4 to +248°F) Accuracy ±2°C (±3.6°F) or ±2% of reading
Measurement analysisSpotmeter Center spotArea 1 box with min./max.Emissivity correction Variable from 0.1 to 1.0 or selected from
list of materialsReflected apparent temperature correction
Automatic, based on input of reflected temperature
Isotherm 1 with above/belowDew point alarm YesInsulation alarm Yes
Set-upMenu commands Palettes (Black and White, Iron and
Rainbow), image adjustment (auto/manual)
Set-up commands Local adaptation of units, language, date and time formats; automatic shutdown, display intensity
Storage of imagesImage storage Standard JPEG, including measurement
data, on memory card
Digital cameraBuilt-in digital camera 2.3 Mpixels (1536 × 1536 pixels), and two
LED lightsDigital camera, focus Minimum focus distance 0.4 m (1.3 ft.)
Laser pointerLaser Semiconductor AlGaInP diode laser,
Class 2
Data communication interfacesInterfaces USB-mini, USB-A
Power systemBattery Li Ion (field replaceable),
5 hours operating timeCharging system In camera, AC adapter, 2-bay charger or
12 V from a vehiclePower management Automatic shutdown
(user selectable)AC operation AC adapter, 90–260 VAC, 50/60 Hz,
12 V output to camera
Environmental dataOperating temperature range –15 to +50 °C (+5 to +122°F)Storage temperature range –40 to +70 °C (–40 to +158°F)Humidity (operating and storage) IEC 68-2-30/24 h 95% relative humidity
+25 °C to +40 °C (+77°F to +104°F)Encapsulation IP 54 (IEC 60529)Bump 25 g (IEC 60068-2-29)Vibration 2 g (IEC 60068-2-6)
Physical dataCamera weight, incl. battery 0.60 kg (1.32 lb)Camera size (L × W × H) 235 × 81 × 175 mm (9.3 × 3.2 × 6.9 in.)
Scope of deliveryPackaging, contents: Hard transport case, Infrared camera with lens, Battery, Calibration certificate, FLIR QuickReport™ PC software CD-ROM, Memory card with adapter, Power supply, Printed Getting Started Guide, USB cable, User documentation CD-ROM, Warranty extension card or Registration card
Optional softwareFLIR Reporter Standard/ Professional
A powerful yet easy-to-use tool to generate comprehensive and professional infrared inspection reports.
FLIR BuildIR™ A powerful yet easy-to-use software designed to visualise and quantify building related issues
www.flir.com/thg
Specifications and prices subject to change without notice.Copyright © 2010 FLIR Systems. All right reserved including the right of reproduction in whole or in part in any form.
Applications
Building: Water and mildew in wall Electrical: Hot FusesBuilding: Heat Loss
1002
09 b
50 d
atas
heet
_en
FLIR Systems Co Ltd.Headquarters Asia PacificRoom 1613 – 15, Tower 2,Grand Central Plaza, 138 Shatin Rural Committee Road,N.T, Hong KongTel: +852 2792 8955Fax: +852 2792 8952Email: [email protected]
FLIR Systems (Shanghai) Co., LtdHead Office ChinaTel: +86 21 5169 7628Email: [email protected] FLIR Systems Japan KKTel: +81 3 6277 5681Email: [email protected]
FLIR Systems Australia Pty LtdHead office AustraliaTel: +61 3 9550 2800Email: [email protected] FLIR Systems Korea Co., LtdTel: +82 2 541 1834Email: [email protected]
FLIR Systems TaiwanRepresentative OfficeTel: +886 2 2757 9662 Email: [email protected]
FLIR Systems India Pvt LimitedC/o Swedish Trade CouncilTel: +91-11-46067100Email: [email protected]

aserComp fox314
Conforms to ASTM C 518 & ISO 8301
Specimen size 300 mm sq. (12”)
Thickness Range from 0 to 102 mm (4”)
Compact size
Accuracy better than 1%
Easy to use, rapid operation
Microprocessor based
Stand alone operation
Solid state cooling\heating
Operation from –30C to 95C (plate)
Digital Thickness readout to 0.001”
Powerful 24 Bit A/D Converter
Two Thin-Film Heat Flux Transducers
Temperature Control to 0.01C
Interfaces to a computer
Ideal for slices of Cellular Plastics
No need to calibrate for years
Full One Year Parts and Labor Warranty
Suitable for R&D and QC testing
Win_Therm Software extends flexibility
Extremely energy efficient
Simplicity of use:
Place the specimen in the test chamber, close thedoor and answer several prompts displayed on aclear 4 line alphanumeric LCD display. The Instru-ment does the rest.
The plate spacing is adjusted automatically to thedesired specimen thickness (accurate to 0.001”).The sophisticated digital temperature control algo-rithm monitors the plate temperatures 20 timesper second and rapidly brings the system to theselected equilibrium test condition. Tests can beperformed repeatedly at one temperature or at upto 9 user selected temperatures between –30Cand 95C. The test results can be output to thehost computer.
THERMAL CONDUCTIVITY INSTRUMENT
20 Spring Street, Saugus, MA 01906, voice 781-233-1717, fax 781-941-2484www.lasercomp.com E-mail: [email protected]

Instrument Description and Procedure
The FOX314 instrument consists of two basicsections: the top section and the base. All theelectronics are housed in the base section. The topsection of the instrument is the actual test chamber.Once the door is opened, the sample can be placedbetween the two plates in the test stack. The upperplate is stationary. The lower plate can move up anddown. It is powered by four independently controlledmotors. The position of each corner of the bottomplate is monitored and controlled by a sophisticateddigital thickness readout system with 0.025 mm(0.001”) precision. Two options for thickness are available. Auto Thickness will cause the lower plate toraise and close on the sample, displaying thickness.User Defined Thickness will allow the user to enterthe desired sample test thickness. This mode is usedfor compressible samples. The instrument will attainthe specified sample thickness, specimen permitting.In either case the displayed results will be accurate towithin 0.025mm (0.001”). Pressing ENT will initiate the test at the first setpoint. The instrumentautomatically advances to the next setpoints if morethan one were entered. The results are displayed atthe end of the test.
Transducers and Thermocouples
A high output Thin Film Heat Flux Transducer,developed by LaserComp, is permanently bonded tothe surface of each plate. The transducers are of theintegrating type with a 4"(101mm) square active areain the center. Overall thickness is only 0.040",precluding heat flow distortion. A type Ethermocouple is bonded in the center of eachtransducer and both are sealed to insure consistentprecision over time. Because each is within 0.005" ofthe sample’s surface they provide accurate readings of the sample’s surface temperature and heat flux. The same thermocouple is used for control of theplate temperature.
Electronic Power and Control
At the heart of the FOX314 instrument is a verypowerful Digital Signal Processor and a 24 Bit Analogto Digital Converter. The A/D Converter converts thesignals from the thermocouples and heat flowtransducers to the digital domain. The resolution onthe conversion is 0.6 V. This translates to aresolution of 0.01C for temperature. For typicalsamples the resolution of transducer readings is0.05%.The DSP controls all aspects of the instrument’s operation, from the user interface to sending data tothe host computer and calculating the results. TheDSP’s most important task is to monitor the
temperatures of the plates and to perform amultistage PID algorithm to control the plates at +/-0.01C of the test setpoint temperature. Based on theoutcome of the algorithm, new control signals aresent to the Power Output Board in each acquisitioncycle (every 0.5 sec.). The Power Output Boardprovides the power to the solid state heating/coolingsystem in each plate. Both plates can be heated andcooled allowing for testing with heat flow up or down.The low thermal mass design of the plates combinedwith the power of the DSP and Power Output Boardenable extremely fast attainment of setpoints.
Win_Therm Software
WIN_THERM Software package operating underMicrosoft Windows allows for connection of FOXinstruments to an IBM compatible computer through astandard RS 232 interface. Through a series ofwindows all the test parameters and format ofoutputs can be setup and changed at any time duringthe test. The software provides complete control ofthe instrument at all times. All selected data isautomatically stored on a hard disk. Once the testconditions have been set and the test started, thecomputer can be used to display any desired outputsin a series of windows. Two FOX (and as many as 8with modest additional hardware) instruments can berun simultaneously on one host computer.
fox314Specimen Size: 305mm (12”) square 0 to 102mm (4”) thick
Temperature range: -20C to 95C ( -4F to 203F )
Absolute accuracy: +/- 1%
Reproducibility: +/-0.5%
Conductivity range: 0.005 to 0.35 W/mK( 0.035 to 2.4 BTU in/hr ft2F )
Conductance: should not exceed:12W/m2C( 2.0 BTU/h ft2 F )
Utility requirements: 110/220V 50/60 Hzswitchable at 600VAcooling water at 18C or less