re eor rer - Aljazira Capital · Please read Disclaimer on the back Insurance Sector Report Sector...
11
Please read Disclaimer on the back Insurance Sector Report Sector report | KSA | Q3-2017 November 2017 Saudi Insurance Sector- Quarterly Q3-2017 November 2017
-
Upload
nguyenkien -
Category
Documents
-
view
214 -
download
0
Transcript of re eor rer - Aljazira Capital · Please read Disclaimer on the back Insurance Sector Report Sector...

Please read Disclaimer on the back
Insurance Sector Report
Sector report | KSA | Q3-2017
November 2017
Saudi Insurance Sector- QuarterlyQ3-2017
November 2017

Please read Disclaimer on the back
Insurance Sector Report
Sector report | KSA | Q3-2017
November 2017
Company Name Codes
The Company for Cooperative Insurance Tawuniya
Salama Cooperative Insurance Co. Salama
UCA Cooperative Assurance Co. UCA
Al-Rajhi Company for Cooperative Insurance Al Rajihi Takaful
Al Alamiya for Cooperative Insurance Co. Al Alamiya
Allied Cooperative Insurance Group ACIG
Bupa Arabia for Cooperative Insurance Co. Bupa Arabia
Arabian Shield Cooperative Insurance Co. Arabian Shield
Buruj Cooperative Insurance Co. Buruj
Al Sagr Cooperative Insurance Co. Sagr Insurance
Malath Cooperative Insurance Co. Malath Insurance
Solidarity Saudi Takaful Co. Solidarity
Trade Union Cooperative Insurance Co. Trade Union
Sanad Cooperative Insurance Company Sanad
Walaa Cooperative Insurance Co. Walaa
Allianz Saudi Fransi Cooperative Insurance Co. Allianz SF
Al-Ahlia Insurance Co. Al Ahlia
The Mediterranean and Gulf Insurance and Reinsurance Co. MEDGULF
Saudi Indian Company for Cooperative Insurance Wafa Insurance
SABB Takaful Co. SABB Takaful
Saudi Arabian Cooperative Insurance Company SAICO
Gulf Union Cooperative Insurance Co. Gulf Union
Saudi Re for Cooperative Reinsurance Co. Saudi Re
Arabia Insurance Cooperative Company AICC
ALAHLI TAKAFUL COMPANY ATC
AXA Cooperative Insurance Co. AXA-Cooperative
Weqaya Takaful insurance and reinsurance Company Weqaya Takaful
CHUBB Arabia Cooperative Insurance Co. Chubb Arabia
Gulf General Cooperative Insurance Co. Gulf General
Wataniya Insurance Co. Wataniya
Amana Cooperative Insurance Co. Amana Insurance
Saudi Enaya Cooperative Insurance Co. Enaya
Alinma Tokio Marine Co. Alinma Tokio
MetLife AIG ANB Cooperative Insurance Co. MetLife
Aljazira Takaful Taawuni Co. Jazira Takaful
Please read Disclaimer on the back
Insurance Sector Report
Sector report | KSA | Q3-2017
November 2017
GWP-Sector WIse
Health
Motor
Property/ Fire
Others
55%27%
4%4%
10%
Energy
Bupa
Arab
ia
Enay
a
Al R
ajih
iTa
kafu
l
Sala
ma
Mal
ath
Insu
ranc
e
ATC
UCA
Aman
aIn
sura
nce
Alin
ma
Toki
o M
Gul
fG
ener
al
0%10%20%30%40%50%60%70%80%90%
100%
Health
Motor
Protection and Saving
Others
60%
34%
2% 2%
Accident and Liability
Bupa Arabia Tawuniya
Al Rajihi Takaful MEDGULF
Others
30.5%
17.2%
9.0%6.2%
4.5%
32.6%
AXA-Cooperative
Al R
ajih
i Tak
aful
Taw
uniy
a
Saud
i Re
Mal
ath
UCA
Bupa
Ara
bia
Trad
e Un
ion 3.7%
2.66%2.07%
0.8% 0.6%
-5.7%
-2.1%-0.9% -0.6% -0.5%
-8.0%
-6.0%
-4.0%
-2.0%
0.0%
2.0%
4.0%
6.0%
Met
Life
AIG
Ala
rabi
AICC
Arab
ian
Shie
ld
Q1
- 201
7
Q2
- 201
7
Q3
- 201
7
Q2
- 201
2
Q3
- 201
2
Q4
- 201
2
Q1
- 201
3
Q2
- 201
3
Q3
- 201
3
Q4
- 201
3
Q1
- 201
4
Q2
- 201
4
Q3
- 201
4
Q4
- 201
4
Q1
- 201
5
Q2
- 201
5
Q3
- 201
5
Q4
- 201
5
Q1
- 201
6
Q2
- 201
6
Q3
- 201
6
Q4
- 201
6 70%72%74%76%78%80%82%84%86%88%90%
0
2,000
4,000
6,000
8,000
10,000
12,000
Premium Ceded - LHS Retention Ratio - RHS
NPE-Sector Wise
Top 5 and Bottom 5- Retention Ratio Top 5 Gainers and Losers- GWP market Share
Premium Ceded-Industry
Net Premium Earned
Gross Written PremiumGWP (Gross Written Premiums) in Q3-2017 stood at SAR 8.3bn depicting a jump of 0.7% YoY.
NWP (Net Written Premiums) in Q3-2017 stood at SAR 6.9bn, depicting a fall of 2.6%YoY.
NPE (Net Premium Earned) in Q3-2017 at SAR 7.7bn showed a jump of 2.3%YoY.
Health Sector Accounted for 55% of the total GWP, followed by Motor which accounted for 27% of GWP
Market Share
BUPA with 30.5% market share in GWP was the biggest player.
Gainer/Loser: Alrajhi Takaful improved its market share from 5.3% in Q3-2016 to 7.7% in Q3-2017 an improvement of 240bps , followed by Saudi Re which showed an improvement of 266bps. Tawuniya improved its market share from 15.1% in Q3-2017 to 17.2% in Q3-2017.
Retention Ratio: Industry retention ratio stood at 83% in Q3-2017, as compared to 85.8% in Q3-2016. Enaya has the highest retention ratio of 101% in Q3-2017 BUPA Arabia at 98.8% had the second highest retention ratio.
Q1
- 201
7
Q2
- 201
7
Q3
- 201
7
Q2
- 201
2
Q3
- 201
2
Q4
- 201
2
Q1
- 201
3
Q2
- 201
3
Q3
- 201
3
Q4
- 201
3
Q1
- 201
4
Q2
- 201
4
Q3
- 201
4
Q4
- 201
4
Q1
- 201
5
Q2
- 201
5
Q3
- 201
5
Q4
- 201
5
Q1
- 201
6
Q2
- 201
6
Q3
- 201
6
Q4
- 201
6-1,000 2,000 3,000 4,000 5,000 6,000 7,000 8,000
NPE % Growth (YoY) - RHS
-10.0%-5.0%0.0%5.0%10.0%15.0%20.0%25.0%30.0%35.0%
13.4%17.5%
20.4%17.8%
26.9%23.9%
16.9%
24.4%20.9%
27.3%32.1%
25.1% 27.2% 26.1%23.8% 24.8%
19.9%6.8% 2.2% -2.4% -4.4% 2.3%
-8.0%-12.0%
-4.0%0.0%4.0%8.0%12.0%16.0%20.0%24.0%28.0%32.0%
0
2000
4000
6000
8000
10000
12000
GWP - LHS % Growth (YoY) - RHS
Q1
- 201
7
Q2
- 201
7
Q3
- 201
7
Q2
- 201
2
Q3
- 201
2
Q4
- 201
2
Q1
- 201
3
Q2
- 201
3
Q3
- 201
3
Q4
- 201
3
Q1
- 201
4
Q2
- 201
4
Q3
- 201
4
Q4
- 201
4
Q1
- 201
5
Q2
- 201
5
Q3
- 201
5
Q4
- 201
5
Q1
- 201
6
Q2
- 201
6
Q3
- 201
6
Q4
- 201
6
8.0%
14.5%
20.4%18.3% 19.3%
30.2%
12.2%
26.7%22.6% 22.7% 21.5%
24.2% 24.6%16.7%
15.5%
11.9%
2.0%-9.5% -2.1%
-2.2%
-2.6%0.74%
Gross Written Premium- Market Share
Source: Argaam, SAMA1Basis Points

Please read Disclaimer on the back
Insurance Sector Report
Sector report | KSA | Q3-2017
November 2017
Bupa Arabia Tawuniya
MEDGULF Al Rajihi Takaful
Others
Malath AXA
25%25%
25%10%
8%
3%3%
Q3 - 2016 Q3 - 2017
Mal
ath
Insu
ranc
e
MED
GUL
F
Al R
ajih
i Tak
aful
Met
Life
AXA
Bupa
Ara
bia
Waf
a In
sura
nce
Taw
uniya
Allia
nz S
F
ACIG
Sala
ma
Trad
e Un
ion
Al A
hlia
Alin
ma
Toki
o M
SAIC
O
Wal
aa
Arab
ian
Shie
ld
Saud
i Re
AIC
C
Wat
aniya
Gul
f Uni
on
Enay
a
Gul
f Gen
eral
Aman
a In
sura
nce
Buru
j
Sagr
Insu
ranc
e
UCA
Chu
bb A
rabi
a
Al A
lam
iya
Solid
arity
ATC
SABB
Tak
aful
Jazir
a Ta
kafu
l0.0%
20.0%
40.0%
60.0%
80.0%
100.0%
120.0%
Mal
ath
Insu
ranc
e
Met
Life
AIG
Ala
rabi
Al R
ajih
i Tak
aful
Bupa
Ara
bia
Coo
pera
tive
Waf
a In
sura
nce
Alin
ma
Toki
o M
Wal
aa In
sura
nce
Arab
ian
Shie
ld
Sagr
Insu
ranc
e
Gul
f Gen
eral
Chu
bb A
rabi
a
Aman
a In
sura
nce
SABB
Tak
aful
Jazir
a Ta
kafu
l
Others
Health
Motor
Protection and Saving
Others
64%
32%
2% 2%
Engineering
Q3 - 2016 Q3 - 2017
80%
140%160%
100%120%
0%
60%
20%40%
180%
MED
GUL
F
Aman
a In
sura
nce
Alin
ma
Tokio
M
Wat
aniya
Met
Life
AIG
Ala
rabi
Enay
a
Mal
ath
Insu
ranc
e
Gul
f Uni
on
SABB
Tak
aful
Waf
a In
sura
nce
SAIC
O
Allia
nz S
F
AXA
Saud
i Re
Sagr
Insu
ranc
e
ACIG
AICC
Al A
hlia
Al R
ajih
i Tak
aful
Sala
ma
Tawu
niya
Bupa
Ara
bia
Al A
lam
iya
Trad
e Un
ion
Gul
f Gen
eral
Arab
ian
Shie
ld
Buru
j
Chub
b Ar
abia
Wal
aa In
sura
nce
Solid
arity
UCA
ATC
Jazir
a Ta
kafu
l
Q1
- 201
7
Q2
- 201
7
Q2
- 201
2
Q3
- 201
2
Q3
- 201
7
Q4
- 201
2
Q1
- 201
3
Q2
- 201
3
Q3
- 201
3
Q4
- 201
3
Q1
- 201
4
Q2
- 201
4
Q3
- 201
4
Q4
- 201
4
Q1
- 201
5
Q2
- 201
5
Q3
- 201
5
Q4
- 201
5
Q1
- 201
6
Q2
- 201
6
Q3
- 201
6
Q4
- 201
6
Net Claims Paid - LHS % Growth (YoY) - RHS
-
1,000
2,000
3,000
4,000
5,000
6,000
7,000
24% 24%32% 29%
38% 40%
66%
25%17% 17%
-7%
24% 23% 21%29%
17% 19%
7%-2% 0.2%
-13.2%
3.4%
-20%-10%0%10%20%30%40%50%60%70%
IN M
N S
AR Q3 - 2016 Q3 - 2017
0200400600800
10001200140016001800
Bupa
Ara
bia
Taw
uniya
MED
GUL
F
Al R
ajih
i Tak
aful
Mal
ath
Insu
ranc
e
AXA
Waf
a In
sura
nce
Allia
nz S
F
Trad
e Un
ion
SAIC
O
Wal
aa In
sura
nce
Sala
ma
Arab
ian
Shie
ld
Saud
i Re
ACIG
UCA
AIC
C
Buru
j
Wat
aniya
Gul
f Uni
on
Met
Life
AIG
Ala
rabi
Sagr
Insu
ranc
e
Gul
f Gen
eral
ATC
Alin
ma
Toki
o M
Chu
bb A
rabi
a
Solid
arity
Al A
hlia
Enay
a
Al A
lam
iya
Aman
a In
sura
nce
SABB
Tak
aful
Jazir
a Ta
kafu
l
Gross Claims Paid - LHS % Growth (YoY) - RHS
Q3
- 201
7
Q1
- 201
7
Q2
- 201
7
Q2
- 201
2
Q3
- 201
2
Q4
- 201
2
Q1
- 201
3
Q2
- 201
3
Q3
- 201
3
Q4
- 201
3
Q1
- 201
4
Q2
- 201
4
Q3
- 201
4
Q4
- 201
4
Q1
- 201
5
Q2
- 201
5
Q3
- 201
5
Q4
- 201
5
Q1
- 201
6
Q2
- 201
6
Q3
- 201
6
Q4
- 201
6
9%
24% 22%
30%
27% 19%25%
17%24%
31%
18%
23%
24%
9%
28%
13%9% 7%
-3%
7%
-10%-5%0%5%
10%15%20%25%30%35%
-
1,500
3,000
4,500
6,000
7,500
-1%-7%
Claims Market Share-Company wise Claims Market Share-sector wise
Loss Ratio Combined Ratio
Net Claims Paid
Gross Claims PaidGCP (Gross Claims Paid) in Q3-2017 stood at SAR 6.1bn depicting a jump of 7.0% YoY.
NCP (Net Claim Paid) in Q3-2017 stood at SAR 5.7bn, depicting a rise of 3.4%YoY.
Market Share
BUPA Arabia with 25.3% market share in GCP paid the highest claims of SAR 1.33bn, followed by Tawuniya at 24.9% market share in claims.
Aljazira Takaful paid the lowest claims of SAR 2.02mn.
Health sector accounted for the highest share in claims at 64% , followed by Motor sector at 32%.
Malath insurance had the highest loss ratio of 99.0% in Q3-2017,followed by MedGulf at 88.1% in Q3-2017.
Aljazira Takaful had the lowest loss ratio of 10.3%.
UCA had the highest combined ratio of 153%, whereas Amana insurance had the lowest combined ratio of 23.4%.
Claims Paid-Company wise
Source: Argaam, SAMA, AlJazira Capital

Please read Disclaimer on the back
Insurance Sector Report
Sector report | KSA | Q3-2017
November 2017
0.0%
0.5%
1.0%
1.5%
2.0%
2.5%
3.0%
3.5%
4.0%
Solidarity Jazira Takaful
Amana Buruj Walaa Chubb Arabia
Arabian Shield
ATC Wataniya Sagr
0%
20%
40%
Buru
j
Al R
ajih
i Tak
aful
Arab
ian
Shie
ld
Sala
ma
Wal
aa In
sura
nce
Mal
ath
Alin
ma
Toki
o M
Enay
a
Met
Life
AIG
MED
GUL
F
-80%
-60%
-40%
-20%
0.0%
5.0%
10.0%
15.0%
20.0%
25.0%
30.0%
35.0%
40.0%
Jazira Takaful
Solidarity Amana Buruj Chubb Arabia
Sagr Arabian Shield
GulfGeneral
ATC SaudiRe
0.0%
5.0%
10.0%
-15.0%
-10.0%
-5.0% Buru
j
Solid
arity
Arab
ian
Shie
ld
Wal
aa In
sura
nce
Sala
ma
Mal
ath
Insu
ranc
e
Alin
ma
Tokio
M
Met
Life
AIG
Enay
a
MED
GUL
F
In M
n SA
R
Al R
ajih
i Tak
aful
Taw
uniya
Bupa
Ara
bia
Saud
i Re
MED
GUL
F
AXA
Trad
e Un
ion
Aman
a
Jazir
a Ta
kafu
l
SABB
Tak
aful
Alin
ma
Tokio
M
Al A
hlia
Solid
arity
Allia
nz S
F
Al A
lam
iya
ATC
Met
Life
AIG
Buru
j
SAIC
O
UCA
Wat
aniya
ACIG
Sala
ma
Enay
a
AIC
C
Arab
ian
Shie
ld
Chu
bb A
rabi
a
Gul
f Uni
on
Sagr
Insu
ranc
e
Waf
a In
sura
nce
Mal
ath
Gul
f Gen
eral
Wal
aa 0
5101520253035404550
In M
n SA
R
Bupa
Ara
bia
Tawu
niya
MED
GUL
F
Al R
ajih
i Tak
aful
Wal
aa In
sura
nce
Buru
j
Sala
ma
Arab
ian
Shie
ld
Solid
arity
Trad
e Un
ion
Aman
a In
sura
nce
SAIC
O
Mal
ath
Insu
ranc
e
AXA
ATC
Jazir
a Ta
kafu
l
Allia
nz S
F
Wat
aniya
Chub
b Ar
abia
Sagr
Insu
ranc
e
Al A
lam
iya
Gul
f Gen
eral
ACIG
AICC
Al A
hlia
Gul
f Uni
on
SABB
Tak
aful
Enay
a
Saud
i Re
UCA
Alin
ma
Tokio
M
Waf
a In
sura
nce
Met
Life
AIG
Ala
rabi
-100
-50
0
50
100
150
200
In M
n SA
R
Bupa
Ara
bia
Taw
uniy
a
Al R
ajih
i Tak
aful
MED
GU
LF
Wal
aa In
sura
nce
Buru
j
Arab
ian
Shie
ld
Sala
ma
Solid
arity
SAIC
O
Trad
e U
nion
Aman
a In
sura
nce
Mal
ath
Insu
ranc
e
AXA
Coo
pera
tive
ATC
Wat
aniy
a
Chu
bb A
rabi
a
Al A
lam
iya
Sagr
Insu
ranc
e
Allia
nz S
F
Jazi
ra T
akaf
ul
Gul
f Gen
eral
ACIG
AIC
C
Al A
hlia
Gul
f Uni
on
SABB
Tak
aful
Enay
a
UC
A
Waf
a In
sura
nce
Alin
ma
Toki
o M
-50
0
50
100
150
200
250
In M
N S
AR
Q1
- 201
7
Q2
- 201
7
Q3
- 201
2
Q3
- 201
7
Q4
- 201
2
Q1
- 201
3
Q2
- 201
3
Q3
- 201
3
Q4
- 201
3
Q1
- 201
4
Q2
- 201
4
Q3
- 201
4
Q4
- 201
4
Q1
- 201
5
Q2
- 201
5
Q3
- 201
5
Q4
- 201
5
Q1
- 201
6
Q2
- 201
6
Q3
- 201
6
Q4
- 201
6
17.3% YoY235.5% QoQ
340 179 (49) (117)
3 (1,159) (41)
199 405 233 (31)
240 491 122 285 432 803 620 319 197.9 664.1
(1,300)
(900)
(500)
(100)
300
700
1,100 -
Operating Margins-Highest 10 Net Margins-Highest 10
ROE-Top 5 /Bottom 5 ROA-Top 5/ Bottom 5 Investment Income
Net Income-Company wise
Net IncomeNet income for the sector stood at SAR 664.1mn in Q3-2017, as compared to SAR 802.1mn in Q3-2016, depicting a fall of 17.2%. On a QoQ basis net income showed a 235.5% increase. Net income before Zakat stood at SAR 756.7mn, depicting a fall of 15.4%, whereas a 144.2% jump on QoQ basis
BUPA with net income of SAR 198.2mn, showed a fall of 18.3%YoY.
BUPA showed the highest surplus, from its insurance operations , at SAR 229.4mn, depicting a fall of 21.0%YoY and a QoQ jump of 57.8%.
AlRajhi takaful showed the highest investment income of SAR 47.8mn in the sector, registering growth of 62.7%YoY and 9.9%QoQ.
Solidarity showed the highest Operating margins at 3.8%, whereas Jazira takaful showed the highest net margin at 35.7%, respectively.
Buruj posted the highest ROE of 35.8%
Buruj also posted the highest ROA of 11.0%.
Surplus From Insurance Operations
Source: Argaam
Please read Disclaimer on the back
Insurance Sector Report
Sector report | KSA | Q3-2017
November 2017
Insurance Sector (LHS) Bupa (RHS)
90
100
110
120
130
140
6,500.00
6,700.00
6,900.00
7,100.00
7,300.00
7,500.00
7,700.00
Dec 2016 Mar 2017 Jun 2017 Sep 2017
TASI (LHS) Insurance Sector (RHS)
4,300.00
4,500.00
4,700.00
4,900.00
5,100.00
5,300.00
5,500.00
6,500.00
6,700.00
6,900.00
7,100.00
7,300.00
7,500.00
7,700.00
Dec 2016 Mar 2017 Jun 2017 Sep 2017
Insurance Sector (LHS) Medgulf (RHS)
10
20
30
40
50
60
70
80
6,500.00
6,700.00
6,900.00
7,100.00
7,300.00
7,500.00
7,700.00
Dec 2016 Mar 2017 Jun 2017 Sep 2017
Insurance Sector (LHS) Alrajhi takaful (RHS)
30
35
40
45
50
55
60
65
6,500.00
6,700.00
6,900.00
7,100.00
7,300.00
7,500.00
7,700.00
Dec 2016 Mar 2017 Jun 2017 Sep 2017
Insurance Sector (LHS) Tawuniya (RHS)
80
85
90
95
100
105
6,500.00
6,700.00
6,900.00
7,100.00
7,300.00
7,500.00
7,700.00
Dec 2016 Mar 2017 Jun 2017 Sep 2017
Insurance Sector (LHS) WALAA (RHS)
15
20
25
30
35
6,500.00
6,700.00
6,900.00
7,100.00
7,300.00
7,500.00
7,700.00
Dec 2016 Mar 2017 Jun 2017 Sep 2017
In M
n SA
R
-
2,000
4,000
6,000
8,000
10,000
12,000
Tawuniya Bupa Arabia AlRajhi Takaful MEDGULF WALAA
0.00.20.40.60.81.01.21.41.61.82.0
Saudi Re SagrInsurance
SAICO U C A Trade Union Gulf General Gulf Union Al-Ahlia AXACooperative
Solidarity
9.1%
4.8%4.3%
2.0% 1.7%
0.0%1.0%2.0%3.0%4.0%5.0%6.0%7.0%8.0%9.0%
10.0%
Sagr Insurance Arabian Shield Tawuniya Jazira Takaful Buruj
0.0
2.0
4.0
6.0
8.0
10.0
12.0
Buruj ArabianShield
Gulf Union Solidarity SAICO Trade Union U C A WALAA Salama Saudi Re
BUPA-1 Yr Performance
Tadawul Insurance Index- 1 Yr Performance
Alrajhi Takaful-1 Yr Performance
Tawuniya-1 Yr Performance
Medgulf-1 Yr Performance Walaa-1 Yr Performance Top 5 Companies-Market Cap
Lowest PB
Highest Dividend Yield
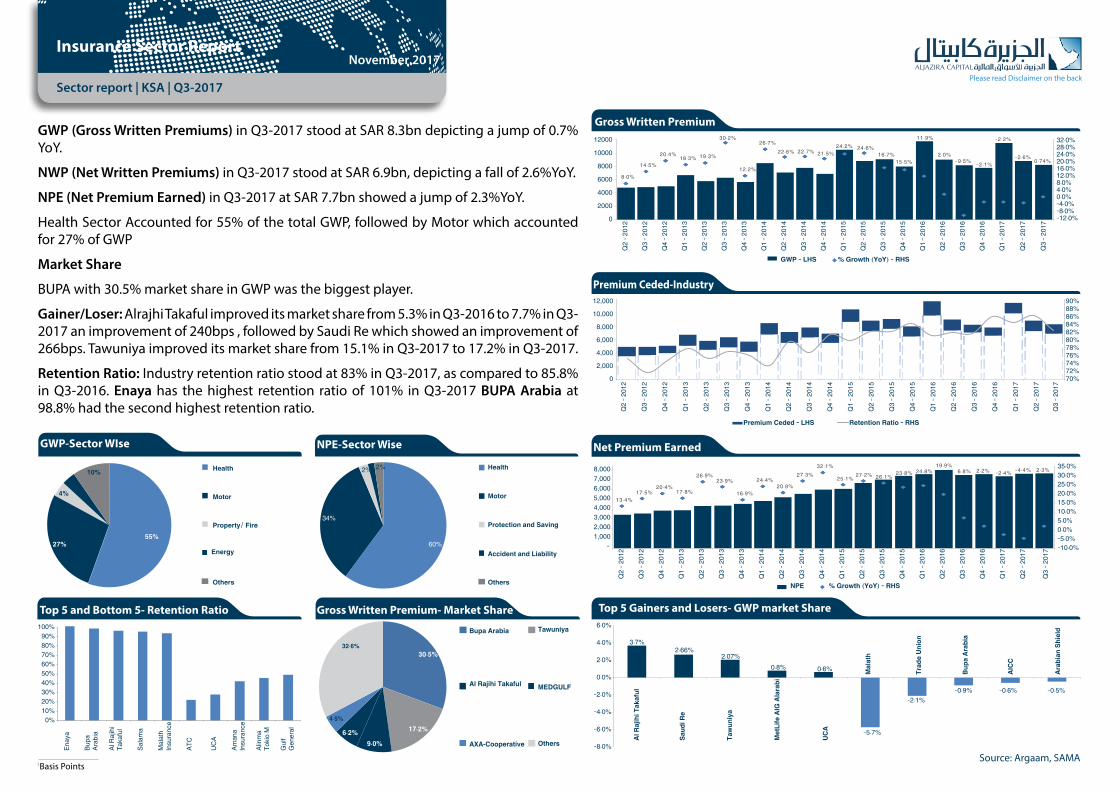
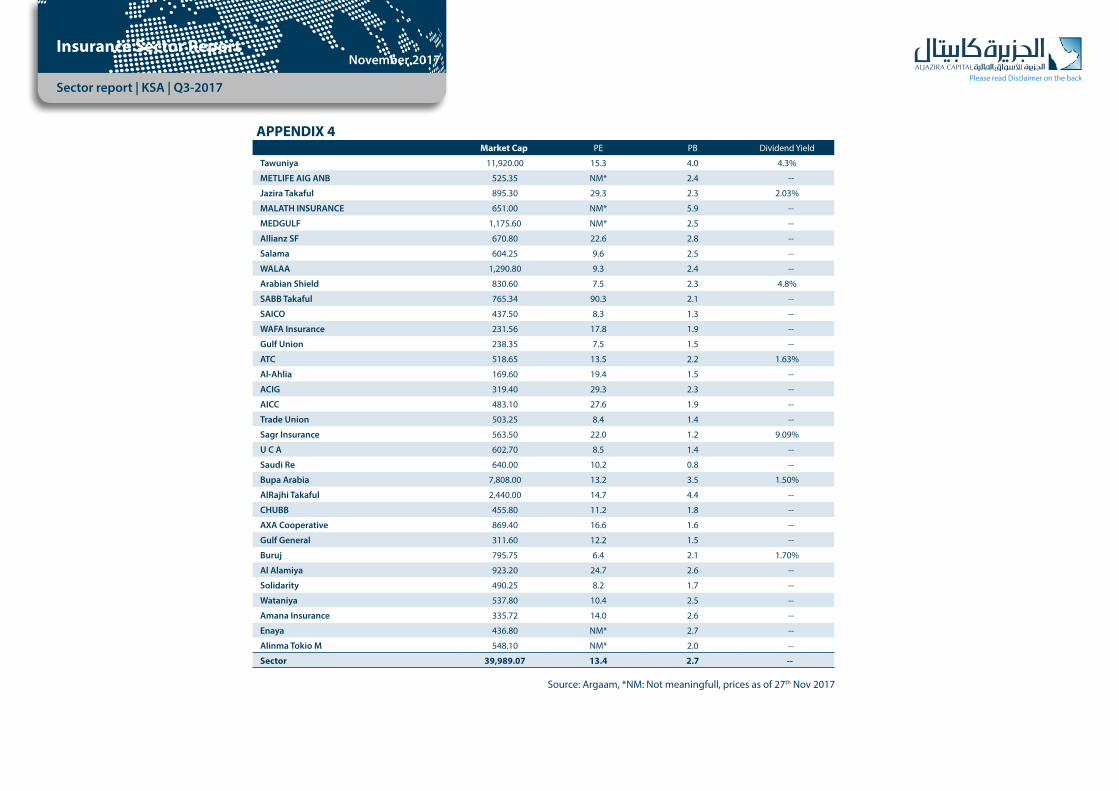
Lowest PEUnited Cooperative Assurance had the lowest PE of 8.3x, followed by Buruj with a PE of 8.5x.
Saudi Re for Cooperative Reinsurance Co has the lowest PB of 0.8x, followed by Sagr insurance with a PB of 1.4x
Only 5 companies gave out dividends, SAGR insurance had the highest dividend yield of 9.1% followed by Arabian Sheild with a dividend yield of 4.8%
Source: Tadawul, Bloomberg, prices as of 13 of June 2017

Please read Disclaimer on the back
Insurance Sector Report
Sector report | KSA | Q3-2017
November 2017
APPENDIX 1
GWP YoY %Increase
QoQ %Increase NWP YoY
%IncreaseQoQ
%Increase NPE YoY %Increase QoQ %Increase
Q3-2016 Q2-2017 Q3-2017 Q3-2016 Q2-2017 Q3-2017 Q3-2016 Q2-2017 Q3-2017
MetLife AIG Alarabi 36 88 103 185.4% 17.1% 26 63 89 241.7% 41.2% 42 55 69 66.1% 25.5%
Jazira Takaful 29 32 28 -5.9% -13.2% 15 13 13 -10.2% 1.0% 7 9 7 -2.9% -18.9%
Tawuniya 1,241 2,104 1,421 14.5% -32.5% 1,077 1,764 1,161 7.7% -34.2% 1,759 1,832 1,883 7.0% 2.8%
Malath Insurance 531 144 62 -88.3% -56.8% 466 127 55 -88.2% -56.6% 351 227 220 -37.3% -3.2%
MEDGULF 511 869 513 0.4% -40.9% 420 702 426 1.3% -39.4% 714 586 565 -20.9% -3.7%
Allianz SF 180 227 147 -18.0% -35.2% 115 134 102 -11.0% NM* 130 166 160 23.3% NM*
Salama 132 202 159 20.4% -21.3% 125 194 148 18.9% -23.7% 113 168 181 60.3% 7.9%
Walaa Insurance 268 218 284 5.9% 30.7% 193 173 174 -9.6% 0.7% 161 200 196 21.7% -2.2%
Arabian Shield 153 165 115 -24.5% -30.2% 101 114 79 -22.0% -30.6% 102 122 106 3.3% -13.5%
SABB Takaful 49 45 51 2.8% 11.6% 36 34 39 6.9% 14.3% 32 34 33 3.0% -4.3%
SAICO 160 149 157 -2.1% 5.5% 108 105 142 31.6% 36.0% 124 130 142 14.6% 9.1%
Wafa Insurance 93 119 100 7.1% -16.1% 78 73 62 -20.8% -15.5% 126 101 98 -22.4% -3.3%
Gulf Union 46 79 32 -29.4% -58.9% 26 52 17 -35.2% -67.2% 23 56 54 130.2% -4.1%
ATC 115 58 120 4.1% 106.1% 29 10 24 -17.8% 132.3% 21 21 16 -24.3% -24.3%
Al Ahlia 43 46 53 23.0% 14.7% 38 43 48 25.0% 12.1% 43 37 37 -15.5% -1.4%
ACIG 136 102 113 -17.4% 10.3% 115 88 98 -14.2% 12.0% 110 87 82 -24.9% -5.6%
AICC 110 69 59 -46.5% -14.5% 96 46 38 -60.8% -19.0% 70 73 54 -23.8% -26.4%
Trade Union 274 289 103 -62.5% -64.4% 231 245 77 -66.8% -68.7% 193 189 176 -9.0% -6.9%
Solidarity 55 21 37 -33.3% 79.5% 48 18 30 -37.9% 70.7% 52 43 40 -23.7% -8.0%
Wataniya 148 83 152 2.4% 83.6% 89 42 88 -1.5% 106.5% 65 74 73 11.9% -1.7%
Amana Insurance 11 16 9 -18.4% -44.6% 4 6 7 72.0% 16.0% 58 14 11 -81.6% -24.1%
AXA-Cooperative 387 220 369 -4.6% 67.9% 346 195 334 -3.5% 71.4% 265 323 300 13.5% -6.9%
Gulf General 37 46 26 -29.9% -44.5% 17 23 11 -35.5% -54.1% 34 29 23 -31.8% -19.5%
Buruj 109 144 95 -12.8% -34.4% 92 133 81 -12.3% -39.3% 100 117 131 30.7% 11.6%
Al Alamiya 64 48 57 -11.0% 18.8% 27 26 21 -20.8% -16.1% 50 46 39 -22.5% -14.4%
Saudi Re 82 121 303 267.0% 150.2% 75 89 89 18.9% 0.9% 119 143 150 26.0% 5.0%
UCA 64 251 116 82.5% -53.7% 25 61 39 51.3% -36.7% 146 52 37 -75.0% -30.0%
Bupa Arabia 2,579 1,848 2,523 -2.2% 36.5% 2,567 1,832 2,497 -2.7% 36.3% 1,939 1,909 1,937 -0.1% 1.4%
Sagr Insurance 13 93 61 380.0% -34.6% (9) 68 56 -744.3% -18.0% 95 42 58 -39.1% 36.6%
Chubb Arabia 42 48 42 0.6% -13.4% 17 28 14 -16.8% -49.0% 29 27 26 -11.1% -2.7%
Enaya 21 66 59 178.0% -10.3% 13 65 60 365.4% -8.6% 14 34 52 270.2% 55.5%
Al Rajhi Takaful 434 680 742 71.2% 9.2% 410 649 711 73.2% 9.6% 407 686 719 76.5% 4.8%
Alinma Tokio M 47 103 51 7.8% -50.9% 17 25 27 58.8% 8.7% 33 32 35 4.0% 9.1%
Total 8,201 8,794 8,261 0.7% -6.1% 7,035 7,240 6,856 -2.5% -5.3% 7,529 7,665 7,706 2.4% 0.5%Source: Argaam, *NM: Not meaningfull

Please read Disclaimer on the back
Insurance Sector Report
Sector report | KSA | Q3-2017
November 2017
APPENDIX 2Gross Claims Paid YoY %Increase QoQ %Increase Net Claims Paid YoY %Increase QoQ %Increase
Q3-2016 Q2-2017 Q3-2017 Q3-2016 Q2-2017 Q3-2017
Tawuniya 1,237 1,519 1,512 22.2% -0.5% 1,306 1,230 1,484 13.6% 20.6%
Salama 62 112 113 81.6% 1.0% 80 83 128 60.0% 54.1%
UCA 187 64 60 -67.9% -5.6% 124 98 15 -87.8% -84.6%
Al Rajhi Takaful 287 559 462 60.8% -17.4% 303 329 592 95.1% 79.9%
Al Alamiya 28 23 18 -34.6% -21.6% 25 25 12 -51.9% -52.2%
ACIG 75 73 60 -19.6% -17.6% 81 79 57 -29.7% -28.0%
Bupa Arabia 1,333 1,647 1,536 15.2% -6.8% 1,511 1,399 1,475 -2.4% 5.5%
Arabian Shield 43 90 69 58.8% -23.3% 66 66 61 -6.8% -7.1%
Buruj 42 61 59 42.1% -3.8% 56 65 78 39.1% 20.6%
Sagr Insurance 59 42 26 -56.2% -39.0% 69 41 35 -48.8% -14.6%
Malath Insurance 436 264 198 -54.6% -25.0% 400 472 168 -58.1% -64.5%
Solidarity 36 26 24 -33.6% -7.2% 25 18 6 -77.3% -69.0%
Trade Union 142 143 141 -0.8% -1.3% 176 153 116 -34.0% -24.1%
Walaa Insurance 67 125 101 49.2% -19.5% 79 83 100 25.9% 20.0%
Allianz SF 89 147 160 79.7% 8.9% 100 102 124 23.8% 22.1%
Al Ahlia 31 24 23 -27.3% -5.5% 36 27 22 -38.9% -18.9%
MEDGULF 666 633 632 -5.1% -0.0% 657 539 459 -30.2% -14.9%
Wafa Insurance 104 149 96 -7.8% -35.4% 102 94 74 -27.6% -21.5%
SABB Takaful 5 15 8 57.3% -45.9% 4 5 3 -18.6% -41.1%
SAICO 93 135 110 18.6% -19.0% 80 76 95 19.3% 26.1%
Gulf Union 20 47 50 157.5% 7.9% 11 12 31 170.0% 154.0%
Saudi Re 48 82 57 19.8% -30.3% 569 77 114 -79.9% 48.7%
AICC 73 63 47 -35.4% -25.5% 56 37 27 -52.6% -28.2%
ATC 11 35 18 65.2% -48.7% 4 5 (0) -108.3% -107.1%
AXA-Cooperative 206 211 203 -1.5% -4.1% 219 217 238 8.4% 9.7%
Chubb Arabia 28 29 31 11.3% 7.3% 10 14 10 8.3% -27.8%
Gulf General 39 35 39 -1.6% 9.1% 20 16 10 -48.3% -38.0%
Wataniya 75 57 80 6.7% 39.8% 46 42 49 7.1% 15.8%
Amana Insurance 48 22 12 -76.0% -47.6% 63 33 (8) -112.4% -123.5%
Enaya 13 23 31 128.7% 31.9% 8 6 31 286.5% 387.9%
Alinma Tokio M 45 30 30 -34.2% -1.3% 23 23 18 -23.1% -23.7%
MetLife AIG Alarabi 37 46 59 59.1% 27.3% 33 36 66 97.3% 85.3%
Jazira Takaful 1 2 2 128.1% 26.9% 1 2 2 157.4% 16.8%
Total 5,667 6,533 6,064 7.0% -7.2% 6,344 5,505 5,692 -10.3% 3.4%Source: Argaam, *NM: Not meaningfull

Please read Disclaimer on the back
Insurance Sector Report
Sector report | KSA | Q3-2017
November 2017
APPENDIX 3Net income Before Zakat YoY %Increase QoQ %Increase Net Income YoY %Increase QoQ %Increase
Q3-2016 Q2-2017 Q3-2017 Q3-2016 Q2-2017 Q3-2017
MetLife AIG Alarabi (4.2) (3.2) (10.4) 146.0% 219.7% (4.2) (3.8) (10.9) 158.9% 188.4%
Jazira Takaful 6.4 8.9 6.8 6.9% -23.0% 6.0 8.1 6.5 9.2% -19.8%
Tawuniya 283.2 248.8 159.7 -43.6% -35.8% 259.6 231.0 141.5 -45.5% -38.7%
Malath Insurance 1.3 5.0 11.1 730.9% 120.4% 0.0 3.5 9.6 NM* 171.5%
MEDGULF 60.0 (417.3) 60.1 0.1% -114.4% 51.8 (440.0) 56.6 9.2% -112.9%
Allianz SF 6.3 7.8 8.0 26.4% 2.3% 4.9 6.0 6.4 30.2% 6.0%
Salama 8.7 16.2 22.0 152.1% 36.3% 7.5 14.9 20.8 177.5% 39.4%
Walaa Insurance 40.0 35.6 44.4 11.0% 24.7% 38.0 32.3 41.1 8.3% 27.2%
Arabian Shield 18.7 22.3 23.1 23.6% 3.5% 16.1 19.2 20.0 24.7% 4.4%
SABB Takaful 2.7 1.8 2.1 -24.8% 15.5% 1.3 0.6 0.7 -47.0% 19.6%
SAICO 17.4 11.5 16.4 -5.6% 42.4% 15.5 9.8 14.4 -6.9% 46.6%
Wafa Insurance 8.7 2.9 (3.6) -141.3% -222.5% 8.4 1.1 (5.2) -162.3% -590.6%
Gulf Union (0.2) 5.8 2.0 -954.9% -65.3% (0.9) 4.0 0.9 -207.5% -76.7%
ATC 7.1 11.1 8.7 22.5% -21.5% 5.8 9.4 8.7 49.9% -7.8%
Al Ahlia (8.6) 4.1 3.2 -136.6% -22.6% (9.3) 3.4 2.0 -121.6% -41.6%
ACIG 4.7 6.6 3.9 -16.4% -40.5% 3.8 6.1 3.0 -22.5% -51.6%
AICC (1.7) 3.6 3.9 -328.4% 6.0% (1.7) 1.6 2.5 -248.2% 60.5%
Trade Union 27.2 25.1 16.7 -38.6% -33.6% 25.7 22.6 16.7 -35.0% -26.2%
Solidarity 14.1 12.9 19.6 39.1% 51.7% 13.4 13.1 17.8 33.1% 36.0%
Wataniya 8.0 7.7 8.2 1.9% 6.7% 7.4 6.9 5.8 -21.6% -15.2%
Amana Insurance 7.9 (1.8) 14.6 85.3% -916.1% 7.6 (2.3) 15.1 98.2% -757.6%
AXA-Cooperative 11.2 14.8 12.6 12.5% -15.1% 7.5 10.8 8.8 16.8% -18.4%
Gulf General 7.0 11.3 4.6 -33.4% -59.0% 6.7 9.8 3.4 -48.8% -65.1%
Buruj 8.6 27.8 24.0 180.5% -13.7% 7.0 25.1 21.4 203.6% -15.0%
Al Alamiya 12.2 7.1 8.8 -27.8% 23.9% 10.0 6.4 4.8 -51.6% -24.3%
Saudi Re 2.7 13.4 (0.3) -110.0% -102.0% (0.7) 9.4 (3.6) 436.8% -138.6%
UCA 26.1 27.4 (2.2) -108.3% -107.9% 23.1 25.9 (3.7) -115.9% -114.1%
Bupa Arabia 260.4 145.8 217.0 -16.7% 48.8% 244.5 127.0 198.2 -18.9% 56.1%
Sagr Insurance 26.7 6.9 7.5 -71.7% 8.8% 21.8 2.3 5.1 -76.5% 123.5%
Chubb Arabia 9.5 9.8 7.8 -17.6% -20.3% 7.6 8.1 5.8 -23.9% -28.7%
Enaya (6.3) (3.5) 0.7 -111.6% -120.9% (6.5) (4.1) 0.1 -102.0% -103.1%
Al Rajihi Takaful 29.6 41.1 58.7 98.5% 42.9% 26.5 38.1 54.0 103.8% 41.6%
Alinma Tokio M (1.1) (7.5) (3.2) 193.4% -56.7% (2.2) (8.5) (4.3) 94.6% -49.7%
Total 894.2 309.8 756.7 -15.4% 144.2% 802.1 197.9 664.1 -17.2% 235.5%Source: Argaam, *NM: Not meaningfull
Please read Disclaimer on the back
Insurance Sector Report
Sector report | KSA | Q3-2017
November 2017
APPENDIX 4Market Cap PE PB Dividend Yield
Tawuniya 11,920.00 15.3 4.0 4.3%
METLIFE AIG ANB 525.35 NM* 2.4 --
Jazira Takaful 895.30 29.3 2.3 2.03%
MALATH INSURANCE 651.00 NM* 5.9 --
MEDGULF 1,175.60 NM* 2.5 --
Allianz SF 670.80 22.6 2.8 --
Salama 604.25 9.6 2.5 --
WALAA 1,290.80 9.3 2.4 --
Arabian Shield 830.60 7.5 2.3 4.8%
SABB Takaful 765.34 90.3 2.1 --
SAICO 437.50 8.3 1.3 --
WAFA Insurance 231.56 17.8 1.9 --
Gulf Union 238.35 7.5 1.5 --
ATC 518.65 13.5 2.2 1.63%
Al-Ahlia 169.60 19.4 1.5 --
ACIG 319.40 29.3 2.3 --
AICC 483.10 27.6 1.9 --
Trade Union 503.25 8.4 1.4 --
Sagr Insurance 563.50 22.0 1.2 9.09%
U C A 602.70 8.5 1.4 --
Saudi Re 640.00 10.2 0.8 --
Bupa Arabia 7,808.00 13.2 3.5 1.50%
AlRajhi Takaful 2,440.00 14.7 4.4 --
CHUBB 455.80 11.2 1.8 --
AXA Cooperative 869.40 16.6 1.6 --
Gulf General 311.60 12.2 1.5 --
Buruj 795.75 6.4 2.1 1.70%
Al Alamiya 923.20 24.7 2.6 --
Solidarity 490.25 8.2 1.7 --
Wataniya 537.80 10.4 2.5 --
Amana Insurance 335.72 14.0 2.6 --
Enaya 436.80 NM* 2.7 --
Alinma Tokio M 548.10 NM* 2.0 --
Sector 39,989.07 13.4 2.7 --
Source: Argaam, *NM: Not meaningfull, prices as of 27th Nov 2017
Asset Management | Brokerage | Corporate Finance | Custody | Advisory
Head Office: King Fahad Road, P.O. Box: 20438, Riyadh 11455, Saudi Arabia، Tel: 011 2256000 - Fax: 011 2256068
RESE
ARC
H
DIV
ISIO
NRE
SEAR
CH
DIVI
SION
RATI
NG
TERM
INO
LOG
YBR
OKE
RAG
E A
ND
IN
VEST
MEN
T CE
NTE
RS
DIV
ISIO
N
Disclaimer
AlJazira Capital, the investment arm of Bank AlJazira, is a Shariaa Compliant Saudi Closed Joint Stock company and operating under the regulatory supervision of the Capital Market Authority. AlJazira Capital is licensed to conduct securities business in all securities business as authorized by CMA, including dealing, managing, arranging, advisory, and custody. AlJazira Capital is the continuation of a long success story in the Saudi Tadawul market, having occupied the market leadership position for several years. With an objective to maintain its market leadership position, AlJazira Capital is expanding its brokerage capabilities to offer further value-added services, brokerage across MENA and International markets, as well as offering a full suite of securities business.
1. Overweight: This rating implies that the stock is currently trading at a discount to its 12 months price target. Stocks rated “Overweight” will typically provide an upside potential of over 10% from the current price levels over next twelve months.
2. Underweight: This rating implies that the stock is currently trading at a premium to its 12 months price target. Stocks rated “Underweight” would typically decline by over 10% from the current price levels over next twelve months.
3. Neutral: The rating implies that the stock is trading in the proximate range of its 12 months price target. Stocks rated “Neutral” is expected to stagnate within +/- 10% range from the current price levels over next twelve months.
4. Suspension of rating or rating on hold (SR/RH): This basically implies suspension of a rating pending further analysis of a material change in the fundamentals of the company.
The purpose of producing this report is to present a general view on the company/economic sector/economic subject under research, and not to recommend a buy/sell/hold for any security or any other assets. Based on that, this report does not take into consideration the specific financial position of every investor and/or his/her risk appetite in relation to investing in the security or any other assets, and hence, may not be suitable for all clients depending on their financial position and their ability and willingness to undertake risks. It is advised that every potential investor seek professional advice from several sources concerning investment decision and should study the impact of such decisions on his/her financial/legal/tax position and other concerns before getting into such investments or liquidate them partially or fully. The market of stocks, bonds, macroeconomic or microeconomic variables are of a volatile nature and could witness sudden changes without any prior warning, therefore, the investor in securities or other assets might face some unexpected risks and fluctuations. All the information, views and expectations and fair values or target prices contained in this report have been compiled or arrived at by Aljazira Capital from sources believed to be reliable, but Aljazira Capital has not independently verified the contents obtained from these sources and such information may be condensed or incomplete. Accordingly, no representation or warranty, express or implied, is made as to, and no reliance should be placed on the fairness, accuracy, completeness or correctness of the information and opinions contained in this report. Aljazira Capital shall not be liable for any loss as that may arise from the use of this report or its contents or otherwise arising in connection therewith. The past performance of any investment is not an indicator of future performance. Any financial projections, fair value estimates or price targets and statements regarding future prospects contained in this document may not be realized. The value of the security or any other assets or the return from them might increase or decrease. Any change in currency rates may have a positive or negative impact on the value/return on the stock or securities mentioned in the report. The investor might get an amount less than the amount invested in some cases. Some stocks or securities maybe, by nature, of low volume/trades or may become like that unexpectedly in special circumstances and this might increase the risk on the investor. Some fees might be levied on some investments in securities. This report has been written by professional employees in Aljazira Capital, and they undertake that neither them, nor their wives or children hold positions directly in any listed shares or securities contained in this report during the time of publication of this report, however, The authors and/or their wives/children of this document may own securities in funds open to the public that invest in the securities mentioned in this document as part of a diversified portfolio over which they have no discretion. This report has been produced independently and separately by the Research Division at Aljazira Capital and no party (in-house or outside) who might have interest whether direct or indirect have seen the contents of this report before its publishing, except for those whom corporate positions allow them to do so, and/or third-party persons/institutions who signed a non-disclosure agreement with Aljazira Capital. Funds managed by Aljazira Capital and its subsidiaries for third parties may own the securities that are the subject of this document. Aljazira Capital or its subsidiaries may own securities in one or more of the aforementioned companies, and/or indirectly through funds managed by third parties. The Investment Banking division of Aljazira Capital maybe in the process of soliciting or executing fee earning mandates for companies that is either the subject of this document or is mentioned in this document. One or more of Aljazira Capital board members or executive managers could be also a board member or member of the executive management at the company or companies mentioned in this report, or their associated companies. No part of this report may be reproduced whether inside or outside the Kingdom of Saudi Arabia without the written permission of Aljazira Capital. Persons who receive this report should make themselves aware, of and adhere to, any such restrictions. By accepting this report, the recipient agrees to be bound by the foregoing limitations.
Head of Research
Talha Nazar +966 11 [email protected]
AnalystSultan Al Kadi+966 11 [email protected]
Analyst
Jassim Al-Jubran +966 11 [email protected]
Analyst
Waleed Al-Jubayr+966 11 [email protected]
Analyst
Muhanad Al-Odan+966 11 [email protected]
General Manager – Brokerage Services
& sales
Alaa Al-Yousef+966 11 [email protected]
AGM-Head of international and institutional
brokerage
Luay Jawad Al-Motawa +966 11 [email protected]
AGM- Head of Western and Southern Region
Investment Centers
Mansour Hamad Al-Shuaibi +966 12 [email protected]
AGM-Head of Sales And Investment Centers
Central Region
Sultan Ibrahim AL-Mutawa +966 11 [email protected]
AGM-Head of Qassim & Eastern Province
Abdullah Al-Rahit +966 16 3617547 [email protected]
Aljazira Capital is a Saudi Investment Company licensed by the Capital Market Authority (CMA), license No. 07076-37

![BGD001B Retro Digital 100M-WR (Black & Pink) 12 EOR - Mist ... · Mist Digital 100M-WR [Nude & Rosegold] 222 EOR - - BG002A Diva Bronze 190 EOR - BG002B Diva Silver 133 EOR - BG003C](https://static.fdocuments.us/doc/165x107/5e7cf3eec367ea52344b7489/bgd001b-retro-digital-100m-wr-black-pink-12-eor-mist-mist-digital.jpg)