RE-DESIGNING OF TOM MBOYA STREET TO … RE-DESIGNING OF TOM MBOYA STREET TO ENHANCE CRIME PREVENTION...
68
i RE-DESIGNING OF TOM MBOYA STREET TO ENHANCE CRIME PREVENTION BY ANDREW MIRARA B65/0477/2006 A PLANNING DEVELOPMENT PROJECT SUBMITTED IN PARTIAL FULFILLMENT OF THE REQUIREMENTS FOR THE AWARD OF DEGREE OF BACHELOR OF ARTS IN URBAN AND REGIONAL PLANNING UNIVERSITY OF NAIROBI August, 2010
Transcript of RE-DESIGNING OF TOM MBOYA STREET TO … RE-DESIGNING OF TOM MBOYA STREET TO ENHANCE CRIME PREVENTION...

i
RE-DESIGNING OF TOM MBOYA STREET TO ENHANCE CRIME
PREVENTION
BY
ANDREW MIRARA
B65/0477/2006
A PLANNING DEVELOPMENT PROJECT SUBMITTED IN PARTIAL
FULFILLMENT OF THE REQUIREMENTS FOR THE AWARD OF DEGREE OF
BACHELOR OF ARTS IN URBAN AND REGIONAL PLANNING
UNIVERSITY OF NAIROBI
August, 2010
ii
DECLARATION
This research is my original work and has not been presented for examination in
any university.
Signed: _________________________________
Date: _____________________
Andrew K. Mirara
B65/0477/2006
(Candidate)
This research project has been submitted for examination with the approval of the
assigned supervisor
Signed: _________________________________
Date: _____________________
Mr. Romanus Opiyo
(Supervisor)
August, 2010
iii
DEDICATION
This work is dedicated to my parents Mr. and Mrs. Moses Mirara; my brothers
Edwin, Alex and Simonkings for their contribution to my success.

iv
ACKNOWLEDGEMENTS
This report would not have reached its final conclusion if it were not for the support and
contribution of various personalities and institutions. First of all I would to thank my supervisor,
Mr. R. Opiyo for his tireless, constant and close supervision and guidance.
I do appreciate the contribution of my fellow students and the entire staff of the department of
urban and regional planning.
I thank my parents and brothers for their continuous support both financially and spiritually.
May the Almighty God bless you all!
Above all, I have to acknowledge and appreciate the Almighty God for giving me this
opportunity, life and good health to study and be able to carry out this research.
v
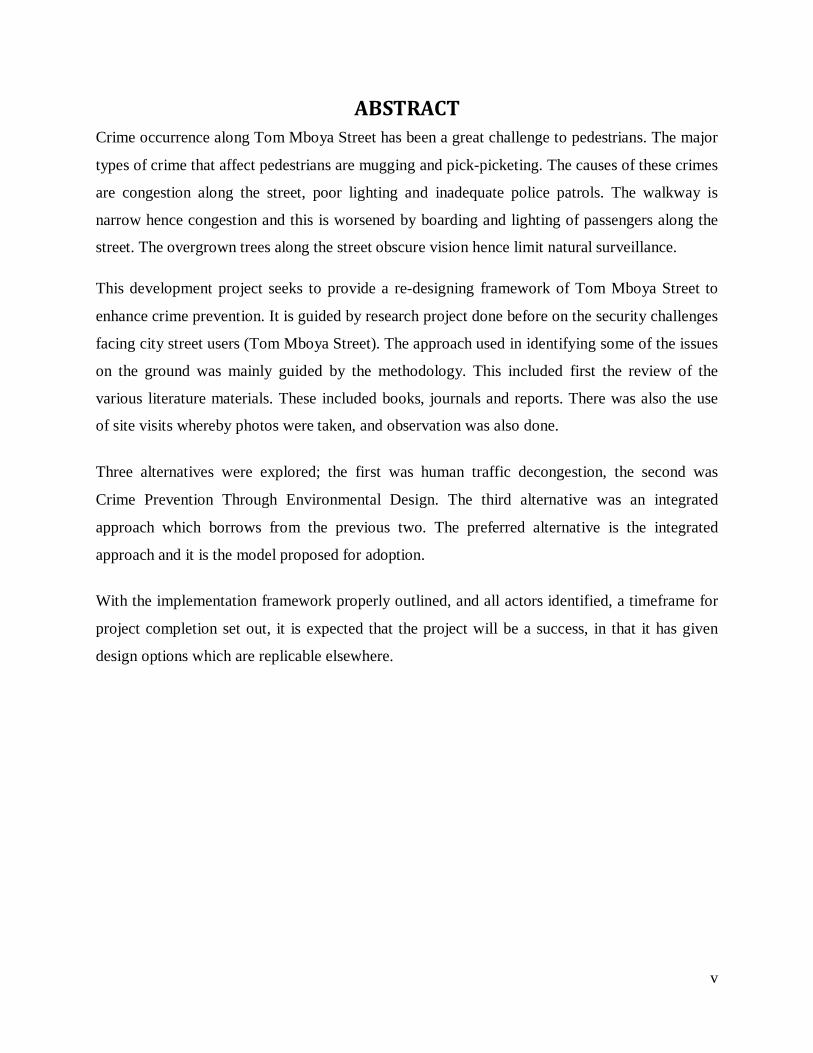
ABSTRACT Crime occurrence along Tom Mboya Street has been a great challenge to pedestrians. The major
types of crime that affect pedestrians are mugging and pick-picketing. The causes of these crimes
are congestion along the street, poor lighting and inadequate police patrols. The walkway is
narrow hence congestion and this is worsened by boarding and lighting of passengers along the
street. The overgrown trees along the street obscure vision hence limit natural surveillance.
This development project seeks to provide a re-designing framework of Tom Mboya Street to
enhance crime prevention. It is guided by research project done before on the security challenges
facing city street users (Tom Mboya Street). The approach used in identifying some of the issues
on the ground was mainly guided by the methodology. This included first the review of the
various literature materials. These included books, journals and reports. There was also the use
of site visits whereby photos were taken, and observation was also done.
Three alternatives were explored; the first was human traffic decongestion, the second was
Crime Prevention Through Environmental Design. The third alternative was an integrated
approach which borrows from the previous two. The preferred alternative is the integrated
approach and it is the model proposed for adoption.
With the implementation framework properly outlined, and all actors identified, a timeframe for
project completion set out, it is expected that the project will be a success, in that it has given
design options which are replicable elsewhere.
vi
Contents DEDICATION .......................................................................................................................... iii
ACKNOWLEDGEMENTS....................................................................................................... iv
ABSTRACT ...............................................................................................................................v
LIST OF FIGURES ................................................................................................................ viii
LIST OF MAPS ...................................................................................................................... viii
LIST OF TABLES .................................................................................................................. viii
LIST OF GRAPHS ................................................................................................................. viii
LIST OF PLATES .................................................................................................................. viii
CHAPTER ONE: INTRODUCTION ..........................................................................................1
1.1 Research topic: ..................................................................................................................1
1.2 Findings of the research project .........................................................................................1
1.3 Recommendations .............................................................................................................2
1.4 Chosen project ...................................................................................................................4
1.5 Reason for choice ..............................................................................................................4
1.6 Location and area coverage ...............................................................................................4
1.7 Objectives of the development project ...............................................................................5
1.8 Assumptions ......................................................................................................................5
1.9 Scope of the Development project and the organization of the project chapters ..................5
1.10 Research methodology for the development project .........................................................6
CHAPTER TWO: LITERATURE REVIEW...............................................................................9
1.0 Overview. ..........................................................................................................................9
1.1 Relevant Policies, Plans, Planning Policies and Design Guidelines. ...................................9
1.2 Planning Standards .......................................................................................................... 13
1.3 Crime Prevention Through Environmental Design ........................................................... 16

vii
1.4 Case studies ..................................................................................................................... 20
1.5 Conceptual framework..................................................................................................... 26
CHAPTER THREE: SITUATIONAL ANALYSIS ................................................................... 27
3.1 Location of the Study Area .............................................................................................. 27
3.2 Historical Development of Nairobi .................................................................................. 29
3.3 Population and Demographic characteristics .................................................................... 30
3.4 Climatic conditions .......................................................................................................... 30
3.5 Land use analysis............................................................................................................. 35
3.6 Site analysis..................................................................................................................... 39
CHAPTER 4: PROJECT PLANNING, DESIGN AND IMPLEMENTATION.......................... 43
4.1 Overview ......................................................................................................................... 43
4.2 Planning and Design of this Project ................................................................................. 43
4.3 Site Planning ................................................................................................................... 43
4.4 Design Alternatives ......................................................................................................... 44
CHAPTER 5: MONITORING AND EVALUATION ............................................................... 54
5.1 Introduction ..................................................................................................................... 54
5.2 Monitoring and Evaluation Stages in The Implementation Of The Project(s) ................... 54
5.3 Guidelines for the implementation ................................................................................... 55
5.4 Environmental Management Plan .................................................................................... 55
5.5 Conclusion ...................................................................................................................... 58
BIBLIOGRAPHY ..................................................................................................................... 59

viii
LIST OF FIGURES Figure 1-1: crime hotspots in the study area ................................................................................3
Figure 2: Conceptual Framework .............................................................................................. 26
Figure 3: Street Layout .............................................................................................................. 48
Figure 4: Street design............................................................................................................... 57
LIST OF MAPS Map 1-1: Study Area ...................................................................................................................4
Map 2: Map of Stroud Town Centre .......................................................................................... 23
Map 3: Kenya ........................................................................................................................... 27
LIST OF TABLES Table 1: Population ................................................................................................................... 30
Table 2: weather data for Nairobi .............................................................................................. 33
LIST OF GRAPHS Graph 1: temperature................................................................................................................. 32
Graph 2: climate ........................................................................................................................ 34
LIST OF PLATES Plate 1: processes ...................................................................................................................... 25
Plate 2: Bus stop at Tom Mboya Post Office ............................................................................. 36
Plate 3: Congestion ................................................................................................................... 37
Plate 4: congestion .................................................................................................................... 37
plate 5: state of walkway ........................................................................................................... 38
Plate 6: light lamp along Tom Mboya Street .............................................................................. 39
plate 7: Vegetation .................................................................................................................... 40

1
CHAPTER ONE: INTRODUCTION Introduction
1.1 Research topic: “Security challenges facing city street users. A case study of Tom Mboya Street”
1.2 Findings of the research project The main types of crime that occur along the street include:
• Mugging
• Pick-pocketing
• Petty theft, robbery and burglary
• Money laundering
The main types of businesses that are targeted include;
• M-pesa dealers
• Supermarkets
• Cafeteria
• Wholesale businesses
The main reasons for the occurrence of these crimes are congestion, poor security and poor
lighting.
The crime hot spots include:
• Afya Centre
• Post office
• Odeon Cinema
• Junction between Tom Mboya Street and Accra Road
• Back lanes

2
These hotspots are congested with human traffic due to the presence of public service vehicles. Pick-pocketing thrives in these areas. As for the back lanes, they are poorly lit hence attract mugging.
1.3 Recommendations There is need for re-design of the street. The walkway along the street is narrow and cannot
accommodate the huge volume of human traffic. Re-designing the street will enable the
expansion of the walkway so as to reduce congestion of the human traffic. This congestion is the
facilitator of pick-pocketing. From the research done on the streets users, 73% of pedestrians
interviewed named pick-pocketing as the type of crime that they had experienced.
The bus terminus at the Tom Mboya Post office should be eliminated as it is a congestion point.
Dropping and picking of passengers along the street should be prohibited.
Alternative areas should be identified for relocation of the public service vehicles that operate
along the street. Such areas may include the back lanes. This will reduce the congestion along the
street. This will also introduce the aspect of natural surveillance since there will be activities
occurring at the back lanes thus deterring muggers. Mugging was identified as the second most
occurring crime.
Lighting should be improved not only along the street but also the access roads and back lanes.
Back lanes should be closed to vehicular traffic as much as possible.
Any walls, trees, power boxes or solid fences that block the view should be eliminated or
modified.
Trees should be trimmed adequately to allow unobstructed lighting and visibility.
Bus shelters should be eliminated to increase the size of the walk way at Tom Mboya Post office.
Police should intensify their patrols along the street. Having plain-clothed police would be ideal
for arresting pick-pockets and muggers.

3
Figure 1-1: crime hotspots in the study area
Post Office Junction of Tom Mboya Street and Accra Road
Odeon Cinema
CRIME HOTSPOTS IN THE STUDY AREA

4
1.4 Chosen project “Re-designing of Tom Mboya Street to enhance crime prevention”
1.5 Reason for choice The rapid pace of urbanization coupled with the growth in city size and density is associated with
increased crime and violence. Poor urban planning, design and management play a role in the
shaping of urban environments that put citizens and property at risk. Poor urban planning, design
and management have increasingly been cited as playing a role in the shaping of urban
environments that put citizens and property at risk. This development project aims to correct this.
Re-designing of Tom Mboya Street will provide a lasting solution to counter existing crime and
also provide prevention measures for the same.
1.6 Location and area coverage
The development project will cover part of Tom Mboya Street i.e. from its junction with Accra
road up to Kodjah Roundabout.
Map 1-1: Study Area
Adapted from Google earth
Study area

5
1.7 Objectives of the development project Broad objective
• To improve security along Tom Mboya Street though environmental design
Other objectives
• To appraise relevant policies and standards for crime prevention and levels of adherence
to these
• To prepare a spatial strategy for crime prevention along Tom Mboya Street
• To prepare implementation and management framework for crime prevention along Tom
Mboya Street
1.8 Assumptions The assumptions include:
That re-designing of Tom Mboya Street is the best intervention to solve the current security
challenges along the street. By re-designing the hotspots, crime will be countered effectively.
The project also assumes that the recommendations and plan details in this report will be
implemented by the relevant authorities, that is, the City Council of Nairobi in partnership with
the Ministry of Nairobi Metropolitan Development.
1.9 Scope of the Development project and the organization of the project chapters
This project report is arranged in terms of chapters as follows:
Chapter 1: Introduction
Chapter 2: Review of Policy Guidelines, Standards and previous plans (Literature Review).
Chapter 3: Situation Analysis
Chapter 4: Project Planning, Design and Implementation
Chapter 5: Monitoring and Evaluation
6
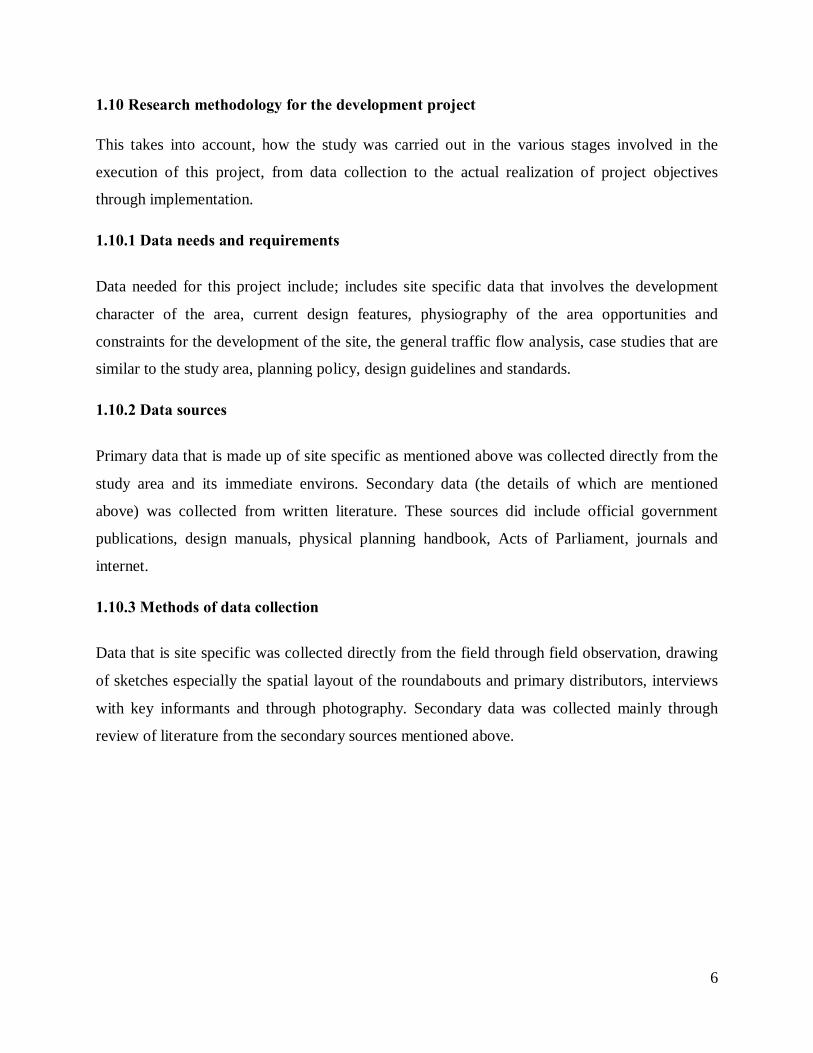
1.10 Research methodology for the development project
This takes into account, how the study was carried out in the various stages involved in the
execution of this project, from data collection to the actual realization of project objectives
through implementation.
1.10.1 Data needs and requirements
Data needed for this project include; includes site specific data that involves the development
character of the area, current design features, physiography of the area opportunities and
constraints for the development of the site, the general traffic flow analysis, case studies that are
similar to the study area, planning policy, design guidelines and standards.
1.10.2 Data sources
Primary data that is made up of site specific as mentioned above was collected directly from the
study area and its immediate environs. Secondary data (the details of which are mentioned
above) was collected from written literature. These sources did include official government
publications, design manuals, physical planning handbook, Acts of Parliament, journals and
internet.
1.10.3 Methods of data collection
Data that is site specific was collected directly from the field through field observation, drawing
of sketches especially the spatial layout of the roundabouts and primary distributors, interviews
with key informants and through photography. Secondary data was collected mainly through
review of literature from the secondary sources mentioned above.

7
1.10.4 Methods of data analysis
The data collected was analyzed based on various categories of data needs and presented
graphically in form of maps, plans, tables, photographs and charts accompanied by a well
synthesized and compiled report. The maps and plans include the following:
• Regional and local context of the study area
• Location plans
• Specific project area plans.
1.10.5 Methods of data presentation
The data presentation was in form of written texts, maps, tables, photographs and sketches. The
technique was determined by the type of data being presented. Qualitative data was mainly
presented in form of the reports summaries of the different responses to the questionnaires as
well as the description of the scenarios depicted by the photographs taken on the ground. For the
Quantitative data this was mainly presented using the various charts and graphs as well as tables.
Maps were used to analyze and present spatial data. The authentication of spatial data was done
through the use of photographs.
1.10.6 Limitations
The project encounters the following limitations
i) Financial constraints especially during the implementation stage. The project however proposes partnerships between public and private sectors who will be the beneficiaries of the project results to rise up towards solving this limitation.
ii) Time constraints right from the development to implementation of the project will be a
limitation of the project.

8
1.10.7 Definition of key terms and concepts
CPTED- Crime Prevention Through Environmental Design
Territoriality- A sense of ownership of one’s living or working environment.
EHW- Eveleigh Heritage Walk

9
CHAPTER TWO: LITERATURE REVIEW Policy Guideline Review
1.0 Overview. This chapter reviews the legal framework that guides this Development Project. Besides, it
entails the review of relevant planning policies, case studies, plans, design guidelines, regulations
and standards.
These laws and policies are important in providing a guiding framework for the re-designing of Tom Mboya Street. The review of case studies provides the ideas and strategies that enlighten the formulation of the plans.
1.1 Relevant Policies, Plans, Planning Policies and Design Guidelines.
Policies
The Constitution of Kenya
Section 3 of the constitution provides that this is the supreme law of the republic of Kenya and therefore has full force of the law throughout Kenya, and subject to section 47, any other law contravening the provisions therein shall be null and void. It is worth noting that planning is a legal entity and therefore practice as it is enshrined in the supreme law of the land. For instance, Section 75 (1) provides that no property of any description shall be compulsorily taken possession of, and no interest in or right over property of any description shall be compulsorily acquired, except where the following conditions are satisfied -
(a) the taking of possession or acquisition is necessary in the interests of defense, public safety, public order, public morality, public health, town and country planning or the development or utilization of property so as to promote the public benefit; and
(c) Provision is made by a law applicable to that taking of possession or acquisition for the prompt payment of full compensation.
10
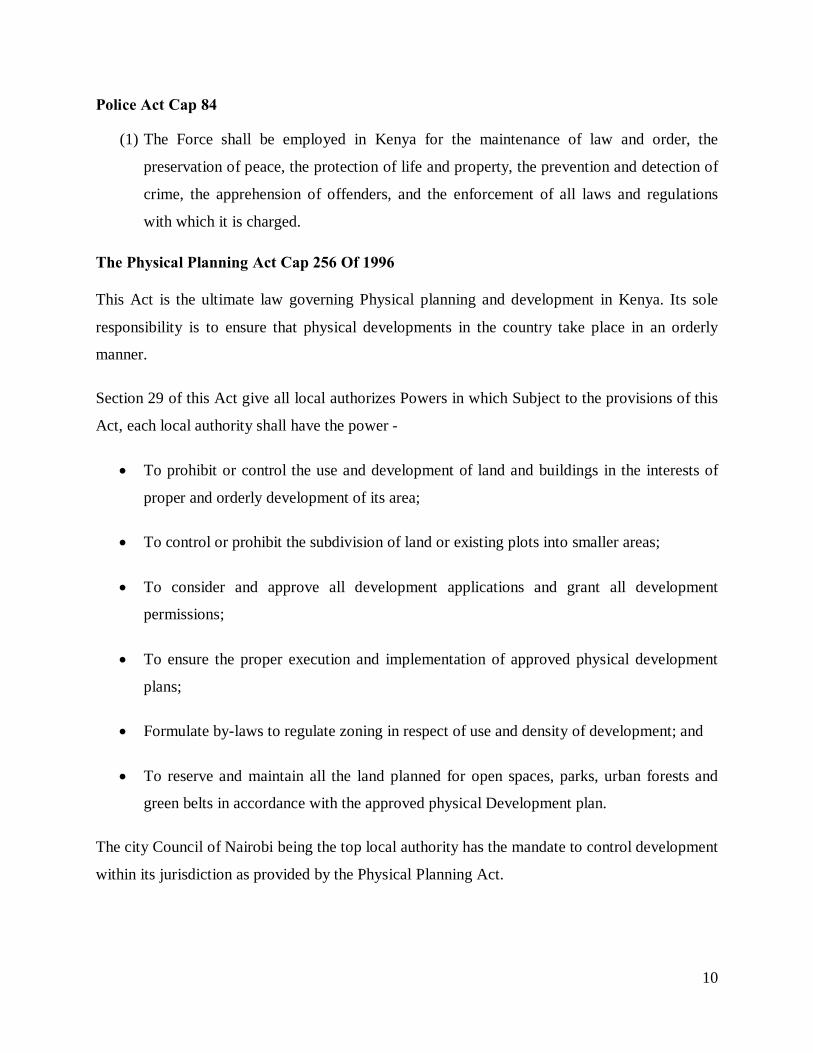
Police Act Cap 84
(1) The Force shall be employed in Kenya for the maintenance of law and order, the
preservation of peace, the protection of life and property, the prevention and detection of
crime, the apprehension of offenders, and the enforcement of all laws and regulations
with which it is charged.
The Physical Planning Act Cap 256 Of 1996
This Act is the ultimate law governing Physical planning and development in Kenya. Its sole
responsibility is to ensure that physical developments in the country take place in an orderly
manner.
Section 29 of this Act give all local authorizes Powers in which Subject to the provisions of this
Act, each local authority shall have the power -
• To prohibit or control the use and development of land and buildings in the interests of
proper and orderly development of its area;
• To control or prohibit the subdivision of land or existing plots into smaller areas;
• To consider and approve all development applications and grant all development
permissions;
• To ensure the proper execution and implementation of approved physical development
plans;
• Formulate by-laws to regulate zoning in respect of use and density of development; and
• To reserve and maintain all the land planned for open spaces, parks, urban forests and
green belts in accordance with the approved physical Development plan.
The city Council of Nairobi being the top local authority has the mandate to control development
within its jurisdiction as provided by the Physical Planning Act.

11
The Local Government Act Cap 265
This is an Act of Parliament to provide for the establishment of authorities for local government;
to define their functions and to provide for matters connected therewith and incidental thereto
under section 166 it provides that Every municipal council, county council or town council may,
subject to any other written law relating thereto, prohibit and control the development and use of
land and buildings in the interest of the proper and orderly development of its area. Under
Section 182 the Act stipulates that:
a) Every municipal council or town council shall have the general control and care of all
public streets which are situated within its area, and the same are hereby vested in such
local authority in trust to keep and maintain the same for the use and benefit of the
public.
b) A municipal council or town council may make, construct, alter, and repair and for any
such purpose temporarily close or divert, any such street, and may make new streets.
A municipal council or town council may, subject to any law relating to road traffic, by order,
prohibit the driving of vehicles on any specified road otherwise than in a specified direction:
Provided that no such order shall be made unless notice of the intention to make the same shall
be published in the Gazette at least fourteen days before the date on which it is intended to make
such order, and, before making such order, there shall be taken in
to consideration.
(i) any objections which may have been made to the making thereof; and,
(ii) the existence of alternative routes suitable for the traffic which would or might be affected by
the order
The Act thus gives councils adequate powers to control how a particular street will be used.
12
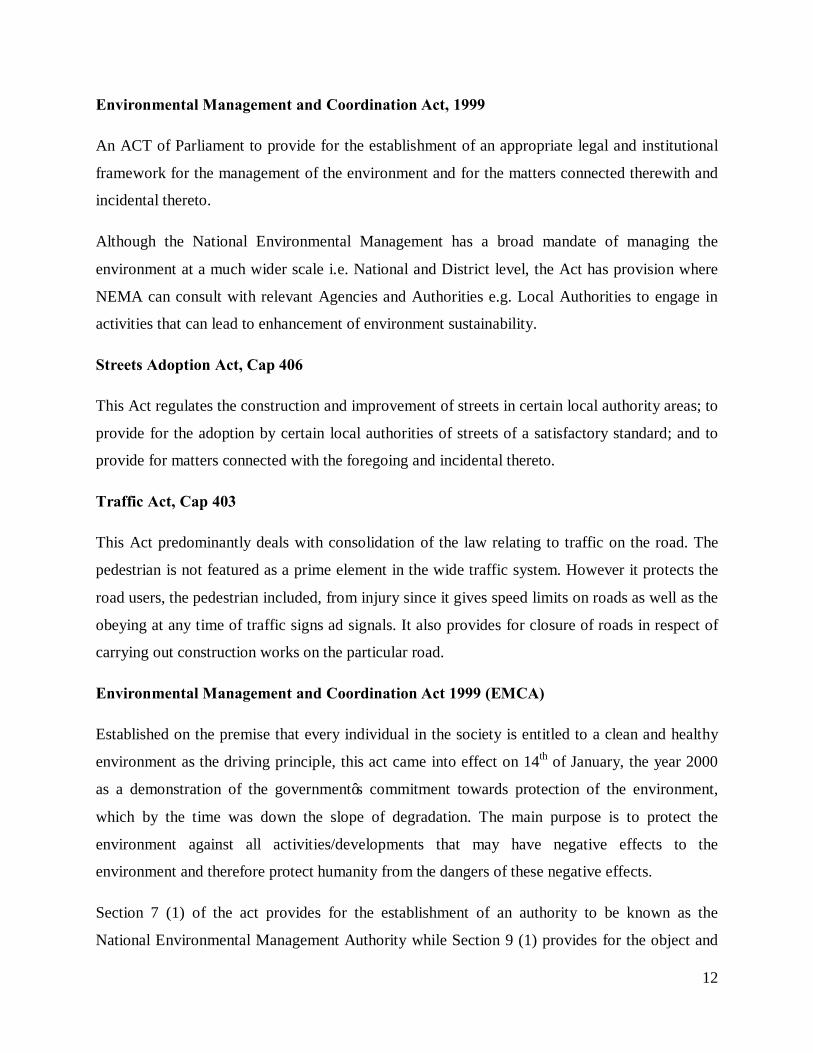
Environmental Management and Coordination Act, 1999
An ACT of Parliament to provide for the establishment of an appropriate legal and institutional
framework for the management of the environment and for the matters connected therewith and
incidental thereto.
Although the National Environmental Management has a broad mandate of managing the
environment at a much wider scale i.e. National and District level, the Act has provision where
NEMA can consult with relevant Agencies and Authorities e.g. Local Authorities to engage in
activities that can lead to enhancement of environment sustainability.
Streets Adoption Act, Cap 406
This Act regulates the construction and improvement of streets in certain local authority areas; to
provide for the adoption by certain local authorities of streets of a satisfactory standard; and to
provide for matters connected with the foregoing and incidental thereto.
Traffic Act, Cap 403
This Act predominantly deals with consolidation of the law relating to traffic on the road. The
pedestrian is not featured as a prime element in the wide traffic system. However it protects the
road users, the pedestrian included, from injury since it gives speed limits on roads as well as the
obeying at any time of traffic signs ad signals. It also provides for closure of roads in respect of
carrying out construction works on the particular road.
Environmental Management and Coordination Act 1999 (EMCA)
Established on the premise that every individual in the society is entitled to a clean and healthy
environment as the driving principle, this act came into effect on 14th of January, the year 2000
as a demonstration of the government’s commitment towards protection of the environment,
which by the time was down the slope of degradation. The main purpose is to protect the
environment against all activities/developments that may have negative effects to the
environment and therefore protect humanity from the dangers of these negative effects.
Section 7 (1) of the act provides for the establishment of an authority to be known as the
National Environmental Management Authority while Section 9 (1) provides for the object and
13
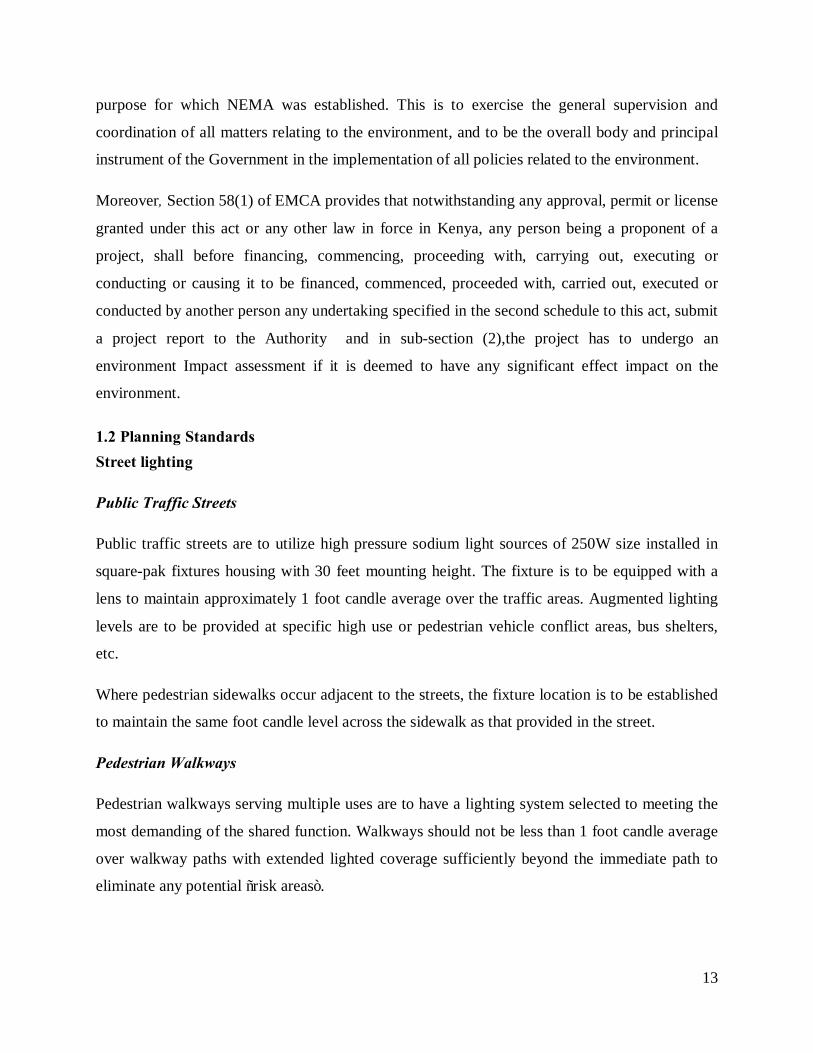
purpose for which NEMA was established. This is to exercise the general supervision and
coordination of all matters relating to the environment, and to be the overall body and principal
instrument of the Government in the implementation of all policies related to the environment.
Moreover, Section 58(1) of EMCA provides that notwithstanding any approval, permit or license
granted under this act or any other law in force in Kenya, any person being a proponent of a
project, shall before financing, commencing, proceeding with, carrying out, executing or
conducting or causing it to be financed, commenced, proceeded with, carried out, executed or
conducted by another person any undertaking specified in the second schedule to this act, submit
a project report to the Authority and in sub-section (2),the project has to undergo an
environment Impact assessment if it is deemed to have any significant effect impact on the
environment.
1.2 Planning Standards Street lighting
Public Traffic Streets
Public traffic streets are to utilize high pressure sodium light sources of 250W size installed in
square-pak fixtures housing with 30 feet mounting height. The fixture is to be equipped with a
lens to maintain approximately 1 foot candle average over the traffic areas. Augmented lighting
levels are to be provided at specific high use or pedestrian vehicle conflict areas, bus shelters,
etc.
Where pedestrian sidewalks occur adjacent to the streets, the fixture location is to be established
to maintain the same foot candle level across the sidewalk as that provided in the street.
Pedestrian Walkways
Pedestrian walkways serving multiple uses are to have a lighting system selected to meeting the
most demanding of the shared function. Walkways should not be less than 1 foot candle average
over walkway paths with extended lighted coverage sufficiently beyond the immediate path to
eliminate any potential “risk areas”.

14
Fixture style shall be “square-pak” type using 150W 100 volt operation high pressure sodium
lamps and may be spaced to allow up to 4:1 lighting ratio.
Fixture mounting height shall be 20 feet and located so as to ensure clear passage of bulky and
long vehicles such as fire trucks. Minimum clearance from edge of path to pole is to be as set out
in drawing E-2 page 14.
When walkways for exclusive pedestrian use are involved, light fixtures are to be square-pak
units 150W 100 volt operation high pressure sodium. Bollard style fixture shall not be utilized.
Fixture units be square-pak units.
Design Element Requirements
Design calculation procedures shall be in accordance with those established by the Illuminating
Engineering Society.
Light contributed to an outside area by “building-light-shine” shall not be considered as useful
light source. This light source is unreliable as a source for outdoor lighting requirements
particularly in view of the growing interest of reduction of building energy use by shutdown
when not in use.
Fixture pole location shall be determined by taking into account:
• .1 Distance spacing to maintain minimum lighting levels as defined in task lighting
requirements.
• .2 Location of trees, existing buildings, roadways, etc., shall be taken into consideration
to provide as close as possible satisfactory spacing of all elements.
Pole locations shall be:
• located back of street curbs approximately 3 ft (see E-2) and set to be a minimum hazard
to vehicle traffic,
• fixture tops shall not overhand street, sidewalks, or pathways,

15
• located to be clear of machine snow clearing operations of streets, sidewalks, or pathways
and take into account grass mowing and cultivation needs,
• located clear of pedestrian traffic,
• compatible with landscape design layout.
Fixture style for all new and replacement installations shall be uniform throughout and shall be
High Pressure Sodium, “square-pak” style; pole mounted utilizing square steel pole and
extension arms as appropriate. Lamp reflector, lens, and other light control components shall be
selected as appropriate for the specific application involved. Under canopy fixtures are to be
70W H.P.S.
All fixture poles, exposed metal bases, housings, etc., shall be painted with University brown.
Fixture poles heights shall be:
• 30 feet for public traffic areas,
• 20 feet for pedestrian/service roads
4.7 The use of light standards for mounting traffic signs is to be encouraged in preference to
installing separate sign poles.
4.8 Identification number decals will be applied on all light units and poles readable from ground
level, these decals to be applied by University of Alberta personnel in accordance with outdoor
lighting record drawings maintained by the University of Alberta.
4.9 Pole base and foundation details shall be as shown on Sketch E-2, dated May 1986.

16
1.3 Crime Prevention Through Environmental Design Crime Prevention Through Environmental Design ("CPTED") is the proper design and effective
use of the built environment in order to lead to a reduction in the fear and incidence of crime, and
an improvement in the quality of life (National Crime Prevention Institute)
CPTED involves the design of a physical space so that it enhances the needs of bona fide users
of the space. This emphasis on design and use deviates from the traditional "target hardening"
approach to crime prevention (National Crime Prevention Institute).
Owners, managers and community users have a joint responsibility by reporting to the police all
suspicious activities and criminal occurrences; without this, the effectiveness of CPTED is
minimized. Creating and maintaining partnerships with the community and the City of Tempe
will aid in improvement of quality of life issues and make for a safer environment and a more
productive community.
For CPTED to be successful, it must be understandable and practicable for the normal users of
the space. The normal users know more about what is going on in the environment and they have
a vested interest (their own well-being) in ensuring that their immediate environment operates
properly. The "Three-D" approach to space assessment provides a simple guide for the normal
users in determining the appropriateness of how their space is designed and used. The Three-D
concept is based on the three functions or dimensions of human space:
i) All human space has some designated purpose.
ii) All human space has social, cultural, legal or physical definitions that prescribe the
desired and acceptable behaviors.
iii) All human space is designed to support and encourage the desired behaviors.

17
CPTED is supported by the following five overlapping principles that are applied to specific sites
and situations.
1) Territoriality
2) Surveillance
3) Access control
4) Activity support
5) Maintenance
1. Territoriality
Territoriality is a concept that clearly delineates private space from semi-public and public
spaces, and creates a sense of ownership. Ownership thereby creates an environment where
appearance of such strangers and intruders stand out and are more easily identified through:
• The enhanced feeling of legitimate ownership by reinforcing existing natural surveillance
and natural access control strategies with additional symbolic or social ones.
• The design of space to allow for its continued use and intended purpose.
• The use of pavement treatments, landscaping, art, signage, screening and fences define
and outline ownership of space.
2. Surveillance
Surveillance is a design concept directed primarily at keeping intruders under observation.
Provision of natural surveillance helps to create environments where there is plenty of
opportunity for people engaged in their normal behavior to observe the space around them. Areas
can be designed so they are more easily observed through:
• Design and placement of physical features to maximize visibility. This will include
building orientation, windows, entrances and exits, parking lots, refuse containers,
walkways, guard gates, landscape trees and shrubs, use of wrought iron fences or walls,
signage and other physical obstructions.
• Placement of persons or activities to maximize surveillance possibilities.

18
• Minimum maintained lighting standards that provide for nighttime illumination of
parking lots, walkways, entrances, exits and related areas to promote a safe environment.
3. Access Control
Access control is a design concept directed primarily at decreasing criminal accessibility.
Provision of natural access control limits access and increases natural surveillance to restrict
criminal intrusion, especially into areas where they will not be easily observed. When present,
intruders are more readily recognized through:
• The use of sidewalks, pavement, gates, lighting and landscaping to clearly guide the
public to and from entrances and exits.
• The use of gates, fences, walls, landscaping and lighting to prevent or discourage public
access to or from dark or unmonitored areas.

19
4. Activity Support
Activity support is the presence of activity planned for the space. Activity support involves
placing activity where the individuals engaged in an activity will become part of the natural
surveillance system. Examples include:
Ø Place safe activities in areas that will discourage would be offenders, to increase the
natural surveillance of these activities and the perception of safety for normal users, and
the perception of risk for offenders.
Ø Place high risk activities in safer locations to overcome the vulnerability of these
activities by using natural surveillance and access control of the safe area.
Ø Locate gathering areas in locations that provide for natural surveillance and access
control or in locations away from the view of would-be offenders.
Ø Improve the scheduling of space to allow for effective use and appropriate intensity of
accepted behaviors.
5. Maintenance
Proper maintenance of landscaping, lighting treatment and other features can facilitate the
principles of CPTED, territorial reinforcement, natural surveillance and natural access control.
Functions include:
a. Proper maintenance of lighting fixtures to prescribed standards.
b. Landscaping which is maintained at prescribed standards.
c. Minimizing the conflicts between surveillance and landscaping as the ground cover,
shrubs and trees mature.
Recognition of these underlying concepts may help guide owners, architects, planners and
developers of property in designing built environments that accomplish the goals of CPTED as
outlined in these Guidelines.

20
1.4 Case studies Case study 1: Crime Prevention Through Environmental Design Report (Australia)
Introduction
This is based on a report submitted by the Redfern-Waterloo Authority to the Department of
Planning. It is based on an understanding of the Crime Prevention Through Environmental
Design (CPTED) principles, key policy drivers promoting designing out crime and an analysis of
the crime profile of the local area.
Crime Prevention and the Assessment of Development Applications: guidelines under section
79C of the Environmental Planning and Assessment Act 1979 identify five CPTED principles
i.e.
1) Territoriality
2) Surveillance
3) Access control
4) Activity support
5) Maintenance
City of Sydney Local Government Area Crime Profile
Across the local government area the Safe City Strategy 2007 – 2012 (Strategy) notes the crime
trends and factors across the local government area. The top five recorded crimes between 1996
and 2006 were non-domestic related assault, fraud, malicious damage to property, steal from
motor vehicles and steal from person offences. Crime tends to peak between Friday and Sunday
with increases in crime experienced over the summer months.
Across the city, crime most commonly occurred in outdoor / public places, licensed premises,
residential dwellings and retail / wholesale outlets. Both victim and offender profiles of crime
committed with the City of Sydney are predominately persons aged between 20 and 39 years.
The City of Sydney Household Survey (2006) is referenced in the Strategy and provides an
overview of residents’ perceptions of safety across the City. Redfern residents were one of three

21
suburbs that highlighted crime and community safety problems as one of the top three issues that
they liked least about their area.
Hotspot map showing stealing from a person across the Sydney LGA
Source: NSW BOSCAR 2006
The proposed EHW provides an extension of Ivy Lane and the Wilson Street public square
which will enhance the legibility of the proposed EHW and permeability to the southern side of
the railway line. Users of the area will be able to navigate themselves with greater ease owing to

22
the strong links with the ATP site and broad viewing opportunities of the area and district created
by the elevated structure. By way of this improved visual connection, crime is expected to be
reduced.
The EHW will also act as an activity generator by attracting more cyclists and pedestrians along
the new route as well as general users who will be intrigued by the high quality design and
viewing panoramas offered along the south bound tracks. Students of the University of Sydney
are likely to be active users of the EHW also and their numbers are expected to increase over the
coming years as part of the University’s current works program. By attracting more people in
this locale, activity can reduce opportunities for crime.
Natural surveillance is expected to be generated by the proposed North Eveleigh development
which will have a number of residential and commercial uses in close proximity to the EHW as
well as the existing residential development at the southern landing (Watertower). Commercial
activity and pedestrian flows to and from the ATP site will also create natural surveillance
opportunities and minimize the potential for criminal activity.
Activation of the general area is expected to increase with the development of the RWA’s sites.
The structure of the EHW has been designed to be open as possible, with allowance for
RailCorp’s design imperatives regarding throw screens. Entry and exit points on the EHW are
open, in particular with minimal enclosure of the stairwell, providing clear sight lines and
preventing opportunities for the entrapment of pedestrians and cyclists. CCTV is also proposed
to be mounted on the EHW.
Lessons learnt
• Delivering good urban design of streets by improving street lighting.
• Expanding the lanes for easier navigation
• Ensuring that entry and exit points are open, in particular with minimal enclosure of the
stairwell, providing clear sight lines and preventing opportunities for the entrapment of
pedestrians and cyclists.

23
Case study 2: Stroud Town Centre- England
Map 2: Map of Stroud Town Centre
Map of Stroud Town centre
Overview
The improvements to Stroud town centre show how planning can be used as a successful weapon
against anti-social behaviour and crime against shops. The abuse of alcohol in public areas was
seriously affecting the quality of life of other residents and impacting on businesses.
Context
Stroud has a pleasant town centre that has suffered from high levels of crime and anti-social
behaviour. In particular, there have been problems associated with street drinking, begging, drug
addiction and shoplifting.
A range of organizations, including the local authority and the police, enabled the transformation
of the town centre. Key amongst these has been the Town Centre Crime and Disorder Group,
which allows the key public, private and voluntary agencies to take ownership of the town’s
crime reduction efforts.
In addition to the planning processes discussed below, the criminal justice system was also used
at the local level. A bylaw passed in 2000 to make street drinking illegal has had a major impact.
24
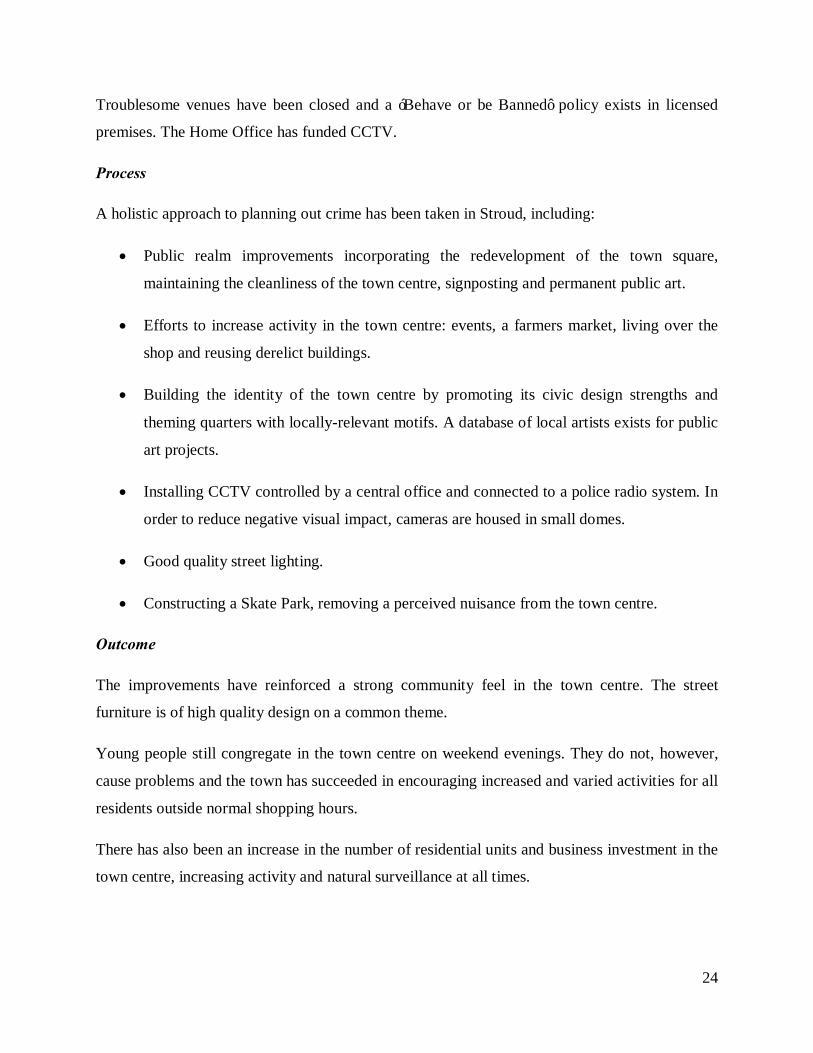
Troublesome venues have been closed and a ‘Behave or be Banned’ policy exists in licensed
premises. The Home Office has funded CCTV.
Process
A holistic approach to planning out crime has been taken in Stroud, including:
• Public realm improvements incorporating the redevelopment of the town square,
maintaining the cleanliness of the town centre, signposting and permanent public art.
• Efforts to increase activity in the town centre: events, a farmers market, living over the
shop and reusing derelict buildings.
• Building the identity of the town centre by promoting its civic design strengths and
theming quarters with locally-relevant motifs. A database of local artists exists for public
art projects.
• Installing CCTV controlled by a central office and connected to a police radio system. In
order to reduce negative visual impact, cameras are housed in small domes.
• Good quality street lighting.
• Constructing a Skate Park, removing a perceived nuisance from the town centre.
Outcome
The improvements have reinforced a strong community feel in the town centre. The street
furniture is of high quality design on a common theme.
Young people still congregate in the town centre on weekend evenings. They do not, however,
cause problems and the town has succeeded in encouraging increased and varied activities for all
residents outside normal shopping hours.
There has also been an increase in the number of residential units and business investment in the
town centre, increasing activity and natural surveillance at all times.

25
Plate 1: processes
Stroud’s improvements are reflected in crime figures. There have been no robberies in the last
two years. In the same period, burglary has halved from 51 to 25 incidents per year and shop
theft has fallen by a quarter. Car crime remains very low.

26
SECURITY CHALLENGES FACING TOM MBOYA STREET
Human traffic congestion
Poor lighting Poor security surveillance Poor maintenance of infrastructure
CAUSES OF THESE CHALLENGES
Delayed planning interventions and poor enforcement of existing
regulations
Weak policy, legal and institutional
framework
Poor planning of streets
PLANNING INTERVENTIONS
Development control Proper enforcement of existing regulations
Proper planning of streets Strengthening of policy, legal and institutional framework
RESULTS OF THE INTERVENTION
Human traffic decongestion
Increased security surveillance
Improved lighting Proper maintenance of infrastructure
Coordinated spatial and structural development
Strong policy, legal and institutional frameworks
A CRIME FREE STREET
Harmony and integratio
1.5 Conceptual framework Figure 2: Conceptual Framework

27
CHAPTER THREE: SITUATIONAL ANALYSIS
3.1 Location of the Study Area Tom Mboya Street is located in Nairobi and it stretches from its junction with Murang’a Road up
to its junction with Haile Sellassie Avenue. It is one of the busiest streets in Nairobi because it
feeds Latema Road, Accra Road, Ronald Ngala Street and Hakati Road which attract huge
volume of public service vehicles. Tom Mboya itself has drop-off and pick-up points for PSVs
that commute to and fro Eastleigh, Lang’ata, Gachie and Embakasi.
National context
Map 3: Kenya

28
Regional context
Map 4: Nairobi
Source: Adopted from Physical Planning Department
Local context
Map 5: Tom Mboya Street
Adapted from Google earth

29
3.2 Historical Development of Nairobi
The City of Nairobi started as a railway camp in 1899 and soon became a centre of
communication, administration and commerce. In time the town grew in size and function to
become the major metropolis in Eastern Africa. Nairobi's current population is about 3.5 million
(2005). Between 1979 and 1989 its rate of growth was about 4.5 percent per year. While this has
declined from its peak of 7.1 percent between 1969 and 1973, the numbers involved are still
high.
This large population continues to pose serious problems for the Nairobi City Council; problems
compounded by the rapid parallel increase in population in the outskirts of the City, in both the
designated urban / trading centers and in surrounding areas.
A number of peri-urban areas have also developed into major population centres which depend
largely on the City of Nairobi for services and employment, a fact usually ignored when planning
for City services. It is imperative; therefore, that Nairobi plans for a Greater Metropolitan Area
and not just for the area within the administrative boundary of the City of Nairobi.
The period immediately after independence was characterized in particular by rapid growth,
creating pressures in housing, community services and physical infrastructure. The city had to
commission a new, comprehensive, urban study to lay out its growth strategy up to the turn of
the Century. The outcome of this was the Nairobi Metropolitan Growth Strategy in 1973, which
consisted of a series of policies related to the major aspects of urban development and the broad
physical structure within which these policies could be realized. It was hoped then that the City
would maintain a continuous review of policies and structures and adjust them to suit the
changing circumstances, but, clearly, this has not happened.

30
3.3 Population and Demographic characteristics
Nairobi has and is experiencing one of the highest population growth rates of any city in Africa.
Since its foundation in 1899, Nairobi has grown to become the largest city in East Africa, despite
being the youngest city in the region. The growth rate of Nairobi is currently 6.9%. It is
estimated that Nairobi's population will reach 5 million in 2015.
Table 1: Population
Year Population
1999 2,143,254
2005 2,750,561
2009 3,138,295
Density 4,509/km2 (11,678.3/sq mi) Source: Central Bureau of Statistics,2009
The matatu termini along the street attract a high percentage of people using the street. Tom
Mboya Street by having several big supermarkets such as Tuskys and Ukwala, attracts people
going for shopping.
3.4 Climatic conditions
Analysis of climatic conditions helps in several ways:
• To establish if the rainfall can sustain the trees to be planted in the implementation stage
• If the rainfall will affect the drainage system along the streets
Nairobi is situated 91.7 km (57 miles) south of the equator and at an altitude of about 1676
(5,500 feet) above sea level, the temperatures in this altitude are too low for the malaria mosquito
to survive. It is some 526 km (327 miles from the coast and enjoys what may be described as a
continental tropical climate).

31
3.4.1 Temperature
Nairobi enjoys a moderate climate. Under the Koppen climate classification, Nairobi has a
Subtropical Highland climate.
• The average temperature in Nairobi, Kenya is 17.7 °C (64 °F).
• The average temperature range is 3.5 °C.
• The highest monthly average high temperature is 26 °C (79 °F) in February.
• The lowest monthly average low temperature is 10 °C (50 °F) in July, August &
September.
• Nairobi's climate receives an average of 925 mm (36.4 in) of rainfall per year, or 77 mm
(3.0 in) per month.
• On average there are 89 days per year with more than 0.1 mm (0.004 in) of rainfall
(precipitation) or 7 days with a quantity of rain, sleet, snow etc. per month.
• The driest weather is in July when an average of 19 mm (0.7 in) of rainfall (precipitation)
occurs across 3 days.
• The wettest weather is in April when an average of 206 mm (8.1 in) of rainfall
(precipitation) occurs across 15 days.
• The average annual relative humidity is 72.8% and average monthly relative humidity
ranges from 64% in October to 79% in July.
• Average sunlight hours in Nairobi range between 4.3 hours per day in July and 9.5 hours
per day in February.
• There is an average of 2525 hours of sunlight per year with an average of 6.9 hours of
sunlight per day.
• There is an average of 0 days per year with frost in Nairobi and in January there is an
average of 0 days with frost.

32
Graph 1: temperature
3.4.2 Rainfall
There are two rainy seasons but rainfall can be moderate. The cloudiest part of the year is just
after the first rainy season, when, until September, conditions are usually overcast with drizzle.
As Kilimani is situated close to the equator, the differences between the seasons are minimal.
The seasons are referred to as the wet season and dry season. The timing of sunrise and sunset
varies little throughout the year, due to Nairobi's close proximity to the equator.

33
Table 2: weather data for Nairobi
Month Jan Feb Mar Apr May Jun Jul Aug Sep Oct Nov Dec Year
Record high
°C (°F)
29
(84)
31
(88)
30
(86)
28
(82)
28
(82)
27
(81)
26
(79)
27
(81)
28
(82)
30
(86)
28
(82)
28
(82)
31
(88)
Average
high °C (°F)
25
(77)
26
(79)
25
(77)
24
(75)
22
(72)
21
(70)
21
(70)
21
(70)
24
(75)
24
(75)
23
(73)
23
(73)
23
(73)
Average low
°C (°F)
12
(54)
13
(55)
14
(57)
14
(57)
13
(55)
12
(54)
11
(52)
11
(52)
11
(52)
13
(55)
13
(55)
13
(55)
13
(55)
Record low
°C (°F)
8
(46)
9
(48)
9
(48)
11
(52)
9
(48)
7
(45)
6
(43)
7
(45)
5
(41)
7
(45)
6
(43)
8
(46)
5
(41)
Precipitation
mm (inches)
38
(1.5)
64
(2.52)
125
(4.92)
211
(8.31)
158
(6.22)
46
(1.81)
15
(0.59)
23
(0.91)
31
(1.22)
53
(2.09)
109
(4.29)
86
(3.39)
959
(37.76)
Source: BBC Weather 2009-08-18

34
Graph 2: climate

35
3.5 Land use analysis
Heavy commercial
Light commercial
Fire station
LEGEND
N
LAND USE MAP
Church
36
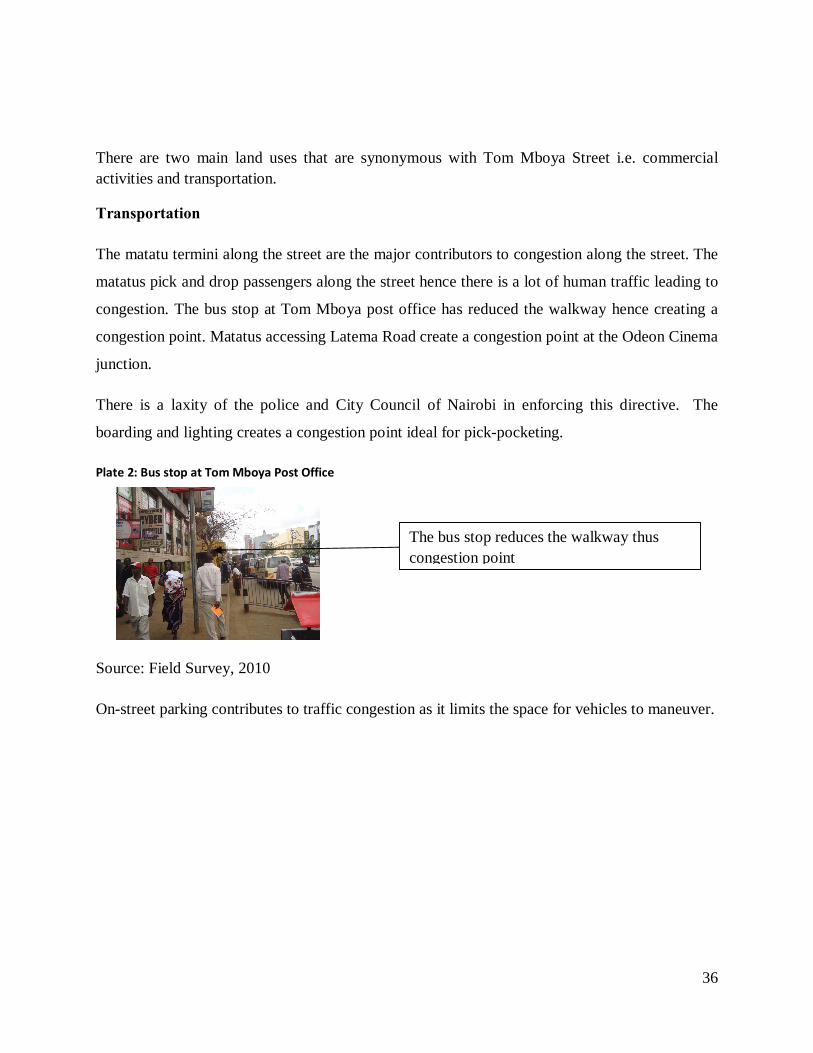
There are two main land uses that are synonymous with Tom Mboya Street i.e. commercial activities and transportation.
Transportation
The matatu termini along the street are the major contributors to congestion along the street. The
matatus pick and drop passengers along the street hence there is a lot of human traffic leading to
congestion. The bus stop at Tom Mboya post office has reduced the walkway hence creating a
congestion point. Matatus accessing Latema Road create a congestion point at the Odeon Cinema
junction.
There is a laxity of the police and City Council of Nairobi in enforcing this directive. The
boarding and lighting creates a congestion point ideal for pick-pocketing.
Plate 2: Bus stop at Tom Mboya Post Office
Source: Field Survey, 2010
On-street parking contributes to traffic congestion as it limits the space for vehicles to maneuver.
The bus stop reduces the walkway thus congestion point

37
Plate 3: Congestion
Pedestrian walkway
The walkway along the street is narrow thereby forcing pedestrian to walk along the motor way
Plate 4: congestion
Source: Field Survey, 2010
Some parts of the walkway are in a poor state hence harzardous to pedestrians incase they fall.

38
plate 5: state of walkway
Source: Field Survey, 2010
Commercial activities
The study area has numerous commercial activities. It has four supermarkets. Most of the buildings have been partitioned to accommodate the numerous stalls that sell phones and their accessories, jewellery, electronics and clothes.
Source: Field Survey, 2010

39
3.6 Site analysis Lighting
Plate 6: light lamp along Tom Mboya Street
Source: Field Survey, 2010
The above picture shows the kind of lighting that is along Tom Mboya Street. This lighting is
poor since the light coming from it only covers a small area.
The area between the lamp post is 15 m thus the centre of two posts is not illuminated properly.
At night, this provides a potential site for mugging.
Street vegetation
The City Council of Nairobi embarked earlier in street beautification by planting trees along the
streets. However the trees have grown without pruning and this has resulted to the trees
obscuring vision. They limit the visibility along the street which is essential in creating natural
surveillance.
The roots of the trees have further damaged the walkway as they grow.

40
plate 7: Vegetation
Source: Field Survey, 2010
3.7 Legal and Institutional Framework
In order for the project to succeed, it is important to identify the legal, institutional and financial issues that affect the study area. In this case, they are identified below:
3.7.1 Nairobi City Council
Nairobi City Council is the local authority agent in service provision in the city of Nairobi. The council has 15departments responsible for various areas of service provision to the city of Nairobi as well as committees responsible for policy formulation. The departments include:-
1. Administration Department headed by the Town Clerk
2. Human Resources Management Department
3. Legal Affairs Department
4. City Planning Department
5. City Engineer Department
6. Audit Department
7. Investigations Department
8. Social services and Housing Department
9. City Treasurer Department

41
10. Public Health Department
11. Environment Department
12. Housing Development Department
13. Director Procurement Department
14. Inspectorate Department
15. Education Department
City Planning and Architecture Department, City Council of Nairobi:
The department has various sections which are important with the provision of higher education in the CBD. These are:
Development Control Section: The section deals with all planning applications to ensure all planning development guidelines are complied with before planning consent is given. Planning applications include, land sub-divisions, land or property change of user, property extension of user, land lease extension and major urban projects.
Building and survey Section: This section deals with building proposals as is required by the building code and the physical planning act. All building proposals must get development consent before construction commences.
Landscape Design Development (urban design) Section: This section was established to deal with general urban design from streetscapes, parks and open spaces and other soft recreational facilities. The section advises on urban architectural heritage, preservation, restoration, and general landscape issues.

42
3.7.2 Nairobi Central District Association (NCBDA)
Nairobi Central Business District’s mission and work plan are to ensure the ongoing sustainable development of the existing city and to support Redevelopment, Revitalization and new Investment in key areas of the Central Business District of Nairobi and its environs. The goal is to create inclusion and maintain a vibrant city for employment, Visitors and Residents.
3.7.3 The Ministry of Nairobi Metropolitan Development
This is a newly formed ministry concerned with the wider Nairobi Metropolitan region with among its main focus being restructuring the systems n the CBD to make it efficient and well functioning.
Council and Committee structure of the City Council of Nairobi

43
CHAPTER 4: PROJECT PLANNING, DESIGN AND IMPLEMENTATION.
4.1 Overview
This chapter explores possible design options for re-designing a street in order to combat crime.
It is from the analysis alternatives that the preferred development model is made. From the
preferred plan, development details as layouts of public spaces and building designs are
explained. Evaluated too in this chapter are objectives, implementation strategies and schedules,
programmes and projects.
4.2 Planning and Design of this Project The expected outputs of this development project are enshrined around the attainment of the goals and objectives of this project. For the sake of this development project therefore, they have been stated alongside the specific objectives as follows:
Table 4-1: Expected Project Output.
4.3 Site Planning
Specific Objective (s) Expected Output/Outcome (s) Implications
To decongest the human traffic along the study area
Elimination of the on-street parking and widening of the walkway
This will ensure continuous flow of human traffic thus reducing congestion which provides the environment for pick-pocketing
To improve the lighting and provide proper street vegetation
Better lighting and planting of street vegetation will improve visibility at night
This will reduce chances of mugging at night
Phasing of the development project for implementation purposes
Proper coordinated implementation of the projects
This will ensure consistency and orderly execution of the provisions of the preferred design alternatives.
To outline a Management, Evaluation and Implementation structure
Implementation Schedule and an Environmental Management plan.
Doing away with deviation from design standards and protection of the Environment.
44
4.4 Design Alternatives 4.4.1 Alternative One: Human Traffic Decongestion Plan
The main objective of this plan is to decongest the human traffic along the street. This congestion was identified as the major cause of pick-pocketing.
Planning and Design Components
1. Widening and repairing the walkway
2. Increasing the human traffic circulation along the street to prevent congestion
3. Restricting public service vehicles from picking and dropping passengers along the street
4.4.2 Alternative Two: Crime Prevention Through Environmental Design Plan
Planning and Design Components
Surveillance: This will entail installation of proper lighting, and rehabilitation of the already existing surveillance materials e.g. lighting poles
Maintenance: This will involve landscaping, pruning of trees and improving the aesthetic value of developments.
Territoriality: Vendors along the walkway promotes congestion along the street. This congestion in turn promotes pick-pocketing. Hawking should therefore be discouraged.
Activity support: Activity support is very important in promoting surveillance. Incorporation of activities such as cafes at corners will promote this.
4.4.3 Evaluation of alternative models 2 and 3:
Human Traffic Decongestion Plan
Advantage
It will increase the circulation of human traffic.
Disadvantage
Relocation of some functions will be expensive and might take a long time e.g. matatu bus stop.
45
Crime Prevention Through Environmental Design Plan
Advantage
It involves rehabilitation and redesigning of the study are to come up with a viable crime
prevention plan that can be implemented
Disadvantage
It is expensive to implement
It is time consuming
It involves a lot of experts
Alternative 3: Integrated Approach (preferred plan)
This alternative combines the concepts identified from the above two alternatives. It seeks to decongest the human traffic and also improve the conditions along the street so enhance crime prevention.
The objectives of this alternative include:
• To increase pedestrian movement along the street
• To avail necessary infrastructure and utilities needed for enhanced pedestrian mobility
• To promote environmental sustainability through minimized pollution
• To create an aesthetically pleasing street environment with a sense of place and identity
Planning and design processes
1. Eliminating the on-street parking
2. Eliminating the bus stop at Tom Mboya Post Office
3. Restricting boarding and alighting of passengers along the street
4. Widening and repairing the walkway
5. Installation of CCTV camera, proper lighting, and rehabilitation of the already existing surveillance materials e.g. lighting poles
6. Landscaping, pruning of trees and improving the aesthetic value of developments.

46
Advantages
• It improves the aesthetic value of the street
• It will increase the circulation of human traffic.
• It involves rehabilitation and redesigning of the study are to come up with a viable crime
prevention plan that can be implemented
• It is a long lasting solution to crime
Disadvantages
• Relocation of some functions will be expensive and might take a long time e.g. matatu
bus stop.
• It is expensive to implement
• It is time consuming
• It involves a lot of experts

47
A model showing improved pedestrian facilities- A section of Tom Mboya Street
Interventions
• Eliminating the on-street parking
• Increasing the walkway
• Planting trees that do not obscure visibility
• Installing lights that illuminate the walkway and the motorway
• Putting bollard along the walkway to prevent vehicles accessing the expanded walkway

48
Figure 3: Street Layout
Bollards have also been added to prevent vehicles from driving on the walkway.
The lighting poles are placed at a distance of 12m between each other. This will increase the lighting of the street and prevent occurrence of blind zones. The poles should have twin bulbs i.e. for lighting the motorway and the other one for lighting the walkway.
The walkway has been increased from the present 3m to 5m so as to accommodate the huge volume of pedestrian traffic. The on-street parking and the Post Office terminus will have to be eliminated for this additional space to be realized. This will increase the traffic circulation thus reducing congestion.

49
Action Plans
i. Provision of adequate pedestrian space that will facilitate and enhance pedestrian movement without causing discomfort. The width of pedestrian walkways be increased from the present 3m to 5m on either side of the street. This width will be able to accommodate the huge volume of human traffic.
ii. The paving material on the walkway surface be of quality, non slippery and durable so as to protect the pedestrian from any injury when walking. This will also enable the pedestrians to walk faster hence a sustainable flow of traffic. This will reduce the traffic congestion.
iii. Lighting of the street should be enhanced to a point where the light illuminated the whole street with no blind zone. The pedestrian should have a good view of the street ahead so as to minimize the dangers of being mugged.
iv. The provision of well maintained urban greenery that entails well trim trees and hedges in order to prevent blind zones that may result to mugging. The actors include City Council of Nairobi, Ministry of Nairobi Metropolitan Development and contractors.
v. Redirect and re route traffic to other streets to enable fast paced construction works to take place.
(The actors include City Council of Nairobi, Kenya Police, Ministry of Nairobi Metropolitan Development and contractors. The site is the whole of the study area.)

50
4.5 Implementation Strategies Objectives Strategies Programs/Projects Actors
To increase pedestrian movement along the street
decongest the human traffic along the street
Widening the walkway
Removal of on-street parking
Removal of the Post Office bus terminus
CCN
NCBDA
To avail necessary infrastructure and utilities needed for enhanced pedestrian mobility
Introduce pedestrian infrastructure and
utilities.
Expand the pedestrian walkway in order
to accommodate the infrastructure
CCN
MOT
To promote environmental sustainability through minimized pollution
Elimination of parking along the street.
introduction of urban greenery
Identification and construction of alternative parking areas and bays.
Tree planting programmes
Preparation and implementation of an Environmental Management Plan and impact assessments
CCN
MoENR
NEMA
To create an aesthetically pleasing street
environment with a sense of place and
identity.
planting of greenery e.g. trees
Introduction of public art displays and
information boards
Encourage pedestrian cohesion through
socialization
Reclaiming of excess street space for
public use.
CCN
MoNH

51
4.6 Implementation Schedule
Activity 2010 2011 2012
Q1 Q2 Q3 Q4 Q1 Q2 Q3 Q4 Q1 Q2 Q3 Q4
Project Design Proposal
Public and Stakeholder Consultation
Environmental Impact Assessment
Plan approval by CCN
Public Transport Relocation Action Plan
Commencement of Construction works
expansion of sidewalks, laying of utilities
and services lines, installation of pedestrian
infrastructure and amenities, signage,
paving of sidewalks
Tree planting and beautification
Street opening to assess adoption new use

52
and function
Official opening by The City Council Of
Nairobi.
Monitoring and Evaluation
Q1=First Quarter of the Year; Q2=Second Quarter of the Year; Q3=Third Quarter of the Year; Q4=Fourth Quarter of the Year

53
4.7 Costing and Resource Requirement
Activity Costs and Resource requirements
Actors
Public and Stakeholder
Consultation
Costs to be done by CCN and Lead planner
All stakeholders, CCN, government
Environmental Impact
Assessment
Costs to be done by NEMA, environmental planner
Lead planner, NEMA
Plans approval by CCN To be done by lead planner and CCN
Planner, CCN
Public transport relocation to
back lane
Costs to be done by lead planner, traffic police, CCN
Traffic Police, CCN, matatu owners
Commencement of Construction
works expansion of sidewalks,
laying of utilities and services
lines, installation of pedestrian
infrastructure and amenities,
signage, paving of sidewalks
To be done by project committee, CCN, construction company, experts including architects, landscapers, engineers
CCN
Monitoring And Evaluation To be done by project committee
All stakeholder
Tree planting and beautification Cost to be done by project committee, NCBDA, NGO, CCN
CCN,NGOs, NCBDA
54
CHAPTER 5: MONITORING AND EVALUATION
5.1 Introduction Monitoring is the continuous assessment of project implementation in relation to agreed
schedules, and of the use of inputs, infrastructure, and services by project beneficiaries.
Monitoring provides managers and other stakeholders with continuous feedback on
implementation. It identifies actual or potential successes and problems as early as possible to
facilitate timely adjustments to project operation.
Evaluation is the periodic assessment of a project's relevance, performance, efficiency, and
impact (both expected and unexpected) in relation to stated objectives: interim evaluations
during implementation are taken as a first review of progress, a prognosis of a project's likely
effects, and as a way to identify necessary adjustments in project design. The use of mid-term
reviews of ongoing projects is done and terminal evaluations, conducted at the end of a project,
are required for project completion reports. They include an assessment of a project's effects and
their potential sustainability.
5.2 Monitoring and Evaluation Stages in The Implementation Of The Project(s)
Besides constant periodic monitoring and evaluation of project(s) the success of the implementation of the proposed project(s) demands full participation and commitment of all stakeholders. Through this, continuous feedback of the overall progress of the project will be assessed so as to provide information on the success of the project. The monitoring process will be done from the commencement and operational stages of the project as well as the completion and post implantation stages of the project
Both stages monitoring and evaluation will require the setting up of relevant monitoring teams and committees which comprise of members of all involved stakeholder i.e. the City Council Of Nairobi, Kenya Police, Ministry of Nairobi Metropolitan Development. The Nairobi Central Business District Association, Business owners, Financial institutions that have invested in the project, private firms, the Government, members of the public (pedestrians), Environmental management bodies and Non Governmental associations.
The roles of these committees will include phasing of the projects, resource utilization, assessment of environmental and social impacts of the project as well as assessment of the quality of work done by the contracted contractors of the project. Members of the public will give their overview of the impacts the project is inflicting on them so as to determine the outcomes of the project in relation to the set objectives.

55
5.3 Guidelines for the implementation The success of the implementation process will be guaranteed by a set of guidelines that will
provide a road map for the full implementation of projects. The projects will be carried out in
phases as outlined in the implementation schedule. The setting up of guidelines should be done
in a consultative manner and should involve all stakeholders in the project. Regular meetings
should be carried out and clear decisions pertaining to the project agreed upon. Such decisions
include:
§ Implementation process of the plan must be geared towards the attainment of the stated
objectives of the development project.
§ All legal requirements pertaining to any works whatsoever will be strictly adhered to
during implementation of this project. This includes all laws and City Council of Nairobi
by Laws. All relevant legal, implementing and management and institutions directly or
indirectly will be involved through numerous consultations.
§ The entire project work will guarantee environmental sustainability and protection.
preparation of an Environmental Management Plan as well as periodic Environmental
Impact Assessments must be done to ensure conformity to environmental laws and
reduction of negative impacts arising thereof.
§ The projects will predominantly use the Participatory Approach to planning, monitoring
and evaluation of the project where all involved stakeholders will give their opinions and
views so as to guarantee acceptability, ownership and sustainability of the project.
§ Treat any objection(s) and complaint(s) raised by any stakeholder with utmost urgency so
as to guarantee smooth running of the project without delays.
5.4 Environmental Management Plan
The outcome of this project must ensure environmental sustainability of the project area. Therefore it is important to prepare an environmental site management plan for the project area aimed at highlighted the expected negative environmental impacts and the proposed mitigation measures/actions.

56
Table 7: Environmental Management Plan
Expected Impacts Mitigation Measures Actors
Noise and air pollution from construction machines on site.
Limit working hours night time and weekends.
Use of construction equipment with low smoke emission levels
Contractors
CCN
Potential leakage of sewerage and drainage blockings
Engineers from The Nairobi Water and Sewerage Company as well as City Council Be on site to respond quickly.
Contractors
CCN
Nairobi Water and Sewerage Company
Inconveniences in pedestrian and motor traffic caused by full or partial closure of street.
Provide alternative route besides the onsite route.
Coordinate with traffic police to help in traffic direction.
CCN
Traffic Police
Contractors
Public
Potential injury to pedestrians during construction
Install warning signs on the site.
Seal off any open dug spaces
Contractors
Pedestrians(public)
Poor litter disposal, untrimmed greenery.
Placing of trash receptacles at strategic location
Emptying of trash bins
Maintenance of the greenery though trimming
Public sensitization.
CCN
Public
NGOs
NCBDA

57
Figure 4: Street design
Source: author
58
5.5 Conclusion This development plan provides a spatial framework that can be used to counter crime and also
prevent it by re-designing Tom Mboya Street. Crime affects our day to day lives and needs to be
checked. Reducing and preventing crime will improve the security and safety of pedestrians that
use Tom Mboya Street thus improve their lives.
In implementing this plan, decongestion of human traffic will also be achieved. Pedestrians will
be able to reach their destinations faster. The aesthetic value of the street will also be improved.
This plan is being carried out in line with the Governments’ and City Council of Nairobi’s plan
to decongest the city totally so as to realize smooth flow of traffic around and within the city.
It is therefore important to involve all stakeholders to support and even finance this development
project whose value might not be quantified in monetary terms or its significance be felt in the
short-run but rather in terms of increased socio-economic welfare to be derived from the same,
by both the Government and the people.
59
BIBLIOGRAPHY 1. Bob Cepeda, 2004. Crime Prevention Through Environmental Design Assessment, 2. Charlotte City Council (2009), Urban Street Design Guidelines
3. Crowe, T.D. (1991). Crime prevention through environmental design: applications of architectural design and space management concepts, Butterworth-Heinemann, Boston, Mass.
4. Crowe, T.D. (2000) Crime Prevention Through Environmental Design. Butterworth-Heinemann, Stoneham, Massachusetts
5. Department of Urban Affairs and Planning (2001), Crime Prevention and the Assessment of Development Applications, Australia
6. Kenya Republic of (1961), Police Act Cap 84. Nairobi. Government printer.
7. Kenya Republic of (1993), Traffic Act, Cap 403. Nairobi. Government Printer
8. Kenya, Republic of (1996), Physical Planning Act, Nairobi: Government Printer.
9. Kenya Republic of (1998), Physical Planning Handbook. Nairobi. Government Printer.
10. Kenya Republic of (1999), Environmental Management and Coordination Act (EMCA).
Nairobi. Government Printer.
11. Manukau City Council (2003), Crime Prevention Action Plan
12. O. Newman (1972), Defensible Space: Crime Prevention Through Environmental Design, New York, Macmillan

60