rd Quarter Greenwich Market Report - hlagents.com€¦ · This summer had us doing a lot of number...
22
�rd Quarter ���� Greenwich Market Report
Transcript of rd Quarter Greenwich Market Report - hlagents.com€¦ · This summer had us doing a lot of number...

�rd Quarter ���� Greenwich Market Report

Presented By
JARED G. RANDALLReal Estate Salesperson
Greenwich BrokerageMobile: 203.273.1034
Office: 203.869.0700 Ext. 40250 | Fax:Email: [email protected]
HOULIHANLAWRENCE.COM

OUR COMMUNITY PARTNERSHIPSOur overriding philosophy is that our company's success is intertwined with the greater health ofthe communities we call home. Houlihan Lawrence is committed to supporting local organizationsthat help improve the quality of life for our neighbors who live in New York City's northern suburbs.Our principals and agents serve on multiple non-profit boards, and our agent community ralliesaround fundraisers and volunteer opportunities.
SUPPORT CONNECTIONSupport-a-Walk Breast and Ovarian Cancer
supportconnection.orgFDR State Park, Yorktown Heights, NY
October 4, 2015
AMERICAN CANCER SOCIETYMaking Strides Against Breast Cancer
makingstrideswalk.orgManhattanville College, Purchase, NY
October 18, 2015
MILES OF HOPE Breast Cancer Foundation Walk
milesofhope.orgJames Baird State Park, Pleasant Valley, NY
October 4, 2015
LIGHT THE NIGHT Leukemia & Lymphoma Society
lightthenight.orgVassar College, Ballantine Field, Poughkeepsie, NY
October 17, 2015Playland Amusement Park, Rye, NY
November 7, 2015
JOIN US BY SPONSORING A PARTICIPATING AGENT OR WALK WITH US IN ONE OF THIS YEAR’S FUND-RAISING EVENTS

This summer had us doing a lot of number crunching here in Greenwich. The local market varies dramatically depending on the neighborhood. While Greenwich itself remains a highly desirable area, buyers are willing to wait on the sidelines for the right property. Our team has become experts on the complicated and changing variables driving the current market, and what makes a property sell.
Wall Street’s volatility is increasingly evident in the real estate market. The summer was a roller coaster for investors, who remain on edge. Those jitters have naturally spread to the housing market and have made buyers wary of making the wrong move. They demand value to get off the sidelines. Recent evidence of some economic weakness has many believing rates will stay low for longer than expected, giving buyers even less reason to compromise, or buy into a property that isn’t turnkey.
Here are some trends we see as the rest of 2015 plays out:
Get ready to play “Deal or No Deal”. If your property is well renovated, in move-in condition, and priced right, you will be able to make a deal. Bonus points if you are near transportation, restaurants, shopping and schools that buyers want. But be warned. Miss on any of those and buyers may bypass your offering, and you will be scrambling to re-group. Buyers don’t want to play games. They don’t want to lowball. They want value and quality.
Fishing is not the sport of choice this season. Sellers must be realistic when setting a price. Many properties are sitting on the market for longer than we would like. The key to cutting down Days On Market is setting the right price from the start. Let’s take some advice from Marie Kondo, author of “The Life-Changing Magic of Tidying Up: The Japanese Art of Decluttering and Organising”. That means staging, painting and perhaps most importantly, de-cluttering. Sellers must take steps to limit the creativity a buyer needs to imagine what their life would be like in the house.
Some regional statistics we’d like to share:
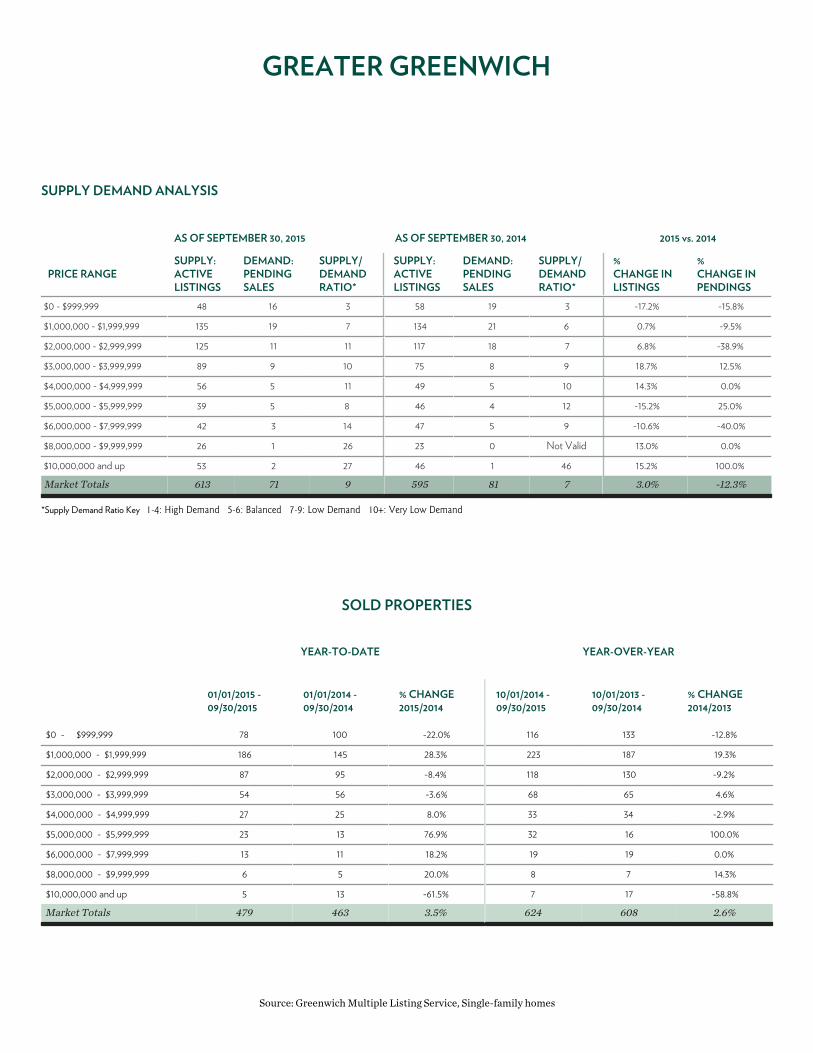
Buyers with the biggest budgets can take their pick in Greater Greenwich. There is a lot to choose from in the $10m plus category with 53 homes to choose from. That said, the hottest price range in the area is the $5-6m, where sales are up 77 percent year-to-date. Overall though, the number of sales is down in the area, and they are taking longer to sell, but prices are higher. Buyers will pay a premium for new or renovated properties.
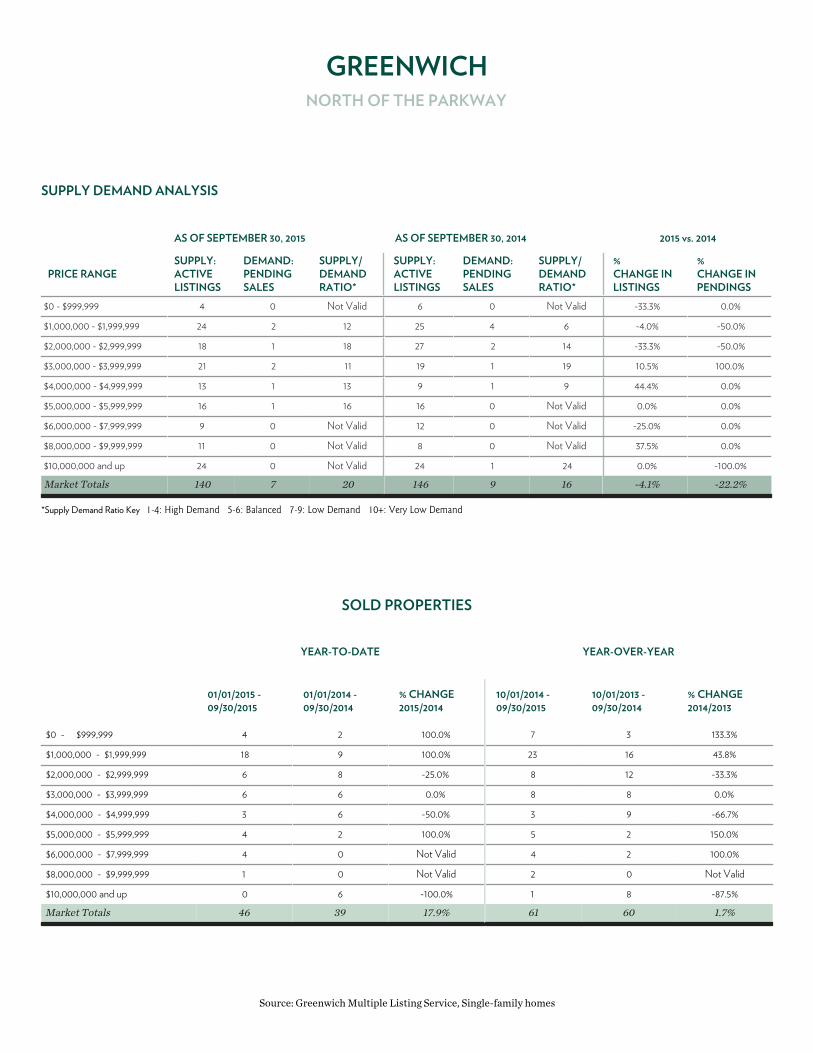
Patience is a virtue North of the Parkway: Homes sat on the market the longest in the area, an average of 276 days. It’s no surprise that prices fell. But in the end that value pricing resonated with buyers, and units sold rose 66 percent.
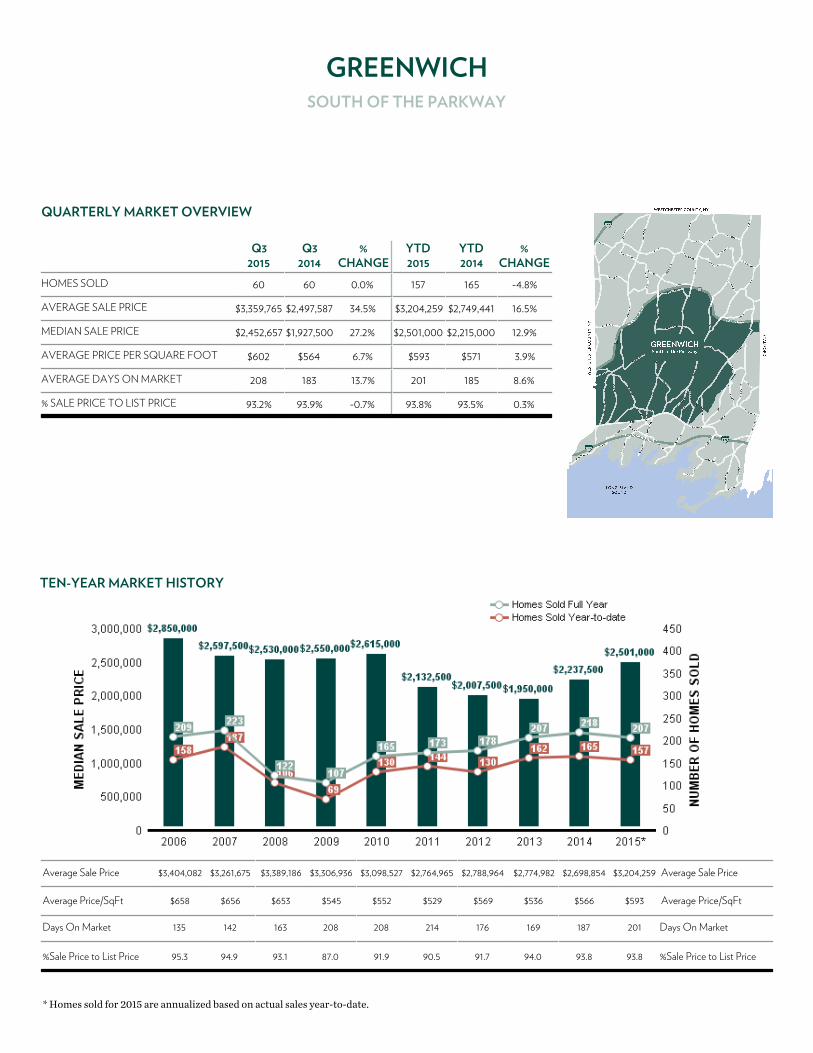
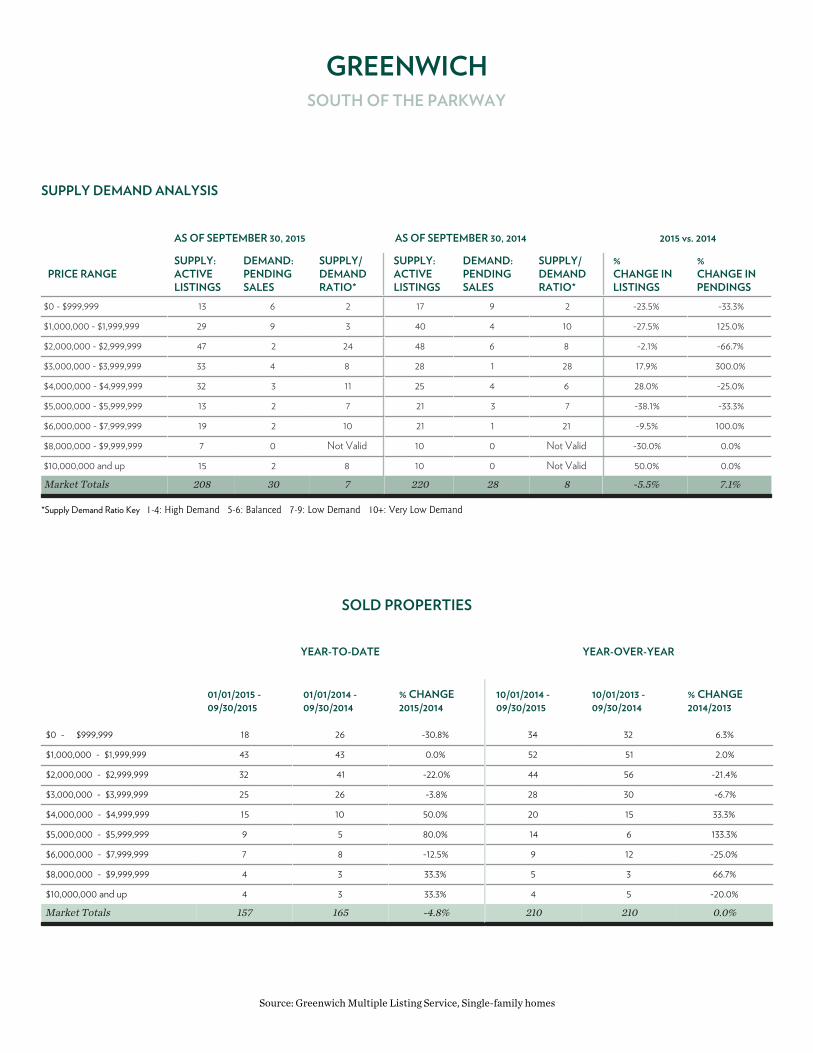
Location paid off South of the Parkway: Buyers were willing to pay more to be close to town. The median price of a home went up 27 percent in the third quarter. It still took a long time to make those sales, and the number of homes sold held steady, but more expensive homes did show gains.
The laws of supply and demand worked in sellers favor South of Post Road. Homes got 97 percent of their last list price, and median prices were up 11 percent in the third quarter. There were fewer homes to choose from. That meant fewer days on the market, and a faster moving market working in favor of smart sellers.
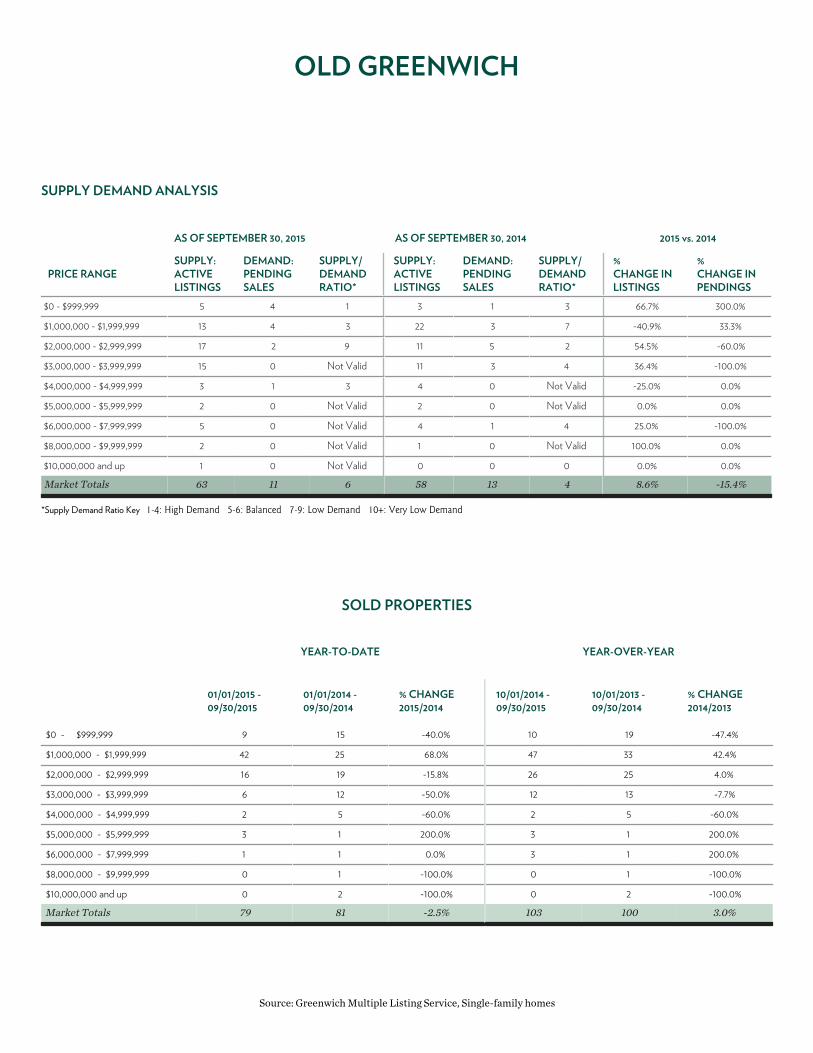
Cos Cob took a break after a strong first half of the year. Inventory grew, and sat on the market longer. Prices fell, as did sales. Old Greenwich also slowed down, moderating after a strong 18 months. Both prices and sales were lower, though there was some improvement in the amount of time it took to sell a home.
Riverside was a mixed bag. More homes sold, but prices were down. Homes that sold were on the market a relatively short amount of time, at an average of 89 days. The hottest category here was the $4m to $5m range. That is typically a new home or a fully renovated home.
Condo sales remain solid, but value remains a high priority for buyers. Prices are down, as is inventory. Buyers are holding out for renovated opportunities, but only at the right price.
Outlook for the rest of 2015: We are energized and excited about the continued appeal of the Greenwich area. We are thrilled to report that Houlihan Lawrence was the sole brokerage behind the largest transaction of the third quarter. We have the data and expertise to get the best results for our clients, and look forward to sharing more good news with you, as we get ready for 2016.
THIRD QUARTER 2015
EXECUTIVE SUMMARY
Stephen MeyersPresident and CEO
Chris MeyersManaging Principal
TABLE OF CONTENTSTHIRD QUARTER 2015
GREATER GREENWICHSingle Family Home Overview
GREENWICHNorth of the Parkway
GREENWICHSouth of the Parkway
GREENWICHSouth of the Post Road
COS COB
RIVERSIDE
OLD GREENWICH
GREATER GREENWICHCondominium Overview
HOULIHANLAWRENCE.COM

GREATER GREENWICH
QUARTERLY MARKET OVERVIEW
Q32015
Q32014
%CHANGE
YTD2015
YTD2014
%CHANGE
HOMES SOLD 182 186 -2.2% 479 463 3.5%
AVERAGE SALE PRICE $2,519,439 $2,398,150 5.1% $2,500,175 $2,758,876 -9.4%
MEDIAN SALE PRICE $1,860,500 $1,722,500 8.0% $1,871,000 $1,881,500 -0.6%
AVERAGE PRICE PER SQUARE FOOT $600 $597 0.5% $596 $612 -2.6%
AVERAGE DAYS ON MARKET 165 145 13.8% 175 160 9.4%
% SALE PRICE TO LIST PRICE 94.8% 94.5% 0.3% 94.5% 93.8% 0.7%
TEN-YEAR MARKET HISTORY
Average Sale Price $2,687,400 $3,009,807 $2,818,933 $2,664,991 $2,518,862 $2,429,922 $2,381,680 $2,245,168 $2,688,907 $2,500,175 Average Sale Price
Average Price/SqFt $638 $665 $627 $545 $544 $539 $555 $555 $610 $596 Average Price/SqFt
Days On Market 114 135 144 187 184 180 173 156 166 175 Days On Market
%Sale Price to List Price 95.5 94.3 92.1 87.5 90.2 91.8 91.9 94.1 93.7 94.5 %Sale Price to List Price
* Homes sold for 2015 are annualized based on actual sales year-to-date.
GREATER GREENWICH
SUPPLY DEMAND ANALYSIS
AS OF SEPTEMBER 30, 2015 AS OF SEPTEMBER 30, 2014 2015 vs. 2014
PRICE RANGESUPPLY:ACTIVELISTINGS
DEMAND:PENDINGSALES
SUPPLY/DEMANDRATIO*
SUPPLY:ACTIVELISTINGS
DEMAND:PENDINGSALES
SUPPLY/DEMANDRATIO*
%CHANGE INLISTINGS
%CHANGE INPENDINGS
$0 - $999,999 48 16 3 58 19 3 -17.2% -15.8%
$1,000,000 - $1,999,999 135 19 7 134 21 6 0.7% -9.5%
$2,000,000 - $2,999,999 125 11 11 117 18 7 6.8% -38.9%
$3,000,000 - $3,999,999 89 9 10 75 8 9 18.7% 12.5%
$4,000,000 - $4,999,999 56 5 11 49 5 10 14.3% 0.0%
$5,000,000 - $5,999,999 39 5 8 46 4 12 -15.2% 25.0%
$6,000,000 - $7,999,999 42 3 14 47 5 9 -10.6% -40.0%
$8,000,000 - $9,999,999 26 1 26 23 0 Not Valid 13.0% 0.0%
$10,000,000 and up 53 2 27 46 1 46 15.2% 100.0%
Market Totals 613 71 9 595 81 7 3.0% -12.3%
*Supply Demand Ratio Key 1-4: High Demand 5-6: Balanced 7-9: Low Demand 10+: Very Low Demand
SOLD PROPERTIES
YEAR-TO-DATE YEAR-OVER-YEAR
01/01/2015 -09/30/2015
01/01/2014 -09/30/2014
% CHANGE2015/2014
10/01/2014 -09/30/2015
10/01/2013 -09/30/2014
% CHANGE2014/2013
$0 - $999,999 78 100 -22.0% 116 133 -12.8%
$1,000,000 - $1,999,999 186 145 28.3% 223 187 19.3%
$2,000,000 - $2,999,999 87 95 -8.4% 118 130 -9.2%
$3,000,000 - $3,999,999 54 56 -3.6% 68 65 4.6%
$4,000,000 - $4,999,999 27 25 8.0% 33 34 -2.9%
$5,000,000 - $5,999,999 23 13 76.9% 32 16 100.0%
$6,000,000 - $7,999,999 13 11 18.2% 19 19 0.0%
$8,000,000 - $9,999,999 6 5 20.0% 8 7 14.3%
$10,000,000 and up 5 13 -61.5% 7 17 -58.8%
Market Totals 479 463 3.5% 624 608 2.6%
Source: Greenwich Multiple Listing Service, Single-family homes

GREENWICHNORTH OF THE PARKWAY
QUARTERLY MARKET OVERVIEW
Q32015
Q32014
%CHANGE
YTD2015
YTD2014
%CHANGE
HOMES SOLD 20 12 66.7% 46 39 17.9%
AVERAGE SALE PRICE $3,180,562 $3,834,290 -17.0% $2,974,472 $4,464,102 -33.4%
MEDIAN SALE PRICE $2,225,000 $3,117,500 -28.6% $2,050,000 $3,150,000 -34.9%
AVERAGE PRICE PER SQUARE FOOT $562 $554 1.4% $552 $584 -5.5%
AVERAGE DAYS ON MARKET 276 295 -6.4% 266 346 -23.1%
% SALE PRICE TO LIST PRICE 95.3% 91.3% 4.4% 92.8% 90.6% 2.4%
TEN-YEAR MARKET HISTORY
Average Sale Price $4,349,585 $4,703,453 $5,046,500 $5,855,000 $4,552,510 $3,887,759 $3,548,310 $3,106,132 $4,136,921 $2,974,472 Average Sale Price
Average Price/SqFt $644 $656 $578 $682 $609 $557 $504 $524 $558 $552 Average Price/SqFt
Days On Market 145 208 223 268 333 251 286 286 349 266 Days On Market
%Sale Price to List Price 94.4 93.0 84.0 86.3 82.9 91.0 89.3 91.5 90.5 92.8 %Sale Price to List Price
* Homes sold for 2015 are annualized based on actual sales year-to-date.
GREENWICHNORTH OF THE PARKWAY
SUPPLY DEMAND ANALYSIS
AS OF SEPTEMBER 30, 2015 AS OF SEPTEMBER 30, 2014 2015 vs. 2014
PRICE RANGESUPPLY:ACTIVELISTINGS
DEMAND:PENDINGSALES
SUPPLY/DEMANDRATIO*
SUPPLY:ACTIVELISTINGS
DEMAND:PENDINGSALES
SUPPLY/DEMANDRATIO*
%CHANGE INLISTINGS
%CHANGE INPENDINGS
$0 - $999,999 4 0 Not Valid 6 0 Not Valid -33.3% 0.0%
$1,000,000 - $1,999,999 24 2 12 25 4 6 -4.0% -50.0%
$2,000,000 - $2,999,999 18 1 18 27 2 14 -33.3% -50.0%
$3,000,000 - $3,999,999 21 2 11 19 1 19 10.5% 100.0%
$4,000,000 - $4,999,999 13 1 13 9 1 9 44.4% 0.0%
$5,000,000 - $5,999,999 16 1 16 16 0 Not Valid 0.0% 0.0%
$6,000,000 - $7,999,999 9 0 Not Valid 12 0 Not Valid -25.0% 0.0%
$8,000,000 - $9,999,999 11 0 Not Valid 8 0 Not Valid 37.5% 0.0%
$10,000,000 and up 24 0 Not Valid 24 1 24 0.0% -100.0%
Market Totals 140 7 20 146 9 16 -4.1% -22.2%
*Supply Demand Ratio Key 1-4: High Demand 5-6: Balanced 7-9: Low Demand 10+: Very Low Demand
SOLD PROPERTIES
YEAR-TO-DATE YEAR-OVER-YEAR
01/01/2015 -09/30/2015
01/01/2014 -09/30/2014
% CHANGE2015/2014
10/01/2014 -09/30/2015
10/01/2013 -09/30/2014
% CHANGE2014/2013
$0 - $999,999 4 2 100.0% 7 3 133.3%
$1,000,000 - $1,999,999 18 9 100.0% 23 16 43.8%
$2,000,000 - $2,999,999 6 8 -25.0% 8 12 -33.3%
$3,000,000 - $3,999,999 6 6 0.0% 8 8 0.0%
$4,000,000 - $4,999,999 3 6 -50.0% 3 9 -66.7%
$5,000,000 - $5,999,999 4 2 100.0% 5 2 150.0%
$6,000,000 - $7,999,999 4 0 Not Valid 4 2 100.0%
$8,000,000 - $9,999,999 1 0 Not Valid 2 0 Not Valid
$10,000,000 and up 0 6 -100.0% 1 8 -87.5%
Market Totals 46 39 17.9% 61 60 1.7%
Source: Greenwich Multiple Listing Service, Single-family homes
GREENWICHSOUTH OF THE PARKWAY
QUARTERLY MARKET OVERVIEW
Q32015
Q32014
%CHANGE
YTD2015
YTD2014
%CHANGE
HOMES SOLD 60 60 0.0% 157 165 -4.8%
AVERAGE SALE PRICE $3,359,765 $2,497,587 34.5% $3,204,259 $2,749,441 16.5%
MEDIAN SALE PRICE $2,452,657 $1,927,500 27.2% $2,501,000 $2,215,000 12.9%
AVERAGE PRICE PER SQUARE FOOT $602 $564 6.7% $593 $571 3.9%
AVERAGE DAYS ON MARKET 208 183 13.7% 201 185 8.6%
% SALE PRICE TO LIST PRICE 93.2% 93.9% -0.7% 93.8% 93.5% 0.3%
TEN-YEAR MARKET HISTORY
Average Sale Price $3,404,082 $3,261,675 $3,389,186 $3,306,936 $3,098,527 $2,764,965 $2,788,964 $2,774,982 $2,698,854 $3,204,259 Average Sale Price
Average Price/SqFt $658 $656 $653 $545 $552 $529 $569 $536 $566 $593 Average Price/SqFt
Days On Market 135 142 163 208 208 214 176 169 187 201 Days On Market
%Sale Price to List Price 95.3 94.9 93.1 87.0 91.9 90.5 91.7 94.0 93.8 93.8 %Sale Price to List Price
* Homes sold for 2015 are annualized based on actual sales year-to-date.
GREENWICHSOUTH OF THE PARKWAY
SUPPLY DEMAND ANALYSIS
AS OF SEPTEMBER 30, 2015 AS OF SEPTEMBER 30, 2014 2015 vs. 2014
PRICE RANGESUPPLY:ACTIVELISTINGS
DEMAND:PENDINGSALES
SUPPLY/DEMANDRATIO*
SUPPLY:ACTIVELISTINGS
DEMAND:PENDINGSALES
SUPPLY/DEMANDRATIO*
%CHANGE INLISTINGS
%CHANGE INPENDINGS
$0 - $999,999 13 6 2 17 9 2 -23.5% -33.3%
$1,000,000 - $1,999,999 29 9 3 40 4 10 -27.5% 125.0%
$2,000,000 - $2,999,999 47 2 24 48 6 8 -2.1% -66.7%
$3,000,000 - $3,999,999 33 4 8 28 1 28 17.9% 300.0%
$4,000,000 - $4,999,999 32 3 11 25 4 6 28.0% -25.0%
$5,000,000 - $5,999,999 13 2 7 21 3 7 -38.1% -33.3%
$6,000,000 - $7,999,999 19 2 10 21 1 21 -9.5% 100.0%
$8,000,000 - $9,999,999 7 0 Not Valid 10 0 Not Valid -30.0% 0.0%
$10,000,000 and up 15 2 8 10 0 Not Valid 50.0% 0.0%
Market Totals 208 30 7 220 28 8 -5.5% 7.1%
*Supply Demand Ratio Key 1-4: High Demand 5-6: Balanced 7-9: Low Demand 10+: Very Low Demand
SOLD PROPERTIES
YEAR-TO-DATE YEAR-OVER-YEAR
01/01/2015 -09/30/2015
01/01/2014 -09/30/2014
% CHANGE2015/2014
10/01/2014 -09/30/2015
10/01/2013 -09/30/2014
% CHANGE2014/2013
$0 - $999,999 18 26 -30.8% 34 32 6.3%
$1,000,000 - $1,999,999 43 43 0.0% 52 51 2.0%
$2,000,000 - $2,999,999 32 41 -22.0% 44 56 -21.4%
$3,000,000 - $3,999,999 25 26 -3.8% 28 30 -6.7%
$4,000,000 - $4,999,999 15 10 50.0% 20 15 33.3%
$5,000,000 - $5,999,999 9 5 80.0% 14 6 133.3%
$6,000,000 - $7,999,999 7 8 -12.5% 9 12 -25.0%
$8,000,000 - $9,999,999 4 3 33.3% 5 3 66.7%
$10,000,000 and up 4 3 33.3% 4 5 -20.0%
Market Totals 157 165 -4.8% 210 210 0.0%
Source: Greenwich Multiple Listing Service, Single-family homes

GREENWICHSOUTH OF THE POST ROAD
QUARTERLY MARKET OVERVIEW
Q32015
Q32014
%CHANGE
YTD2015
YTD2014
%CHANGE
HOMES SOLD 18 20 -10.0% 46 49 -6.1%
AVERAGE SALE PRICE $2,219,250 $2,493,025 -11.0% $2,140,094 $4,548,839 -53.0%
MEDIAN SALE PRICE $1,620,000 $1,453,000 11.5% $1,442,500 $1,465,000 -1.5%
AVERAGE PRICE PER SQUARE FOOT $599 $607 -1.3% $588 $756 -22.2%
AVERAGE DAYS ON MARKET 164 194 -15.5% 221 149 48.3%
% SALE PRICE TO LIST PRICE 97.2% 94.0% 3.4% 96.4% 93.4% 3.2%
TEN-YEAR MARKET HISTORY
Average Sale Price $2,366,656 $3,957,126 $2,291,158 $2,658,088 $3,031,344 $3,239,191 $2,486,569 $2,219,081 $4,083,817 $2,140,094 Average Sale Price
Average Price/SqFt $659 $856 $617 $558 $573 $570 $574 $577 $726 $588 Average Price/SqFt
Days On Market 113 132 146 213 215 212 215 160 172 221 Days On Market
%Sale Price to List Price 93.3 89.8 95.5 83.9 87.7 91.5 89.0 92.6 93.4 96.4 %Sale Price to List Price
* Homes sold for 2015 are annualized based on actual sales year-to-date.

GREENWICHSOUTH OF THE POST ROAD
SUPPLY DEMAND ANALYSIS
AS OF SEPTEMBER 30, 2015 AS OF SEPTEMBER 30, 2014 2015 vs. 2014
PRICE RANGESUPPLY:ACTIVELISTINGS
DEMAND:PENDINGSALES
SUPPLY/DEMANDRATIO*
SUPPLY:ACTIVELISTINGS
DEMAND:PENDINGSALES
SUPPLY/DEMANDRATIO*
%CHANGE INLISTINGS
%CHANGE INPENDINGS
$0 - $999,999 8 1 8 15 4 4 -46.7% -75.0%
$1,000,000 - $1,999,999 14 0 Not Valid 13 2 7 7.7% -100.0%
$2,000,000 - $2,999,999 16 1 16 8 0 Not Valid 100.0% 0.0%
$3,000,000 - $3,999,999 5 1 5 7 0 Not Valid -28.6% 0.0%
$4,000,000 - $4,999,999 5 0 Not Valid 5 0 Not Valid 0.0% 0.0%
$5,000,000 - $5,999,999 4 2 2 5 1 5 -20.0% 100.0%
$6,000,000 - $7,999,999 3 1 3 7 3 2 -57.1% -66.7%
$8,000,000 - $9,999,999 4 1 4 3 0 Not Valid 33.3% 0.0%
$10,000,000 and up 6 0 Not Valid 9 0 Not Valid -33.3% 0.0%
Market Totals 65 7 9 72 10 7 -9.7% -30.0%
*Supply Demand Ratio Key 1-4: High Demand 5-6: Balanced 7-9: Low Demand 10+: Very Low Demand
SOLD PROPERTIES
YEAR-TO-DATE YEAR-OVER-YEAR
01/01/2015 -09/30/2015
01/01/2014 -09/30/2014
% CHANGE2015/2014
10/01/2014 -09/30/2015
10/01/2013 -09/30/2014
% CHANGE2014/2013
$0 - $999,999 18 20 -10.0% 24 26 -7.7%
$1,000,000 - $1,999,999 12 16 -25.0% 17 20 -15.0%
$2,000,000 - $2,999,999 5 2 150.0% 7 6 16.7%
$3,000,000 - $3,999,999 3 2 50.0% 3 2 50.0%
$4,000,000 - $4,999,999 1 1 0.0% 1 2 -50.0%
$5,000,000 - $5,999,999 6 3 100.0% 9 5 80.0%
$6,000,000 - $7,999,999 0 2 -100.0% 2 4 -50.0%
$8,000,000 - $9,999,999 1 1 0.0% 1 2 -50.0%
$10,000,000 and up 0 2 -100.0% 1 2 -50.0%
Market Totals 46 49 -6.1% 65 69 -5.8%
Source: Greenwich Multiple Listing Service, Single-family homes

COS COB
QUARTERLY MARKET OVERVIEW
Q32015
Q32014
%CHANGE
YTD2015
YTD2014
%CHANGE
HOMES SOLD 17 29 -41.4% 57 51 11.8%
AVERAGE SALE PRICE $1,434,583 $1,313,840 9.2% $1,362,007 $1,281,125 6.3%
MEDIAN SALE PRICE $1,150,000 $1,178,000 -2.4% $1,250,000 $1,178,000 6.1%
AVERAGE PRICE PER SQUARE FOOT $503 $430 17.0% $509 $447 13.9%
AVERAGE DAYS ON MARKET 141 96 46.9% 127 106 19.8%
% SALE PRICE TO LIST PRICE 96.1% 96.2% -0.1% 96.4% 96.4% 0.0%
TEN-YEAR MARKET HISTORY
Average Sale Price $1,513,291 $1,573,462 $1,429,370 $1,254,122 $1,141,637 $1,116,709 $1,224,821 $1,241,224 $1,254,598 $1,362,007 Average Sale Price
Average Price/SqFt $532 $520 $468 $418 $403 $431 $414 $471 $465 $509 Average Price/SqFt
Days On Market 102 115 106 165 149 141 153 131 103 127 Days On Market
%Sale Price to List Price 95.6 96.7 94.3 90.7 93.1 92.7 94.0 95.0 96.1 96.4 %Sale Price to List Price
* Homes sold for 2015 are annualized based on actual sales year-to-date.

COS COB
SUPPLY DEMAND ANALYSIS
AS OF SEPTEMBER 30, 2015 AS OF SEPTEMBER 30, 2014 2015 vs. 2014
PRICE RANGESUPPLY:ACTIVELISTINGS
DEMAND:PENDINGSALES
SUPPLY/DEMANDRATIO*
SUPPLY:ACTIVELISTINGS
DEMAND:PENDINGSALES
SUPPLY/DEMANDRATIO*
%CHANGE INLISTINGS
%CHANGE INPENDINGS
$0 - $999,999 11 2 6 10 3 3 10.0% -33.3%
$1,000,000 - $1,999,999 31 0 Not Valid 20 7 3 55.0% -100.0%
$2,000,000 - $2,999,999 11 1 11 7 2 4 57.1% -50.0%
$3,000,000 - $3,999,999 7 0 Not Valid 3 0 Not Valid 133.3% 0.0%
$4,000,000 - $4,999,999 0 0 0 0 0 0 0.0% 0.0%
$5,000,000 - $5,999,999 0 0 0 0 0 0 0.0% 0.0%
$6,000,000 - $7,999,999 0 0 0 0 0 0 0.0% 0.0%
$8,000,000 - $9,999,999 0 0 0 0 0 0 0.0% 0.0%
$10,000,000 and up 0 0 0 0 0 0 0.0% 0.0%
Market Totals 60 3 20 40 12 3 50.0% -75.0%
*Supply Demand Ratio Key 1-4: High Demand 5-6: Balanced 7-9: Low Demand 10+: Very Low Demand
SOLD PROPERTIES
YEAR-TO-DATE YEAR-OVER-YEAR
01/01/2015 -09/30/2015
01/01/2014 -09/30/2014
% CHANGE2015/2014
10/01/2014 -09/30/2015
10/01/2013 -09/30/2014
% CHANGE2014/2013
$0 - $999,999 14 20 -30.0% 21 26 -19.2%
$1,000,000 - $1,999,999 36 26 38.5% 43 34 26.5%
$2,000,000 - $2,999,999 5 5 0.0% 7 6 16.7%
$3,000,000 - $3,999,999 2 0 Not Valid 2 0 Not Valid
$4,000,000 - $4,999,999 0 0 Not Valid 0 0 Not Valid
$5,000,000 - $5,999,999 0 0 Not Valid 0 0 Not Valid
$6,000,000 - $7,999,999 0 0 Not Valid 0 0 Not Valid
$8,000,000 - $9,999,999 0 0 Not Valid 0 0 Not Valid
$10,000,000 and up 0 0 Not Valid 0 0 Not Valid
Market Totals 57 51 11.8% 73 66 10.6%
Source: Greenwich Multiple Listing Service, Single-family homes
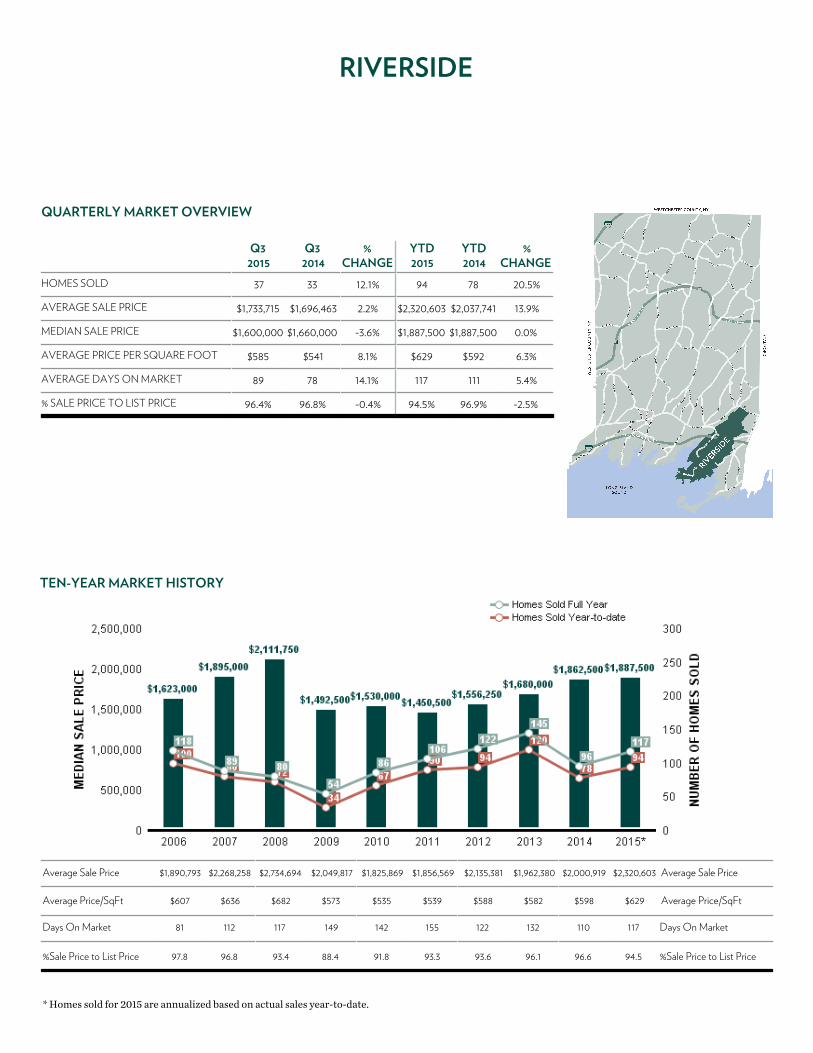
RIVERSIDE
QUARTERLY MARKET OVERVIEW
Q32015
Q32014
%CHANGE
YTD2015
YTD2014
%CHANGE
HOMES SOLD 37 33 12.1% 94 78 20.5%
AVERAGE SALE PRICE $1,733,715 $1,696,463 2.2% $2,320,603 $2,037,741 13.9%
MEDIAN SALE PRICE $1,600,000 $1,660,000 -3.6% $1,887,500 $1,887,500 0.0%
AVERAGE PRICE PER SQUARE FOOT $585 $541 8.1% $629 $592 6.3%
AVERAGE DAYS ON MARKET 89 78 14.1% 117 111 5.4%
% SALE PRICE TO LIST PRICE 96.4% 96.8% -0.4% 94.5% 96.9% -2.5%
TEN-YEAR MARKET HISTORY
Average Sale Price $1,890,793 $2,268,258 $2,734,694 $2,049,817 $1,825,869 $1,856,569 $2,135,381 $1,962,380 $2,000,919 $2,320,603 Average Sale Price
Average Price/SqFt $607 $636 $682 $573 $535 $539 $588 $582 $598 $629 Average Price/SqFt
Days On Market 81 112 117 149 142 155 122 132 110 117 Days On Market
%Sale Price to List Price 97.8 96.8 93.4 88.4 91.8 93.3 93.6 96.1 96.6 94.5 %Sale Price to List Price
* Homes sold for 2015 are annualized based on actual sales year-to-date.

RIVERSIDE
SUPPLY DEMAND ANALYSIS
AS OF SEPTEMBER 30, 2015 AS OF SEPTEMBER 30, 2014 2015 vs. 2014
PRICE RANGESUPPLY:ACTIVELISTINGS
DEMAND:PENDINGSALES
SUPPLY/DEMANDRATIO*
SUPPLY:ACTIVELISTINGS
DEMAND:PENDINGSALES
SUPPLY/DEMANDRATIO*
%CHANGE INLISTINGS
%CHANGE INPENDINGS
$0 - $999,999 7 3 2 7 2 4 0.0% 50.0%
$1,000,000 - $1,999,999 24 4 6 14 1 14 71.4% 300.0%
$2,000,000 - $2,999,999 16 4 4 16 3 5 0.0% 33.3%
$3,000,000 - $3,999,999 8 2 4 7 3 2 14.3% -33.3%
$4,000,000 - $4,999,999 3 0 Not Valid 6 0 Not Valid -50.0% 0.0%
$5,000,000 - $5,999,999 4 0 Not Valid 2 0 Not Valid 100.0% 0.0%
$6,000,000 - $7,999,999 6 0 Not Valid 3 0 Not Valid 100.0% 0.0%
$8,000,000 - $9,999,999 2 0 Not Valid 1 0 Not Valid 100.0% 0.0%
$10,000,000 and up 7 0 Not Valid 3 0 Not Valid 133.3% 0.0%
Market Totals 77 13 6 59 9 7 30.5% 44.4%
*Supply Demand Ratio Key 1-4: High Demand 5-6: Balanced 7-9: Low Demand 10+: Very Low Demand
SOLD PROPERTIES
YEAR-TO-DATE YEAR-OVER-YEAR
01/01/2015 -09/30/2015
01/01/2014 -09/30/2014
% CHANGE2015/2014
10/01/2014 -09/30/2015
10/01/2013 -09/30/2014
% CHANGE2014/2013
$0 - $999,999 15 17 -11.8% 20 27 -25.9%
$1,000,000 - $1,999,999 35 26 34.6% 41 33 24.2%
$2,000,000 - $2,999,999 23 20 15.0% 26 25 4.0%
$3,000,000 - $3,999,999 12 10 20.0% 15 12 25.0%
$4,000,000 - $4,999,999 6 3 100.0% 7 3 133.3%
$5,000,000 - $5,999,999 1 2 -50.0% 1 2 -50.0%
$6,000,000 - $7,999,999 1 0 Not Valid 1 0 Not Valid
$8,000,000 - $9,999,999 0 0 Not Valid 0 1 -100.0%
$10,000,000 and up 1 0 Not Valid 1 0 Not Valid
Market Totals 94 78 20.5% 112 103 8.7%
Source: Greenwich Multiple Listing Service, Single-family homes

OLD GREENWICH
QUARTERLY MARKET OVERVIEW
Q32015
Q32014
%CHANGE
YTD2015
YTD2014
%CHANGE
HOMES SOLD 30 32 -6.3% 79 81 -2.5%
AVERAGE SALE PRICE $2,161,966 $3,320,125 -34.9% $2,069,294 $2,499,106 -17.2%
MEDIAN SALE PRICE $1,785,000 $2,425,000 -26.4% $1,700,000 $2,000,000 -15.0%
AVERAGE PRICE PER SQUARE FOOT $695 $846 -17.8% $657 $734 -10.5%
AVERAGE DAYS ON MARKET 110 102 7.8% 147 108 36.1%
% SALE PRICE TO LIST PRICE 95.5% 95.4% 0.1% 96.4% 94.4% 2.1%
TEN-YEAR MARKET HISTORY
Average Sale Price $1,960,677 $2,466,218 $2,041,162 $1,785,979 $1,736,841 $1,905,612 $2,271,283 $1,753,566 $2,564,436 $2,069,294 Average Sale Price
Average Price/SqFt $679 $703 $664 $565 $575 $588 $617 $615 $749 $657 Average Price/SqFt
Days On Market 99 110 125 147 115 105 165 103 116 147 Days On Market
%Sale Price to List Price 96.5 96.0 95.5 91.4 94.4 94.8 93.8 95.0 94.1 96.4 %Sale Price to List Price
* Homes sold for 2015 are annualized based on actual sales year-to-date.
OLD GREENWICH
SUPPLY DEMAND ANALYSIS
AS OF SEPTEMBER 30, 2015 AS OF SEPTEMBER 30, 2014 2015 vs. 2014
PRICE RANGESUPPLY:ACTIVELISTINGS
DEMAND:PENDINGSALES
SUPPLY/DEMANDRATIO*
SUPPLY:ACTIVELISTINGS
DEMAND:PENDINGSALES
SUPPLY/DEMANDRATIO*
%CHANGE INLISTINGS
%CHANGE INPENDINGS
$0 - $999,999 5 4 1 3 1 3 66.7% 300.0%
$1,000,000 - $1,999,999 13 4 3 22 3 7 -40.9% 33.3%
$2,000,000 - $2,999,999 17 2 9 11 5 2 54.5% -60.0%
$3,000,000 - $3,999,999 15 0 Not Valid 11 3 4 36.4% -100.0%
$4,000,000 - $4,999,999 3 1 3 4 0 Not Valid -25.0% 0.0%
$5,000,000 - $5,999,999 2 0 Not Valid 2 0 Not Valid 0.0% 0.0%
$6,000,000 - $7,999,999 5 0 Not Valid 4 1 4 25.0% -100.0%
$8,000,000 - $9,999,999 2 0 Not Valid 1 0 Not Valid 100.0% 0.0%
$10,000,000 and up 1 0 Not Valid 0 0 0 0.0% 0.0%
Market Totals 63 11 6 58 13 4 8.6% -15.4%
*Supply Demand Ratio Key 1-4: High Demand 5-6: Balanced 7-9: Low Demand 10+: Very Low Demand
SOLD PROPERTIES
YEAR-TO-DATE YEAR-OVER-YEAR
01/01/2015 -09/30/2015
01/01/2014 -09/30/2014
% CHANGE2015/2014
10/01/2014 -09/30/2015
10/01/2013 -09/30/2014
% CHANGE2014/2013
$0 - $999,999 9 15 -40.0% 10 19 -47.4%
$1,000,000 - $1,999,999 42 25 68.0% 47 33 42.4%
$2,000,000 - $2,999,999 16 19 -15.8% 26 25 4.0%
$3,000,000 - $3,999,999 6 12 -50.0% 12 13 -7.7%
$4,000,000 - $4,999,999 2 5 -60.0% 2 5 -60.0%
$5,000,000 - $5,999,999 3 1 200.0% 3 1 200.0%
$6,000,000 - $7,999,999 1 1 0.0% 3 1 200.0%
$8,000,000 - $9,999,999 0 1 -100.0% 0 1 -100.0%
$10,000,000 and up 0 2 -100.0% 0 2 -100.0%
Market Totals 79 81 -2.5% 103 100 3.0%
Source: Greenwich Multiple Listing Service, Single-family homes

GREATER GREENWICHCONDOMINIUMS
QUARTERLY MARKET OVERVIEW
Q32015
Q32014
%CHANGE
YTD2015
YTD2014
%CHANGE
UNITS SOLD 55 44 25.0% 139 120 15.8%
AVERAGE SALE PRICE $927,654 $1,011,240 -8.3% $1,069,487 $909,674 17.6%
MEDIAN SALE PRICE $689,000 $780,895 -11.8% $816,500 $706,500 15.6%
AVERAGE PRICE PER SQUARE FOOT $477 $460 3.7% $498 $462 7.8%
AVERAGE DAYS ON MARKET 133 131 1.5% 147 152 -3.3%
% SALE PRICE TO LIST PRICE 95.8% 95.9% -0.1% 96.1% 95.9% 0.2%
TEN-YEAR MARKET HISTORY
Average Sale Price $967,194 $1,054,207 $950,219 $888,920 $814,418 $878,893 $852,428 $842,525 $901,903 $1,069,487 Average Sale Price
Average Price/SqFt $542 $530 $490 $440 $410 $436 $422 $436 $456 $498 Average Price/SqFt
Days On Market 119 135 161 241 210 204 227 186 154 147 Days On Market
%Sale Price to List Price 96.8 95.6 94.2 92.6 90.6 92.8 93.4 95.0 95.6 96.1 %Sale Price to List Price
* Homes sold for 2015 are annualized based on actual sales year-to-date.

GREATER GREENWICHCONDOMINIUMS
SUPPLY DEMAND ANALYSIS
AS OF SEPTEMBER 30, 2015 AS OF SEPTEMBER 30, 2014 2015 vs. 2014
PRICE RANGESUPPLY:ACTIVELISTINGS
DEMAND:PENDINGSALES
SUPPLY/DEMANDRATIO*
SUPPLY:ACTIVELISTINGS
DEMAND:PENDINGSALES
SUPPLY/DEMANDRATIO*
%CHANGE INLISTINGS
%CHANGE INPENDINGS
$0 - $999,999 56 17 3 66 16 4 -15.2% 6.3%
$1,000,000 - $1,999,999 14 6 2 26 5 5 -46.2% 20.0%
$2,000,000 - $2,999,999 11 2 6 9 1 9 22.2% 100.0%
$3,000,000 - $3,999,999 4 2 2 6 1 6 -33.3% 100.0%
$4,000,000 - $4,999,999 4 1 4 3 1 3 33.3% 0.0%
$5,000,000 - $5,999,999 1 0 Not Valid 0 0 0 0.0% 0.0%
$6,000,000 - $7,999,999 0 0 0 1 0 Not Valid -100.0% 0.0%
$8,000,000 - $9,999,999 0 0 0 0 0 0 0.0% 0.0%
$10,000,000 and up 0 0 0 0 0 0 0.0% 0.0%
Market Totals 90 28 3 111 24 5 -18.9% 16.7%
*Supply Demand Ratio Key 1-4: High Demand 5-6: Balanced 7-9: Low Demand 10+: Very Low Demand
SOLD PROPERTIES
YEAR-TO-DATE YEAR-OVER-YEAR
01/01/2015 -09/30/2015
01/01/2014 -09/30/2014
% CHANGE2015/2014
10/01/2014 -09/30/2015
10/01/2013 -09/30/2014
% CHANGE2014/2013
$0 - $999,999 89 86 3.5% 120 112 7.1%
$1,000,000 - $1,999,999 35 27 29.6% 47 35 34.3%
$2,000,000 - $2,999,999 11 3 266.7% 13 4 225.0%
$3,000,000 - $3,999,999 3 2 50.0% 3 3 0.0%
$4,000,000 - $4,999,999 1 1 0.0% 1 1 0.0%
$5,000,000 - $5,999,999 0 1 -100.0% 0 1 -100.0%
$6,000,000 - $7,999,999 0 0 Not Valid 0 0 Not Valid
$8,000,000 - $9,999,999 0 0 Not Valid 0 0 Not Valid
$10,000,000 and up 0 0 Not Valid 0 0 Not Valid
Market Totals 139 120 15.8% 184 156 17.9%
Source: Greenwich Multiple Listing Service, Condominium
5 GLOBAL NETWORKS – REACHING 56 COUNTRIES & 6 CONTINENTS
Leading Real Estate Companies of the World | Luxury Portfolio InternationalMayfair International Realty | Board of Regents Luxury Real Estate