R&D Outsourcing as a form of Business Transformation ... R&D Outsourcing as a form of Business...
36
1 1 1 R&D Outsourcing as a form of Business Transformation Partnership Sandeep Kishore Corporate Representative – HCL Japan Exec. Vice President and Global Head, Sales & Practice Engineering and R&D Services January 23 rd , 2012 Tokyo, Japan
Transcript of R&D Outsourcing as a form of Business Transformation ... R&D Outsourcing as a form of Business...

1 1 1
R&D Outsourcing as a form of Business Transformation
Partnership
Sandeep Kishore
Corporate Representative – HCL Japan
Exec. Vice President and Global Head, Sales & Practice
Engineering and R&D Services
January 23rd, 2012
Tokyo, Japan

2 2 2
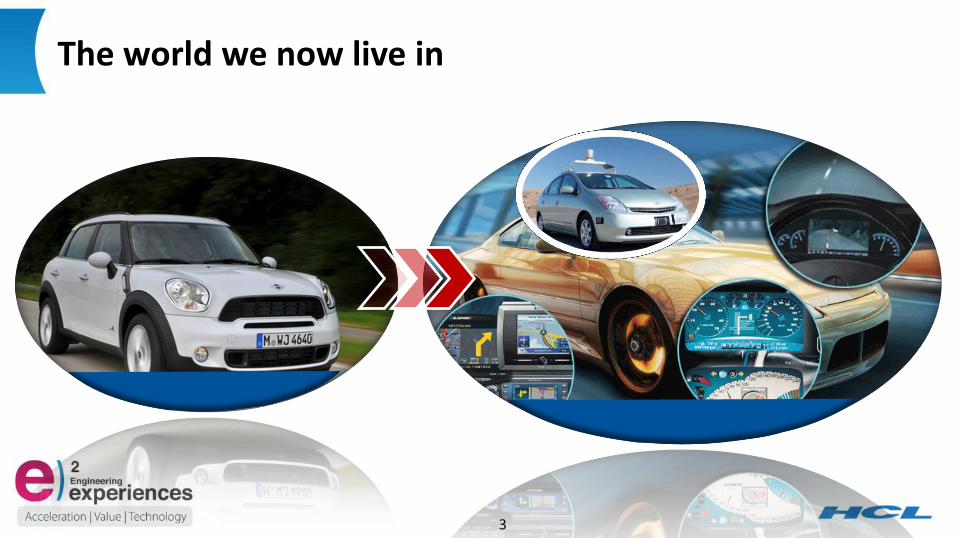
The world we now live in
3 3 3
The world we now live in

4 4 4
The world we now live in
5 5 5
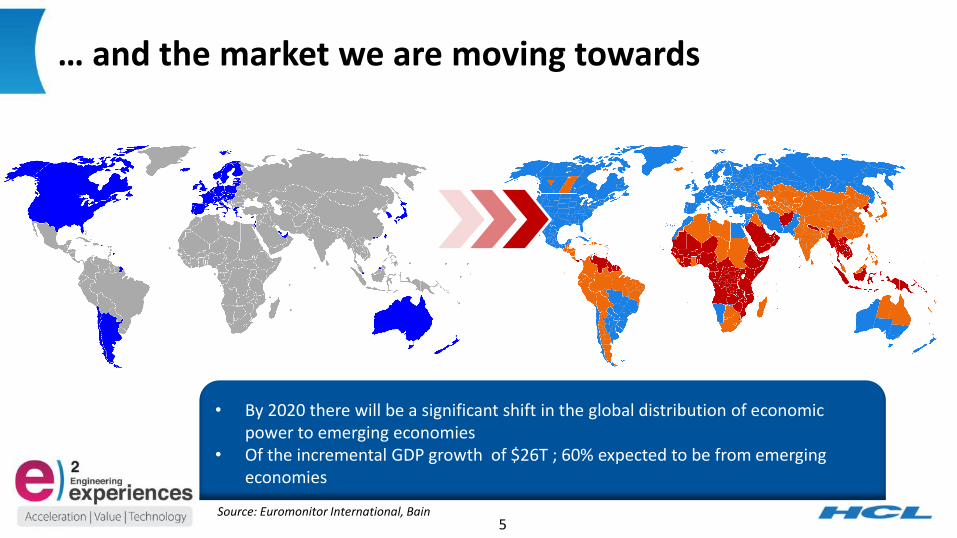
… and the market we are moving towards
• By 2020 there will be a significant shift in the global distribution of economic power to emerging economies
• Of the incremental GDP growth of $26T ; 60% expected to be from emerging economies
Source: Euromonitor International, Bain

6 6 6
… and the market we are moving towards
• Next Billion Consumers will drive $10 Trillion towards global GDP by 2020 • Additional 1.3 B people by 2020 as global middle class
7 7 7
Global R&D Industry Context
8 8 8
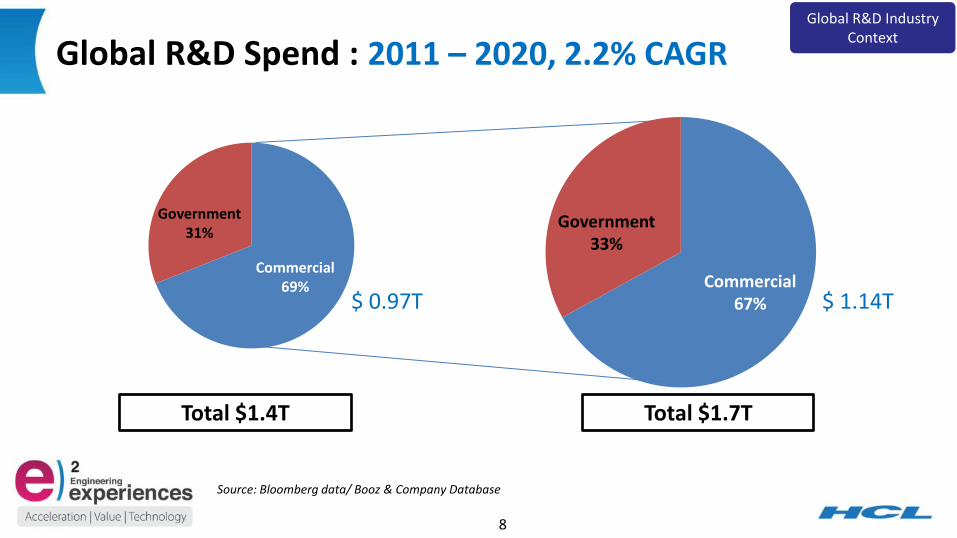
Global R&D Spend : 2011 – 2020, 2.2% CAGR
Government 31%
Commercial 69% Commercial
67%
Government 33%
Total $1.4T Total $1.7T
Global R&D Industry Context
$ 0.97T $ 1.14T
Source: Bloomberg data/ Booz & Company Database
9 9 9
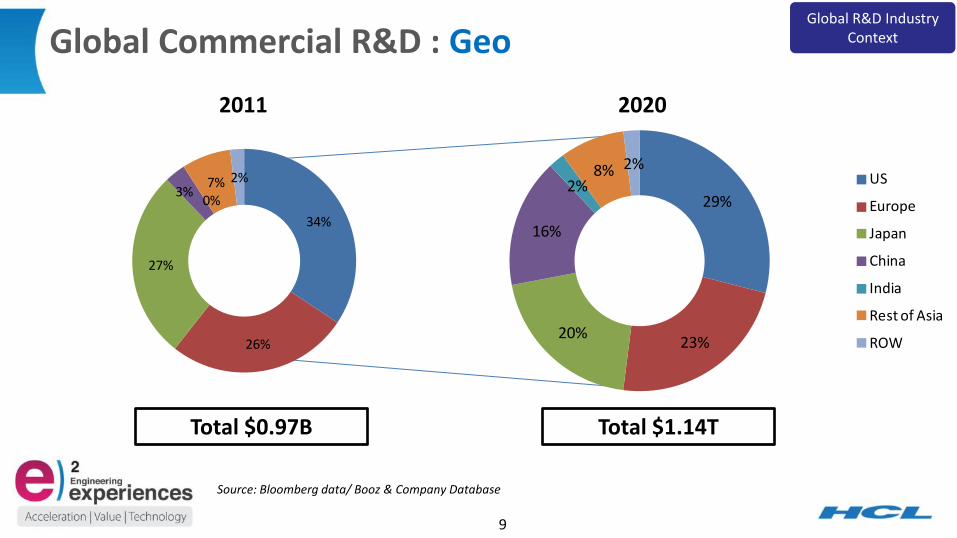
Global Commercial R&D : Geo
2020 2011
Total $0.97B Total $1.14T
Global R&D Industry Context
Source: Bloomberg data/ Booz & Company Database
29%
23%20%
16%
2%8% 2%
US
Europe
Japan
China
India
Rest of Asia
ROW
34%
26%
27%
3%0%7% 2%

10 10 10
Global Commercial R&D : Industry
2020 2011
Total $0.97B Total $1.14T
Global R&D Industry Context
26%
18%
10%10%
9%
8%
6%
6%5%2%
Automotive
Consumer Electronics
Telecom
Machinery
Semiconductor
Computing Systems
Aerospace
Energy
Medical Devices
Other
Source: Bloomberg data/ Booz & Company Database
26%
18%
11%10%
9%
8%
5%
6%5%2%
11 11 11
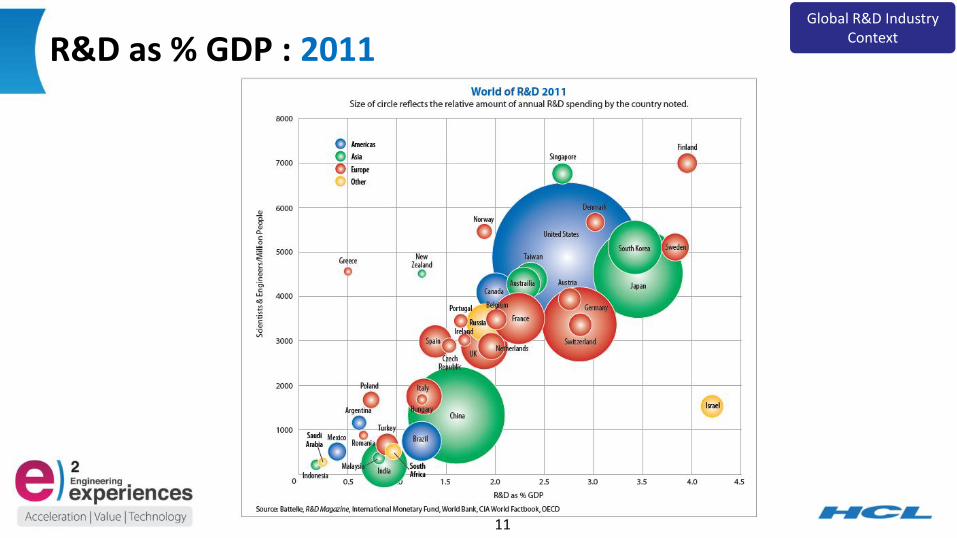
R&D as % GDP : 2011 Global R&D Industry
Context
12 12 12
218
251
9585
80
120
160
200
240
280
1997 1999 2001 2003 2005 2007 2009 2011 2013 2015
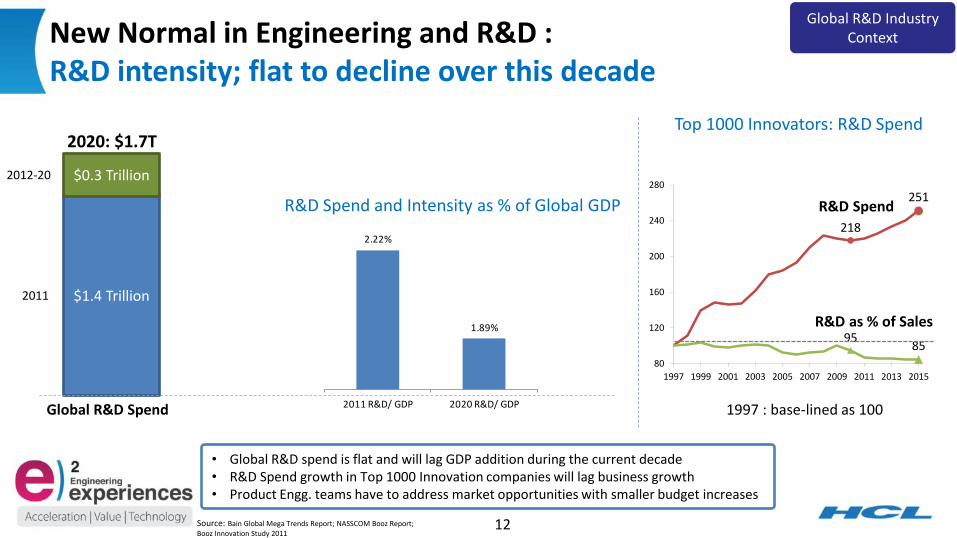
New Normal in Engineering and R&D : R&D intensity; flat to decline over this decade
$1.4 Trillion
$0.3 Trillion
Global R&D Spend
2011
2012-20
2020: $1.7T
R&D Spend and Intensity as % of Global GDP
Top 1000 Innovators: R&D Spend
R&D Spend
• Global R&D spend is flat and will lag GDP addition during the current decade • R&D Spend growth in Top 1000 Innovation companies will lag business growth • Product Engg. teams have to address market opportunities with smaller budget increases
Source: Bain Global Mega Trends Report; NASSCOM Booz Report; Booz Innovation Study 2011
R&D as % of Sales
1997 : base-lined as 100
Global R&D Industry Context
2.22%
1.89%
2011 R&D/ GDP 2020 R&D/ GDP

13 13 13
Engineering and R&D : India Context

14 14 14
2011 : Engineering and R&D was 19% of Indian IT Exports 2020 : ER&D ~3X in scale of 2011
Engineering and R&D Services from India : the road ahead @ 16.2% CAGR
India Engg. Services Market Forecast
ER&D India Context

15 15 15
North America46%
Europe30%
Japan9%
ROW15%
North America
Europe
Japan
ROW
Engineering Services Market : Geo wise growth
Source: NASSCOM Booz Report
2020 ES market: Size & Growth by GEO
Size
$6.7B
$4B
$13.5B
$20.7B 13.0%
16.2%
16.5%
25.9%
26.2%
North America
ESO Market
Europe
Japan
ROW
ER&D India Context

16 16 16
Engineering Services Market : Industry wise growth
$8.5B
$4B
$2B
$8.7B
Size
$1B
$2B
$10.8B
$8.5B
22.6%
20.0%
18.4%
18.0%
17.2%
16.2%
14.0%
10.2%
9.3%
Automotive
Medical Electronics
Consumer Electronics
Industrial
Aerospace
ESO Market
Computing Systems
Networking & Telecom
Semiconductor Mfg
ER&D India Context
19%
24%
19%
19%
2%4%
9%4%
Automotive
Consumer Electronics
Networking & Telecom
Industrial
Semiconductor
Computing Systems
Aerospace
Medical Electronics
2020 ES market: Size & Growth by Industry
17 17 17
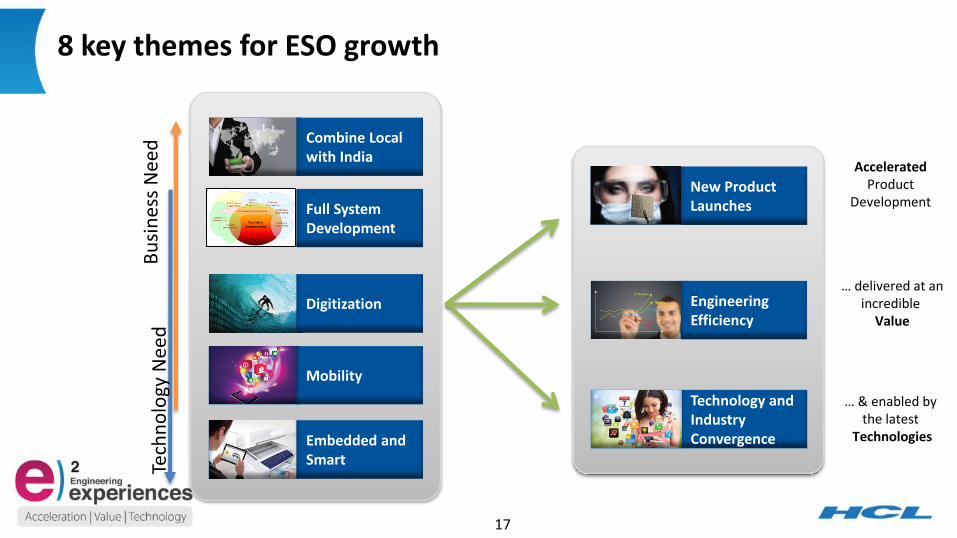
8 key themes for ESO growth
New Product Launches
Technology and Industry Convergence
Combine Local with India
Mobility
Embedded and Smart
Digitization
Bu
sin
ess
Nee
d
Tech
no
logy
Nee
d
Accelerated Product
Development
… delivered at an incredible
Value
… & enabled by the latest
Technologies
Full System Development
Engineering Efficiency

18 18 18
Engineering Partner for the best known global
brands Most of the World’s
best known brands leverage India in
Engineering Services
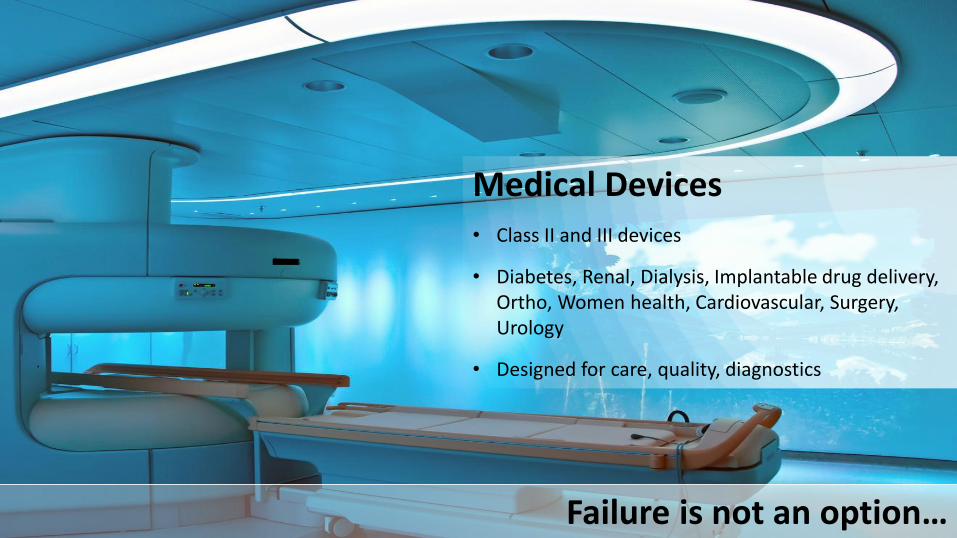
19 19 19 Failure is not an option…
Medical Devices • Class II and III devices
• Diabetes, Renal, Dialysis, Implantable drug delivery, Ortho, Women health, Cardiovascular, Surgery, Urology
• Designed for care, quality, diagnostics

20 20 20
Telecom • 75% of the products, platforms, devices, tools
• Core network, SDN, Video, Analytics, Mobility, Converged and self healing network, IPV6, M2M
• SW, Embedded, Value Engineering, Test & Certification
• One of the largest global engagements in ESO

21 21 21
Office Automation • 3 COEs ; High speed data analytics,
Imaging, Control Systems
• Design, Development and Life cycle management of 8 products complete end-2-end
• Cloud based Apps for new segment, emerging market

22 22 22
Consumer • Picture quality so lifelike it's like looking through a
window
• 4K LCD Panel, 4 X ultraHD
• Apps and connect to the world through Entertainment Network
• Imaging and SW, All screen development
• Platform, Devices, Embedded, Mobile, Quality
23 23 23
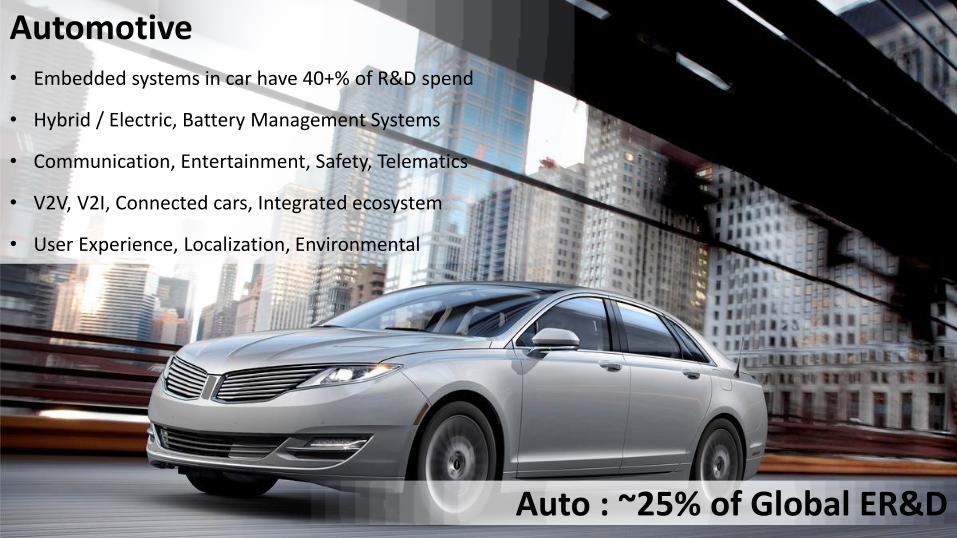
Automotive • Embedded systems in car have 40+% of R&D spend
• Hybrid / Electric, Battery Management Systems
• Communication, Entertainment, Safety, Telematics
• V2V, V2I, Connected cars, Integrated ecosystem
• User Experience, Localization, Environmental
Auto : ~25% of Global ER&D

24 24 24
Industrial / Heavy Machineries • Powertrain, Structures, Cabin, Hydraulics, Electrical / Electronics
systems
• Device control and monitoring, M2M, Sensors, Data collection / analytics
• Telematics, Diagnostics, Mobility, Cloud Applications
Industrial ESO growth 18% CAGR; same as Consumer

25 25 25
ESO and Business Transformation : Engagement Context
26 26 26
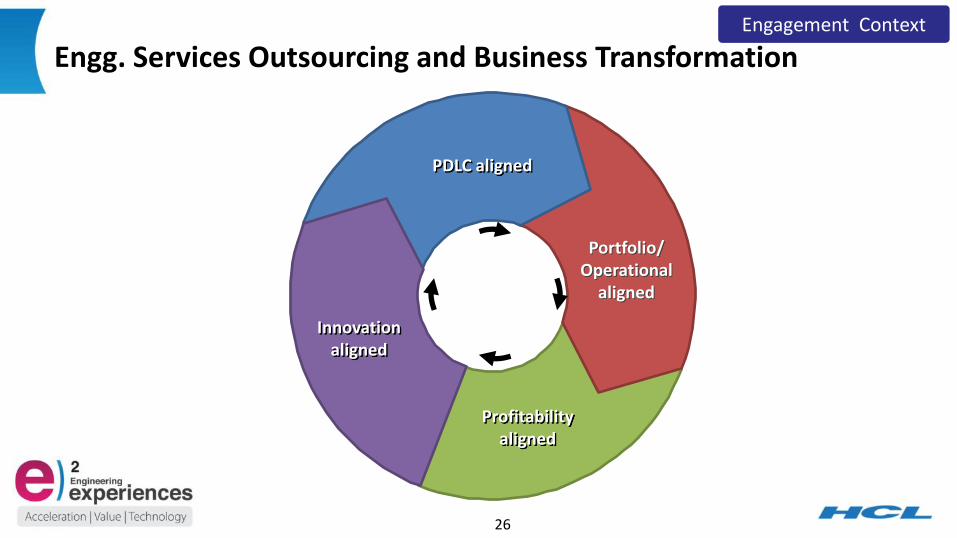
Engg. Services Outsourcing and Business Transformation Engagement Context
PDLC aligned
Innovation aligned
Portfolio/ Operational
aligned
Profitability aligned

27 27 27
PDLC alignment
Go To Market Tight Deadlines
Interdependencies
Declining Margins Operational Efficiency
Adjacent Markets
End of Lifecycle Cost Pressures
Product Sustenance
Product launch & Acc. Platform build & Acc. Value Engineering Product Sust. & Support Product Q&C
• Solutions • Product Mgmt. • Architecture • System Engg.
• Test Automation • Release Management • Process Management
• BOM optimization • Supply Chain Mgmt. • Emerging Market
Addressal
• Cost of quality • Cost of sustenance • Maintaining Product Margin
• Platform Engineering • I18N/L10N • Performance engineering
Pa
in P
oin
ts P
DLC
So
lutio
n
}
}
}
Engagement Context 1
Customer Satisfaction Escalations
Release Cycles
Expanded User Base Uniform Experience Turn Around Time

28 28 28
Portfolio / Operational alignment Engagement Context 2
Installed base is the main contributor to profits, Maintenance contracts contribute to large share of revenue and profits
Investments need to be unlocked and put into newer products
Significant cost pressure from engg. operations
Most product companies with 10+ years of history have multiple products, releases, diverse teams, silo operations ..
Diversified customer portfolio with respect to: businesses, industries & geographies
Engineering processes are geared for medium - long product launch cycles

29 29 29
Profitability alignment BCG matrix; low growth and low market share products cause significant drain
Market Share
Ma
rket
Gro
wth
Question Mark Star
Dogs Cash Cows
End of Lifecycle, Legacy Technology, Cannibalized by next gen Products • Reduce cost of operations and make the product
profitable • Free up experienced resources • Extend Life of Product, ensure smooth transition for next gen products
Mature Product, Huge Customer Base • Test Automation & Cycle time reduction • Agile & Rapid Release Management • Incidence Management and Customer Satisfaction
Mature Product, Huge Customer Base • Platform Engineering for Uniform Customer
Experience @ Scale • Test Automation and rapid release management • Addressing extended and adjacent markets with localized solutions
New Technology, New Segment / Market • Solutions / core engg. expertise • Flexible Engineering Capacity @ Scale
Engagement Context 3

30 30 30
Innovation alignment Engagement Context 4
Product innovation Patentable ideas Supplier sourced Innovation
a
Process innovation Injection of Intelligence Operational Efficiencies
b
Business model innovation Outcome based Risk reward / Revenue share
c
New market ideas Product adjacencies Industry / technology convergences
d

31 31 31
HCL Technologies, an introduction

32 32 32
About HCL
• $ 6.2 B Enterprise
• 90,000 Employees
• 31 Countries

33 33 33
HCL Japan
Absolute Market Leadership in Engineering Services
Largest Engineering Outsourcing by a Japanese Company
Local Multi-Lingual Employees 30% Local Hires
Industry Best in Class CSAT 100% Contract Renewals
19 Years of local presence
35+ Customers
#1 Indian services company in Japan
500+ Engineers skilled in
Japanese language including 56 Native Japanese
$8B+ Product revenue enabled
8 of 32 Top 150 R&D companies
are HCL’s Customers
2000 Employees across Japanese
projects
Only Indian Service Provider to be
certified by VCCI Japan
70+ Language support experts
Asian Human Capital Award 2011

34 34 34
HCL ERS : creating business impact for our customers across the globe everyday
25+ customers / Focus industry verticals: CE, Medical & Office Automation; Auto and Industrial
Japan dedicated, Multi-lingual engg. / engagement teams / 2 Offices, Tokyo and Osaka
Japan
$25+ M investment in engg. labs
~ 100 development centers, dedicated and shared
6 locations, 15,500+ engineers, among the largest engg. strength globally
India
225+ customers
$40 B+ product revenue enabled
3 US based Engineering Development Centers with 50% local employees / 20+ Offices
North America
50+ customers / 4 Regions in Europe
15 of 50 Top Tier R&D companies are HCL’s Customers
1 Europe Development Center, 80% local employees
Europe
• by 18,500 HCL ERS engineers across 4 continents; 3000 outside India
• for 300+ active engineering customers • at 75 active Offshore Development Centers with
dedicated labs, 22 shared labs

35 35 35
Lets recap … The world we live in has changed …..
Best known global brands leverage India’s engineering and design ….
Global R&D investment will lag global GDP growth over this decade ….
Engg. and R&D Services from India will grow 8 times faster than global R&D ….
4 Engagement contexts of ESO and Business Transformation …..

36 36 36
36
Thank You