RCED-89-135 Standards and Technology: Impact of Fee ...
24
’ 1 c F’llil(b(l Stilt(‘S (;(hIICLl’ilI Acc.ourrt.ing Of‘ficXa -- ,~ _--.- “_,^_ -.__l.l”._.l ..___r.._ . __ . .I “..._ . .._-^.I._--.1”-- ----- GAO ~ -_____ I - 111 .l_l_-.____ .- -I . . . I .” .._.-, -. ._., .I _-._._. - ....l._l_r - .-.-- I_. ~“I *I I1 tit& 1 !)t+!) STANDARDS AND TECHNOLOGY Impact of Fee Increases on Measurement Services “t -
Transcript of RCED-89-135 Standards and Technology: Impact of Fee ...
’ 1 c F’llil(b(l Stilt(‘S (;(hIICLl’ilI Acc.ourrt.ing Of‘ficXa -- ,~ _--.- “_,^_ -.__ l.l”._.l ..___r.._ . __ . .I “..._ . .._ -^.I ._--.1”-- -----
GAO
~ -_____ I - 111 .l_l_-.____ .- -I . . . I .” .._.-, -. ._., .I _-._._. - ....l._l_r - .-.-- I_. ~“I
*I I1 tit& 1 !)t+!) STANDARDS AND TECHNOLOGY
Impact of Fee Increases on Measurement Services
“t -


GAO united states General Accounting Office WaaMngton, D.C. 20548
Resows, Canmunity, and Economic Development Division
B-236260
June 22,1989
The Honorable Robert A. Roe Chairman, Committee on Science,
Space and Technology House of Representatives
The Honorable Robert S. Walker Ranking Minority Member, Committee on
Science, Space and Technology House of Representatives
On October 20,1988, you requested that we analyze the potential impact of proposed fee increases on sales of calibration services and standard reference materials provided by the National Institute of Standards and Technology (NET)-formerly the National Bureau of Standards-in the Department of Commerce. As agreed with your office, to assess the impact of the fee increases, we analyzed the changes in prices and corre- sponding changes in service levels (demand) for calibration services and standard reference materials between fiscal years 1979 and 1988. We also evaluated the justification for proposed fiscal year 1989 fee increases that NIST submitted to your Committee on September 19,1988.
Results in Brief Because data were not readily available to measure the impact of vari- ous factors that affect demand, we could not determine how much impact, if any, price changes alone had on the demand for NIST calibra- tion services and standard reference materials between fiscal years 1979 and 1988. Our analysis suggested, however, that demand was affected by factors other than price changes, such as the market condi- tions for NET customers’ products and services.
In justifying its proposed fiscal year 1989 fee increases, NIST did not fully explain the nature or the likely impact of the fee increases on the demand for measurement services, which we believe would have helped the Committee evaluate the appropriateness of the increases.
/ Background Calibration services and standard reference materials assist businesses
and research laboratories in precisely measuring the physical and chem- ical properties of materials. Calibration services generally include check- ing, adjusting, or characterizing particular instruments, devices, or sets of standards on a one-time-per-request basis. The cost for these services
Page 1 GAO/WED-S~135 Standards and Technology
_;, ,I.’ f .*:’ ‘. .‘: .s, , “‘,,:, ‘_ : ,’ ,” ,,I’
.., ‘$, ,‘,’ .’ .,

B-226260
in fiscal year 1988 averaged $471 per calibration and ranged from less than $100 to calibrate a laboratory thermometer to over $60,000 for special tests of large microwave antenna systems. Standard reference materials are certified for certain chemical properties, such as the com- position of steel, or physical properties, such as the thickness or weight of coatings. They can be used for calibrating an instrument, assessing a measurement method, or assigning values to materials. In fiscal year 1988 the cost for standard reference materials averaged $144 per unit and, according to a NIST official, ranged from $39 for five microcopy test charts to $3,636 for an optical microscope linewidth-measurement standard used in manufacturing integrated circuits.
Fees for Services
Calibration NIST'S customers are charged for calibration services based on the number of tests performed on an item. In December 1987 NIST increased the price of calibration services, which had been based on its technical division’s costs to perform these services and an operations surcharge of about 13 percent to cover administrative office expenses, by adding a “development surcharge” to support the development of new and improved calibration services. NIST Set the development surcharge at 8 percent of the technical division’s costs to perform calibration services for fiscal year 1988 and plans to increase it by 8 percent each year until the surcharge is about 40 percent of the technical division’s costs in fis- cal year 1992.
Fees for Standard Reference Materials
The price of a standard reference material is baaed on (1) the direct cost of producing and certifying it; (2) an operations surcharge to cover packaging, inventory, sales, and distribution costs; (3) fees to cover such costs as obsolescence and differences between direct production costs and fair market value; and (4) a development surcharge that was intro- 1, duced in fiscal year 1983 for the development of new and improved standard reference materials. In December 1987 NIST increased the development surcharge from 16 percent to 20 percent of the direct cost of producing a standard reference material, which on average repre- sented only about 39 percent of NIST'S total price. (The surcharge was $7.80 on average for standard reference materials costing $100.) NIST
plans to increase the development surcharge by 6 percent annually until it is about 40 percent of the direct production cost in fiscal year 1992.
Page 2 GAO/WED-W13~5Standardsand Technology
,

Requirement That NIST Justify Further Fee Increases
Section 6114 of the Omnibus Trade and CompeUtiveness Act of 1988 (P.L. 100-418) requires that NIsT justify in writing to the Senate Commit- tee on Commerce, Science and Transportation and the House Committee on Science, Space and Technology all policy changes regarding fees for standard reference materials and calibration services, including a description of the anticipated impact of any proposed changes in demand for and revenues from these services.
Changes in Factors In analyzing the changes in real average prices and service levels for
Other Than Price Can standard reference materials and calibration services between fiscal years 1979 and 1988, we found that factors other than price also
Affect Demand for affected the demand for these services.’ According to NIST officials, price
NIST Measurement increases generally have affected the demand for NIST measurement ser-
Services vices less than other factors, such as general economic conditions, mar- ket conditions for products or services that NIST'S customers provide, and the availability and price of alternative services. The NIST officials noted that measurement service costs are negligible in comparison with the costs of equipping and operating a laboratory that uses the services. They said customer feedback has indicated that most customers (1) are willing to pay higher fees for new and improved services and (2) can adjust their budgets to the higher prices if they are aware of the price increases ahead of time. The NIST officials also observed that customers may be able to pass on price increases to their own customers or alterna- tively, depending on the degree of accuracy required, customers may reduce costs by using less expensive measurement services offered by private industry or increase the time between obtaining measurement services from NIsT.
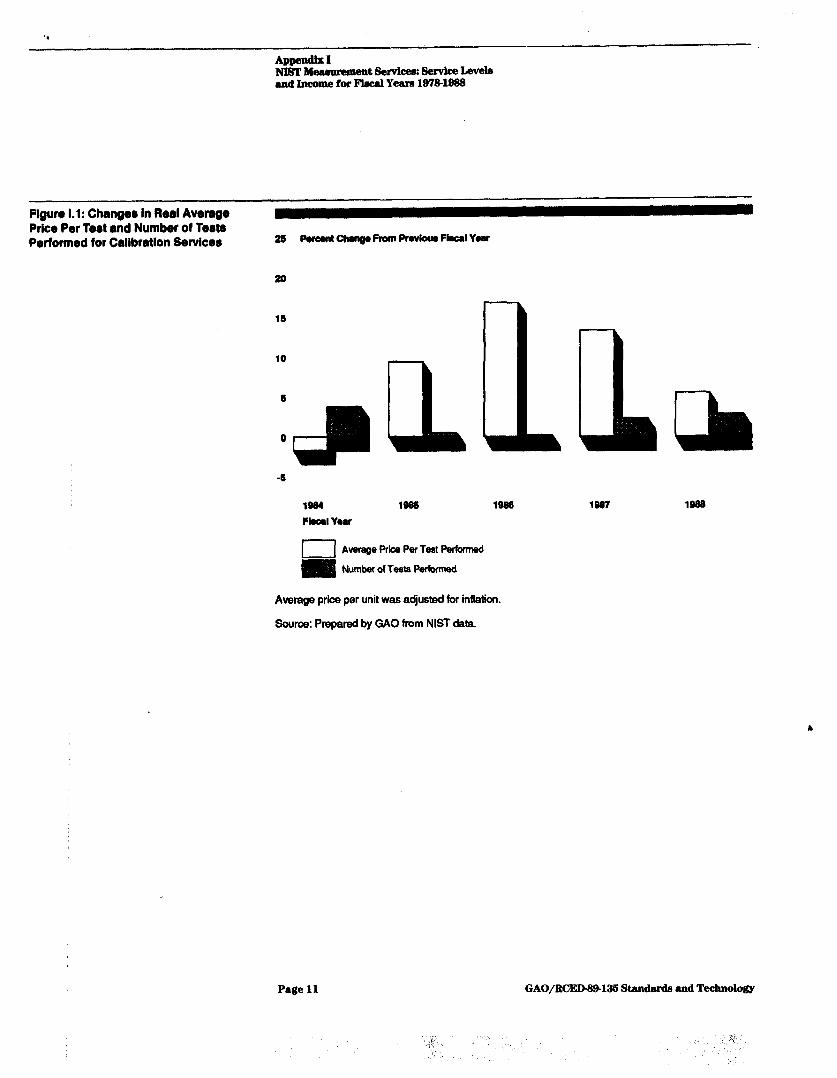
Calibration Services We found that the number of calibration tests performed increased in each year between fiscal years 1984 and 1988, even though the real average price per test also increased in each year except fiscal year 1984, indicating that changes in factors other than price also affected the demand for calibration services, For example, the largest price change, a 17-percent increase in fiscal year 1986, corresponded with a Z-percent increase in the number of tests performed. In fiscal year 1988, despite a real average price increase of 6 percent, the number of tests performed increased by 3 percent. (See app. I for a year-by-year analysis.)
‘We analyzed NIST’s average price for services in real dollars to account for inflation.
Page 3 GAO/RCED-Sfh136 Standa& and Technology
Ez36259
The Chief of NIST’S Office of Physical Measurement Services said that the economic state of the defense and aerospace industries has been and is likely to continue to be the most important market force affecting the demand for calibration services. This is because defense procurement contracts that specify a high degree of measurement precision comprise a significant portion of the demand for calibration services.
Standard Materials
Reference We found that price changes had some effect on the demand for stand- ard reference materials between fiscal years 1979 and 1988. In particu- lar, the largest price change, an increase of 23 percent in fiscal year 1983, corresponded with the largest change in demand, a decrease of 16 percent. However, factors other than price also affected the demand for standard reference materials. Roth the real average price and the number of units sold increased in fiscal years 1986 and 1987, indicating that other factors overshadowed price changes. The magnitude of the fluctuations in demand in other years also reflected the effect of factors other than price. (See app. I for a year-by-year analysis.)
The Chief of the Office of Standard Reference Materials told us that sev- eral factors can affect the demand for particular standard reference materials. He said that it is not uncommon for NIST to be out of stock or have a backlog of orders for a given material. He cited, as an example, that the optical microscope linewidth-measurement standard has a wait- ing list of up to 2 years because (1) it is critical for producing integrated circuits, (2) NIST is the only producer of this material, and (3) NIST
requires 2 weeks to produce each one. For the human serum standard reference material, although prices increased (28 percent in fiscal year 1987 and 9 percent in fiscal year 1988), sales increased even more (by 46 percent and 19 percent, respectively) because of increased quality consciousness in the clinical industry. Alternatively, he mentioned that b sales of microscopy test charts dropped (from 2,336 units in fiscal year 1986 to 696 in fiscal year 1987) in large part because a major customer decided to produce its own.
Jdstification to the Cbnmittee for Fee Idcreases v
Senate Committee on Commerce, Science and Transportation and the House Committee on Science, Space and Technology of NET’S intent to increase the development surcharge fees in fiscal year 1989. (See app. II.) The director concluded that the fiscal year 1988 development surcharge increases had “no deleterious impact” on measurement ser- vices income and that small business demand increased by 21 percent
Page 4 GAOjWXD-39~135 Standards and Technology
for calibration services and declined by 1 percent for standard reference materials. Data were enclosed for both programs showing current and projected revenues from the proposed fee increases; the sales history for fiscal years 1978 through 1988, including the service levels, gross income, and average price per item; and a comparison of income col- lected in various categories of customers in fiscal years 1987 and 1988.
We believe NIST could have improved its analysis and presentation of information on the nature and possible impacts of the fee increases to assist the Committees in their deliberations by (1) clearly indicating that the development surcharges would be applied to only a portion of the total sales price, (2) analyzing annual changes in average prices and income using real dollars to account for inflation, (3) controlling for or explaining the likely effects of other factors on customer demand, and (4) more clearly showing the impact of price changes on customer demand. In addition, we noted that NIST could have improved its analy- sis of calibration services by comparing income with the number of cali- brations, rather than the number of items calibrated, because NIST
charges its customers on the basis of tests performed.
After we discussed our findings and observations with your office on January 30,1989, you sent a letter to the acting Director of NIST on Feb- ruary 8, 1989, approving the proposed fiscal year 1989 fee increases but requesting that NIST meet with us to consider the results of our work and more clearly present data justifying any further increases. In a meeting with our staff on March 29, 1989, NIST officials agreed with our observa- tions about how they could more clearly present information justifying future increases and added that our report would be helpful in prepar- ing future justifications.
Scope and Methodology
NIST officials provided us with information and statistics on the prices, service levels, and program income for calibration services and standard reference materials from fiscal years 1978 through 1988. We analyzed these data to determine the relationship between price changes and changes in service levels. To compare prices over time, we adjusted the average price for inflation by calculating a real average price by (1) adjusting yearly income to its 1982 equivalent by dividing it by the pro- ducer price index for intermediate materials, supplies, and components and (2) dividing the adjusted income by the number of calibration tests performed or units of standard reference materials sold, as appropriate. We also reviewed past, present, and planned pricing policies for these
Page 5 GAO/RCED.39-135 Standards and Technology
R-336369
services but did not survey NET’S customers to obtain their views on the impact of these pricing policies.
We conducted our review in January and February 1989. We discussed the report’s contents with responsible agency officials and incorporated their views where appropriate. However, as requested by your office, we did not obtain formal agency comments on a draft of this report.
As agreed with your office, we are sending copies of this report to the Secretary of Commerce and other interested parties. Copies also will be made available to others upon request. Major contributors to this report are listed in appendix III.
c/ John M. Ols, Jr. Director, Housing and Community
Development Issues
Page 6 GAO/RCED-SBX3l5 Ramlamb and Technology
. ...” .., ,, : / :

Page 7 GAO/RCEDs9-136 Standards and Technology

Contents
Letter
Appendix I NIST Measurement Services: Service Levels and Income for Fiscal Years 19’7% 1988
Appendix II NIST’s Justification for Its Fiscal Year 1989 Development St&charge Fee
13
In&eases
Aapendix III 20
Maljor Contributors to Resources, Community, and Economic Development 20
This Report Division Washington, DC.
Tables Table I. 1: Service Levels and Income for Calibration Services
10
Table 1.2: Service Levels and Income for Standard Reference Materials
10
Figures Figure I. 1: Changes in Real Average Price Per Test and Number of Tests Performed for Calibration Services
Figure 1.2: Changes in Real Average Price Per Unit and Number of Units Sold for Standard Reference Materials
11
12
Abbreviations
GAO General Accounting Office NEST National Institute of Standards and Technology
Page 8 GAO/RCZD-t3%136 Standnrds and Technology

Page 9 GAO/RCED-W136 Standards and Technology
‘, ‘,,‘. I, ,, ., ..I ‘. .’
Appendix I :
NEST Measurement Services: Service Levels md Income for FbcaI Years 19784988
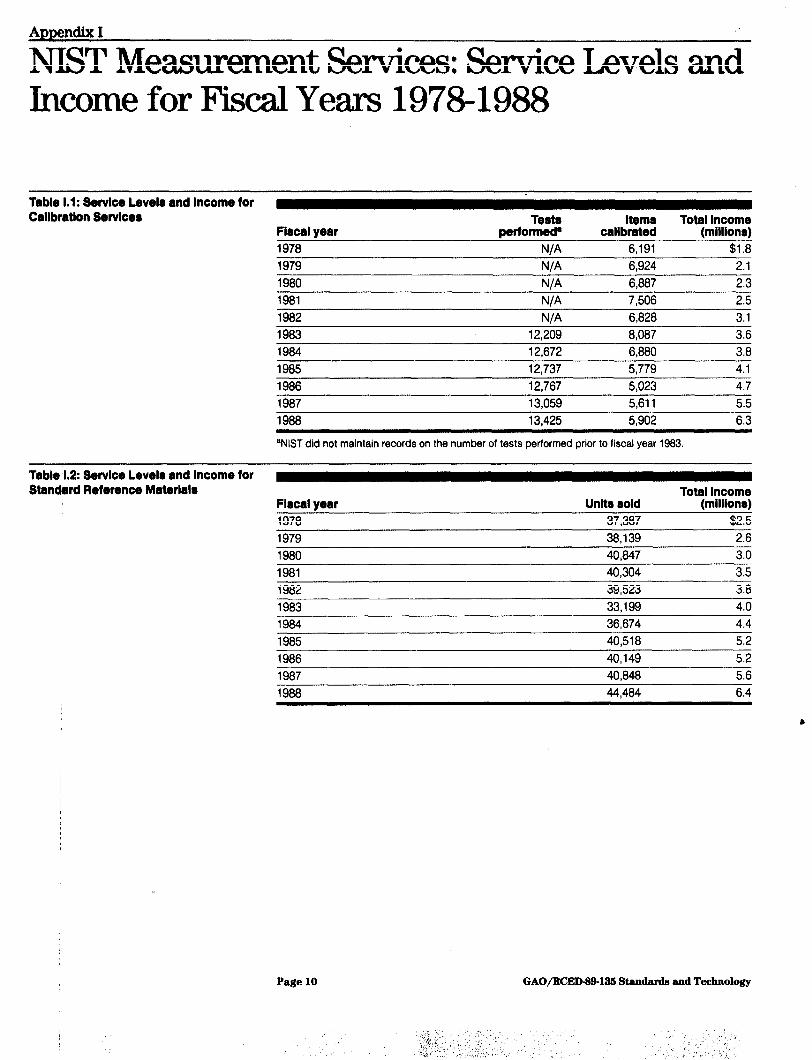
Table 1.1: Service Levels and Income for Callbratlon Servlcee Tests Items Total income
Fiscal year performed0 calibrated (mllllons) 1978 N/A 6.191 $1.8 1979 N/A 6,924 2.1
iii80 N/A 6,887 2.3
1981 WA 7,506 2.5
1982 N/A 6,828 3.1
1983 12,209 8,087 3.6 1984 12,672 6,880 3.8 1985 12,737 5,779 4.1
1986 12,767 5,023 4.7
1987 131059 5,611 5.5
1988 13,425 5,902 6.3
aNlST did not maintain records on the number of tests performed prior to fiscal year 1983
Table 1.2: Service Levels and Income for Standard Reference Materlals Total Income
Fiscal year Units sold (million8) 1978 37,387 $2.5 1979 38,139 2.6
1980 40,847 3.0
1981 40,304 3.5 1982 39,523 3.8
1983 33,199 4.0 1984 36,674 4.4
1985 40,518 5.2
1986 40,149 5.2
1987 40,848 5.6
1988 44,484 6.4
Page 10 GAO/lUXD-S61i% Standards and Technology
Abl&-d mement Servtw Service Levele
and home for Fbcal Years 1978-1888
Figure 1.1: Changes In Real Average Prlco Per Teat and Number of Tests Perloned for Callbratlon Servicer 26 PwmtChangoFmm ProvloW Fbd Year
20
15
10
L 1984 Fboal Yom
I I
1@85
u Average Price Per Test Pwfomwd
Number of Test8 Pwfwmed
loB8 1987 1068
Awage price per unit was adjusted for inflation.
Source: Prepared by GAO from NIST data.
Page 11 GAO/RCED4Bl% Standards and Technology

NTST Measarement Services: Service Levels and Income for Fiscal Years 19781933
Flgun 1.2: Changer In Real Average Price Per Unlt and Number of Unltr Sold for Standard Reference Materials SO Pwwnt Change From Pnvloua Fbcal Year
20
10
0
-10
Fbcal Yom
Average Price Per Unit Sold
Number of Units Sold
Average price per unit sold was adjusted for inflation.
Sourca: Prepared by GAO from NIST data.
Page 12 GAO/‘RCED439-135 Standards e.nd Technology
‘.. ‘,*‘: ,’ : ‘. ‘I, .”

bw ‘s’s Justification for Its Fiscal Year 1989 Development Surcharge Fee Increases
UNITED STATES DEPARTMENT OF COMMERCE Natlonol Burw~~ of Standards
SEP 1 9 196fi
Honorable Robert Roe Chairman, Committee on Science,
Space and Technology House of Representatives Washington, D.C. 20515
Dear Mr. Chairman:
As I notified you last year, NIST increased its fees charged for standard reference materials and calibration services, effective December 6, 1987. This was part of cur five-year plan to increase fees incrementally to a final surcharge level of approximately 40% for each service. The funds collected from the surcharges are used to offset costs associated with developing new and/or improved standard reference materials and calibrations needed by industry at large.
Improved measurement methods and standards are needed for measurement quality assurance in traditional science and technology areas, and at the same time, industry and the science communities need new measurement methods and standards for new emerging technologies. The increases for this past year have allowed NIST to further serve industry as a whole without adversely affecting individual customers, including small business. The next incremental increase in fees would allow NIST to further expand its efforts to improve its existing measurement services and develop new services.
In response to your Committee instructions dated November 17, 1987, NIST has monitored the effect of the 1988 fee increases on the demand for services and the impact on small business, non-profit organizations and other organizations with limited financial means. The data we have collected to date indicates no deleterious impact on income as a result of these fee increases and has resulted in a drop of only 1% in the income level from small business for reference materials and an increase of 21% in the level of calibration services provided to this same class of customers. I am enclosing several graphs displaying the sales history and income levels for both standard reference materials and calibrations.
Based on this review we intend to implement the second incremental increase to the fees at the beginning of fiscal year 1989. I am enclosing l chart showing current and projected revenues and surcharge rates from the increases.
Page 13 GAO/ltCEDWl~ Standards and Technology
,I

P
:
NEWa JuetUkatlon for Ita Fiscal Year 19419 Development Surcharge Fee Increaaee
UNITED STATES DEPARTMENT OF COMMERCE Natiensl Bureau of Standards
In eccordancs with Section 5114 of Public Law 100-418. the Omnibus Trade and Coupetitivoness Act of 1988, this letter is intended to notify you of our plans to Implement this next incremental fee increase.
Sincerely, OrWoa1 Sign@ 3, SCFIJeat Amblrr
Ernest Ambler Director
Enclosures
CC: Manuel Lujan, Jr. Ranking Minority Member
Page 14 GAO/RCEDW-135 Standards and Technology

APP-II NIST’eJndflcatlon forItrFUcaIYeulW3B Development Surcharge Fee Incwwes
Current and Projected Revenues from Proposed Fee Increases
Technical service level:
Development surcharge rate applied:
Davelopment funds from customer fees annually (SK):
Change margin:
Production costs:
Development surcharge rate applied:
Development funds from customer fees snnually ($10:
Change margin:
Total combined cumulative 348 713 1,560 2 ,,160 2,760 3,360
. . .
. . .
. . .
. . .
$2.3N
15%
348
-
$5.5M $6H
8% 16%
250 d 960
+250 +710
$2.3M $2.4M
20% 25%
463 600
dui+137
$6H
24%
1,440
+480
$2.4H
3or;
720
h/ Lapsed resulting from &layed implementation for fiscal year 1988.
WH
328
1.920
t480
$2.414
35%
840
AKQ
w
408
2,400
+480
$2.4N
40%
960
Au!2
Page 15

Appendix II NEWS Ju&fkation for Itu Fha.l Year 1999 Development Surcharge Fee Increases
SRM SALES HISTORY
Units Sold Gross Income ($M)
50,000
45,000
40,000
35,000
30,000
25,000
20,000
15,000
10,000
5,000
0
$97 $129
78 79 80 81 82 83 84 85 86 87 88
Fiscal Year
Total Income - right vertical axis
6 -
Unlta aold - 5 left vertloal axls
Page 16 GAO/RCED-W-135 Standards and Technology
.
NISFr Jlutiflcstion for Its F’bcal Year 19?39 Development Surcharge Fee Increases
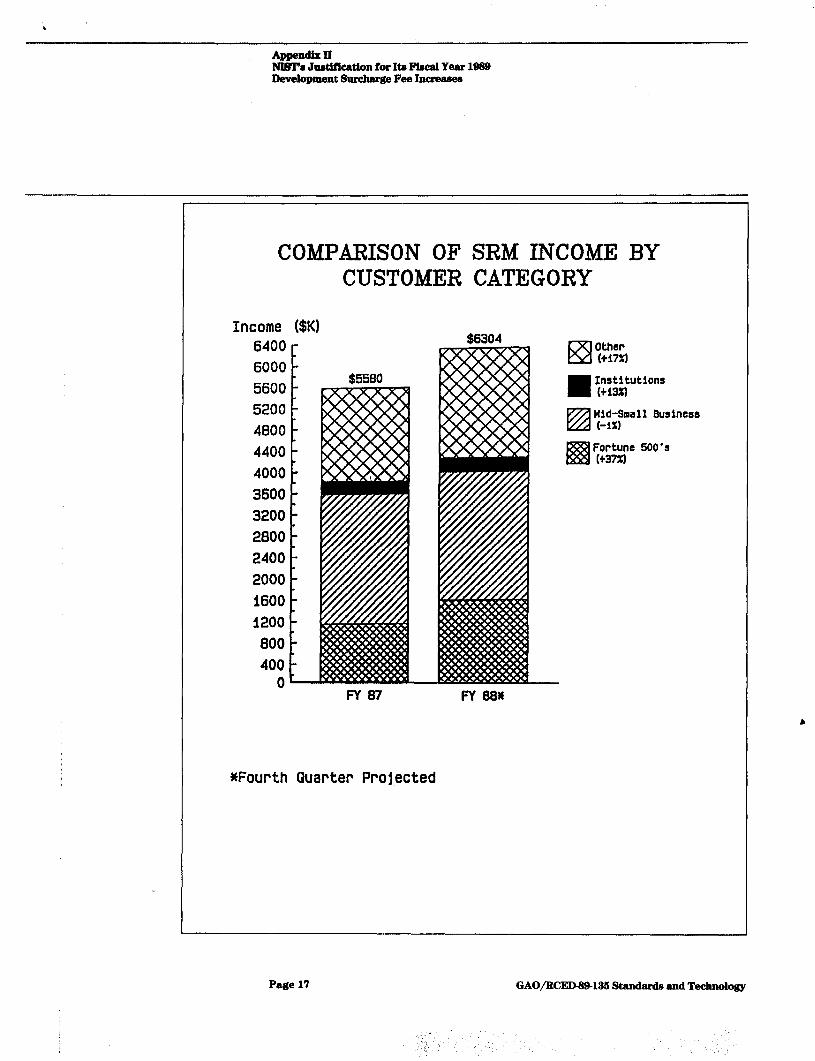
COMPARISON OF SRM INCOME BY CUSTOMER CATEGORY
Income ($Kl 6400 - 6000 - 5600 - 5200 - 4800 - 4400 - 4000 - 3600 - 3200 - 2800 - 2400 - 2000 - 1600 - 1200 - 800 - 400 -
0-
*Fourth Quarter Projected
$6304 Other (+17x1
Inn;zutlons
lzl Mid-Small Business (-1%)
Page 17 GAO/RCED-S9-185 Standande and Technology
,: ‘I,’ .:*, I’
Appendix II NIST’s Judflcation for Its Fiaca3 Year 19SB Development Surcharge Fee In-
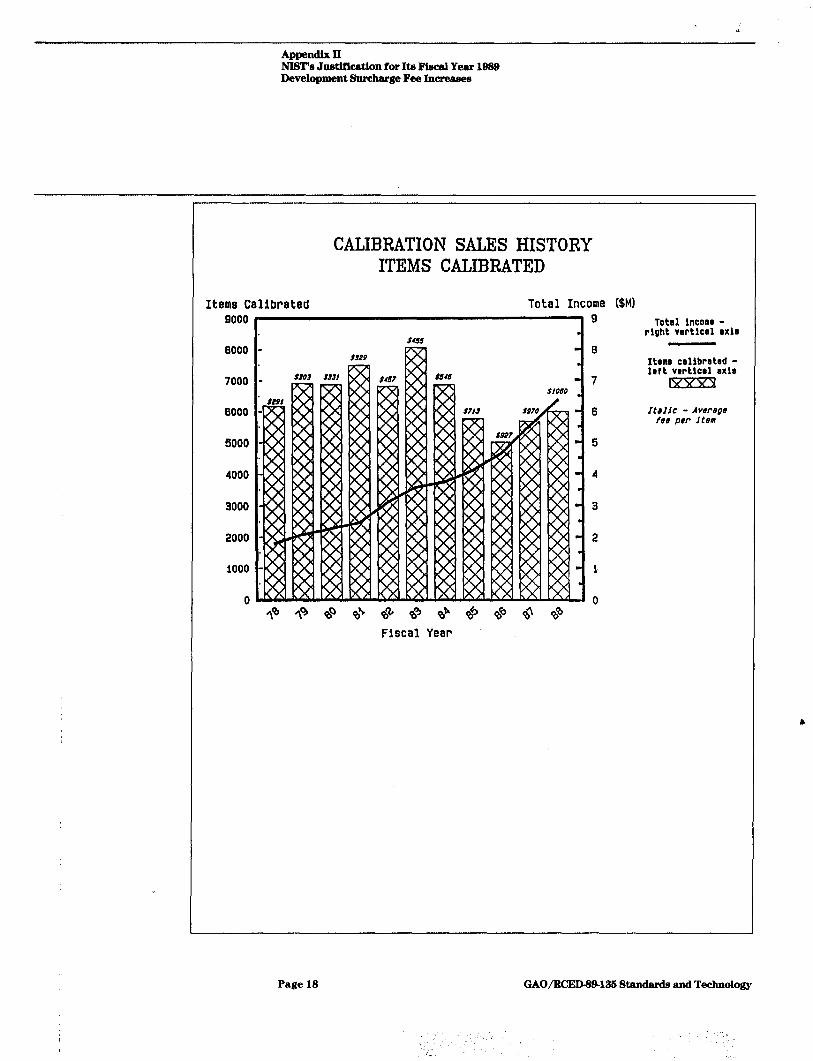
CALIBRATION SALES HISTORY ITEMS CALIBRATED
Items Calibrated Total Income ($Ml 9000
6000
7000
6000
5000
4000
3000
2000
1000
0
Total lncomv - rlght vartlcsl sxls
Itrmm csllbratad - loft vrrtlcrl rxls
fxxua
Italic - Average fee Der item
Page 18 GAO/RCED-fB135 Standards and Technology
‘. .:,

AppendlxII NISTb Jn&flcatlon for Its Fkal Year 1989 Development Surcharge Fee Increaw
COa@ARISON OF CALIBRATION INCOME BY CUSTOMER CATEGORY
6400 ,- 6000 - 5600 - 5200 - 4800 - 4400 - 4000 - 3600 - 3200 - 2800 - 2400 - 2000 - 1600 - 1200 - 800 - 400 -
Income WI
$5627
*Fourth Quarter Projected
Other (+42%l
aI Institutions (+!%I
Fortune 600'8 (-3X1
Page 19 GAO/IUXDW135 Standards and Technology

Appendix III
Major Contributors to This &port
Resources, Community, and Economic
John M. Ols, Jr., Director, Housing and Community Development Issues, (202) 27645626 Lowell Mininger, Assistant Director Richard Cheston, Assignment Manager
Development Division Linda J. Weber, Evaluator-in-Charge M&rzd Nadji, Economist
Washington, D.C.
(006765) Page 20 GAO/RCED-3%133 Standarda and Technology

‘I’tlt~ l’irsl five c’tbpiw of thilCtl rt~port. iiw I’rtw. Atlctit ional t*opiths art !s’L.oo t%c-tl.
Ordt~rs IIIUS~ tw ~)rt’pi~itl by t*astl or by check or tnot1t~~’ orttt~r lllittttb 0111 lo t tit* SliI)t~rii~lt~iltlt~iit ol’ Ihwr~rwtits.
-