RC-1471 - Field Demonstration of Durable Link Slabs for Jointless
265
New Abstract Form I:/forms/newblankabstractsheet (3/2002) Technical Report Documentation Page 1. Report No. Research Report RC- 1471 2. Government Accession No. 3. MDOT Project Manager Roger Till 4. Title and Subtitle Field Demonstration of Durable Link Slabs for Jointless Bridge Decks Based on Strain-Hardening Cementitious Composites 5. Report Date December 21, 2005 7. Author(s) Victor C. Li (Principal Investigator) M. Lepech and M. Li 6. Performing Organization Code 9. Performing Organization Name and Address The Advanced Civil Engineering Material Research Laboratory Department of Civil and Environmental Engineering University of Michigan, Ann Arbor, MI 48109-2125, U. S. A. 8. Performing Org Report No. 10. Work Unit No. (TRAIS) 11. Contract Number: Master Contract #03-0026 12. Sponsoring Agency Name and Address Michigan Department of Transportation Construction and Technology Division P.O. Box 30049 Lansing, MI 48909 11(a). Authorization Number: Work Auth #2 13. Type of Report & Period Covered June 21, 2004 – Dec. 21, 2005 15. Supplementary Notes 14. Sponsoring Agency Code 16. Abstract The research presented herein describes the development of durable link slabs for jointless bridge decks based on strain- hardening cementitious composite - engineered cementitious composite (ECC). Specifically the superior ductility of ECC was utilized to accommodate bridge deck deformations imposed by girder deflection, concrete shrinkage, and temperature variations, providing a cost-effective solution to a number of deterioration problems associated with bridge deck joints. Based on the findings within, the implementation of a durable ECC link slab is possible in a standard bridge deck reconstruction scenario. This report includes development of theoretical guidelines for compete design of an ECC link slab, example calculations, desk references, sample design drawings, material specifications, and contractual special provisions. In addition to these documents, the results of full scale mixing trials and demonstrations are summarized and recommendations are made along with batching sequences and mix designs for large scale mixing. A summary of construction practices and procedures is also included, followed by the results of full scale load testing on the completed ECC link slab demonstration bridge. Conclusions within the report reveal that with the aid of design documents provided within, the design of an ECC link slab element can be completed with little difficulty by Department of Transportation design engineers. The mixing of ECC material at commercial concrete plants can also produce a large scale version of the material similar in mechanical performance to laboratory grade material. The construction of an ECC link slab can be completed by a general contractor with some additional care when working with this new material. Finally, load tests conclude that the ECC link slab functions as designed under bending loads. 17. Key Words ECC link slab, Jointless bridge deck, Strain-hardening, Durability, Crack width control, Implementation, Demonstration 18. Distribution Statement No restrictions. This document is available to the public through the Michigan Department of Transportation. 19. Security Classification (report) Unclassified 20. Security Classification (Page) Unclassified 21. No of Pages 22. Price
Transcript of RC-1471 - Field Demonstration of Durable Link Slabs for Jointless

New Abstract Form I:/forms/newblankabstractsheet (3/2002) Technical Report Documentation Page 1. Report No.
Research Report RC- 1471 2. Government Accession No. 3. MDOT Project Manager
Roger Till 4. Title and Subtitle
Field Demonstration of Durable Link Slabs for Jointless Bridge Decks Based on Strain-Hardening Cementitious Composites
5. Report Date December 21, 2005
7. Author(s) Victor C. Li (Principal Investigator)
M. Lepech and M. Li
6. Performing Organization Code
9. Performing Organization Name and Address The Advanced Civil Engineering Material Research Laboratory
Department of Civil and Environmental Engineering University of Michigan, Ann Arbor, MI 48109-2125, U. S. A.
8. Performing Org Report No.
10. Work Unit No. (TRAIS)
11. Contract Number: Master Contract #03-0026
12. Sponsoring Agency Name and Address Michigan Department of Transportation Construction and Technology Division P.O. Box 30049 Lansing, MI 48909
11(a). Authorization Number: Work Auth #2
13. Type of Report & Period Covered
June 21, 2004 – Dec. 21, 2005
15. Supplementary Notes
14. Sponsoring Agency Code
16. Abstract The research presented herein describes the development of durable link slabs for jointless bridge decks based on strain-hardening cementitious composite - engineered cementitious composite (ECC). Specifically the superior ductility of ECC was utilized to accommodate bridge deck deformations imposed by girder deflection, concrete shrinkage, and temperature variations, providing a cost-effective solution to a number of deterioration problems associated with bridge deck joints. Based on the findings within, the implementation of a durable ECC link slab is possible in a standard bridge deck reconstruction scenario. This report includes development of theoretical guidelines for compete design of an ECC link slab, example calculations, desk references, sample design drawings, material specifications, and contractual special provisions. In addition to these documents, the results of full scale mixing trials and demonstrations are summarized and recommendations are made along with batching sequences and mix designs for large scale mixing. A summary of construction practices and procedures is also included, followed by the results of full scale load testing on the completed ECC link slab demonstration bridge. Conclusions within the report reveal that with the aid of design documents provided within, the design of an ECC link slab element can be completed with little difficulty by Department of Transportation design engineers. The mixing of ECC material at commercial concrete plants can also produce a large scale version of the material similar in mechanical performance to laboratory grade material. The construction of an ECC link slab can be completed by a general contractor with some additional care when working with this new material. Finally, load tests conclude that the ECC link slab functions as designed under bending loads. 17. Key Words ECC link slab, Jointless bridge deck, Strain-hardening, Durability, Crack width control, Implementation, Demonstration
18. Distribution Statement No restrictions. This document is available to the public through the Michigan Department of Transportation.
19. Security Classification (report) Unclassified
20. Security Classification (Page) Unclassified
21. No of Pages 22. Price

Final Report
On
Field Demonstration of Durable Link Slabs for Jointless Bridge Decks Based on Strain-Hardening Cementitious Composites
By
Victor C. Li (Principal Investigator), M. Lepech, and M. Li
With Contributions by Jerome Lynch and Tsung-Chin Hou
The Advanced Civil Engineering Material Research Laboratory
Department of Civil and Environmental Engineering University of Michigan, Ann Arbor, MI 48109-2125, U. S. A.
Submitted to Michigan Department of Transportation
December 21, 2005
Research Sponsor: Michigan Department of Transportation MDOT Project Manager: Roger Till Award Reference No: Master Cont #03-0026 Work Auth #2 Contract Period: June 21, 2004 – December 21, 2005 Research Report RC-1471

DISCLAIMER
The contents of this report reflect the views of the authors, who are responsible for the
facts and accuracy of the information presented herein. This document is disseminated
under the sponsorship of the Michigan Department of Transportation, in the interest of
information exchange. The Michigan Department of Transportation assumes no liability
for the contents or use thereof.

Acknowledgments
The presented research has been sponsored by the Michigan Department of
Transportation, which is gratefully acknowledged. The authors thank the Michigan DOT
projector manager Roger Till and the other members of the MDOT Research Advisory
Panel for their useful comments, discussions and support. The researchers would also
like to thank the following individuals for their help and support during the
implementation of this new technology: Mr. John Codere, Brighton Block and Concrete;
Mr. Tom Shultz, HNTB; Mr. Gary Watters, Midwest Bridge; Mr. Rodney Cliff, Midwest
Bridge; Mr. Hal Ballinger, Clawson Concrete Company.

i
Table of Contents
Table of Contents………………………………………………………………… i
List of Tables…………………………………………………………………….. iii
List of Figures……………………………………………………………………. v
1.0 Introduction………………………………………………………………… 1
1.1 Background…………………………………………………………….. 1
1.2 Goal and Impact………………………………………………………... 3
1.3 Overview……………………………………………………………….. 3
2.0 Literature Review………………………………………………………….. 5
2.1 Current MDOT Link Slab Design Criteria…………………………….. 5
2.2 Current MDOT Link Slab Implementation……………………………. 6
2.3 Large Scale Mixing of ECC Material………………………………….. 11
3.0 ECC Link Slab Design Example, Theoretical Design Basis (Appendix B),
Design Flow Chart (Appendix B), and Design Overview (Appendix B)…… 15
4.0 Scaling of ECC Mixing Procedures for Large Infrastructure Applications… 26
4.1 Grain Size Distribution Analysis………………………………………. 26
4.2 Fiber Length Change…………………………………………………… 30
4.3 Hydration Stabilizing Admixtures……………………………………… 33
4.4 Batching Sequence – Laboratory Findings…………………………….. 36
4.5 Mixing Plant Site Visit…………………………………………………. 38
4.6 Batching Sequence – Field Findings…………………………………… 38
4.7 Large Scale Trial Mixes………………………………………………… 40
4.7.1 One Cubic Yard Trial………………………………………………. 40
4.7.2 Four Cubic Yard Trial……………………………………………… 44
4.7.3 Two Cubic Yard Trial……………………………………………… 45
4.8 Evaluation and Testing of Fresh Properties……………………………. 47
4.9 Evaluation and Testing of Hardened Properties……………………….. 50
4.9.1 Compression Testing………………………………………………. 51
4.9.2 Uniaxial Tension Testing…………………………………………… 55
ii
4.10 Placing of ECC Material……………………………………………….. 60
5.0 ECC Link Slab Construction Preparation………………………………….. 62
5.1 Informational Meetings………………………………………………… 62
5.2 Approval of Equals Submitted by General Contractor as
Substitute ECC Raw Materials………………………………………… 63
5.3 Contractor Demonstration Mixing……………………………………... 66
6.0 Grove Street Construction………………………………………………….. 73
6.1 Phase One Construction………………………………………………... 73
6.2 Construction of ECC Link Slab – Phase One………………………….. 75
6.3 Early Age Performance – Phase One…………………………………… 81
6.4 Restrained Shrinkage Investigations…………………………………… 84
6.5 Phase Two Construction……………………………………………….. 90
6.6 Construction of ECC Link Slab – Phase Two………………………….. 92
6.7 Early Age Performance – Phase Two…………………………………... 97
6.8 Construction Completion and Restraint of Link Slab by
Non-structural Bridge Components ……………………………………. 99
7.0 Load Testing………………………………………………………………... 107
7.1 Predicted Bridge Response…………………………………………….. 108
7.2 Instrumentation Strategy………………………………………………... 111
7.2.1 Strain Gage Installation Upon the Link Slab Steel Reinforcement… 112
7.2.2 Strain Gage Installation Upon the Link Slab Top Surface…………. 113
7.2.3 Linear Variable Differential Transducers for Beam Rotation……… 114
7.2.4 Data Acquisition……………………………………………………. 115
7.3 Loading Tests…………………………………………………………… 117
7.3.1 Phase One Load Testing……………………………………………. 118
7.3.2 Phase Two Load Testing……………………………………………. 122
7.4 Finite Element Model of the Grove Street Bridge……………………… 136
8.0 Conclusions………………………………………………………………… 138
9.0 Future Research Needs…………………………………………………….. 143
10.0 References………………………………………………………………….. 146
11.0 Appendix A – ECC Tensile Response Statistical Information…………….. A1

iii
12.0 Appendix B – Extended Design Example and Flow Chart with Procedures. B1
ECC Link Slab Design Example and Theoretical Basis……………………… B2
ECC Link Slab Design Procedure Flow Chart……………………………….. B22
ECC Link Slab Design Procedure……………………………………………. B23
13.0 Appendix C – Grove Street Bridge Design Calculations…………………... C1
ECC Link Slab For Grove Street Bridge Over I-94 (S02 of 81063)………….. C2
Grove Street ECC Link Slab Design Details…………………………………. C7
14.0 Appendix D – ECC Special Provision……………………………………… D1
15.0 Appendix E – Link Slab Informational Meeting Minutes………………….. E1
16.0 Appendix F – Construction Progress Meeting Minutes……………………. F1
I-94 Rehabilitation Project (81062-59277) - July 7 Meeting Minutes……….. F2
I-94 Rehabilitation Project (81062-59277) – August 4 Meeting Minutes….... F5
I-94 Rehabilitation Project (81062-59277) - August 18 Meeting Minutes.….. F8
I-94 Rehabilitation Project (81062-59277) – September 1 Meeting Minutes... F11
I94 Rehabilitation Project (81062-59277) – September 15 Meeting Minutes. F14
I94 Rehabilitation Project (81062-59277) – September 29 Meeting Minutes. F17
I94 Rehabilitation Project (81062-59277) – October 13 Meeting Minutes…. F20
I94 Rehabilitation Project (81062-59277) – October 27 Meeting Minutes…. F23
I94 Rehabilitation Project (81062-59277) – November 10 Meeting Minutes.. F26
17.0 Appendix G – Grove Street Thermal Stress Calculations………………….. G1
List of Tables
Table 2.1 ECC Mixing Proportions…………………………………………… 12
Table 4.1 ECC Mix Design Proportions for ECC M45 and M45-X………….. 27
Table 4.2 Fresh Deformability and Strain Capacity of ECC M45 and M45-X
Series…………………………………………………………… 30
Table 4.3 Characteristic Tensile Material Properties for M45 - 0.5” and
M45 – 0.3”……………………………………………………… 33
Table 4.4 Characteristic Tensile Material Properties for M45 with Degaussa
And W. R. Grace Stabilizers…………………………………… 36
Table 4.5 ECC Mixing Sequences and Mixing Results………………………. 37

iv
Table 4.6 Large Scale ECC Batching Sequence Times….…………………… 39
Table 4.7 ECC Mixing Proportions and Batching Weights…………………… 41
Table 4.8 Statistical Parameters of Compressive Testing (Sorted by Trial)….. 51
Table 4.9 Statistical Parameters of Tensile Testing (Sorted by Age)…………. 59
Table 5.1 Statistical Parameters of Compressive Testing of ECC for
Submission Approval…………………………………………… 65
Table 5.2 Statistical Parameters of Tensile Testing of ECC for
Submission Approval…………………………………………… 65
Table 5.3 Statistical Parameters for Compressive and Tensile Testing of
ECC Demo Mixing Material…………………………………… 71
Table 5.4 Fresh Properties of ECC Demo Mixing Material………………….. 71
Table 6.1 Comparison Unit Prices for Superstructure Concrete and ECC…… 73
Table 6.2 Mixing Proportions for ECC Link Slab – Phase One……………… 74
Table 6.3 Statistical Parameters for Compressive and Tensile Testing of
ECC Link Slab – Phase One……………………………………. 79
Table 6.4 Fresh Properties of ECC Link Slab – Phase One…………………… 79
Table 6.5 Restrained Shrinkage Test Parameters……………………………… 85
Table 6.6 Summary of Restrained Shrinkage Testing………………………… 87
Table 6.7 Mixing Proportions for ECC Link Slab – Phase Two……………… 90
Table 6.8 Statistical Parameters for Compressive and Tensile Testing of
ECC Link Slab – Phase Two……………………………………. 96
Table 6.9 Fresh Properties of ECC Link Slab – Phase Two…………………… 96
Table 6.10 Maximum Tensile and Compressive Stresses within the ECC Link
Slab and ECC Link Slab with Concrete Sidewalk Due to
Positive and Negative Moment Temperature Gradients and
Uniform Stresses………………………………………………... 105
Table 7.1 Summary of Sensing Transducers………………………………….. 115
Table 7.2 Axel Weights of Trucks Used For Load Testing…………………… 117
Table 7.3 Summary of Static Load Test Results………………………………. 130
Table 7.4 Summary of Static Load Test Results………………………………. 137

v
List of Figures
Figure 1.1 Uniaxial Tensile Response of ECC Material……………………….. 2
Figure 2.1 Schematic of Link Slab on Westbound I-496 Near Lansing, MI…… 7
Figure 2.2 Photograph and Schematic of Omni-mixer………………………… 12
Figure 2.3 ECC Large Scale Mixing Tensile Stress-Strain Curves……………. 13
Figure 2.4 Reliability of ECC Ultimate Strength and Ultimate Strain Values… 13
Figure 3.1 Stress-Strain Curve of ECC M45 and Idealized Elastic-Perfectly
Plastic Behavior………………………………………………… 18
Figure 3.2 Schematic Stress and Strain Distributions in a Cross Section of
(a) Reinforced Concrete (R/C) and (b) Reinforced ECC
(R/ECC) Link Slab……………………………………………… 19
Figure 3.3 Section Dimension Used in Non-linear Sectional Analysis………… 20
Figure 3.4 Discritization of the Stress Distribution in Non-linear Sectional
Analysis………………………………………………………… 21
Figure 3.5 Link Slab Reinforcement Ratio Design Chart……………………… 23
Figure 4.1 Optimal ad M45 Grain Size Distribution Curves…………………... 27
Figure 4.2 M45, Optimal, and M45-X Grain Size Distribution Curves……….. 28
Figure 4.3 Deformability Test Setup…………………………………………… 29
Figure 4.4 Completed Deformability Test……………………………………… 28
Figure 4.5 0.5 Inch and 0.33 Inch PVA Fiber………………………………….. 31
Figure 4.6 (a) Tensile Stress-Strain Response of M45 with 0.5” PVA Fiber….. 32
(b) Tensile Stress-Strain Response of M45 with 0.33” PVA Fiber… 33
Figure 4.7 Loss of Deformability f M45 ECC With and Without Hydration
Stabilizers………………………………………………………. 35
Figure 4.8 Effect of Hydration Stabilizers on Tensile Stress-Strain Response… 36
Figure 4.9 Manual Charging…………………………………………………… 41
Figure 4.10 Tower Charging……………………………………………………. 41
Figure 4.11 (a) Cement Balls Formed During Mixing………………………….. 42
(b) Close-up View of Cement Balls Formed During Mixing………. 42
Figure 4.12 Creamy ECC Mortar Matrix……………………………………….. 42
Figure 4.13 ECC Material in Mixer……………………………………………... 42

vi
Figure 4.14 Homogenous Matrix Material………………………………………. 45
Figure 4.15 Delivery of ECC to Jobsite…………………………………………. 45
Figure 4.16 Flowability of ECC versus Time…………………………………… 48
Figure 4.17 One Yard Flowability Test ( 1 hour)……………………………….. 48
Figure 4.18 Four Yard Flowability Test (5 minute)…………………………….. 48
Figure 4.19 Completed ECC Sculpture of UM North Campus – front view…… 50
Figure 4.20 Completed ECC Sculpture of UM North Campus – back view…… 50
Figure 4.21 Compressive Strength Gain of Large Scale ECC Trial Mixes
(Sorted by Trial)………………………………………………… 51
Figure 4.22 Compressive Strength Gain of Large Scale ECC Trial Mixes
(Sorted by Sample Time)…………………………………….. 52
Figure 4.23 (a) Tensile Stress Strain Response of One Cubic Yard Trail at
4 days…………………………………………………………… 53
(b) Tensile Stress Strain Response of One Cubic Yard Trail at
7 days…………………………………………………………… 54
(c) Tensile Stress Strain Response of One Cubic Yard Trail at
14 days…………………………………………………………. 54
(d) Tensile Stress Strain Response of One Cubic Yard Trail at
28 days…………………………………………………………. 55
Figure 4.24 (a) Tensile Stress Strain Response of Four Cubic Yard Trail at
4 days…………………………………………………………… 55
(b) Tensile Stress Strain Response of Four Cubic Yard Trail at
7 days…………………………………………………………… 56
(c) Tensile Stress Strain Response of Four Cubic Yard Trail at
14 days…………………………………………………………. 56
(d) Tensile Stress Strain Response of Four Cubic Yard Trail at
28 days…………………………………………………………. 57
Figure 4.25 (a) Tensile Stress Strain Response of Two Cubic Yard Trail at
4 days…………………………………………………………… 57
(b) Tensile Stress Strain Response of Two Cubic Yard Trail at
7 days…………………………………………………………… 58

vii
(c) Tensile Stress Strain Response of Two Cubic Yard Trail at
14 days…………………………………………………………. 58
(d) Tensile Stress Strain Response of Two Cubic Yard Trail at
28 days…………………………………………………………. 59
Figure 4.26 Schematic of Formwork Constructed to Verify Casting Potential
Of ECC…………………………………………………………. 60
Figure 4.27 ECC Pouring into Formwork………………………………………. 61
Figure 4.28 ECC Filling Formwork…………………………………………….. 61
Figure 5.1 Flowability Tests of ECC Using Substitute Material for
Submission Approval…………………………………………… 64
Figure 5.2 Compressive Strength Gain of ECC Using Substitute Material for
Submission Approval…………………………………………… 64
Figure 5.3 Representative Tensile Response of ECC Using Substitute
Material for Submission Approval……………………………… 65
Figure 5.4 Clawson Concrete Batching Plant in Scio Township, MI………….. 67
Figure 5.5 F-110 Silica Sand Batching Pile Outside Clawson Concrete………. 67
Figure 5.6 Charging Concrete Truck With Sand, Fly Ash, Cement, Water,
And High Range Water Reducer……………………………….. 67
Figure 5.7 Adding Fibers to Truck…………………………………………….. 67
Figure 5.8 Slump Cone Testing………………………………………………… 68
Figure 5.9 Slump Cone Measurement…………………………………………. 68
Figure 5.10 Placement of ECC in Demonstration Formwork…………………… 68
Figure 5.11 Screeding of ECC Surface………………………………………….. 68
Figure 5.12 Finished ECC Surface After Steel Troweling and Tining………….. 68
Figure 5.13 Close up of Finished ECC Surface After Steel Troweling and
Tining…………………………………………………………… 68
Figure 5.14 Representative Tensile Responses of ECC Demonstration Mixing… 69
Figure 5.15 Tensile Strength Development of ECC Demo Mixing Material…… 69
Figure 5.16 Tensile Strain Capacity Development of ECC Demo Mixing
Material…………………………………………………………. 70
Figure 5.17 Compressive Strength Development of ECC Demo Mixing

viii
Material…………………………………………………………. 70
Figure 6.1 Removal of Bituminous Asphalt Wearing Surface………………… 74
Figure 6.2 Exposed Steel Girders with Shear Studs Removed………………… 74
Figure 6.3 Painting of Girders After Installation of New Shear Connectors….. 74
Figure 6.4 Preparing Formwork for Placing of Convetional Deck Adjacent
To Each Side of ECC Link Slab……………………………….. 74
Figure 6.5 Completing Installation of Continuous Reinforcing Steel
Throughout ECC Link Slab……………………………………… 75
Figure 6.6 Shear Developers in Link Slab Transition Zone……………………. 75
Figure 6.7 Arrival of ECC Material in Concrete Mixing Truck……………….. 76
Figure 6.8 Placement of First Truck of EC Material at Link Slab Location…… 76
Figure 6.9 ECC Material Flowing Throughout Link Slab Confines…………… 76
Figure 6.10 Screeding of ECC Material to Final Surface Grade………………… 76
Figure 6.11 Hand Finishing of ECC Link Slab Riding Surface………………… 77
Figure 6.12 Representative Tensile Responses of ECC Link Slab – Phase One... 77
Figure 6.13 Tensile Strength Development of ECC Link Slab – Phase One……. 78
Figure 6.14 Tensile Strain Capacity Development of ECC Link Slab – Phase
One……………………………………………………………… 78
Figure 6.15 Compressive Strength Development of ECC Link Slab – Phase
One……………………………………………………………… 79
Figure 6.16 Cracking Within ECC Link Slab with Crack Width Approximately
0.007”…………………………………………………………… 82
Figure 6.17 Cracking in ECC Link Slab Around Sidewalk Reinforcing Steel…… 82
Figure 6.18 Cracking in ECC Link Slab with Crack Width 0.005” and
Spacing 8”……………………………………………………… 82
Figure 6.19 Cracking in ECC Link Slab Corner with Crack Width 0.005”…….. 82
Figure 6.20 Cracking in ECC Link Slab Cross Section at Reinforcing Steel
With Width 0.007” at Surface………………………………….. 83
Figure 6.21 Rebar Placement Within ECC Link Slab…………………………… 83
Figure 6.22 Diagram of Cracking in ECC Link Slab – Phase One……………… 83
Figure 6.23 Restrained Shrinkage Ring Test……………………………………. 85

ix
Figure 6.24 Restrained Shrinkage Ring Test with Crack Width Measurement
Microscope……………………………………………………… 85
Figure 6.25 Schematic of Large Restrained Shrinkage Test Setup……………… 88
Figure 6.26 Top View of Large Restrained Shrinkage Test Setup……………… 88
Figure 6.27 Corner View of Large Restrained Shrinkage Test Setup…………… 88
Figure 6.28 Shrinkage Specimen After 28 Days of Age………………………… 89
Figure 6.29 Completion of Stay-in-Place Formwork, Painting of Girders, and
Installation of New Shear Connectors………………………….. 91
Figure 6.30 Installation of Reinforcing Steel……………………………………. 91
Figure 6.31 Installation of Link Slab Formwork and Continuous Reinforcement
Throughout Link Slab and Adjacent Concrete Deck…………… 91
Figure 6.32 Shear Connectors Within Transition Zone and Debonding Layer…. 91
Figure 6.33 ECC Link Slab Transition Zone with Completed Adjacent
Concrete Deck………………………………………………….. 91
Figure 6.34 Placing of ECC Material at the Link Slab Location – Phase Two…. 93
Figure 6.35 Flowability of ECC Material Discharging from Truck…………….. 93
Figure 6.36 Placing of ECC Material at the Site – Phase Two………………….. 93
Figure 6.37 Screeding of ECC Link Slab Finished Surface…………………….. 93
Figure 6.38 Steel Trowel Finishing of ECC Link Slab Surface………………… 93
Figure 6.39 Tining of ECC Link Slab Riding Surface………………………….. 93
Figure 6.40 Representative Tensile Responses of ECC Link Slab – Phase Two.. 94
Figure 6.41 Tensile Strength Development of ECC Link Slab – Phase Two…… 94
Figure 6.42 Tensile Strain Capacity Development of ECC Link Slab – Phase
Two…………………………………………………………….. 95
Figure 6.43 Compressive Strength Development of ECC Link Slab – Phase
Two…………………………………………………………….. 95
Figure 6.44 Diagram of Cracking in ECC Link Slab – Phase Two……………... 98
Figure 6.45 Construction of Concrete Sidewalk and Barrier Wall……………… 99
Figure 6.46 Reinforcement Detailing Within Concrete Barrier Wall…………… 99
Figure 6.47 Expansion Joint Within Concrete Barrier Wall and Sidewalk……... 99
Figure 6.48 Completed Concrete Barrier Wall and Sidewalk…………………… 99

x
Figure 6.49 ECC Design Concept for Link Slab Made From Strain Hardening
Cementitious Composites………………………………………. 100
Figure 6.50 (a) Concrete Sidewalk and Barrier Wall Deforming Incompatibility
With ECC Link Slab Resulting in Localization of Cracking at
Ends of Link Slab or Under Concrete Expansion Joint………… 101
(b) Concrete Sidewalk and Barrier Wall Deforming Incompatibility
With ECC Link Slab Resulting in Distributed Cracking
Within the Concrete Sidewalk and Barrier wall………………... 101
Figure 6.51 ECC Link Slab with ECC Sidewalk and Barrier Wall……………… 103
Figure 6.52 ECC Link Slab wth Debonded Concrete Sidewalk and Barrier
Wall…………………………………………………………….. 103
Figure 7.1. (a) AASHTO HS25 truck loading………………………………....... 108 (b) 6-axel carting truck used during load testing…………………… 108
Figure 7.2 Details of the Half Width Bridge Section…………………………... 109
Figure 7.3 Transformed Half Width Bridge Section…………………………… 110
Figure 7.4 HS25-44 Axel Loading Profile……………………………………… 110
Figure 7.5 Simply Supported Beam Model…………………………………….. 110
Figure 7.6 Metal Foil Strain Gages Embedded in Link Slab
(a) Position Within the Link Slab…………………………………… 112
(b) Strain Mounted To a Reinforcement Bar Surface………………. 112
Figure 7.7 Instrumentation to Measure Link Slab Strain………………………. 113
(a) Position of Surface Strain Gauges………………………………. 113
(b) Instrumentation to Measure Link Slab Strain…………………… 113
Figure 7.8 (a) Linear Displacement Transducer Installation Location………… 116
(b) LVDT Mounted to Top of Girder 2 Web……………………….. 116
Figure 7.9 (a) Fully Assembled Wireless Sensing Unit Prototype…………….. 117
(b) Strain Gage Interface Circuit…………………………………… 117
Figure 7.10 Plan View of Bridge Span Loaded – Phase One.…………………... 118
Figure 7.11 (a) Transverse Truck Location of Test #1………………………….. 119
(b) Load Plan for Test #1……………………………………………. 119
Figure 7.12 Strain Response of Link Slab During Test #1……………………… 119

xi
Figure 7.13 (a) Transverse Truck Location for Test #2…………………………. 121
(b) Load Plan for Test #2……………………………………………. 121
Figure 7.14 Strain Response of Link Slab During Test #2……………………… 122
Figure 7.15 Plan View of Bridge Span Loaded – Phase Two…………………... 123
Figure 7.16 (a) Transverse Truck Location of Test #1…………………………… 124
(b) Load Plan for Test #1……………………………………………. 124
Figure 7.17 (a) Transverse Truck Location of Test #2…………………………… 125
(b) Load Plan for Test #2……………………………………………. 125
Figure 7.18 (a) Transverse Truck Location of Test #3…………………………… 126
(b) Load Plan for Test #3……………………………………………. 126
Figure 7.19 (a) Transverse Truck Location of Test #4…………………………… 127
(b) Load Plan for Test #4……………………………………………. 127
Figure 7.20 (a) Transverse Truck Location of Test #5…………………………… 128
(b) Load Plan for Test #5……………………………………………. 128
Figure 7.21 Determination of Beam Rotation Based on LVDT Readings……… 129
Figure 7.22 Test #1 Results
(a) LVDT Measurement………………………………………… 131
(b) Strain Gage Measurement………………………………….. 131
Figure 7.23 Test #2 Results
(a) LVDT Measurement………………………………………… 132
(b) Strain Gage Measurement………………………………….. 132
Figure 7.24 Test #3 Results
(a) LVDT Measurement………………………………………… 133
(b) Strain Gage Measurement………………………………….. 133
Figure 7.25 Test #4 Results
(a) LVDT Measurement………………………………………… 134
(b) Strain Gage Measurement………………………………….. 134
Figure 7.26 Test #5 Results
(a) LVDT Measurement………………………………………… 135
(b) Strain Gage Measurement………………………………….. 135
Figure 7.27 (a) SAP2000 Grove Street Beam Model……………………………. 136

xii
(b) Modeled Truck Loading………………………………………… 136
(c) Corresponding Bridge Response……………………………….. 136
Figure 8.1 Completed Grove Street Bridge – deck view………………………. 138
Figure 8.2 Completed ECC Link Slab…………………………………………. 138
Figure 8.3 Grove Street Pier Two Under Completed ECC Link Slab…………. 139
Figure 8.4 Completed Grove Street Bridge – elevation view………………….. 139

- 1 -
1.0 Introduction
1.1 Background
A majority of highway bridges within the United States are composed of multiple
span steel or prestressed concrete girders, which are simply supported at piers or bents.
These girders support cast-in-place concrete decks to from a composite bridge deck
system. A mechanical expansion joint was typically installed at the end of these simple
span decks to allow for deck deformations imposed by deflection, concrete shrinkage,
and temperature variations. These bridge deck joints are expensive to install and maintain,
and deterioration of joint performance can lead to severe damage of the bridge deck,
beam end, and substructure. The durability of beam ends, girder bearings, and supporting
structures can be compromised by water leaking and the flow of deicing chemicals
through the joints.
A possible approach to alleviate this problem is the elimination of mechanical
deck joints in multispan bridges. This has been proposed by a number of researchers
through the use of link slab elements within the bridge deck, which move expansion
joints off the bridge deck away from the piers thereby creating a continuous, and
therefore more durable, deck surface. The section of the deck connecting the two
adjacent simple-span girders is called the link slab. Caner and Zia (1998) experimentally
analyzed the performance of jointless bridge decks and proposed design methods for such
a link slab. These investigations showed that the link slab was subjected to bending loads
under traffic conditions. Tensile cracks were observed at the top of the link slab under
service conditions due to a negative moment. This work also concluded that additional
tensile stress may be imposed on the link slabs due to shrinkage, creep, and temperature
loading, and that crack widths must be carefully controlled. Recommendations were
made to use epoxy coated reinforcing bars in the link slab to avoid reinforcement
corrosion, along with reducing the stiffness of the link slab by debonding the link slab
from the girder near the joint for a length equal to 5% of each girder span. This link slab
concept can be used for new bridge decks and also for replacement of deteriorated joints
of existing bridge decks.

- 2 -
Figure 1.1 Uniaxial Tensile Response of ECC Material.
Engineered Cementitious Composites (ECC) are a high performance fiber
reinforced cementitious composite designed to resist tensile and shear forces while
remaining compatible with concrete in almost all other respects (Li, 2002). Figure 1.1
shows the uniaxial tensile response of an ECC reinforced with Polyvinyl Alcohol (PVA)
fiber. After first cracking, the composite undergoes plastic yielding and strain-hardening
to a tensile strain of 3.5% prior to developing a macroscopic crack. This tensile strain
capacity is about 350 times that of normal concrete (0.01%). ECC achieves strain-
hardening using only a moderate amount of fibers (typically 2% by volume) compared to
other high performance fiber reinforced concretes. This is particularly important for
practical field applications such as those examined in this report, where the mixing and
placing processes must be simple and similar to that used in mixing and placing of
conventional concrete. Based upon the superior performance of ECC materials in
tension-critical applications, the introduction of ECC into link slab construction will
likely lead to a highly durable bridge deck system.
0
100
200
300
400
500
600
700
800
900
1000
0 0.5 1 1.5 2 2.5 3 3.5
Strain, Π (%)
Stre
ss, σ
(PSI
)
Strain, ε (%)
0
100
200
300
400
500
600
700
800
900
1000
0 0.5 1 1.5 2 2.5 3 3.5
Strain, Π (%)
Stre
ss, σ
(PSI
)
Strain, ε (%)

- 3 -
1.2 Goal and Impact
The goal of this research is to complete the engineering design, construction, and
field testing of an ECC link slab as based on laboratory experiments conducted
previously. To achieve this goal a number of requirements must be met. These include
the authoring of detailed design guidelines, sample design drawings, material
specifications, and contractual special provisions. Additionally, the laboratory mixing
quantities and batching procedures must be scaled up and proven effective in large
commercial concrete plants. Once mixed, the construction of an ECC link slab can
proceed under the close supervision of research personnel. Finally, the completed bridge
must be load tested to quantify the impact of the link slab on overall bridge structural
performance.
The implementation of ECC link slabs for retrofitting simple span bridges is
expected to remedy a number of deterioration problems experienced by Michigan bridges,
particularly those related to deck joints. It is expected that the high resistance to cracking
in ECC and its ability to accommodate deformation imposed by shrinkage, thermal
variation, and live load will lead to crack free decks, effectively prolonging the life of
bridge decks while minimizing the cost and inconvenience to the motorist public of
periodic maintenance.
The research program is expected to significantly impact the aged infrastructure
locally and nationally. It directly addresses Item 2 (Methods to eliminate or improve
bridge joints) identified as focus areas beneficial to the Michigan Department of
Transportation (MDOT) in the document entitled “Strategic Research Program for Next
Five Years – Bridges and Structures”. This research also contributes to address Item 5
(Methods to increase life of bridge decks from 30 years to 75 years) and Item 7 (High
performance concrete). The cost effective, maintenance-free ECC link slab may greatly
improve the durability and service life of the country’s bridges.
1.3 Overview
In section two, the current implementation of link slabs within the State of
Michigan will be discussed and examined. This will form the basis of initial
implementation methods for ECC link slab technology. Due to the distinctly different

- 4 -
approach used for the design and construction of an ECC link slab, a number of design
guidelines, sample design drawings, material specifications, and contractual special
provisions were authored. These allowed for the completion of a link slab design by
Michigan Department of Transportation designers, and construction by a lowest-bidder
contractor. The ECC link slab design example is presented in section three while all
supporting documents and provisions are presented in appendices B through D.
In addition to the location and construction process of the link slab itself, the
scaling up of ECC mixing and batching technologies is critical to ultimate structural
performance. While the tensile response of ECC materials processed in the laboratory
has proven exceptional, there exist few large scale mixing applications worldwide and
none within the United States. These applications include the construction of the cable-
stayed Mihara Bridge in Hokkaido, Japan, the repair of a large earth retaining wall in
Gifu, Japan, and the repair of Mitaka Dam near Hiroshima, Japan. This portion of the
work will be discussed in section four. Following the scaling up process, construction
began with the approval of submittals, demonstration mixes by the general contractor and
materials supplier, and finally placing of the link slab in two phases due to partial-width
construction as will be detailed in sections five and six.
Finally, to validate the performance of the ECC link slab and to guarantee public
safety, a series of load tests using HS-25 equivalent truck loads were carried out. These
tests were essential to both calm the fears concerning the new material application, along
with giving the researchers a complete picture of the performance qualities of the in-situ
link slab. These load tests are highlighted in section seven. The overall conclusions of
the project are presented in section eight.

- 5 -
2.0 Literature Review of Current Link Slab Implementation
Current link slab design guidelines proposed by the Michigan Department of
Transportation (MDOT) are primarily based on investigations carried out by Zia et al
(1995) and Caner & Zia (1998) in conjunction with the North Carolina Department of
Transportation. This previous research was based on both theoretical analysis and
laboratory experiments of simple span bridges (both steel and prestressed concrete
girders) utilizing concrete link slabs to create jointless bridge decks. The complete
theoretical evaluation of these design guidelines for application to ECC link slabs can be
found in work preceding this field demonstration study (Li et al, 2003). The Caner and
Zia design procedure has been adopted by MDOT both for preliminary laboratory
investigations and field applications.
2.1 Current MDOT link slab design criteria Currently, MDOT designers have two link slab design examples authored by the
MDOT Construction and Technology Division for use by designers when designing link
slab structures. One example is for bridges constructed of steel girders and the other for
bridges constructed of prestressed concrete beams, but are quite similar in form. These
examples begin with a number of fixed design conditions. These fixed conditions are
mainly concerned with geometry of the existing bridge scheduled for retrofit with link
slabs.
1. Span length
2. Beam Spacing
3. Longitudinal gap between beams
4. Girder dimensions and material properties
5. Deck dimensions and material properties
Once the link slab location is selected and these preliminary inputs are
determined, the design of link slabs proceeds similarly for both steel and prestressed
concrete bridges. This design includes 8 major sequential steps to complete the design of
a concrete link slab in addition to additional design checks. These steps are shown below
for comparison to the ECC link slab design example included within section three.

- 6 -
1. Girder Distribution Factor (GDF)
2. Impact Load Factor
3. Length of link slab
4. Composite Moment of Inertia (Icomp)
5. Beam rotation due to deck dead load
6. Beam rotation due to live load
7. Moment induced due to beam rotation due to dead and live load
8. Check crack width criterion
In addition to these design calculations, there are a number of checks that the
designer must perform prior to completing the design.
1. The designer must verify that the existing abutments can withstand additional
thermal movement if all existing expansion joints are removed. If this is not the
case, the existing backwall must be replaced with a sliding backwall.
2. The designer must verify that the existing pier columns can withstand additional
thermal movement if all the existing expansion joints are removed.
3. Existing bearings must be checked to verify they can accommodate additional
movements.
4. For precast concrete bridge superstructures, the designer must evaluate the
existing beam ends to determine if they require end repair.
2.2 Current MDOT link slab implementation
Currently, eight concrete link slabs have been constructed by MDOT (Giliani and
Jansson, 2004). The two oldest are on northbound I-75 over 13 Mile Road in Madison
Heights, Michigan (S04 of 63147) and on westbound I-496 over I-96 east of Lansing,
Michigan (S02 of 23081). These structures experience average daily traffic (ADT) of
163,000 and 24,700 vehicles, respectively (MDOT, 2003). Both structures were designed
by MDOT engineers in 2001 and consequently built in late 2001 and 2002. Per site visits

- 7 -
performed by the investigators, both of these structures appear to be in good riding
condition, however both of these structures are currently only about two years old.
In the case of northbound I-75 in Madison Heights, Michigan the existing bridge
is constructed of prestressed concrete I-beams. This structure consists of 3 spans of 38’-
11” (Span 1), 63’-6” (Span 2), and 38’-11” (Span 3) joined by two 5’-0” long link slabs
joining spans 1 & 2 and spans 2 & 3. The 9 concrete girders are spaced transversely at
6’-4” and there is a 0º-00’-00” design skew angle. Overall work for this project included
deck replacement (night pours), widening of the traffic lanes, substructure repair, and
concrete beam end repair. Traffic was also maintained during the construction schedule.
To facilitate debonding of the link slab from the concrete girders, slab ties were removed
over the length of the link slab, and 2 layers of 6 mil plastic sheet were secured to the top
of the girders before pouring the link slab.
In the case of westbound I-496 near Lansing, Michigan the existing bridge is
constructed of steel plate girders (3’-6” deep). This structure consists of 4 spans of 36’-
3” (Span 1), 81’-6” (Span 2), 81’-6” (Span 3), and 34’-3” (Span 4). This bridge is
constructed of pin-and-hanger type construction with expansion joints located between
spans 1 & 2 and spans 3 & 4. The joint between spans 2 & 3 is a fixed-fixed joint over
the top of the center pier. This fixed-fixed joint is the location of the 8’-3” link slab
(Figure 2.1) The 6 steel plate girders are spaced transversely at 7’-9” and there is a 1º-
47’-45” design skew angle. Overall work for this project included deck replacement
(night pours), pin-and-hanger replacement, painting of existing structural steel, and
substructure patching repairs. Traffic was maintained during the course of partial width
construction. To facilitate debonding over the length of the link slab, existing shear
developers (studs) along the top of the plate girder were removed and ground smooth.
Two layers of 0.3lb/ft2 (30#) roofing paper was secured to the top flange of the beams.
Figure 2.1. Schematic of link slab on westbound I-496 near Lansing, Michigan.
EXP EXP FIX FIXFIX EXP EXP FIX
Span 1 Span 2 Span 3 Span 4 Link Slab Location

- 8 -
The other six concrete link slabs have all been built on steel girder bridges with
span lengths ranging from approximately 39 feet up to 82 feet. Of most note is the high
skew angle of one of these structures, I-94 under Harper Road (S15 of 82025)
constructed in 2001. The skew angle for this bridge is 45º. While the absence of truck
traffic on this structure does not allow us to discount the effect of high skew on link slabs
under heavy service loads, the adequate performance of this concrete link slab does
provide some insight into the effect of skew on the construction of the link slab. For the
Harper Road link slab, no construction sequencing was in place to minimize the dead
load moment on the link slab. Regardless, all cracking within the Harper Road link slab
remains below 0.004 inches, verifying that it is possible to construct a link slab at high
skew angles without the effect of the skew causing detrimental cracking during or shortly
after construction. Previous concerns regarding cracking due to torsional effects of high
skew angles during construction will likely be minimal for an ECC link slab as well.
While the monitoring report proposes a possible limit of 25 degrees on skew angles for
link slab bridge applications, this recommendation is based primarily on a lack of
knowledge of the performance of concrete link slabs at high skew angles and not based
on actual poor field performance of link slabs or theoretical calculations. Therefore,
construction of an ECC link slab on a highly skewed bridge, as is currently planned on
Grove Street over I-94 (S02 of 81063), may be unaffected by the skew angle.
In addition to the adequate performance of the Harper Road link slab, five others
(six out of eight in total) are noted as performing satisfactorily or better. Evaluation of
these link slabs is based both on crack density and maximum crack widths present within
the concrete link slab. On all six of these bridges, hairline cracks within the concrete
links slabs remain less than 0.004 inches wide. Of the two bridges which are not
performing satisfactorily, the cause of this poor performance is cited as likely being due
to improper design or construction. This poor performance leads directly to poor
serviceability and the need for increased maintenance of the link slab, and the overall
bridge. Poor performance of this nature completely negates the concept of the link slab,
which is to replace mechanical expansion joints which currently require frequent
maintenance. In all cases currently constructed within Michigan, it appears that the

- 9 -
serviceability failure mode (i.e. maximum crack width) supersedes the structural failure
mode (i.e. load resistance) within concrete link slabs.
The extent of cracking within concrete link slabs is very sensitive to the amount
of longitudinal reinforcing steel. If the improper amount of reinforcement is used, or
placed incorrectly, cracking in the link slab under service is likely, resulting in a
serviceability failure. This is due to the well known dependence of controlled crack
widths in reinforced concrete upon high reinforcement ratios to bridge traction-free
cracks and hold the crack widths tight. Historically, crack width criteria in both the
AASHTO (1998) and ACI (1995) design codes have depended upon high levels of
reinforcement to keep cracks widths small. Within the poorest performing MDOT
concrete link slab (S05 of 82025), it was found that the amount of longitudinal
reinforcing steel in place within the link slab was approximately 50% of what is required
for proper design. Due to this, the majority of crack widths within this link slab range
between 0.01 inches and 0.02 inches, far above the 0.004 inch serviceability limit. But
due to the linear strain distribution within the link slabs, the likelihood of these cracks
penetrating the full depth of the link slab is minimal, so the impact on serviceability of
the overall structures is somewhat diminished. Regardless, any cracks above the 0.004
inch limit can be considered a serviceability failure.
While the effect of improper design and placement of reinforcing steel within
concrete link slabs remains a large concern for their overall performance, this is not the
case within ECC link slabs. As noted in previous MDOT work (Li et al, 2004) crack
widths within ECC material are not a function of reinforcement ratio as in reinforced
concrete, but are rather an inherent material property similar to compressive strength or
elastic modulus. As reinforced concrete undergoes tensile deformation, there is a brief
initial period during which both the concrete and reinforcing steel deform compatibly in
an elastic nature prior to first cracking within the concrete. Following the formation of
the first crack, all subsequent tensile deformation is localized at this crack face, resulting
in a wider crack as the deformation increases. In ECC material, however, tensile
deformation is accommodated by numerous hairline cracks approximately 0.002 inches
wide. As tensile deformation increases, these cracks do not widen, but rather additional
microcracks form to “strain” the material. The maximum width of these cracks is a

- 10 -
function of the cementitious matrix, the fibers within the composite, and the interfacial
interaction between these two phases, rather than structural variables such as
reinforcement ratio or fiber volume fraction. Due to this unique response, nearly all
inadequacies within the design and construction procedure of ECC link slabs can be
overcome with an intrinsic material solution (i.e. inherently tight crack widths) rather
than intentional overdesign or careful design checks and intensive construction
inspection. While the need for proper design and construction of any structure cannot be
overstressed, the ability of ECC material to overcome any shortfalls within this process is
an additional source of safety for the designer, the owner, and the public.
A number of recommendations are made within the MDOT link slab report for
future construction of concrete link slabs.
1. Pay close attention to design and construction procedures of concrete
link slabs to ensure correct amount and spacing of longitudinal steel.
2. Develop a simpler design process (i.e. nomograph-based) for concrete
link slabs.
3. Do not terminate longitudinal reinforcement at the middle of the link
slab near the sawcut.
4. Specify pour sequence to minimize dead load moment within link slab.
5. Provide the transverse sawcut in a timely manner after construction.
6. Stagger any bar terminations and splices.
7. Place longitudinal bars on top of transverse bars.
8. Possible skew limit of 25 degrees on link slab applications.
Aside from the last recommendation, all of these concerns are accounted for in the
design and construction of an ECC link slab. The simple design process and inherent
material performance make the design and construction of ECC link slabs relatively
straightforward. Contrary to concrete link slabs, a transverse sawcut is not recommended
within an ECC link slab. Further, no longitudinal bars are terminated within an ECC link
slab, and all splices are staggered according to standard MDOT procedure. A pour
sequence limiting dead load moment is also required. Finally, it is recommended that

- 11 -
longitudinal bars are placed on top of transverse bars. Due to these improvements upon
current MDOT design and construction practice, in addition to the high performance of
the ECC material, the implementation of ECC link slabs looks to be a solution to not only
conventional joint maintenance, but also problems with concrete link slabs currently in
use.
2.3 Large scale mixing of ECC material
Some experimental research work has been done on large scale mixing of
engineered cementitious composites (ECC), but this work has progressed primarily in
Japan. Due to the major differences in construction practices between Japan and the
United States, little of the information gained from these investigations is directly
applicable to this project. However, this work may still give good insight into large scale
mixing processes for ECC material.
Investigations done by Kanda et al (2003) studied the tensile properties of ECC
material in full scale production. ECC compositions containing ordinary Portland cement
(OPC) and moderate-heat Portland cement were tested for large scale production at
ambient temperatures ranging from 63ºF to 68ºF (summer conditions) and 48ºF to 61ºF
(winter conditions). ECC test mixes were mixed at a precast plant using a 1.3 cubic yard
omni-mixer. This mixer can be considered a type of force based mixer which uses
external mixing paddles to deform a rubber mixing drum containing the cementitious
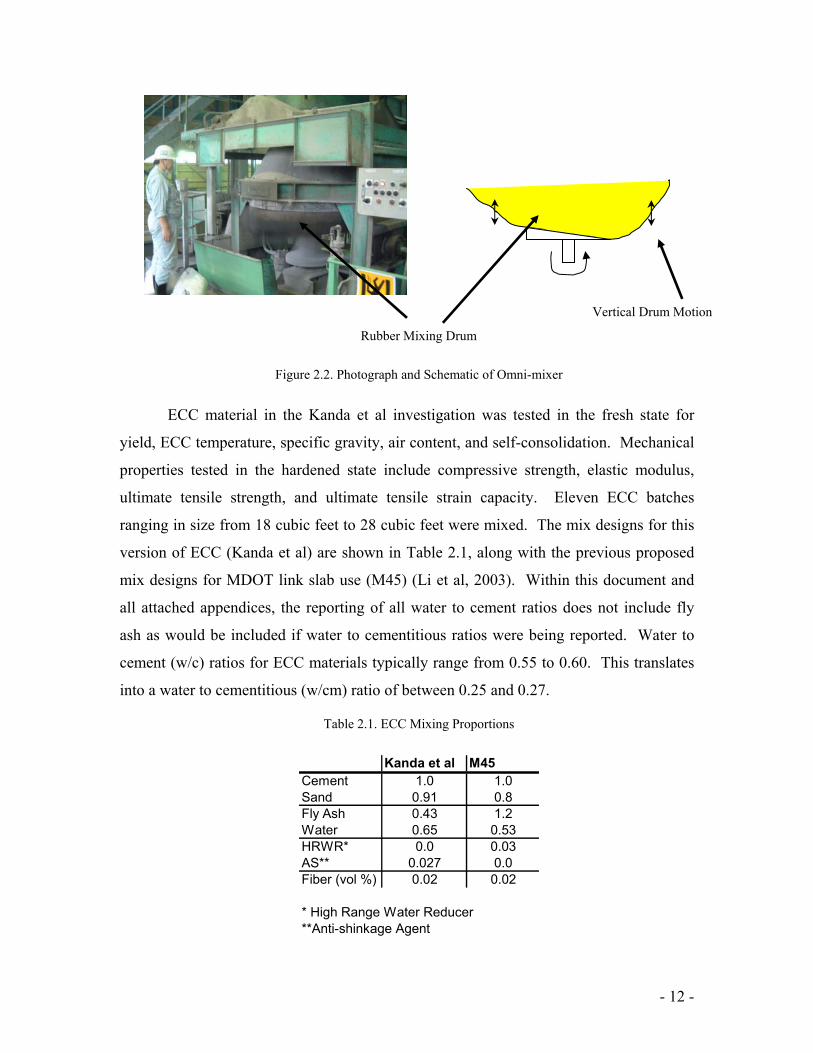
material. This is shown schematically in Figure 2.2. This mixing equipment is
substantially different than gravity mixers which rely mainly on gravity to mix a viscous
liquid (paddles within the rotating drum lift the material and agitate it by dropping the
material inside the drum). Typically, force based mixers are much more efficient in
achieving homogeneity within concrete mixes due to the high amount of mixing agitation.
While these are common at precast concrete plants, they are very uncommon on
construction sites. Typical construction site equipment uses gravity mixers due to their
portability, or in the case of concrete ready-mix trucks, screw based mixers.
- 12 -
Figure 2.2. Photograph and Schematic of Omni-mixer
ECC material in the Kanda et al investigation was tested in the fresh state for
yield, ECC temperature, specific gravity, air content, and self-consolidation. Mechanical
properties tested in the hardened state include compressive strength, elastic modulus,
ultimate tensile strength, and ultimate tensile strain capacity. Eleven ECC batches
ranging in size from 18 cubic feet to 28 cubic feet were mixed. The mix designs for this
version of ECC (Kanda et al) are shown in Table 2.1, along with the previous proposed
mix designs for MDOT link slab use (M45) (Li et al, 2003). Within this document and
all attached appendices, the reporting of all water to cement ratios does not include fly
ash as would be included if water to cementitious ratios were being reported. Water to
cement (w/c) ratios for ECC materials typically range from 0.55 to 0.60. This translates
into a water to cementitious (w/cm) ratio of between 0.25 and 0.27.
Table 2.1. ECC Mixing Proportions
Kanda et al M45Cement 1.0 1.0Sand 0.91 0.8Fly Ash 0.43 1.2Water 0.65 0.53HRWR* 0.0 0.03AS** 0.027 0.0Fiber (vol %) 0.02 0.02
* High Range Water Reducer**Anti-shinkage Agent
Rubber Mixing Drum
Vertical Drum Motion

- 13 -
Of most interest is the ultimate strain capacity of the trial mixes. Typical stress-
strain curves for these 11 ECC mixes are shown in Figure 2.3. Tensile coupon test
specimens had dimensions of 6.3” X 1.2” X 0.5” and were tested in uniaxial tension.
Shown in Figure 2.4 are the mean, standard deviation, and 96% lower limit confidence
interval for the tested ECC mixes. The TC results represent tensile coupon tests (6.3” X
1.2” X 0.5”) while TP results represent tests performed on tensile prisms with specimen
dimensions of 15.7” X 4” X 2.4” tested in uniaxial tension. While the tensile stress-
strain curves are similar to those for M45 ECC material proposed previously for MDOT
for link slab use, the 96% lower limit confidence interval shows an ultimate strain
capacity of only 1.3%, significantly lower than typically sought for the link slab
application. This concern will be addressed in full scale mixing tests for this field
demonstration.
Kanda et al concluded that full scale production of ECC is possible and the
material performance can be mechanically similar to that in the lab. Futher, the quality
control of ECC in large scale mixing can be controlled and confidence intervals can be
formed to statistically manage the performance of the material. In addition to this study,
additional work was done by Kanda et al (2003) using both gravity and omni-mixers to
process ECC material for spraying applications. The conclusions of that limited study
showed that mechanical performance of ECC was similar when produced using either an
omni-mixer or a ordinary concrete gravity mixer.
Figure 2.3. ECC Large Scale Mixing Tensile Stress- Strain Curves
Figure 2.4. Reliability of ECC ultimate strength and ultimate strain values

- 14 -
In focusing on the mix design and rheology of ECC materials, Fischer et al (2003)
have proposed a set of design procedures for processing and workability requirements.
The objective of this methodology is to optimize the grain size distribution of the various
ECC matrix components to produce a free-flowing mixture inside the mixing equipment,
and a self-consolidating material during placing. This concept relies heavily on
optimization of the combined grain sized distributions of all the matrix components and
achieving a highly dense and closely packed material matrix. This is analogous to
densely packed soils that are subject to liquifaction under earthquake vibration. Just as
these soils turn liquid under the slight aggitation of an earthquake, the fresh matrix of
closely packed, specifically graded particles easily liquifies from the agitation of a
concrete gravity mixer.
One historical gradation curve prone to liquefaction was determined by Fuller and
Thompson (1907). This gradation curve is shown as Equation 1.
Where,
fd = Fraction of Particles Smaller than d
d =Particle Size Smaller than d (in)
dmax = Maximum Particle Size (in)
Since the Fuller Curve (Equation 2-1) was developed, more optimal gradations
have been proposed (Ortega et al, 1999; Funk and Dinger, 1994). These new gradations
are the base of further optimization of fresh ECC for large scale mixing. To be discussed
in section 4.1, this approach builds the required mixing characteristics into the material,
rather than forcing modifications of mixing equipment.
5.0
maxd d
d100f
= Equation 2-1
- 15 -
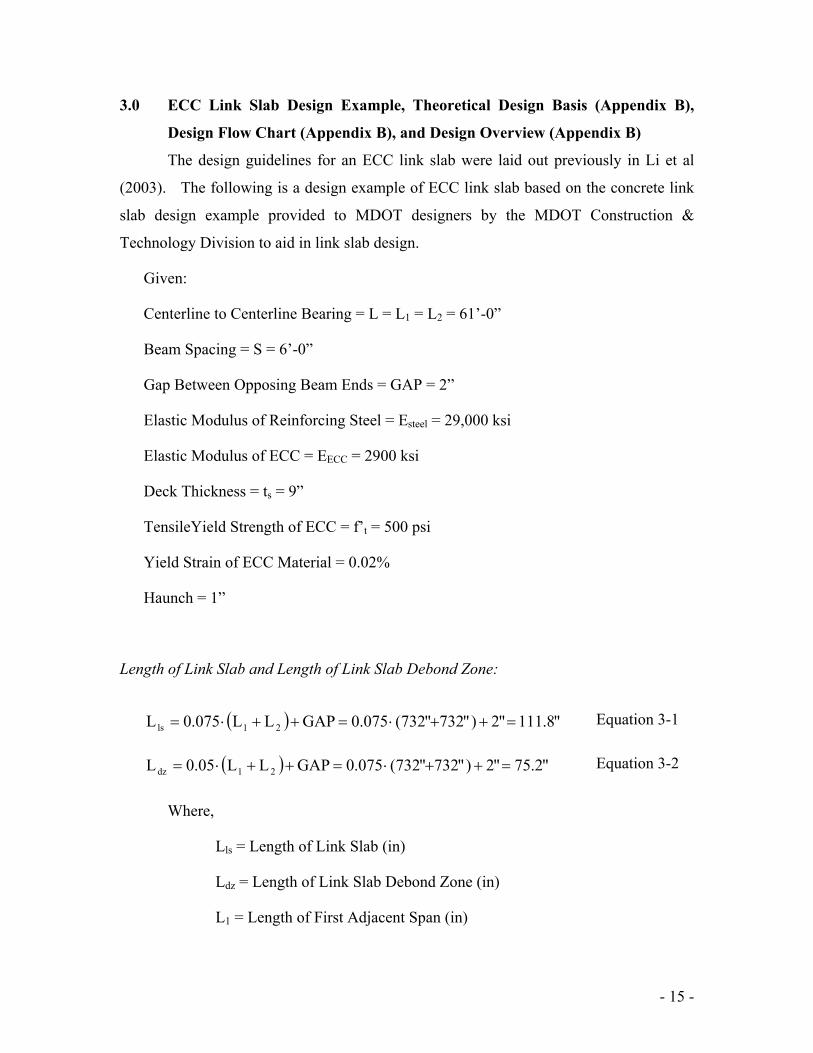
3.0 ECC Link Slab Design Example, Theoretical Design Basis (Appendix B),
Design Flow Chart (Appendix B), and Design Overview (Appendix B)
The design guidelines for an ECC link slab were laid out previously in Li et al
(2003). The following is a design example of ECC link slab based on the concrete link
slab design example provided to MDOT designers by the MDOT Construction &
Technology Division to aid in link slab design.
Given:
Centerline to Centerline Bearing = L = L1 = L2 = 61’-0”
Beam Spacing = S = 6’-0”
Gap Between Opposing Beam Ends = GAP = 2”
Elastic Modulus of Reinforcing Steel = Esteel = 29,000 ksi
Elastic Modulus of ECC = EECC = 2900 ksi
Deck Thickness = ts = 9”
TensileYield Strength of ECC = f’t = 500 psi
Yield Strain of ECC Material = 0.02%
Haunch = 1”
Length of Link Slab and Length of Link Slab Debond Zone:
Where,
Lls = Length of Link Slab (in)
Ldz = Length of Link Slab Debond Zone (in)
L1 = Length of First Adjacent Span (in)
( ) "8.111"2)"732"732(075.0GAPLL075.0L 21ls =++⋅=++⋅=
( ) "2.75"2)"732"732(075.0GAPLL05.0L 21dz =++⋅=++⋅=
Equation 3-1
Equation 3-2

- 16 -
L2 = Length of Second Adjacent Span (in)
End Rotation Angle of Adjacent Spans:
Where,
θmax = Maximum End Rotation Angle Imposed on Link Slab
θ = Acutal End Rotation Angle Imposed on Link Slab
∆max = Maximum Allowable Bridge Span Deflection (in)
∆ = Actual Bridge Span Deflection (in)
L = Bridge Span Length (in)
Determine Uncracked Moment of Inertia of Link Slab (per foot width of bridge deck):
Where,
Ils = Moment of Inertia of Link Slab (in4)
Bls = Transverse Width of Link Slab (in) (Assumed per foot width)
ts = Slab Thickness
θ∆
∆=θ max
max
800L
max =∆
rad00375.0L3
800L
L3
maxmax =
=
∆=θ
433
slsls in729
12)"9("12
12tBI =
⋅==
(AASHTO LRFD 2.5.2.6.2)
Equation 3-3
Equation 3-4
Equation 3-5
Equation 3-6

- 17 -
Determine the Moment Developed at θmax (per foot width of bridge deck):
Where,
Mls = Moment Induced in the Link Slab due to End Rotation (kip-in)
EECC = Elastic Modulus of ECC Material (ksi)
Ils = Moment of Inertia of Link Slab (in4)
Ldz = Length of Link Slab Debond Zone (in)
θmax = Maximum End Rotation Imposed on Link Slab
Determine Required Longitudinal Reinforcement Ratio:
The amount of reinforcement is calculated by non-linear sectional analysis. This
is based on the assumption that ECC material is elastic-perfectly plastic. While ECC
material typically does show some strain hardening characteristics after first cracking
(Figure 3.1), this phenomenon will not be relied upon for conservative design practice.
The “yield strain” of the ECC material is set to 0.02%. From a pool of tensile test
results, this value is chosen as a fair representative for the first cracking strain of ECC
M45 material. The “yield stress” of the ECC material is chosen to be 500psi. While the
actual ultimate strength is typically above this value, 500psi was again chosen as a fair
representative value from a pool of M45 tests. See Appendix A for statistical information
on assumed M45 design values.
inkip9.21000375.0"2.75
in729ksi29002L
IE2M4
maxdz
lsECCls ⋅=
⋅⋅=θ= Equation 3-7

- 18 -
As proposed by Caner and Zia (1998), a conservative working stress of 40% of
the yield strength of the reinforcment is used for design. Unlike the design assumptions
for concrete, in which no tensile force is carried by the concrete, a substantial stress of
500psi is assumed to be carried by the ECC up to failure between 3% and 4% strain.
Using non-linear sectional analysis, the moment capcity of the section can be computed
for any reinforcing ratio. The reinforcement ratio is then adjusted accordingly to resist
the moment due to maximum end rotation computed earlier (Equation 3-7). Figure 3.2
shows the cross sectional stress and strain distributions of a reinforced concrete link slab
(R/C) and a reinforced ECC link slab (R/ECC) (Li et al, 2003).
0
100
200
300
400
500
600
700
800
900
0 0.5 1 1.5 2 2.5 3 3.5 4
Strain, ε (%)
Stre
ss, σ
(MPa
)
ε = 0.02%
f’t = 500psi
Figure 3.1. Stress-Strain Curve of ECC M45 and Idealized Elastic-Perfectly Plastic Behavior
Stre
ss, σ
(PSI
)
Strain, ε (%)

- 19 -
Initially, a reinforcement ratio is selected.
(a)
(b)
Figure 3.2. Schematic Stress and Strain Distributions in a Cross Section of (a)
Reinforced Concrete (R/C) and (b) Reinforced ECC (R/ECC) Link Slab
Looking at the stress distribution for the reinforced ECC cross section, a simple
force balance is performed equating the compression forces and tension forces in the
section. The section dimensions used in this calculation are shown in Figure 3.3.
StrainSection Stress
N.A. ts
b
sε ss Eε
R/C
cε
StrainSection Stress
N.A. ts
b
sε ss Eε
R/C
cε
N.A.ts
StrainSection
b
Stress
sε
R/ECC
cε
ssEε
N.A.ts
StrainSection
b
Stress
sε
R/ECC
cε
ssEε

- 20 -
Figure 3.3. Section Dimension Used in Non-linear Sectional Analysis
The yield strain in the steel is assumed to be 0.08%. This is derived by taking
40% of the yield stress of the reinforcing steel and multiplying by the elastic modulus of
steel.
Knowing the yield strain (first cracking strain) of the ECC the yield strain ratio
can be determined, nε, to find the location of the kink in the tensile stress distribution.
To calculate the forces, the cross section is divided up into four regions. These
are schematically shown in Figure 3.4.
N.A.ts
Section
b
Stress
cd nεd
%08.0ksi000,29ksi604.0
steely =⋅
=ε −
25.0%08.0%02.0n
steely
ECCy ==ε
ε=
−
−ε
Equation 3-8
Equation 3-9

- 21 -
Figure 3.4. Discritization of the Stress Distribution in Non-linear Sectional Analysis
Computing the force for each of these four sections individually (per foot width of
deck)
Where,
Tsteel = Tension Force in Reinforcing Steel (kip)
fy-steel = Yield Strength of Reinforcing Steel (ksi)
ρ = Reinforcement Ratio
ts = Slab Thickness (in)
TECC-1 = Tension Force in ECC Section 1 (kip)
f’t = Design Tensile Strength of ECC (ksi)
N.A.
Stress Tsteel TECC-1 TECC-2 CECC
ssteelysteel t)f4.0(T ρ= −
( )cd)n1('fT t1ECC +−= ε−
dn'f21T t2ECC ε−
=
( )2stECC cdt
d1
n1'f
21C −−
=
ε
Equation 3-10a
Equation 3-10b
Equation 3-10c
Equation 3-10d

- 22 -
nε = Yield Strain Ratio
d = Distance from Neutral Axis to Centroid of Reinforcing Steel (in)
c = Distance from Tensile Face to Centroid of Reinforcing Steel (in)
TECC-2 = Tension Force in ECC Section 2 (kip)
CECC = Compression Force in ECC (kip)
To compute the section properties, the forces are balanced on each side of the
neutral axis.
Finally, to compute the moment capacity of the section, the moment of the four
forces is summed about the neutral axis.
Where,
M = Moment Resistance of the Link Slab (kip-in)
Once the moment resistance of the section is calculated for a particular
reinforcement ratio, if the resistance is less than the moment developed in the link slab
due to end rotation, Mls, a higher reinforcement ratio is selected. Since this process can
involve a number of iterations when determining the reinforcement ratio, a design chart
has been adapted from that given previously by Li et al (2003). This chart is shown as
Figure 3.5.
Assumptions in Design Chart:
Working Stress Factor = 40%
0CTTT ECC2ECC1ECCSteel =−++ −−
( ) )(32
32
21
21 cdHCdnTdncdnTdTM ECCECCECCsteel −−
+
+
⋅+
+−+⋅= −− εε
ε
Equation 3-10e
Equation 3-11

- 23 -
Yield Strain of Steel = 0.08%
Yield Strain of ECC = 0.02%
Yield Strength of Steel = 60 ksi
Yield Strength of ECC = 500 psi
Distance from Tensile Face to Centroid of Reinforcing Steel, c = 3”
Figure 3.5. Link Slab Reinforcement Ratio Design Chart
From previous calculations (Equation 3-7), the moment exerted on the link slab
due to end rotations is 210.9 kip-in per foot width of the bridge deck. For a deck
thickness of 9”, the corrsponding reinforcement ratio is 0.003.
Determine the required reinforcement spacing:
0
50
100
150
200
250
300
350
400
450
0 0.002 0.004 0.006 0.008 0.01 0.012 0.014 0.016
Reinforcement Ratio, ρ
Link
Sla
b M
omen
t Res
ista
nce
(Per
Foo
t W
idth
), ki
p-in
ts = 10”
ts = 9”
ts = 8”
ts = 7”
s
bar
tAsρ
= Equation 3-12

- 24 -
Where,
s = bar spacing (in)
Abar = Cross Sectional Area of Selected Bar Size (in2)
ρ = Calculated Reinforcement Ratio
ts = Slab Thickness (in)
Try #3 bars (Abar = 0.11in2) s = 4” (too small)
Try #5 bars (Abar = 0.31in2) s = 11” (selected)
Regardless of girder material (steel or prestressed concrete) the design procedure
is the same. While the overall treatment of the design may be slightly different between
the two scenarios (i.e. checking beam end conditions, construction methods), these must
be evaluated by the designer on a case by case basis. Due to the inherently small crack
width of ECC materials (the crack width in ECC is independent of steel reinforcement),
there is no need to additionally check any crack width criterion.
It must be noted that inherently assumed in this design example is a deck pour
schedule that places the ECC link slab last. This is due to the fact that the maximum end
rotation of the link slab is calculated using only the maximum allowable deflection under
live load (∆max = L/800). If the link slab is cast before all dead loads are applied to the
adjacent spans, the combined dead load end rotation and live load end rotation may
exceed the allowable 0.00375rad. To this end, care must be taken during construction to
place all dead loads on adjacent spans prior to ECC link slab casting.
In addition to the ECC link slab design example shown above, a number of
documents have been authored in order to aid MDOT design engineers in the design of
an ECC link slab. Among these documents are an extended ECC link slab design
example, which includes greater detail regarding the theoretical design assumptions made
during the design process. These additions to the extended design example were made

- 25 -
following recommendations made by the MDOT research advisory panel. This extended
design example is included in Appendix B. Additionally, at the request of the MDOT
research advisory panel, a flow chart was produced outlining the ECC link slab design
procedure along with a corresponding short overview of the design procedure, including
all necessary equations and checks for use as a quick reference for designers. These
supplemental design documents are also included in Appendix B.
In cooperation with MDOT Construction and Technology Division engineers and
designers, design calculations were completed and submitted for the Grove Street Bridge
ECC link slab (S02 of 81063), which is the structure selected for the ECC link slab
demonstration project. Along with the design calculations, sample details for
construction plan detailing of the ECC link slab were also prepared. These details show
the extents of the various portions of the ECC link slab, the detailing of shear connectors
with the ECC link slab transition and debond zones, the detailing of reinforcing steel, and
outlining of construction sequencing. The Grove Street Bridge design calculations and
the accompanying example ECC link slab detail are included as Appendix C.
To allow for letting of the construction documents, a special provision for use of
ECC material in MDOT projects was prepared. This special provision is included as
Appendix D. This special provision outlines the procuring of specific ECC component
materials (i.e. fibers, sand, admixtures), sample mix design parameters, minimum
material properties for acceptance, placement and curing procedures, along with quality
assurance procedures and testing schemes. This ECC special provision allows for the use
of ECC material not only in the link slab application, but will prove invaluable in the
incorporation of ECC material into future MDOT applications such as bridge and
pavement patching if proven advantageous.

- 26 -
4.0 Scaling of ECC Mixing Procedures for Large Infrastructure Applications
4.1 Grain Size Distribution Analysis
As mentioned from literature, prior to conducting large scale ECC mixing trials,
the fresh rheology of the mix may have to be further optimized to allow for the greatest
chance of success in large mixers. To achieve this rheology, an optimal grain size
distribution is required to promote a highly liquid fresh state while still in the mixing
equipment. In particular, the Alfred grain size distribution curve (Funk and Dinger,
1994) has been proven sucessful for this analysis. This grain size distribution is given as
Equation 4-1.
Where,
CPFT = Cummulative Percent of Particles Finer
D = Particle Diameter Size (in)
Ds = Diameter of Smallest Particle in Distribution (in)
DL = Diameter of Largest Particle in Distribution (in)
q = Distribution Modulus
From theory (Funk and Dinger, 1994), the optimal distribution is achieved with a
distribution modulus equal to 0.37. This idealized particle distribution is then compared
with the current M45 particle distribution to evaluate the performance and look for
improvements. This comparison is shown in Figure 4.1.
−−
= qs
qL
qs
q
DDDD100CPFT Equation 4-1

- 27 -
Figure 4.1. Optimal and M45 Grain Size Distribution Curves
From this analysis, it can be seen that the grain size distribution for M45 is quite
close, but not equivalent to the optimal solution. To take advantage of this, new versions
of ECC designated M45-X1, M45-X2, and M45-X3 were designed to more closely match
the optimal Alfred curve (i.e. “q” in equation 4-1 equal to 0.37). The mix proportions of
ECC M45 and all three M45-X series are given in Table 4.1. The grain size distribution
curves of M45, M45-X1, M45-X2, and M45-X3 are also shown in Figure 4.2. The fiber
used in each of these mixes is 0.33 inches long.
Table 4.1. ECC Mix Design Proportions for ECC M45 and M45-X
Mix Designation Cement Fly Ash Sand Water SP Fiber (vol%)M45 1.0 1.2 0.8 0.56 0.012 0.02M45-X1 1.0 1.2 1.2 0.58 0.012 0.02M45-X2 1.0 1.2 1.4 0.59 0.012 0.02M45-X3 1.0 1.2 1.6 0.60 0.012 0.02
0
20
40
60
80
100
120
0.1 1 10 100 1000
Particle Size (mil)
Nor
mal
ized
Par
ticle
Fra
ctio
n (%
)M45
Optimum (Andreasen)
4.0 40.0 0.4 0.04 0.004
q = 0.37

- 28 -
Figure 4.2. M45, Optimal, and M45-X Grain Size Distribution Curves
To evaluate the effect of this change in particle size distribution, a flowability test
is performed on the fresh ECC immediately after processing of the material. This test is
outlined in Kong et al (2003). To perform this test, a standard concrete slump cone is
filled with fresh ECC material and emptied onto a level Plexiglas or glass plate. The
flowable ECC material flattens into a large pancake-shaped mass. Two orthogonal
diameters of this “pancake” are measured and a characteristic flowability factor, denoted
by Γ, is calculated using Equation 4-2.
0
01
D)DD( −
=Γ Equation 4-2
Where,
Γ = Fresh ECC Deformability Factor
D1 = Average of two orthogonal “pancake” diameter measurements
D0 = Diameter of bottom of slump cone
Essentially, this Γ factor captures the overall deformability, or flowability, of the
material in the fresh state regardless of flow cone size and is therefore applicable to both
0
20
40
60
80
100
120
0.1 1 10 100 1000
Particle Size (mil)
Norm
aliz
ed P
artic
le F
ract
ion
(%)
M45Optimum (Andreasen)M45-X1M45-X2M45-X3
q = 0.37

- 29 -
standard size slump cones and the smaller ASTM designated flow cones for matrix
materials. The experimental setup and an example flowability “pancake” is shown in
Figure 4.3a and 4.3b respectively.
Figure 4.3a. Deformability test setup Figure 4.4b. Completed deformability test
As shown in Table 4.1, along with an increase in sand, the amount of water was
also increased correspondingly. If the water to cementitious ratio were not increased with
each increase of sand content, the flowability of the fresh ECC would be expected to drop
rapidly with each increase in sand proportion due to the inherently dry nature of the
mixture. To minimize the variables among the experimental mixes, the amount of
additional water was calculated to correspond approximately to the amount needed to
bring the additional dry sand to the saturated surface dry state.
The overall impact of changing the amount of sand is minimal over the
experimental mix designs investigated. The difference in Γ factors over M45, M45-X1,
and M45-X2 is not significant to draw any conclusions regarding any benefits of higher
sand content. Further, the mechanical performance in the hardened state (i.e. strain
capacity) does not alter significantly. These results are summarized in Table 4.2 (ranges
shown are standard deviation). Uniaxial tension tests were performed in accordance with
testing procedures outlined in the Special Provision for ECC Materials, included as
Appendix D in this report. Due to the lack of improvement with the increase of sand
content, it is recommended that the original M45 mix design be used for further large

- 30 -
scale mixing tests. Additionally, since this was the mix design, which was used for all
preceding experimental MDOT studies, the continual use of this standard mix design
minimizes any concern over mix design changes in this late stage of the demonstration
project.
Table 4.2. Fresh Deformability and Strain Capacity of ECC M45 and M45-X series (See Appendix D for
Uniaxial Tensile Testing Parameters)
Mix DesignationAverage
Diameter (in) ΓUltimate Tensile
Strain (%)No. of
SpecimensM45 35 ± 3 3.4 ± 0.4 2.9 ± 0.4 3M45 - X1 37 ± 4 3.6 ± 0.5 2.9 ± 0.5 3M45 - X2 33 ± 3 3.2 ± 0.4 2.7 ± 0.4 3M45 - X3 28 ± 3 2.5 ± 0.4 2.2 ± 0.6 3
4.2 Fiber Length Change
In addition to increasing the amount of sand to increase the flowability of the
material, a change of fiber length was also examined. The standard poly-vinyl-alcohol
(PVA) fibers which are used in ECC material measure 0.5 inches long and 1.5 mils in
diameter. After to the addition of fibers to the fresh matrix, a significant increase in
viscosity of the material is seen, as is completely expected. To help increase the
flowability of the fresh ECC material, shorter PVA fibers measuring 0.33 inches long and
1.5 mils in diameter were investigated. These fibers are identical in every way to the
longer fibers (i.e. fiber surface coating, chemical composition, strength, modulus) but
have an overall shorter length. Both the long and short fibers are shown in Figure 4.5.

- 31 -
Figure 4.5. 0.5 inch and 0.33 inch PVA fiber
In this investigation, both the fresh state flowabiltiy of the ECC material and the
hardened mechanical properties were considered. Prior to testing it was expected to see
an increase in the flowabiltiy of the fresh ECC material using the shorter fibers.
However, the hardened properties were not expected to change significantly. From the
micromechanical models used to develop ECC material, it can be shown that the critical
fiber length, or the fiber embedment length necessary to allow for adequate fiber pullout
and therefore strain hardening performance, is less than either the 0.25 inches or 0.165
inches (half of fiber length) provided by either the long or short PVA fibers. The longer
PVA fibers are typically used since they may provide a more robust ECC material when
high strain capacities are needed (i.e. greater than 3.5% strain), but since these high
strains are not needed for the link slab application, the change to a shorter fiber to
improve the fresh state properties was considered.
The short and long fibers were tested in the standard M45 mortar matrix. The mix
proportions of this material are shown in Table 4.1. In the fresh state, the flowability test
outlined previously and shown in Figure 4.4 was used to evaluate the material. The use
of the shorter 0.33 inch fibers showed a significant improvement in the flowability of the
fresh ECC material, improving the Γ factor from 3.0 to 3.4. This additional flowability
of the material should allow for easier mixing in large capacity mixers and easier
placement once on the construction site. Further, by exhibiting a higher initial
0.5 inch fiber 0.33 inch fiber

- 32 -
flowability, it is likely that the fresh ECC material with shorter fibers will maintain self-
consolidating properties longer without the use of large amounts of retarding admixtures.
To evaluate effect of shorter fibers on the hardened tensile properties of ECC, tensile
coupon tests were run according to uniaxial testing requirements in Appendix D on M45
specimens with short fibers for comparison to previous results using longer fibers. These
tests were run both at early age (10 days) and after full strength gain (28 days). As
shown in the Figure 4.6, the effect of shorter fibers is a slight decrease of ultimate strain
capacity from 3.1% to 2.8%. However, this small reduction is not a large concern since
the strain capacity of the ECC material is still far above the 2% minimum required by the
link slab application. All of the characteristic tensile material properties are summarized
in Table 4.3 (ranges shown are standard deviation). Ultimately, due to the mechanical
similarity between ECC composites using 0.5” and 0.33” fibers, the decision was made to
use 0.33” fibers to facilitate easier large scale mixing.
Figure 4.6a. Tensile stress-strain response of M45 with 0.5 inch PVA fiber
0
100
200
300
400
500
600
700
800
900
0 0.5 1 1.5 2 2.5 3 3.5 4
Strain, ε (%)
Stre
ss, σ
(psi
)
28 days 10 days

- 33 -
Figure 4.6b. Tensile stress-strain response of M45 with 0.33 inch PVA fiber
Table 4.3. Characteristic Tensile Material Properties for M45 – 0.5” and M45 – 0.33”
Mix Designation Age (days)Cracking
Strength (psi)Ultimate
Strength (psi)Ultimate Tensile
Strain (%)No. of
SpecimensM45 - 0.5" 10 550 ± 45 620 ± 70 3.3 ± 0.6 3M45 - 0.5" 28 640 ± 43 765 ± 50 3.1 ± 0.4 3M45 - 0.33" 10 515 ± 35 570 ± 55 2.9 ± 0.7 3M45 - 0.33" 28 575 ± 45 650 ± 75 2.8 ± 0.4 3
4.3 Hydration Stablizing Admixtures
As specified in the special provision for ECC material (Appendix D) the material
supplier is allowed one hour following batching to discharge the ECC material from the
truck at the jobsite. In the typical laboratory situation, due to the high cement content of
ECC material, the time during which the material is flowable and workable is on the
order of 20 minutes. Therefore, a retarding admixture is required to delay hydration and
extend the time to setting. A number of hydration retarders are available commercially,
and this instance two were selected for investigation. One is retarder is Delvo®
Stabilizer produced by Degaussa and the other is Daratard® 17 produced by W.R. Grace.
Within the special provision, the W.R. Grace retarder is mentioned specifically as a
potential admixture, however either of these commercial hydration stabilizers perform
equally as well.
0
100
200
300
400
500
600
700
800
900
0 0.5 1 1.5 2 2.5 3 3.5 4
Strain, ε (%)
Stre
ss, σ
(psi
)
28 days 10 days

- 34 -
There exist two major concerns with the use of a hydration stabilizer in ECC
material. The first is the ability of the stabilizer to adequately retard the hydration
process to allow for adequate time for deliver to the jobsite. Due to the high cement
content of ECC material, the dosage of the retarding admixture will be relatively high.
However, since these admixtures have proven very effective in nearly any concrete
application, their ability to retard the setting of ECC material is virtually guaranteed. Of
more concern is the effect of these chemical admixtures on the strain capacity of the
hardened ECC material. Due to the careful chemical tailoring of the interfacial region
between the PVA fibers and the mortar matrix within ECC, any chemical admixtures that
are added to the mix must be evaluated in the hardened state to be certain they do not
interfere with the composite tensile properties.
Dosages for both the Degaussa and W.R. Grace products in the testing series
followed the manufacturers recommendations. For both products, a range of dosage rates
is provided. As mentioned previously, ECC has a high cement content compared to
concrete, and therefore a high dosage rate within the specified range was used. In the
case of both Delvo® Stabilizer and Daratard® 17, the dosage rate was 5 fl oz/100lb of
ECC cementitious material. The addition of either hydration stabilizer resulted in a
significant increase in setting time, extending the fresh self-consolidating properties of
the ECC material beyond the one hour time limit specified in the special provision. The
development of flowability with respect to time is shown in Figure 4.7. The reported
average deformation diameter is the average of two orthogonal diameter measurements of
the “pancake” formed during flowability testing as outlined in section 4.1. The retarding
admixture tests were performed with M45 containing 0.33 inch fibers. As can be seen,
M45 without any retarding admixture exhibits a fairly rapid loss of self-consolidating
characteristics and after 30-35 minutes becomes unworkable. However, for both ECC
mixtures containing the Degaussa and W.R. Grace products, a high workability and self-
consolidating nature is exhibited beyond the one hour time limit.

- 35 -
Figure 4.7. Loss of Deformability of M45 ECC with and without hydration stabilizers
As mentioned, in addition to the fresh properties, the hardened tensile properties
were also examined. The tensile stress-strain curves for ECC mixtures containing both
the Degaussa and W.R. Grace retarders are shown in Figure 4.8 and summarized in Table
4.4 (ranges shown are standard deviation). As can be seen, there is no significant impact
on the tensile strain response of the composite with the addition of the retarders. Due to
this, it is recommended that a hydration stabilizer be used if the jobsite is farther than 30
minutes from the ECC batching plant, or in case the delivery may be delayed due to
traffic or jobsite congestion. According to the manufacturer’s directions, if additional
working time is deemed necessary, the dosage may be increased to further delay setting
time without any adverse effects on the composite. As described in section 4.8, one large
trial mix incorporated very high levels of hydration stabilizer to allow for greatly
extended working times. While this did have an effect on the early age mechanical
performance of the material, there were no lingering effects on the ECC performance (i.e.
after 7 days). Any recommendations the manufacturer may make regarding higher
dosages of hydration stabilizer can be applied to the composite mix design with
acceptable performance of ECC material to be expected.
0.00
5.00
10.00
15.00
20.00
25.00
30.00
35.00
40.00
0 20 40 60 80 100
Time, t (min)
Aver
age
Defo
rmat
ion
Diam
eter
, d (i
n)
M45 Degaussa
M45 W.R. Grace
M45

- 36 -
Figure 4.8. Effect of hydration stabilizers on tensile stress-strain response
Table 4.4. Characteristic Tensile Material Properties for M45 with Degaussa and W.R. Grace Stabilizers
Mix Designation Age (days)Cracking
Strength (psi)Ultimate
Strength (psi)Ultimate Tensile
Strain (%)No. of
SpecimensM45 - 0.33" 28 575 ± 45 650 ± 75 2.8 ± 0.4 3M45 (Degaussa) 28 590 ± 65 660 ± 70 3.05 ± 0.5 3M45 (W.R. Grace) 28 570 ± 50 645 ± 75 2.9 ± 0.5 3
4.4 Batching Sequence – Laboratory Findings
To scale the batching of ECC material up from small laboratory mixers into large
gravity or screw mixers, the sequence of mixing must be optimized to promote the best
homogeneity of the material when discharging the material from the concrete truck. In a
typical laboratory setting, during which force-based mixers are commonly used, all of the
dry components of the matrix (cement, fly ash, and sand) are initially added and mixed
together. Following a complete blending of these materials, the water is slowly added to
gradually turn the mixture more liquid. After the majority of the water is added, a high
range water reducer (superplasticizer) is added, along with the remaining water. Finally,
the fibers are slowly added and dispersed throughout the mixture. The overall mixing
sequence lasts between 10 and 15 minutes.
0
100
200
300
400
500
600
700
800
900
0 0.5 1 1.5 2 2.5 3 3.5 4
Strain, ε (%)
Stre
ss, σ
(psi
)
Degaussa W.R. Grace
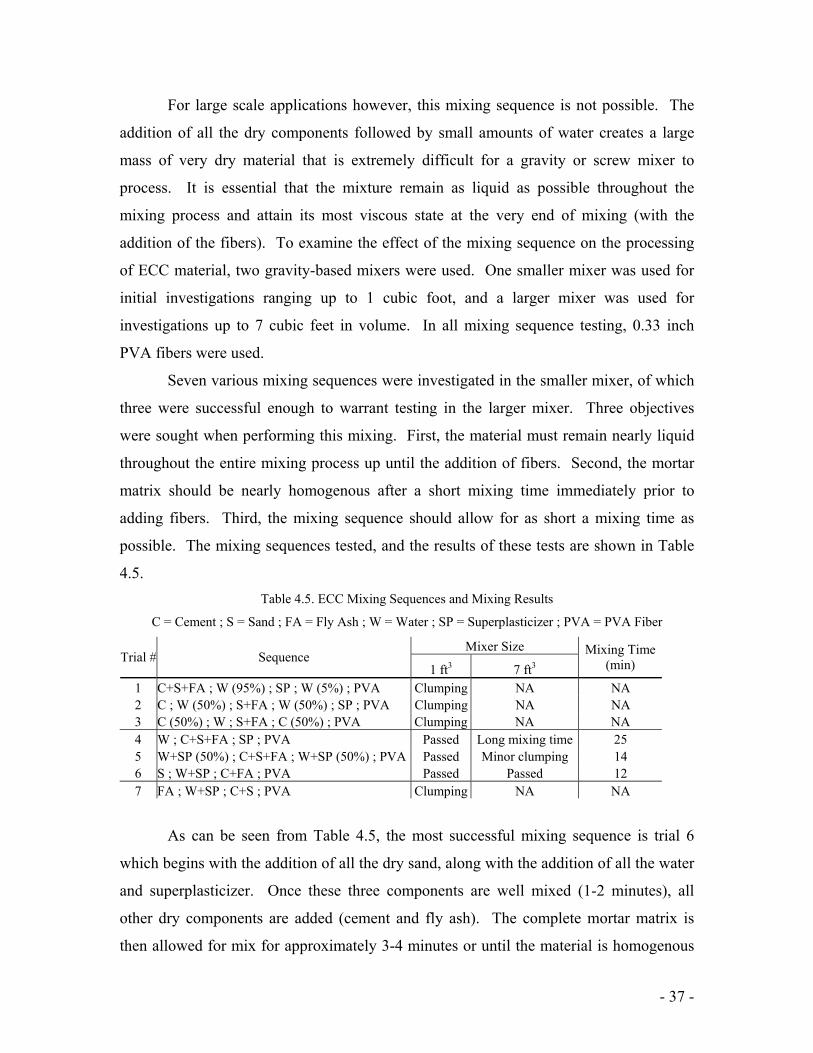
- 37 -
For large scale applications however, this mixing sequence is not possible. The
addition of all the dry components followed by small amounts of water creates a large
mass of very dry material that is extremely difficult for a gravity or screw mixer to
process. It is essential that the mixture remain as liquid as possible throughout the
mixing process and attain its most viscous state at the very end of mixing (with the
addition of the fibers). To examine the effect of the mixing sequence on the processing
of ECC material, two gravity-based mixers were used. One smaller mixer was used for
initial investigations ranging up to 1 cubic foot, and a larger mixer was used for
investigations up to 7 cubic feet in volume. In all mixing sequence testing, 0.33 inch
PVA fibers were used.
Seven various mixing sequences were investigated in the smaller mixer, of which
three were successful enough to warrant testing in the larger mixer. Three objectives
were sought when performing this mixing. First, the material must remain nearly liquid
throughout the entire mixing process up until the addition of fibers. Second, the mortar
matrix should be nearly homogenous after a short mixing time immediately prior to
adding fibers. Third, the mixing sequence should allow for as short a mixing time as
possible. The mixing sequences tested, and the results of these tests are shown in Table
4.5. Table 4.5. ECC Mixing Sequences and Mixing Results
C = Cement ; S = Sand ; FA = Fly Ash ; W = Water ; SP = Superplasticizer ; PVA = PVA Fiber
Mixer Size Trial # Sequence
1 ft3 7 ft3 Mixing Time
(min)
1 C+S+FA ; W (95%) ; SP ; W (5%) ; PVA Clumping NA NA 2 C ; W (50%) ; S+FA ; W (50%) ; SP ; PVA Clumping NA NA 3 C (50%) ; W ; S+FA ; C (50%) ; PVA Clumping NA NA 4 W ; C+S+FA ; SP ; PVA Passed Long mixing time 25 5 W+SP (50%) ; C+S+FA ; W+SP (50%) ; PVA Passed Minor clumping 14 6 S ; W+SP ; C+FA ; PVA Passed Passed 12 7 FA ; W+SP ; C+S ; PVA Clumping NA NA
As can be seen from Table 4.5, the most successful mixing sequence is trial 6
which begins with the addition of all the dry sand, along with the addition of all the water
and superplasticizer. Once these three components are well mixed (1-2 minutes), all
other dry components are added (cement and fly ash). The complete mortar matrix is
then allowed for mix for approximately 3-4 minutes or until the material is homogenous

- 38 -
and sufficiently liquid. After this mortar mixing time, the fibers are simply added
gradually into the mixture and the complete ECC composite is mixed for an additional 5-
6 minutes or until the fibers are well dispersed throughout the composite. This mixing
sequence results in an overall mixing time between 9 and 12 minutes, which should be
adequate for field applications. However, adjustments can be made in the field if other
sequences are found more practical.
4.5 Mixing Plant Site Visit
In anticipation of large scale mixing, a site visit was conducted to the ready mix
concrete provider, which will be assisting in the large scale mixing of ECC in this project.
Brighton Block and Concrete was chosen as an excellent provider for this material.
Further, Brighton Block and Concrete is an MDOT approved concrete material provider.
Tours were conducted of the batching facilities, storage facilites, and dispatch facilities.
Proactive troubleshooting conversations held with Brighton Block and Concrete
employees yielded a number of concerns with batching ECC from a commercial concrete
plant.
1. Short working time due to high cement content.
Possible Solution: Using a retarding agent to increase setting time.
2. Clumping of cement due to high cement content.
Possible Solution: Careful addition of water and superplasticizer
simultaneously at the batching plant, along with adding most of the sand
before cement.
3. Fibers clumping mix during transit.
Possible Solution: Adding fibers onsite prior to discharging the mix, and
mixing vigorously to disperse the fibers
4.6 Batching Sequence – Field Findings
Large scale mixing in concrete trucks was completed in cooperation with
Brighton Block and Concrete. This MDOT approved redi-mix concrete supplier, based

- 39 -
in Brighton, Michigan, has agreed to allow the use of concrete mixing trucks for batching,
mixing, and discharging of ECC material.
As directed in the special provision for ECC materials, fine graded sand, PVA
fibers, ASTM C150 Type I cement, Type F Normal fly ash, water, polycarboxylate
superplasticizer, and a retarding admixture were initially batched according to the
provided mix design parameter within the ECC special provision. The batching sequence
progressed identical to that used for the largest laboratory mixes, and is shown in Table
4.6. The elapsed time shown in the table is the recommended time for execution of each
of these activities at the time of batching.
Table 4.6. Large Scale ECC Batching Sequence Times
ActivityElapsed
Time (min)1. Charge all sand 22. Charge portion of mixing water, all HRWR, and all hydration stabilizer 23. Charge all fly ash 24. Charge all cement 25. Charge remaining mixing water to wash drum fins 46. Mix at high speed RPM for approximately 5-10 minutes or until material is homogenous 57. Bring flowable ECC material to top of mixing drum 28. Charge fibers and mix at high RPM for approximately 5-10 minutes or until material is homogenous 5
Total 24
As was expected, with the absence of large aggregate to agitate the materials
within the mixing drum, a significant amount of mixing time is needed between charging
of the matrix materials and the fibers. This 5-10 minutes of mixing time provides
significant agitation and time for the large quantity of superplasticizer to liquefy the
material. It is suggested that this mixing time may take place in transit, and once having
arrived at the site, the material be brought to the top of the drum, visually inspected for
homogeneity, and fibers added. The fibers are then mixed into the matrix (at high RPM)
onsite. Within the ECC special provision, a time of one hour is allowed between
charging at the concrete plant and full discharge of the material. This hour begins at the
addition of the final portion of the mixing water (Activity 5 in Table 4.6).

- 40 -
4.7 Large Scale Trial Mixes
Large scale mixes proceeded after long lead times for both material purchasing
and coordination with a material supplier. Further, it was found to be more realistic to
conduct these trials in warmer summer weather, similar to conditions that may be
encountered during a summer construction project using ECC material. Three large scale
trial mixes of one, two, and four cubic yards were planned. The one yard trial mixing
was conducted on April 8, 2005, the four yard trial was conducted on April 18, 2005, and
the final large scale trial mix, two yards in volume, was completed in cooperation with
Brighton Block and Concrete on Friday, April 22, 2005. The conditions on both one
cubic and four cubic yard days were sunny, with high temperatures of 62º F and 77 ºF for
each mix, respectively. Conditions for the two yard mix were a light rain with
temperatures between 45ºF and 50ºF. The three trials were initially intended to progress
in order of increasing size, but due to the possibility of using the four yard mix material
for an outside project with a limited time schedule, the two and four yard trial schedules
were switched.
4.7.1 One Cubic Yard Trial
With the incorporation of a number of raw materials not typically stored in
concrete batching towers within Michigan (i.e. fine silica sand, Type F fly ash) into the
mix, it was not practical to charge the concrete mixing truck from the charging tower
during the large scale mixing trials. Therefore, the sand, fly ash, fibers, and admixtures
were manually charged into the batching funnel (Figure 4.9) according to the batching
sequence (Table 4.6), while cement and mixing water were charged using the batching
tower (Figure 4.10). While this does not exactly duplicate the charging times expressed
in Table 4.6, this scenario was as close as possible to reality. The initial batching was
done according to the batch weights set forth in Table 4.7. These mixing weights do not
exactly reflect those in Appendix D (ECC Special Provision) as the mixing weights in the
special provision incorporate all mix design changes adopted throughout construction
phases of this demonstration project.

- 41 -
Table 4.7. Large Scale Trial ECC Mixing Proportions and Batching Weights
Material Proportion Amount (lbs/cyd)Cement 1.0 974Water 0.59 563Fly Ash 1.20 1169Sand 0.80 779HRWR 0.014 13.6Fiber (vol %) 0.02 43.8Stabilizer - 1cyd trial 0.006 5.4Stabilizer - 4cyd trial 0.013 12.4Stabilizer - 2cyd trial 0.008 8.1
During the one yard mixing trial, a number of initial hurdles were overcome. One
such example occurred during the mixing stage due to significant clumping of the cement
into impermeable balls within the matrix material after addition of fly ash and cement and
2-3 minutes of high speed mixing (Figure 4.11a & 4.11b).
Figure 4.9. Manual Charging Figure 4.10. Tower Charging
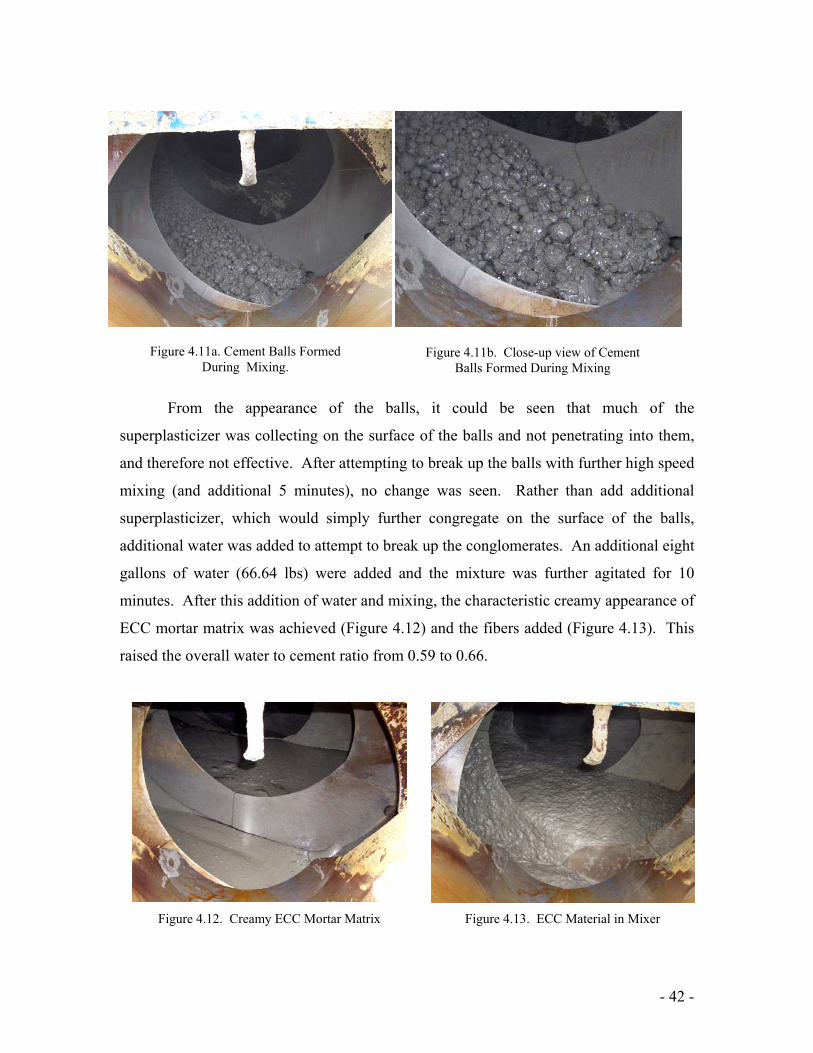
- 42 -
From the appearance of the balls, it could be seen that much of the
superplasticizer was collecting on the surface of the balls and not penetrating into them,
and therefore not effective. After attempting to break up the balls with further high speed
mixing (and additional 5 minutes), no change was seen. Rather than add additional
superplasticizer, which would simply further congregate on the surface of the balls,
additional water was added to attempt to break up the conglomerates. An additional eight
gallons of water (66.64 lbs) were added and the mixture was further agitated for 10
minutes. After this addition of water and mixing, the characteristic creamy appearance of
ECC mortar matrix was achieved (Figure 4.12) and the fibers added (Figure 4.13). This
raised the overall water to cement ratio from 0.59 to 0.66.
Figure 4.11a. Cement Balls Formed During Mixing.
Figure 4.11b. Close-up view of Cement Balls Formed During Mixing
Figure 4.12. Creamy ECC Mortar Matrix Figure 4.13. ECC Material in Mixer

- 43 -
One likely reason for the need of this addition of water may be due to the fact that
at the beginning of mixing, the concrete mixing drum was dry. The initial wetting of the
drum face and fins takes water from the ECC material, requiring additional overall water
for mixing and hydration. Wetting the surfaces of large concrete drum requires a
significant amount of water. While this addition of water may be of some concern, of
most importance is the ability of the mortar matrix to exhibit the proper viscosity for
effective dispersion of the fibers during mixing, allowance for proper placement and
finishing of the ECC material at the job site, and ultimately the mechanical performance
(i.e. strength and strain capacity) of the hardened material. Further, in later trials the
drum will be pre-wetted to ensure that no water is absorbed in this fashion.
As was noted by the staff at Brighton Block and Concrete, the appearance and
fresh properties of ECC are remarkably different than that of concrete. Their
inexperience with this material often lead them to doubt the quality of the material in the
fresh state, and ultimately its mechanical ability in service. Due to this reason, it is
apparently critical to have the concrete/ECC material provider well trained in the mixing
of ECC material. First hand knowledge of the fresh properties necessary to achieve
adequate fiber dispersion is of utmost importance. Along with this is needed the
experience in knowing what alterations can be made to the ECC mixture to allow for
proper processing without compromising mechanical performance. The experience
learned from large scale mixing reinforces the requirement within the ECC special
provision that “The Contractor will appoint a technical representative capable of making
adjustments to the batching and mixing of ECC material. This representative should be
familiar with the mixing, batching, and placement of ECC material.”
Following the charging of the truck and final mixing of the material a high speed
to fully homogenize the ECC, the drum was rotated at low speed for one hour to simulate
travel time to the jobsite. During this time, the fresh properties of the material were
evaluated every 15 minutes to determine the degradation of flowability over time.
Further, compressive cylinder and uniaxial tension plates were cast at the same 15 minute
time intervals to determine any change in hardened material performance over this one
hour of mixing time.

- 44 -
4.7.2 Four Cubic Yard Trial
A number of lessons which were learned in the first mixing trial were put into
practice for the second trial. Foremost among these lessons was the pre-wetting of the
drum prior to the initiation of mixing. Due to the lack of use of the truck used before the
first mix trial, the drum was allowed to completely dry before the trial. Having just
returned from another delivery, the truck used for the four yard trial, while completely
empty, had wet fins and drum sides. As was done in the one yard trial, batching of the
four yard trial proceeded with the addition of sand, the majority of mixing water (90%),
admixtures (i.e. high range water reducer, hydration stabilizer) Type F fly ash, cement,
and finally the balance of the mixing water. In this case, only 10% of the mixing water
was reserved for the final charging rather than 20% as was done for the one yard trial.
The intent of this water is to be used for washing of all dry matrix materials off of the
drum fins and down into the truck. For the one yard mix, reserving 20% of the mixing
water resulted in roughly 16 gallons for washing purposes. However, for the four yard
mix this would have given nearly 60 gallons for washing. This was deemed excessive
and the reserved mixing water was reduced to 10%, or roughly 30 gallons of water. As
batch sizes grow, this percentage may be reduced even further. It is recommended, to
keep the size of this reserved mixing water reasonable, that for a full truckload of ECC
material (assumed to be approximately 8 cubic yards) only 5% of the mixing water needs
to be reserved for drum washing.
Using the same mixing scheme as shown in Table 4.6, and the same mixing
proportions as shown in Table 4.7, an acceptable fresh material resulted. This required
no additional water, or additional admixtures. The four yard trial mix showed excellent
fresh properties, including fiber dispersion, flowability, and homogeneity as shown in
Figure 4.14. The material mixed for the four cubic yard test was also used in the
fabrication of an architectural focal element on the University of Michigan’s North
Campus (Figure 4.15). This project location in Ann Arbor, Michigan is roughly 30
minutes driving time from the batching plant in Brighton, Michigan. This project gave a
good indication of the behavior of the ECC material after transport and slow mixing for
an extended period of time.

- 45 -
Staggered within the transport and placement of the ECC material, flowability
tests were conducted to determine the degradation of fresh properties of the material, as
was done for the one yard trial mix. These results of these tests are presented in section
4.8. Further, compression cylinders were cast and were evaluated at 4, 7, 14, and 28 days
after casting to determine the ultimate strength and rate of strength gain over time along
with uniaxial tension testing plates.
4.7.3 Two Cubic Yard Trial
As was done in the previous two large scale trials, the raw materials within ECC
not typically kept in the commercial plant charging tower were charged by hand. Similar
to before, the sand, fly ash, fibers, and admixtures were manually charged into the
batching funnel according to the previously outlined batching sequence, while cement
and mixing water were charged using the batching tower. Batching was done according
to the weights shown in Table 4.6. The ECC material mixed in this trial was used to
complete the sculpture on the University of Michigan’s North Campus and delivered in a
similar fashion as the four yard trial mix.
Once again, 10% of the mixing water was reserved for washout purposes. This
amounted to approximately 15 gallons of water for the two yard load. During the course
of washing, all 15 gallons of this reserve water were added back into the truck. This
amount was recorded using the water gauge on the truck itself.
As in the four yard trial, a number of lessons which were learned in the previous
mixing trials were put into practice. One such lesson learned from the four yard trial was
Figure 4.14. Homogeneous matrix material Figure 4.15. Delivery of ECC to jobsite

- 46 -
a more appropriate dosage of hydration stabilizers for ECC material. Following
conversations with the manufacturer, it was decided that dosages for hydration stabilizer
should be based on only a portion of the total amounts of cementitious material per cubic
yard. Due to the large amount of fly ash within ECC material, as compared with concrete,
dosing based upon the full quantity of cementitious materials results in very high dosages
of hydration stabilizer. The effect of these high dosages was observed in the four yard
trial setting times and early age strength gain. Therefore, for the two yard trial, the
dosage was reduced and based only upon the cement content per cubic yard within the
ECC material. Using this dosage, a reasonable working time was achieved, while early
age compressive strength gains were not excessively delayed as was seen in the four
cubic yard trial. Additionally, the batching sequence was slightly altered to charge water
into the truck first, followed by silica sand. This changes the sequence such that the first
two mixing materials were switched. No negative effects were seen during the mixing
process. Therefore, as long as the both the sand and water are in the mixing drum prior to
cement and fly ash, successful processing of the material can be accomplished.
As mentioned previously, the ECC material mixed during both the four yard and
two yard trial mixes was brought back to Ann Arbor for casting of a free standing
sculpture on the University of Michigan’s North Campus. During the four yard trial mix,
the ECC material was checked for homogeneity and overall consistency before leaving
the batching plant in Brighton, Michigan. Upon arrival at the job site, a small amount of
high speed mixing was performed and the material was discharged from the truck.
However, the homogeneity of the material had degraded from the batching plant
condition. Fiber bundles had started to form and the overall consistency of the material
was degraded. Therefore, during the two yard trial the material was mixed at high speed
for 3-5 minutes on site before discharge to fully homogenize the material and break up
any fiber clumping. The result of this additional mixing was a final product which more
closely resembled the conditions at the batching plant, and laboratory grade ECC material.
As done previously, staggered within the transport and placement of the ECC
material, flowability tests were conducted to determine the degradation of fresh
properties of the material, as was done for the one and four yard trial mixes. These
results of these tests are presented below. Further, compression cylinders were cast and

- 47 -
were evaluated at 4, 7, 14, and 28 days after casting to determine the ultimate strength
and rate of strength gain over time along with uniaxial tension testing plates.
4.8 Evaluation and Testing of Fresh Properties
As required by the ECC link slab special provision, upon completion of the
mixing the material for both large scale trials was evaluated for “fiber dispersion,
flowability, and mixture rheology.” Fiber dispersion is evaluated through visual
inspection and random sampling of the material to look for pockets or conglomerates of
unmixed matrix materials or fiber bundles. As mentioned previously, in its most
desirable state, the texture of ECC material has a flowing, smooth, creamy viscosity.
Overall mixture rheology is evaluated in much the same way by an experienced
individual examining the homogeneity of the complete material, ensuring that the
material has not segregated.
Quantitative evaluation of the fresh ECC is done through flowability testing of the
material. This is test utilizes a standard concrete slump cone which is filled with
material. Once the cone is removed, the highly flowable material forms a “pancake”. As
stipulated in the special provision, this pancake must form a minimum average diameter
of 30 inches throughout the one hour of mixing time that is allowed. As also allowed by
the provision, a hydration stabilizer was used to help meet this requirement. The results
of flowability tests for both large scale trials conducted thus far are shown in Figure 4.16,
along with the flowability test results from a laboratory mix of ECC M45, which did not
include the hydration stabilizer.

- 48 -
Figure 4.16. Flowability of ECC vs. Time
For the one cubic yard large scale mixing trial, it can be seen that initially the
material meets the flowability requirement of 30 inches. However, after approximately
35 minutes of mixing the deformability falls below this minimum (Figure 4.17). This
indicated a slight change in the dosage of retarder was needed in future large scale mixes.
As it was a cooler morning (62ºF), the amount of retarder for the one yard trial was
reduced within the trial mix to 5.4 lbs/cyd (4 fl oz per 100 lbs cement), which was
Figure 4.17. One yard flowability test (1 hour)
Figure 4.18. Four yard flowability test (5 minute)
0.00
5.00
10.00
15.00
20.00
25.00
30.00
35.00
40.00
0 20 40 60 80 100
Time, t (min)
Aver
age
Def
orm
atio
n D
iam
eter
, d
M45 (Lab)
M45 (1 cyd)
M45 (4 cyd)
M45 (2cyd)
(in)
0.00
5.00
10.00
15.00
20.00
25.00
30.00
35.00
40.00
0 20 40 60 80 100
Time, t (min)
Aver
age
Def
orm
atio
n D
iam
eter
, d
M45 (Lab)
M45 (1 cyd)
M45 (4 cyd)
M45 (2cyd)
(in)

- 49 -
reduced from 6.8 lbs/cyd (5 fl oz per 100 lbs cement) as specified by manufacturer’s
literature as to not delay the setting of the material any more than necessary. Smaller
scale work performed previously on 7 ft3 batches of ECC showed acceptable flowability
with slightly lower retarder dosage rates well past 90 minutes of mixing time. However,
due to more controlled laboratory settings, these mixes started with a deformation
diameter above 35 inches. Ultimately, the first one cubic yard trial did not meet the
minimum flowability of 30 inches for the required one hour after batching. In subsequent
large scale mixes, the amount of retarder was adjusted to achieve the necessary initial
flowability to maintain high liquidity throughout the one hour of mixing time.
Following new recommendations from the manufacturer made for dosage rates of
5 fl oz of stabilizer for every 100 lbs of cementitious material in ECC (due to the high
proportion of fly ash within ECC as compared to normal concrete) the stabilizer
proportion was raised to 12.4 lbs/cyd for the second large scale trial. Likely due to the
improved control of net mixing water (i.e. a pre-wetted mixing drum), the four yard trial
mix initially exhibited a flowability deformation diameter of 36 inches (Figure 4.18).
This was significantly higher than the 32 inches exhibited by the one yard trial batch, and
showed good promise for meeting the minimum flowability throughout the one hour
mixing time. This high flowability was maintained, likely attributable to the higher
stabilizer dosage, throughout the required mixing time, and well past the mandatory one
hour, even considering it was a significantly warmer day (77º F).
Of considerable note is the fact that due to a number of difficulties in casting the
architectural work at U of M (i.e. poor construction of formwork, etc.), the ECC material
was required to stay in a workable, flowable state for up to 3 hours after initial batching.
While controlled testing of fresh properties of the four cubic yard mix was concluded at
90 minutes, the fresh properties of the material were closely observed long after that time
limit. At an age of approximately 90 – 120 minutes, the overall fresh state of the material
began to change. After this time, clumping of fibers begins to develop, along with
formation of small pockets of hardened material. This may likely be due both to the
increased number of mixing rotations within the mixing truck, in addition to the initial
signs of setting. However, this observation is primarily academic in nature, as the
contractor is allowed only one hour after batching to completely discharge the ECC

- 50 -
material at the job site. No problems of fiber dispersion or signs of initial setting were
observed within this time limit.
For the two cubic yard mix, a dosage rate of 8.1 lbs/cyd (6 fl oz per 100 lbs of
cement) was used. This is only slightly higher than manufacturer’s recommendations to
account for the large amount of fly ash used within ECC materials. As seen in Figure
4.16, this dosage provided an adequate working time and remained above the minimum
30 inch specified spread for the 1 hour time limit.
The final appearance of the architectural element cast with the trial ECC material
mixes is shown in Figures 4.19 and 4.20. Due to the small cross sections (i.e. a
continuous 4” thick wall), it was impossible to create this sculpture with traditional
reinforced concrete materials. Further, due to the demanding flowability requirements as
a result of the casting process, a traditional fiber reinforced concrete could not be used.
The superior performance of ECC materials in both the fresh and hardened state made the
realization of this artwork possible.
4.9 Evaluation and Testing of Hardened Properties
Testing of hardened ECC from large scale mixing trials consisted of both
compressive testing of standard cylinders and uniaxial tension testing of prescribed plate
specimens. All testing was performed in accordance with the ECC special provision for
this link slab project (Appendix D).
Figure 4.19 Completed ECC sculpture of UM North Campus – front view
Figure 4.20 Completed ECC sculpture of UM North Campus – back view

- 51 -
4.9.1 Compression Testing
During each of the large scale trials, a series of twelve cylinders were cast of
ECC materials. For both the four yard trial and two yard trial, 4” x 8” cylinders were
used rather than the 6” x 12” cylinders used for the one yard trial. Of these twelve
cylinders, three were cast immediately after initial batching, three more after 30 minutes,
and the final six after 1 hour of mixing. This series of cylinders allows for not only an
evaluation of compressive strength gain over time, but also insight into any differences in
the material which may exist over the one hour of mixing time.
Figure 4.21. Compressive Strength Gain of Large Scale ECC Trial Mixes (Sorted by Trial)
Table 4.8. Statistical Parameters of Compressive Testing (Sorted by Trial)
Trial Age (days) Average Strength (KSI) Standard Deviation (KSI) No. of Samples4 4.73 0.438 37 7.56 0.513 314 9.18 0.451 328 9.78 0.478 34 3.193 0.641 37 7.947 0.295 314 8.760 0.368 328 9.05 0.286 3
4 5.267 0.225 37 7.102 0.478 314 8.830 0.326 328 9.105 0.397 3
1 cyd
4 cyd
2 cyd
0.00
2.00
4.00
6.00
8.00
10.00
12.00
0 5 10 15 20 25 30
Age, d (days)
Com
pres
sive
Str
engt
h, f'
c (K
1cyd
2cyd
4cyd
Com
pres
sive
Str
engt
h, f’
c(K
SI)
0.00
2.00
4.00
6.00
8.00
10.00
12.00
0 5 10 15 20 25 30
Age, d (days)
Com
pres
sive
Str
engt
h, f'
c (K
1cyd
2cyd
4cyd
Com
pres
sive
Str
engt
h, f’
c(K
SI)

- 52 -
Figure 4.22. Compressive Strength Gain of Large Scale ECC Trial Mixes (Sorted by Sampling Time)
Compressive tests were performed on one cylinder from each time group (i.e.
immediately after batching, 30 minute, and 60 minute sample groups) on all four of the
predetermined testing days (i.e. 4 days, 7days, 14 days, 28 days). The results from
compressive tests are shown in Figure 4.21, along with a standard ECC M45 compressive
strength development curve for comparison. Statistical data is shown in Table 4.8.
As seen, the strength gain of the trial mix material is similar to that of the
laboratory material. Ultimately, the large scale mixing material shows a compressive
strength of between 9ksi and 10ksi, close to laboratory grade material. The average
strength of the material after 4 days of curing is of important note. Within the ECC
special provision, heavy equipment is not allowed on the link slab until after 4 days of
curing, and even then not until the specified 28-day strength of the material has been
achieved. With a required 28-day strength of 4.5ksi, the large scale trail ECC material
passes this requirement after 4 days for two of the three mixes, allowing for faster
construction scheduling and contractor cost savings. The primary reason for the four
yard trials not passing this mark is the overdose of hydration stabilizer mentioned earlier.
It can also be seen from Figure 4.22 that although the specimens from each trial
were cast at a different time during the required one hour of mixing time, there is similar
variation in compressive strength gain. Therefore, regardless of how long the material
mixes within the truck, as long as it is discharged before the one hour time limit has
0
2
4
6
8
10
12
0 5 10 15 20 25 30
Age, d (days)
Com
pres
sive
Str
engt
h, f'
c (K
5-15 Min
30 Min
60 Min
Com
pres
sive
Str
engt
h, f’
c(K
SI)
0
2
4
6
8
10
12
0 5 10 15 20 25 30
Age, d (days)
Com
pres
sive
Str
engt
h, f'
c (K
5-15 Min
30 Min
60 Min
Com
pres
sive
Str
engt
h, f’
c(K
SI)

- 53 -
expired, good confidence can be held in the hardened mechanical properties of the
material.
4.9.2 Uniaxial Tension Testing
Uniaxial tension plates were also cast during the one hour of large scale mixing.
Eight plates were cast at each time interval of 5-15 minutes, 30 minutes, and 60 minutes.
Two plates from each sampling time (six from each trial mix) are tested at an age of 4
days, 7 days, 14 days, and 28 days. This testing scheme is very similar to the
compressive strength scheme in that it not only gives good insight into the tensile
behavior of the large scale trial material over time, but also a good comparison of the
material throughout the mixing time. Representative tensile test curves for each of the
sample times (i.e. 5-15 minutes, 30 minutes, and 60 minutes) are shown at an age of 4, 7,
14, and 28 days in Figures 4.23 – 4.25. Statistical variation and analysis of the results are
shown in Table 4.9.
Figure 4.23a. Tensile Stress Strain Response of One Cubic Yard Trial at 4 Days
0
100
200
300
400
500
600
700
800
900
1000
0 0.5 1 1.5 2 2.5 3 3.5
Strain,? (%)
15 Min
30 Min
60 Min
Stre
ss, σ
(PSI
)
Strain, ε (%)
0
100
200
300
400
500
600
700
800
900
1000
0 0.5 1 1.5 2 2.5 3 3.5
Strain,? (%)
15 Min
30 Min
60 Min
Stre
ss, σ
(PSI
)
0
100
200
300
400
500
600
700
800
900
1000
0 0.5 1 1.5 2 2.5 3 3.5
Strain,? (%)
15 Min
30 Min
60 Min
Stre
ss, σ
(PSI
)
Strain, ε (%)

- 54 -
Figure 4.23b. Tensile Stress Strain Response of One Cubic Yard Trial at 7 Days
Figure 4.23c. Tensile Stress Strain Response of One Cubic Yard Trial at 14 Days
0
100
200
300
400
500
600
700
800
900
1000
0 0.5 1 1.5 2 2.5 3 3.5
Strain, Η (%)
15 Min
30 Min
60 Min
Stre
ss, σ
(PSI
)
Strain, ε (%)
0
100
200
300
400
500
600
700
800
900
1000
0 0.5 1 1.5 2 2.5 3 3.5
Strain, Η (%)
15 Min
30 Min
60 Min
Stre
ss, σ
(PSI
)
0
100
200
300
400
500
600
700
800
900
1000
0 0.5 1 1.5 2 2.5 3 3.5
Strain, Η (%)
15 Min
30 Min
60 Min
Stre
ss, σ
(PSI
)
Strain, ε (%)
0
100
200
300
400
500
600
700
800
900
1000
0 0.5 1 1.5 2 2.5 3 3.5
Strain, (%)
15 Min
30 Min
60 Min
Stre
ss, σ
(PSI
)
Strain, ε (%)
0
100
200
300
400
500
600
700
800
900
1000
0 0.5 1 1.5 2 2.5 3 3.5
Strain, (%)
15 Min
30 Min
60 Min
Stre
ss, σ
(PSI
)
0
100
200
300
400
500
600
700
800
900
1000
0 0.5 1 1.5 2 2.5 3 3.5
Strain, (%)
15 Min
30 Min
60 Min
Stre
ss, σ
(PSI
)
Strain, ε (%)

- 55 -
Figure 4.23d. Tensile Stress Strain Response of One Cubic Yard Trial at 28 Days
Figure 4.24a. Tensile Stress Strain Response of Four Cubic Yard Trial at 4 Days
0
100
200
300
400
500
600
700
800
900
1000
0 0.5 1 1.5 2 2.5 3 3.5
Strain, (%)
15 Min
30 Min
60 Min
Stre
ss, σ
(PSI
)
Strain, ε (%)
0
100
200
300
400
500
600
700
800
900
1000
0 0.5 1 1.5 2 2.5 3 3.5
Strain, (%)
15 Min
30 Min
60 Min
Stre
ss, σ
(PSI
)
0
100
200
300
400
500
600
700
800
900
1000
0 0.5 1 1.5 2 2.5 3 3.5
Strain, (%)
15 Min
30 Min
60 Min
Stre
ss, σ
(PSI
)
Strain, ε (%)
0
100
200
300
400
500
600
700
800
900
1000
0 0.5 1 1.5 2 2.5 3 3.5
Strain, (%)
15 Min
30 Min
60 Min
Stre
ss, σ
(PSI
)
Strain, ε (%)
0
100
200
300
400
500
600
700
800
900
1000
0 0.5 1 1.5 2 2.5 3 3.5
Strain, (%)
15 Min
30 Min
60 Min
Stre
ss, σ
(PSI
)
0
100
200
300
400
500
600
700
800
900
1000
0 0.5 1 1.5 2 2.5 3 3.5
Strain, (%)
15 Min
30 Min
60 Min
Stre
ss, σ
(PSI
)
Strain, ε (%)

- 56 -
Figure 4.24b. Tensile Stress Strain Response of Four Cubic Yard Trial at 7 Days
Figure 4.24c. Tensile Stress Strain Response of Four Cubic Yard Trial at 14 Days
0
100
200
300
400
500
600
700
800
900
1000
0 0.5 1 1.5 2 2.5 3 3.5
Strain, (%)
15 Min
30 Min
60 Min
Stre
ss, σ
(PSI
)
Strain, ε (%)
0
100
200
300
400
500
600
700
800
900
1000
0 0.5 1 1.5 2 2.5 3 3.5
Strain, (%)
15 Min
30 Min
60 Min
Stre
ss, σ
(PSI
)
0
100
200
300
400
500
600
700
800
900
1000
0 0.5 1 1.5 2 2.5 3 3.5
Strain, (%)
15 Min
30 Min
60 Min
Stre
ss, σ
(PSI
)
Strain, ε (%)
0
100
200
300
400
500
600
700
800
900
1000
0 0.5 1 1.5 2 2.5 3 3.5
Strain, (%)
15 Min
30 Min
60 Min
Stre
ss, σ
(PSI
)
Strain, ε (%)
0
100
200
300
400
500
600
700
800
900
1000
0 0.5 1 1.5 2 2.5 3 3.5
Strain, (%)
15 Min
30 Min
60 Min
Stre
ss, σ
(PSI
)
0
100
200
300
400
500
600
700
800
900
1000
0 0.5 1 1.5 2 2.5 3 3.5
Strain, (%)
15 Min
30 Min
60 Min
Stre
ss, σ
(PSI
)
Strain, ε (%)
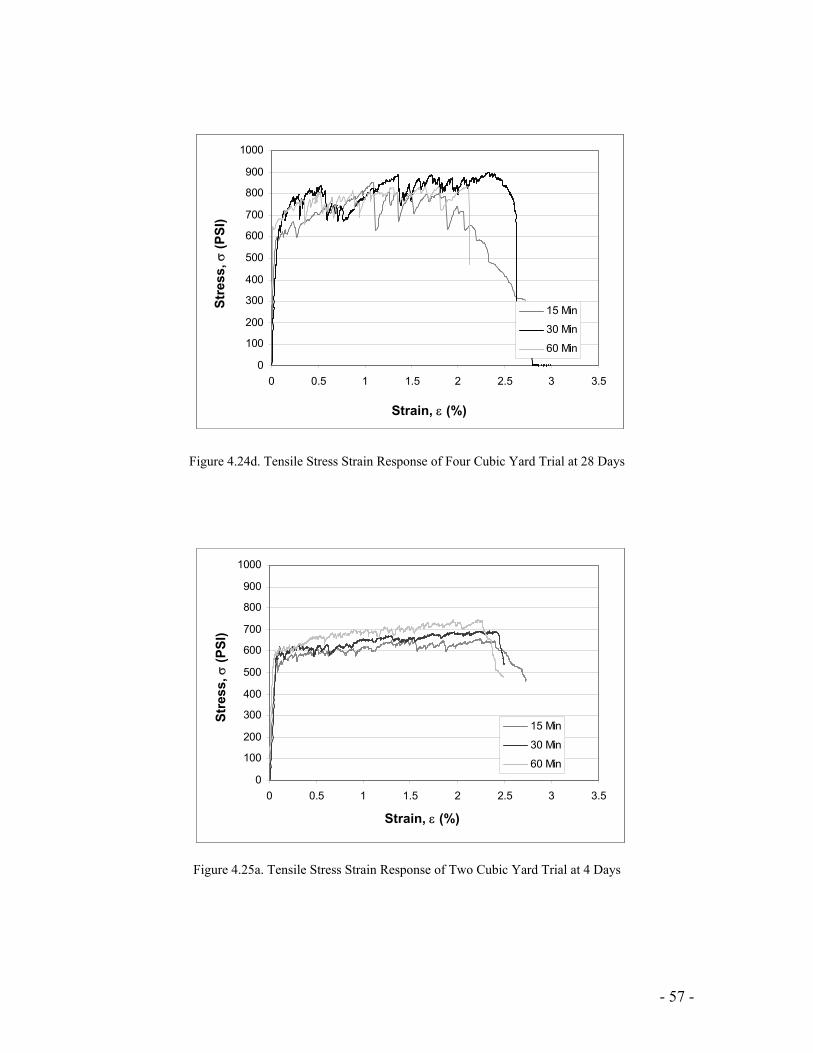
- 57 -
Figure 4.24d. Tensile Stress Strain Response of Four Cubic Yard Trial at 28 Days
Figure 4.25a. Tensile Stress Strain Response of Two Cubic Yard Trial at 4 Days
0
100
200
300
400
500
600
700
800
900
1000
0 0.5 1 1.5 2 2.5 3 3.5
Strain, ∪ (%)
15 Min
30 Min
60 Min
Stre
ss, σ
(PSI
)
Strain, ε (%)
0
100
200
300
400
500
600
700
800
900
1000
0 0.5 1 1.5 2 2.5 3 3.5
Strain, ∪ (%)
15 Min
30 Min
60 Min
Stre
ss, σ
(PSI
)
0
100
200
300
400
500
600
700
800
900
1000
0 0.5 1 1.5 2 2.5 3 3.5
Strain, ∪ (%)
15 Min
30 Min
60 Min
Stre
ss, σ
(PSI
)
Strain, ε (%)
0
100
200
300
400
500
600
700
800
900
1000
0 0.5 1 1.5 2 2.5 3 3.5
Strain,≅ζ (%)
15 Min
30 Min
60 Min
Stre
ss, σ
(PSI
)
Strain, ε (%)
0
100
200
300
400
500
600
700
800
900
1000
0 0.5 1 1.5 2 2.5 3 3.5
Strain,≅ζ (%)
15 Min
30 Min
60 Min
Stre
ss, σ
(PSI
)
0
100
200
300
400
500
600
700
800
900
1000
0 0.5 1 1.5 2 2.5 3 3.5
Strain,≅ζ (%)
15 Min
30 Min
60 Min
Stre
ss, σ
(PSI
)
Strain, ε (%)

- 58 -
Figure 4.25b. Tensile Stress Strain Response of Two Cubic Yard Trial at 7 Days
Figure 4.25c. Tensile Stress Strain Response of Two Cubic Yard Trial at 14 Days
0
100
200
300
400
500
600
700
800
900
1000
0 0.5 1 1.5 2 2.5 3 3.5
Strain, ≅ (%)
15 Min
30 Min
60 Min
Stre
ss, σ
(PSI
)
Strain, ε (%)
0
100
200
300
400
500
600
700
800
900
1000
0 0.5 1 1.5 2 2.5 3 3.5
Strain, ≅ (%)
15 Min
30 Min
60 Min
Stre
ss, σ
(PSI
)
0
100
200
300
400
500
600
700
800
900
1000
0 0.5 1 1.5 2 2.5 3 3.5
Strain, ≅ (%)
15 Min
30 Min
60 Min
Stre
ss, σ
(PSI
)
Strain, ε (%)
0
100
200
300
400
500
600
700
800
900
1000
0 0.5 1 1.5 2 2.5 3 3.5
Strain, (%)
15 Min
30 Min
60 Min
Stre
ss, σ
(PSI
)
Strain, ε (%)
0
100
200
300
400
500
600
700
800
900
1000
0 0.5 1 1.5 2 2.5 3 3.5
Strain, (%)
15 Min
30 Min
60 Min
Stre
ss, σ
(PSI
)
0
100
200
300
400
500
600
700
800
900
1000
0 0.5 1 1.5 2 2.5 3 3.5
Strain, (%)
15 Min
30 Min
60 Min
Stre
ss, σ
(PSI
)
Strain, ε (%)

- 59 -
Figure 4.25d. Tensile Stress Strain Response of Two Cubic Yard Trial at 28 Days
Table 4.9. Statistical Parameters of Tensile Testing (Sorted by Age)
Age (Days) No. of SpecimensAve (PSI) St Dev (PSI) Ave (PSI) St Dev (PSI) Ave (%) St Dev (%)
4 572 37 696 32 2.4 0.41 97 640 30 774 69 2.3 0.16 9
14 694 53 802 83 2.2 0.2 928 695 46 862 73 2.2 0.17 9
First Cracking Strength Ultimate Strength Strain Capacity
As can be seen from Figures 4.23 – 4.25, the tensile response of the large scale
trial materials shows the characteristic strain hardening behavior of ECC. While the
strain capacity is lower than typical for laboratory versions of the material in most cases,
it still meets the requirements of 500 PSI strength and a minimum of 2% ultimate strain
capacity at 4, 7, 14, and 28 days of aging. Once again, acceptable variation is seen
among specimens cast at different times throughout the mixing time. The results of
these 36 specimens that were tested, in addition to the 30 laboratory M45 tensile response
curves used for material characterization for design procedures, begin to approach the
number of specimens necessary for reliable statistical validation of the large scale trial
material.
While the strain capacity is below the typical expected values associate with ECC
material, this outcome is not totally unexpected as discussed in the context of the findings
0
100
200
300
400
500
600
700
800
900
1000
0 0.5 1 1.5 2 2.5 3 3.5
Strain, (%)
15 Min
30 Min
60 Min
Stre
ss, σ
(PSI
)
Strain, ε (%)
0
100
200
300
400
500
600
700
800
900
1000
0 0.5 1 1.5 2 2.5 3 3.5
Strain, (%)
15 Min
30 Min
60 Min
Stre
ss, σ
(PSI
)
0
100
200
300
400
500
600
700
800
900
1000
0 0.5 1 1.5 2 2.5 3 3.5
Strain, (%)
15 Min
30 Min
60 Min
Stre
ss, σ
(PSI
)
Strain, ε (%)

- 60 -
of Kanda et al (2003). It can also be seen that the overall tensile response of the material
improved over the three trials, signifying improvements made from lessons learned while
mixing. These improvements are expected to be magnified as more large scale mixing
experience is accumulated. However, even at this stage the material continues to meet
the necessary minimum requirements imposed by the special provision.
4.10 Placing of ECC Material
In response to previous concerns by the research advisory panel, an additional test
on ECC material in the fresh state was carried out in conjunction with the one yard trial
mix. As shown earlier, fresh ECC is a very flowable material. The ability of this very
flowable material to be cast easily onto a bridge deck with a 2% cross-sloped crown can
be questioned. To investigate the ability of ECC to be cast on a slight slope, a large form
measuring 4’ x 8’ was built, which could be used to cast an ECC slab up to 9 inches
thick. This formwork is schematically shown in Figure 4.26.
Figure 14. Formwork for Cross-slope Casting
Figure 4.26. Schematic of formwork constructed to verify casting potential of ECC
As shown in Figure 4.27 and Figure 4.28, the ECC material in the fresh state,
even after 1 hour, shows excellent flowabiltiy and is able to fill the formwork well.

- 61 -
Ultimately, the finishing of the ECC material, while not easy, was also not
difficult. The ability of the material to hold to a sloped surface was validated. The form
was filled to a depth of approximately 7 inches so that a uniform gap of 2 inches between
the top of the formwork and the ECC top surface existed around the entire rim of the slab.
The form was not completely filled in case the material did eventually slump down the
slope. After hardening, the same 2 inch gap was observed around the entire slab,
verifying the ability of the material to hold a constant cross slope. However, it must be
mentioned that the research team did have some difficulty in finishing this large area of
material to a smooth finish, as commonly seen on most pavements and bridge decks.
However, this is more likely due to the inexperience of the finishers than a problem for
any experienced concrete contractor.
Figure 4.26 ECC Filling Formwork
2”
Figure 4.25 ECC Pouring into Formwork

- 62 -
5.0 ECC Link Slab Construction Preparation
Prior to beginning construction of the ECC link slab, a large degree of
coordination was established among University of Michigan personnel, MDOT
inspectors, private consultants, the general contractor, and any subcontractors or material
suppliers that may be involved with the construction process. Without this cooperation,
the likelihood of success for this project would have been decreased.
5.1 Informational Meetings
Two informational meeting were held on May 31, 2005 and June 3, 2005 to
introduce the various parties involved with the link slab project to the development of
ECC material, the theory behind the link slab replacement of expansion joints, and to
answer any general questions they might have before the construction work began.
Those in attendance, in addition to University of Michigan personnel, were MDOT,
HNTB® Engineers, Inc. (project managers), NTH® Consultants, Ltd. (consultant),
Construction Technology Laboratories, Inc. (CTL) (testing consultants), Midwest Bridge
(bridge contractor), and Clawson Concrete (concrete material supplier).
The meeting on May 31, 2005 was primarily for local MDOT transportation
service center personnel and HNTB project managers to become acquainted with the
specifics behind ECC. The minutes for this meeting are included in Appendix E. The
meeting on June 3, 2005 included testing consultants, the bridge contractor, and the
material supplier. This meeting was held primarily in the concrete mixing lab at the
University of Michigan Department of Civil and Environmental Engineering to show the
actual mixing procedure of the material in a small gravity mixer and allow construction
workers to become familiar with the fresh material properties first hand. This was
especially important for the material supplier, as it was a different company than
participated in the large scale trial batches. Therefore, all lessons learned during these
three trials would have to be directly communicated through the University of Michigan
researchers during meetings such as these.

- 63 -
5.2 Approval of Equals Submitted by General Contractor as Substitute ECC
Raw Materials
Consistent with the ECC special provision (Appendix D), substitute raw materials
were allowed for use in the link slab provided that they showed similar composite
properties in both the fresh and hardened states. Two substitute materials were submitted
by Clawson Concrete for evaluation. These were a different high range water reducer,
and fly ash from a different material supplier. Flow, compressive strength, and uniaxial
tension tests were performed on ECC materials using both of these replacements. To
shorten investigation times, and extended material lead times, these replacements were
not evaluated individually to determine the impact of each on the composite. As they
were intended by the material supplier to be used in tandem, they were only tested as
such. In the event the combined replacements had performed poorly, each would have
been investigated individually to determine the source of poorer performance.
High range water reducer from Euclid© Company with the trade name Plastol®
5000 was submitted as a replacement for the W.R. Grace product specified within the
special provision. This product is a polycarboxylate-based water reducer similar in
chemical composition to both the W.R. Grace and Degaussa products previously
approved. Additionally, Type F fly ash produced by Headwaters Companies in Eastlake,
Ohio was submitted as an alternative to the Type F fly ash specified by Boral Materials
Technologies in San Antonio, Texas. Material samples of each of these materials were
provided by the manufacturer and tested as a direct replacement (i.e. identical mix
design) for the specified material. Results of flow tests (Figure 5.1), compressive
strength tests (Figure 5.2 and Table 5.1), and uniaxial tension tests (Figure 5.3 and Table
5.2) are shown in the referenced figures and tables.
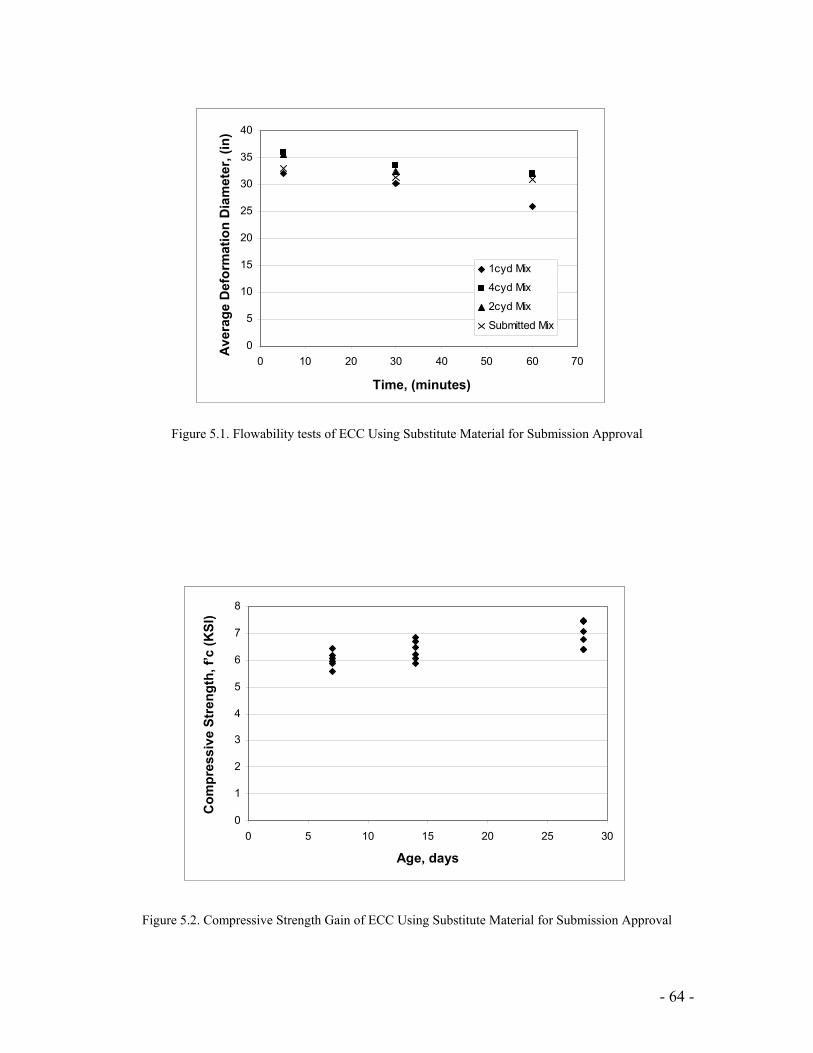
- 64 -
Figure 5.1. Flowability tests of ECC Using Substitute Material for Submission Approval
Figure 5.2. Compressive Strength Gain of ECC Using Substitute Material for Submission Approval
0
5
10
15
20
25
30
35
40
0 10 20 30 40 50 60 70
Time, Minutes
Ave
rage
Def
orm
atio
n D
iam
eter
,
1cyd Mix
4cyd Mix
2cyd Mix
Submitted Mix
Time, (minutes)
Ave
rage
Def
orm
atio
n D
iam
eter
, (in
)
0
5
10
15
20
25
30
35
40
0 10 20 30 40 50 60 70
Time, Minutes
Ave
rage
Def
orm
atio
n D
iam
eter
,
1cyd Mix
4cyd Mix
2cyd Mix
Submitted Mix
Time, (minutes)
Ave
rage
Def
orm
atio
n D
iam
eter
, (in
)
0
1
2
3
4
5
6
7
8
0 5 10 15 20 25 30
Age, days
Com
pres
sive
Str
engt
h, f’
c(K
SI)
Age, days
0
1
2
3
4
5
6
7
8
0 5 10 15 20 25 30
Age, days
Com
pres
sive
Str
engt
h, f’
c(K
SI)
Age, days

- 65 -
Table 5.1. Statistical Parameters of Compressive Testing of ECC for Submission Approval
Age (days) Average Strength (PSI) Standard Deviation (PSI) No. of Samples7 6019 291 614 6355 382 628 6927 483 6
Figure 5.3. Representative Tensile Response of ECC Using Substitute Material for Submission Approval
Table 5.2. Statistical Parameters of Tensile Testing of ECC for Submission Approval
Age (Days) No. of SpecimensAve (PSI) St Dev (PSI) Ave (PSI) St Dev (PSI) Ave (%) St Dev (%)
7 568 39 660 43 2.9 0.3 614 630 36 770 44 2.3 0.2 628 653 20 840 36 2.2 0.1 6
First Cracking Strength Ultimate Strength Strain Capacity
From these results, the overall composition was approved using Plastol® 5000 as
a replacement for the W.R. Grace product and Type F fly ash produced by Headwaters
Companies in Eastlake, Ohio as an alternative to the Type F fly ash specified by Boral
Materials Technologies in San Antonio, Texas. However, the mechanical performance of
the two materials is slightly different. The fly ash from Ohio, while meeting the
specifications for Type F ash, contains significantly less pozzolanic material that that
from Texas. Due to this, both the first cracking strengths and compressive strengths for
the substituted mixes are lower. Specifically, average 28 day compressive strength
0
100
200
300
400
500
600
700
800
900
1000
0 0.5 1 1.5 2 2.5 3 3.5
Strain, e (%)
7 Day
14 Day
28 Day
Stre
ss, σ
(PSI
)
Strain, ε (%)
0
100
200
300
400
500
600
700
800
900
1000
0 0.5 1 1.5 2 2.5 3 3.5
Strain, e (%)
7 Day
14 Day
28 Day
Stre
ss, σ
(PSI
)
Strain, ε (%)

- 66 -
dropped from 9.3ksi to 6.9ksi, tensile first cracking strength dropped from 695psi to
653psi, and ultimate tensile strength dropped from 862psi to 840psi. Entrained air
measurements of these mixes incorporating substitute materials exhibit air contents
between 6% and 8%. These are in line with observations made for typical laboratory
mixing of M45 with specified materials. This is not unexpected, as the level of air
entrainment in ECC is closely related to the flowability since most air is entrapped during
mixing rather than intentionally entrained through air entraining admixtures. Due to the
similarities in flowability between previous M45 mixtures and those with the substitute
materials (Figure 5.1), the air content was expected to remain similar. While none of
these differences result in the material failing to meet material specifications, ultimately
the differences in the material performance are noticeable.
5.3 Contractor Demonstration Mixing
In accordance with the special provision (Appendix D), a demonstration mix was
prepared in cooperation with the general contractor, material supplier, project engineer,
and testing consultants. This demonstration was held on Saturday, July 23, 2005. At
this meeting, four cubic yards of ECC material were mixed using the same batching plant,
materials, and trucks that would be used for the construction pours. This allowed the
material supplier personnel to become familiar with the material batching sequence,
mixing times, and overall procedure. Also in attendance were concrete placing and
finishing crew members from the general contractor. They were brought to witness the
placing of the material, and practice finishing and tining the ECC surface. To do this, a
simple square form (approx 8’ x 8’) was made to contain the fresh ECC material.
Photographs of the demonstration mixing (Figures 5.4 – 5.13), along with tensile curves
(Figures 5.14 – 5.16) and compressive strength results (Figure 5.17) are shown in the
referenced figures. Statistical parameters are summarized in Tables 5.3 (ranges shown
are standard deviation) and 5.4.

- 67 -
Figure 5.4. Clawson Concrete batching plant in Scio Township, Michigan.
Figure 5.5. F-110 Silica Sand batching pile outside Clawson Concrete
Figure 5.6. Charging concrete truck with sand, fly ash, cement, water, and high range water reducer.
Figure 5.7. Adding fibers to truck.

- 68 -
Figure 5.8. Slump cone testing. Figure 5.9. Slump cone measurement.
Figure 5.10. Placement of ECC into demonstration formwork.
Figure 5.11. Screeding of ECC surface.
Figure 5.12. Finished ECC surface after steel troweling and tining.
Figure 5.13. Close up of finished ECC surface after steel troweling and tining.

- 69 -
Figure 5.14. Representative Tensile Responses of ECC Demonstration Mixing
Figure 5.15. Tensile Strength Development of ECC Demo Mixing Material
0
100
200
300
400
500
600
700
800
900
1000
0 0.5 1 1.5 2 2.5 3 3.5
Strain, e (%)
7 Day
14 Day
28 Day
45 Day
Stre
ss, σ
(PSI
)
Strain, ε (%)
0
100
200
300
400
500
600
700
800
900
1000
0 0.5 1 1.5 2 2.5 3 3.5
Strain, e (%)
7 Day
14 Day
28 Day
45 Day
Stre
ss, σ
(PSI
)
Strain, ε (%)
0
100
200
300
400
500
600
700
800
0 10 20 30 40 50
Age, days
Tens
ile S
tren
gth,
PTe
nsile
Str
engt
h, f t
(PSI
)
Age, d (days)
0
100
200
300
400
500
600
700
800
0 10 20 30 40 50
Age, days
Tens
ile S
tren
gth,
PTe
nsile
Str
engt
h, f t
(PSI
)
Age, d (days)

- 70 -
Figure 5.16. Tensile Strain Capacity Development of ECC Demo Mixing Material
Figure 5.17. Compressive Strength Development of ECC Demo Mixing Material
0
0.5
1
1.5
2
2.5
3
3.5
0 10 20 30 40 50
Age, days
Tens
ile S
trai
n, (%
Tens
ile S
trai
n,ε u
(%)
Age, d (days)
0
0.5
1
1.5
2
2.5
3
3.5
0 10 20 30 40 50
Age, days
Tens
ile S
trai
n, (%
Tens
ile S
trai
n,ε u
(%)
Age, d (days)
0
1000
2000
3000
4000
5000
6000
7000
8000
9000
0 10 20 30 40 50
Age, days
Com
pres
sive
Str
engt
h, P
Com
pmre
ssiv
eSt
reng
th, f
’ c(P
SI)
Age, d (days)
0
1000
2000
3000
4000
5000
6000
7000
8000
9000
0 10 20 30 40 50
Age, days
Com
pres
sive
Str
engt
h, P
Com
pmre
ssiv
eSt
reng
th, f
’ c(P
SI)
Age, d (days)

- 71 -
Table 5.3. Statistical Parameters for Compressive and Tensile Testing of ECC Demo Mixing Material
Age Actual Req'd. # Actual Req'd. # Actual Req'd. # 4 5023 PSI ± 515 - 6 500 PSI ± 62 2.6 % ± 0.5 - 67 6041 PSI ± 252 3200 6 570 PSI ± 40 500 6 2.4 % ± 0.2 2.0 6
14 6273 PSI ± 401 4000 6 637 PSI ± 25 500 6 2.4 % ± 0.1 2.0 628 6946 PSI ± 311 4500 6 648 PSI ± 26 500 6 2.3 % ± 0.2 2.0 645 7357 PSI ± 474 4500 6 643 PSI ± 19 500 6 2.3 % ± 0.2 2.0 6
First Cracking Strength Tensile Strain Test
Compressive
Table 5.4. Fresh Properties of ECC Demo Mixing Material
Test Result RequiredTemperature 100ºF -Slump 25" dia. 30" dia.Air Content ~7% -
A number of important recommendations and findings came out of this
demonstration mixing. Foremost among these concerned the slump of the fresh ECC
material upon initial discharge from the mixing truck. The slump measurement of
approximately 25” diameter falls below 30” minimum specified in the MDOT special
provision. This 30” minimum was set to guarantee a flowable mix for proper fiber
dispersion. It was found during the demonstration mix that with adequate mixing time,
fibers could be adequately dispersed with a slightly smaller flow (about 25”). In order to
facilitate easier placement on cross-slope of bridge deck, the requirement of a 30” slump
may be relaxed as long as good fiber dispersion is checked visually by MDOT inspectors
or their designee. The mix should be flowable, homogenous, and fibers should be well
dispersed throughout the fresh matrix. No fiber clumps or bundles should be visually
apparent or noticeable to the touch.
Also, the mixing time used during the demonstration mix after addition of fibers
(approximately 5 minutes) was slightly too short, as a small number of fiber bundles were
still intact. It is recommended that between 8-10 minutes of mixing at full RPM is
completed before mixing truck leaves the batching plant. The additional mixing en route,
along with 5 minutes of high agitation upon arrival at the jobsite should alleviate any
concerns of fiber clumping.
Screeding of the material can be accomplished by using a typical hand screed.
This can be followed a few minutes after by hand troweling with a steel trowel. Best

- 72 -
results can be achieved by through a gentle sweeping motion across the surface while still
in the fresh state. Following the finishing, texturing of the surface can be achieved after
initial setting (15-30 minutes after casting) by carefully drawing a tining rake across the
surface of the material taking care not to disturb the fiber distribution. If this is not
possible, texturing by diamond grinding is allowed after the material has cured and
sufficient strength has been gained to allow for use of heavy machinery on the surface.
These recommendations were also submitted in writing to the project managers,
inspectors, general contractor, and materials supplier at regularly held progress meetings
for the Grove Street project. Each of these recommendations was ultimately
implemented in the final construction and placing of the ECC link slab.

- 73 -
6.0 Grove Street Bridge Construction
Construction of the Grove Street Bridge over I-94 (S02 of 81063) began on
Monday, July 25, 2005 with placement of traffic control devices, and concluded on
Monday, October 25, 2005 with complete opening to traffic. This construction project
was completed in two phases, implementing partial width construction to maintain traffic
flow on Grove Street over I-94 throughout the project.
Unit prices for superstructure concrete on the Grove Street Bridge are shown in
Table 6.1. These include unit prices from both the engineer’s estimate (MDOT design)
and the low bidder (Midwest Bridge) for superstructure concrete forming, finishing, and
curing as measured in square yards, and also prices for the superstructure concrete
material itself per cubic yard. Unit prices for ECC forming, finishing, and curing as
measured in square yards, and also prices for the ECC material itself per cubic yard are
shown for comparison.
Table 6.1 Comparison Unit Prices for Superstructure Concrete and ECC
Item Description Measure Source Amount ($)Engineer $100.00
Midwest Bridge $31.13Engineer $165.00
Midwest Bridge $250.00Engineer $120.00
Midwest Bridge $40.00Engineer $350.00
Midwest Bridge $750.00
ECC - Forming, Finishing, and Curing Square Yard
ECC Material Cubic Yard
Square Yard
Superstructure Concrete - Forming, Finishing, and Curing
Superstructure Concrete Cubic Yard
6.1 Phase One Construction
Beginning with traffic control on Monday, July 25, 2005, phase one
reconstruction progressed on the east half of Grove Street through Friday, September 23,
2005 when traffic was shifted over to the newly constructed sections and phase two
construction progressed on the west half of Grove Street. The ECC mix design used for
phase one is shown in Table 6.2. Photographs of the construction process, including
essential portions of the link slab detailing are shown in Figures 6.1 – 6.6.

- 74 -
Table 6.2 Mixing proportions for ECC link slab – phase one
Material Proportion Amount (lbs/cyd)Cement 1 974Fly Ash 1.2 1168Water 0.59 563Sand 0.8 778HRWR 0.014 13.6Fiber (vol%) 0.02 44Stabilizer Manufacturer's
Recommdation
Figure 6.1. Removal of bituminous asphalt wearing surface.
Figure 6.2. Exposed steel girders with shear studs removed.
Figure 6.3. Painting of girders after installation of new shear connectors. Notice lack of shear connectors within link slab debond zone.
Figure 6.4. Preparing formwork for placing of conventional deck adjacent to each side of ECC link slab.

- 75 -
Throughout this process, regularly scheduled project progress meetings were
conducted with the general contractor every two weeks. Minutes of applicable meetings
can be found in Appendix F. Research personnel attended all meetings throughout the
implementation of the ECC link slab to answer questions, maintain open lines of
communication, and keep track of overall progress. During this construction phase, a
number of tasks were completed to prepare the link slab for instrumentation during load
testing. Two longitudinal #3 rebar within each phase of the bridge construction were
instrumented with foil strain gauges. Coordination with the bridge contractor and the
reinforcement subcontractor was crucial in these stages to guarantee the instrumented
reinforcement was installed in the correct locations, and the instrumentation was not
damaged during construction.
6.2 Construction of ECC Link Slab – Phase One
Placement of the ECC link slab for phase one took place on Saturday, September
10, 2005. The two bridge spans adjacent to the ECC link slab had been poured overnight
on September 9, 2005 to ensure that they were sufficiently cured to pour the neighboring
ECC link slab. Research team personnel were placed at both the concrete batching plant
and onsite at the Grove Street Bridge to observe, monitor, and document all aspects of the
material mixing, placing, and finishing. Research team members at the Clawson
Concrete batching plant assisted by answering questions and performing flowability and
general rheology inspections before concrete trucks left the plant. This helped assure that
Figure 6.5. Completing installation of continuous reinforcing steel throughout ECC link slab.
Figure 6.6. Shear developers in link slab transition zone.

- 76 -
the material would be acceptable upon arrival at Grove Street. Research personnel at the
Grove Street site were responsible for answering onsite questions, conducting fresh
material testing (i.e. flowability tests, rheology inspections, temperature, air content, etc.),
approval of the fresh material, and oversight of the ECC material placement, finishing,
and curing.
For the approximate 20 cubic yards of ECC material needed for each phase of the
construction, three trucks with 7 cubic yards of ECC material were batched and sent to
the site. Fresh material tests were conducted for each truck on site, along with preparing
specimens for testing hardened mechanical properties. The placement and finishing of
the ECC material for phase one is shown in Figures 6.7 – 6.11.
Figure 6.7. Arrival of ECC material in concrete mixing truck.
Figure 6.8. Placement of first truck of ECC material at link slab location.
Figure 6.9. ECC material flowing thoughout link slab confines.
Figure 6.10. Screeding of ECC material to final surface grade.

- 77 -
The results of both fresh property testing and hardened property testing are shown
below in Figures 6.12 – 6.15 and Tables 6.3 – 6.4 (ranges shown are standard deviation).
Figure 6.12. Representative Tensile Responses of ECC Link Slab - Phase One
Figure 6.11. Hand finishing of ECC link slab riding surface.
0
100
200
300
400
500
600
700
800
900
1000
0 0.5 1 1.5 2 2.5 3 3.5
Strain, e (%)
7 Day
14 Day
28 Day
Stre
ss, σ
(PSI
)
Strain, ε (%)
0
100
200
300
400
500
600
700
800
900
1000
0 0.5 1 1.5 2 2.5 3 3.5
Strain, e (%)
7 Day
14 Day
28 Day
Stre
ss, σ
(PSI
)
Strain, ε (%)

- 78 -
Figure 6.13. Tensile Strength Development of ECC Link Slab – Phase One
Figure 6.14. Tensile Strain Capacity Development of ECC Link Slab – Phase One
0
100
200
300
400
500
600
700
800
0 5 10 15 20 25 30
Age, days
PSI
Truck 1
Truck 2
Truck 3Tens
ile S
tren
gth,
f t(P
SI)
Age, d (days)
0
100
200
300
400
500
600
700
800
0 5 10 15 20 25 30
Age, days
PSI
Truck 1
Truck 2
Truck 3Tens
ile S
tren
gth,
f t(P
SI)
Age, d (days)
0
0.5
1
1.5
2
2.5
3
3.5
0 5 10 15 20 25 30
Age, days
%
Truck 1
Truck 2
Truck 3
Tens
ile S
trai
n,ε u
(%)
Age, d (days)
0
0.5
1
1.5
2
2.5
3
3.5
0 5 10 15 20 25 30
Age, days
%
Truck 1
Truck 2
Truck 3
Tens
ile S
trai
n,ε u
(%)
Age, d (days)
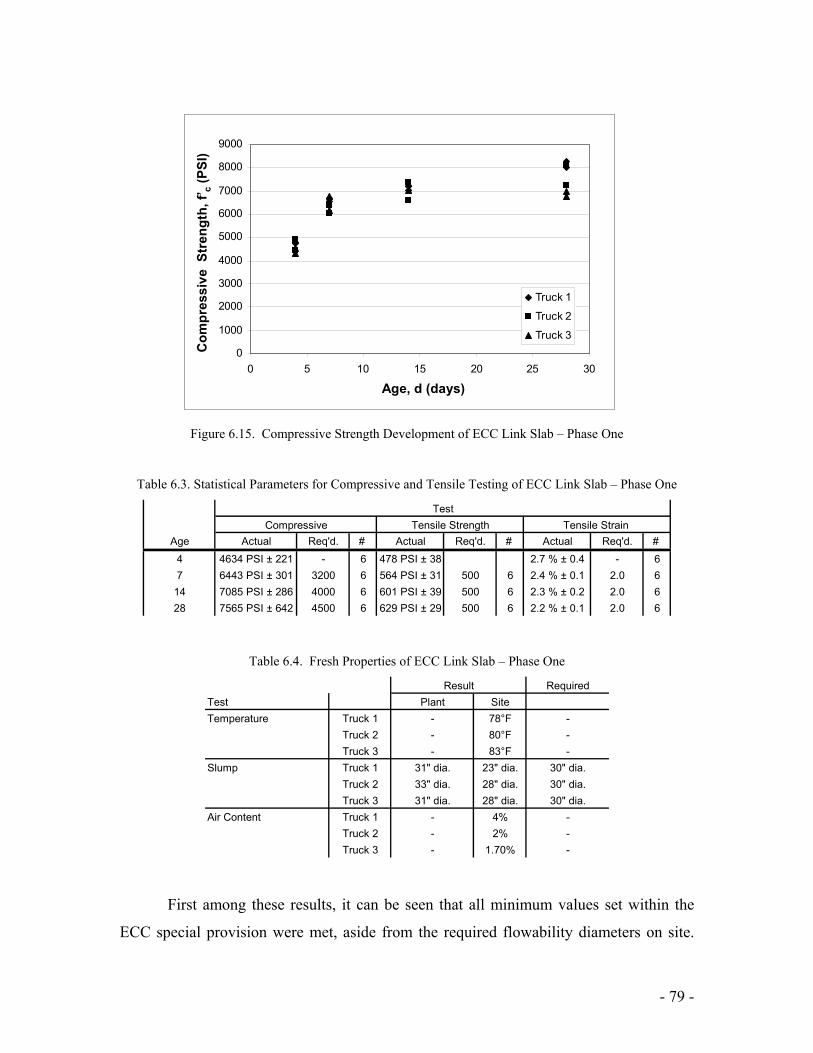
- 79 -
Figure 6.15. Compressive Strength Development of ECC Link Slab – Phase One
Table 6.3. Statistical Parameters for Compressive and Tensile Testing of ECC Link Slab – Phase One
Age Actual Req'd. # Actual Req'd. # Actual Req'd. # 4 4634 PSI ± 221 - 6 478 PSI ± 38 2.7 % ± 0.4 - 67 6443 PSI ± 301 3200 6 564 PSI ± 31 500 6 2.4 % ± 0.1 2.0 6
14 7085 PSI ± 286 4000 6 601 PSI ± 39 500 6 2.3 % ± 0.2 2.0 628 7565 PSI ± 642 4500 6 629 PSI ± 29 500 6 2.2 % ± 0.1 2.0 6
Compressive Tensile Strength Tensile Strain Test
Table 6.4. Fresh Properties of ECC Link Slab – Phase One Required
Test Plant SiteTemperature Truck 1 - 78°F -
Truck 2 - 80°F -Truck 3 - 83°F -
Slump Truck 1 31" dia. 23" dia. 30" dia.Truck 2 33" dia. 28" dia. 30" dia.Truck 3 31" dia. 28" dia. 30" dia.
Air Content Truck 1 - 4% -Truck 2 - 2% -Truck 3 - 1.70% -
Result
First among these results, it can be seen that all minimum values set within the
ECC special provision were met, aside from the required flowability diameters on site.
0
1000
2000
3000
4000
5000
6000
7000
8000
9000
0 5 10 15 20 25 30
Age, days
PSI
Truck 1
Truck 2
Truck 3
Com
pres
sive
Str
engt
h, f’
c(P
SI)
Age, d (days)
0
1000
2000
3000
4000
5000
6000
7000
8000
9000
0 5 10 15 20 25 30
Age, days
PSI
Truck 1
Truck 2
Truck 3
Com
pres
sive
Str
engt
h, f’
c(P
SI)
Age, d (days)

- 80 -
As mentioned previously, these requirements were partially relaxed after the
demonstration mixing, after observations showed acceptable material homogeneity and
rheological properties without a slump of 30”. Further, the slightly lower flowability
gave the general contractor more confidence that the material would not ultimately flow
off of the bridge from the 2% crown of the deck. Also, while there were large differences
in the fresh appearance of the ECC on site (i.e. flowability), the differences among the
three trucks measured in the mechanical testing are relatively small, as most of the test
results are indistinguishable between the first, second, or third truck loads.
Overall the tensile response of the material performs in a similar manner to what
was seen in the demonstration mixing. Tensile strain capacity after 7 days exhibits a
wide range of relatively large values, after which it begins to decline while showing less
variability. Ultimately an average strain capacity of 2.2% is shown for the ECC link slab
material. While not a high as values typically seen in the laboratory, this value is
significantly high to accommodate the strain demands exhibited by the adjacent bridge
decks in this application. Finally, the compressive strength gain of the material is very
similar to that seen in the demonstration mix and acceptable for the link slab application
as well.
One observation made during the placing at the bridge site was a distinct
difference in the fresh appearance between the first truck and the final two trucks. This
can be seen in Table 6.4 from the slump values for each truck on site. As shown, the
flowability diameter for the first truck was 23”, while for the second and third trucks was
28”. The second and third batches were much more flowable and liquid in nature than
the first batch, which was more similar to material which is produced under laboratory
conditions. A simple explanation for this difference can be found in the habits of the
individual concrete truck drivers at the batching plant. Unlike batching of concrete which
is done completely from the tower at one time, the batching of ECC material is done in
steps, which were outlined previously in the batching sequence. Therefore, rather than
washing the charging cone of the truck once as is typically done for concrete, for ECC
drivers may wash the charging cone after charging of the sand and water, again after
charging of the cement and fly ash, a third time after charging of the fibers, and
potentially a fourth time after discharging ECC materials at the batching plant for a slump

- 81 -
test. While 9% of the mixing water was reserved for the washing out process to help
account for this, the exact number of washings a driver undertakes creates variability in
the material water content, and therefore flowability. It was observed that the driver of
the first truck washed the charging cone only twice during the mixing process (after
completed charging of the fibers, and after discharging for the slump test) while the other
two drivers washed the charging cone four times. Using potentially 5-6 gallons per
washout, this may change the mix design by 80 lbs of water, or 2% of the mixing water
for the entire truck. While this value may seem minor, changes of 2% of the mixing
water in laboratory settings have shown significant differences in the flowability of ECC
material. In subsequent batchings, a tighter control on the amount of washing was
exercised to correct this problem.
6.3 Early Age Performance – Phase One
Approximately 3 days after placement of the first phase of the ECC link slab, and
before wet curing was completed, it was discovered that a number of cracks had
developed within the link slab. Initially, these were attributed to shrinkage cracking and
they were monitored up until the time of load testing, approximately one week after
placement of the ECC material. Load testing of phase one of the link slab proceeded on
Monday, September 19, 2005. While the procedure and results of the load tests will be
discussed in a later section, the observations and adjustments made in the days following
the phase one placement had a significant impact on the execution of phase two and
therefore will be discussed here.
Photographs of the cracking are shown in Figures 6.16 – 6.20. Also included is
the age of the link slab when the photographs were taken. As seen from the photographs,
the spacing of the cracks is very regular with a spacing of approximately 8” between each
crack. Also, as can be seen clearly in Figure 6.20, cracks tended to originate from rebar
and propagate radially outward. Further, the most severe observable cracking originated
around the rebar which protrude out of the link slab surface to be cast into the sidewalk
(Figure 6.17). While the vast majority of cracks within the link slab remained about
0.005” to 0.007” in width, some large restrained shrinkage cracks around the

- 82 -
reinforcement protruding for the sidewalk approached 0.014”. Figure 6.22 is a diagram
of the phase one link slab showing early age cracking patterns.
Figure 6.16. Cracking within ECC link slab with crack width approximately 0.007”. (3 Days)
Figure 6.17. Cracking in ECC link slab around sidewalk reinforcing steel with crack width approximately 0.014”. (3 Days)
Figure 6.18. Cracking in ECC link slab (highlighted with blue chalk) with crack width 0.005 and spacing 8”. (8 Days)
Figure 6.19. Cracking in ECC link slab (highlighted with blue chalk) corner with crack width 0.005. (8 Days)

- 83 -
Figure 6.22. Diagram of cracking in ECC link slab – Phase One
Figure 6.20. Cracking in ECC link slab cross section at reinforcing steel with width 0.007” at surface. (8 Days)
Figure 6.21. Steel reinforcement layout within ECC link slab.
7”
CL
Ref Lin
e
N
Sidewalk
Grove Street
39’-0”
8’-5 1/2” 8’-5 1/2”
#5 reinforcing bars protrudingfrom deck for sidewalk
#5 rebar protruding from construction joint edge of link slab
CL
Ref Lin
e
N
Sidewalk
Grove Street
39’-0”
8’-5 1/2” 8’-5 1/2”
#5 reinforcing bars protrudingfrom deck for sidewalk
#5 rebar protruding from construction joint edge of link slab

- 84 -
The crack patterns in the phase one link slab suggest that the reinforcing steel
within the deck may be aiding to generate the cracks within the ECC. This was partially
verified by the photographs of the reinforcing steel installed within the link slab. This is
shown in Figure 6.21. As can be seen, the reinforcing steel along the ECC/concrete
interface is spaced on the order of 8” apart in a consistently regular pattern. After
initiation near the ECC/concrete interface, the cracks tend to steer perpendicular to the
interface as though the entire link slab were a large tensile specimen restrained from free
shrinkage along the edges in contact with the neighboring concrete deck already in place.
This crack steering phenomenon is most pronounced near the acute angle formed by the
link slab edges near centerline of the Grove Street bridge. Due to the strain-hardening
characteristics of ECC material which increases in tensile strength after cracking, these
cracks do not pose any structural concerns. However, their impact on the durability of
the link slab could be significant and potential ways to eliminate them were investigated.
Subsequent static load testing of the Grove Street bridge performed on September 19,
2005 confirmed the structural integrity of the link slab. A complete description of the
load testing and results can be found in section seven.
6.4 Restrained Shrinkage Investigations
The restrained and free shrinkage behavior of ECC materials was investigated
previously by Li et al (2003), and was found to be of little concern for crack formation.
That work consisted of a series of restrained shrinkage rings that were cast using an M45
ECC mix design identical to that used in the link slab aside from the use of approved
substitute materials within the link slab casting. Findings within that study verified that
the cracks that did form in restrained shrinkage specimens were on the order of 0.001”
and therefore too small to impact durability performance. Specimens in that study
however, were cured for 3 days, allowed to air dry, and kept at constant laboratory
temperatures throughout the tests. Additionally, those rings used the exact raw materials
specified within the special provision. Therefore, a series of ring tests were performed to
evaluate the effects of early age curing regimes, curing temperatures, and approved
substitute raw materials. The specimen geometries, measurement methods, and testing
procedure are identical to that outlined in Li et al (2003) unless otherwise discussed

- 85 -
below. The full series of test parameters is shown in Table 6.5 along with a photograph
of a ring specimen and crack microscope in Figures 6.23 and 6.24.
Table 6.5. Restrained Shrinkage Test Parameters
Ring No. Mix Design Environment Wet Curing1 M45 Outdoors 4 Days2 M45 Substitute Materials Outdoors 4 Days3 M45 Substitute Materials Laboratory 4 Days4 M45 Substitute Materials High Water Outdoors 4 Days5 M45 Substitute Materials Low Water Outdoors 4 Days6 M45 Substitute Materials Outdoors 4 Hours7 M45 Substitute Materials Outdoors 7 Days
Within this test series, the mix designs varied between the standard M45 (ring 1)
with raw materials identical to those mixed in earlier studies to other rings using the
approved substitute raw materials. For ring 4 the amount of water was artificially
increased to produce a version of ECC that was similar in terms of flowability to the
material from trucks two and three during phase one of the link slab pouring. For ring 5,
the amount of water was artificially lowered to produce a very stiff fresh material with
little extra water. All rings aside from ring 3 were kept outdoors over the days of
September 26 – October 3, 2005. Over these days, daytime temperatures averaged 71°F
Figure 6.23. Restrain shrinkage ring test.
Figure 6.24. Restrain shrinkage ring test with crack width measurement microscope.

- 86 -
while nighttime lows averaged 39°F, giving a wide range of temperatures over the 24
hour daily cycle. In the case of ring 3, the laboratory temperature was set at 68ºF ± 2ºF.
It was also suspected that while burlap and plastic were eventually placed on the link slab,
the initial time (approximately 4 to 5 hours) that elapsed before this happened may have
attributed to much of the early age cracking. Therefore, ring 6 was removed from the
molds and allowed to air cure after 4 hours, only long enough to hold the shape of the
ring specimen. Finally, ring 7 was allowed to remain in the moist mold for 7 days to
examine the effects of the extended curing time on shrinkage cracking.
Many of the problems associated with early age cracking, and in particular with
the larger crack widths exhibited within the link slab, may be related to the development
of the fiber bridging relation at early age. As was discussed in previous research, the
fiber bridging properties within ECC material are the root of the unique strain hardening
behavior. However, these properties take time to develop and therefore if early age
shrinkage occurs before the fiber bridging within the composite has reach an adequate
strength, larger crack widths may result. Within the work done previously by Li et al
(2003), crack formation at such early ages (i.e. hours after casting) was not the focus of
the investigation. In previous studies, all rings had been cured for 4 to 7 days prior to
exposure to drying shrinkage conditions. By this time, the fiber bridging behavior of the
material had matured to a point at which it could resist the formation of large cracks.
This short series of tests was designed to investigate this possibility, along with the
effects of temperature and mixing materials as discussed earlier.
The results of the restrained shrinkage tests are shown Table 6.6 with a summary
of the crack widths and number of cracks in each ring specimen. Within Table 6.6 the
shrinkage strain of the material was computed by dividing the total shrinkage measured
within the specimen (through summation of all crack widths) by the ring circumference
(40.84”).

- 87 -
Table 6.6. Summary of Restrained Shrinkage Testing
Ring No. No. of Cracks Maximum Width Average Width Total Shrinkage Shrinkage Strain1 8 0.0016" 0.0012" 0.0094" 0.023%2 7 0.0016" 0.0012" 0.0087" 0.021%3 6 0.0016" 0.0012" 0.0071" 0.017%4 7 0.0024" 0.0014" 0.0102" 0.026%5 5 0.0012" 0.0010" 0.0051" 0.013%6 8 0.0024" 0.0015" 0.0118" 0.032%7 7 0.0016" 0.0012" 0.0087" 0.021%
The results for ring 1 show slightly lower shrinkage results than those reported by
Li et al (2003) in which 10 cracks were observed in each ring ranging in magnitude
between 0.001” and 0.003”. However, considering the variability of water requirements
of fly ash material used in ECC, and the large portion of fly ash within the ECC mix
design, such differences in the number of shrinkage cracks are expected. As can be seen
from the various mix designs and environmental conditions tested, shifting to the
substitute materials alone did not result in a large change in shrinkage strains or crack
width. However, a change in mixing water from 0.59 to 0.61 w/c ratio (ring 4 with
higher water content) did increase the shrinkage cracking and also the average crack
width. Further, the short curing times associated with ring 6 also seemed to promote high
shrinkage deformations. These two factors combined could be partially responsible for
the extensive cracking observed in the phase one link slab.
However, no rings within this series of tests showed crack widths near the 0.006”
to 0.008” widths that are seen on the Grove Street bridge. While the microcrack widths
in ECC are inherently size independent, the combined effects of larger surface area,
thicker slab dimension, and embedded epoxy coated rebar were all regarded as possible
causes for the larger crack widths. Therefore, a larger restrained shrinkage frame was
constructed that combined the effects of a larger slab area, thicker slab dimension, and
embedded #5 reinforcing steel. This frame is shown in Figures 6.25 – 6.27.
This frame was constructed of 3” x 5” X 1/8” angle steel to adequately resist the
shrinkage forces within the ECC slab and promote cracking. The frame measured 40” by
20” and could accommodate a 5” thick slab. To transfer restraint from the frame to the
slab, a series of 0.5” diameter shear connectors were placed on the frame every 3” along
the sides at mid depth. Epoxy coated reinforcing bars (#5) were obtained from the
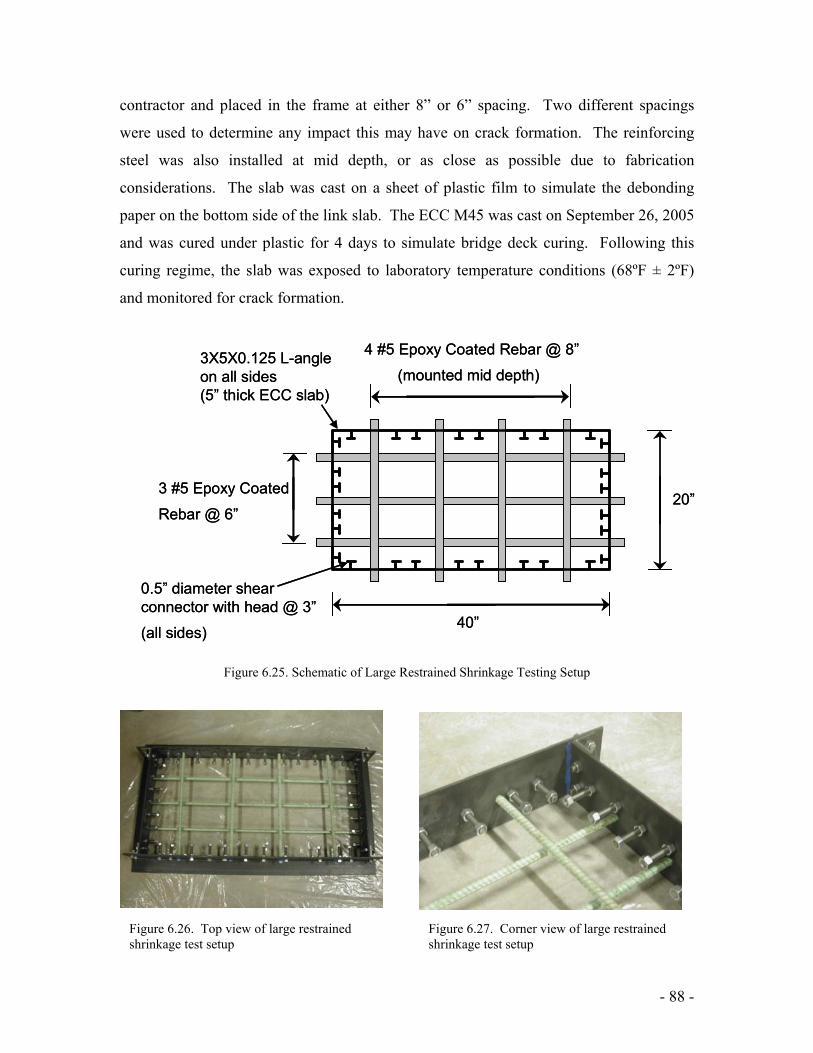
- 88 -
contractor and placed in the frame at either 8” or 6” spacing. Two different spacings
were used to determine any impact this may have on crack formation. The reinforcing
steel was also installed at mid depth, or as close as possible due to fabrication
considerations. The slab was cast on a sheet of plastic film to simulate the debonding
paper on the bottom side of the link slab. The ECC M45 was cast on September 26, 2005
and was cured under plastic for 4 days to simulate bridge deck curing. Following this
curing regime, the slab was exposed to laboratory temperature conditions (68ºF ± 2ºF)
and monitored for crack formation.
Figure 6.25. Schematic of Large Restrained Shrinkage Testing Setup
Figure 6.26. Top view of large restrained
shrinkage test setup Figure 6.27. Corner view of large restrained shrinkage test setup
40”
20”
4 #5 Epoxy Coated Rebar @ 8”
(mounted mid depth)
3 #5 Epoxy Coated
Rebar @ 6”
0.5” diameter shear connector with head @ 3”
(all sides)
3X5X0.125 L-angleon all sides(5” thick ECC slab)
40”
20”
4 #5 Epoxy Coated Rebar @ 8”
(mounted mid depth)
3 #5 Epoxy Coated
Rebar @ 6”
0.5” diameter shear connector with head @ 3”
(all sides)
3X5X0.125 L-angleon all sides(5” thick ECC slab)

- 89 -
While this restrained shrinkage frame does more fully represent the field
conditions in the ECC link slab, the same type of cracking observed in the link slab could
not be replicated. After 4 days of curing, no shrinkage cracks could be found and after 7
days (4 curing and 3 lab exposure) a number of small microcracks could be seen. These
have remained stable up to 28 days age when last measured. The appearance and crack
map of the specimen are shown in Figure 6.28.
Unfortunately, due to the tight construction schedule between phases one and two
of the link slab construction, only one larger sized shrinkage specimen of this nature was
cast before making the necessary recommendations and changes for the ECC mix design
of phase two. Three major considerations were drawn upon when making changes to the
mix design. First, from the ring tests it was observed that the use of approved equal
material did not negatively impact the shrinkage behavior of the material and these were
allowed continued use. Second, the flowability and liquidity of the ECC material from
trucks two and three during the phase one construction were higher than that seen in
laboratory grade materials. Reasons for this additional flowability with regard to higher
Figure 6.28. Shinkage specimen after 28 days of age. Cracks are shown as solid lines along with crack widths at that location. Reinforcing steel locations are shown as dashed lines.
0.001”
0.0007”
0.0007”
0.001”
0.0007”
0.0007”
0.0007”
0.0007”
0.001”
0.0007”
0.0007”
0.001”
0.0007”
0.0007”
0.0007”
0.0007”

- 90 -
water content were discussed previously. Third, the performance of laboratory grade
ECC material in all shrinkage tests was far superior to that exhibited by the phase one
link slab. Therefore, the decision was made to reduce the water content within the ECC
material to a water/cement ratio of 0.57 rather than 0.59. This resulted in a revised mix
design shown in Table 6.7.
Table 6.7. Mixing proportions for ECC link slab- phase two
Material Proportion Amount (lbs/cyd)Cement 1 973Fly Ash 1.2 1167Water 0.57 544Sand 0.8 778HRWR 0.015 14.6Fiber (vol%) 0.02 44Stabilizer Manufacturer's
Recommdation
To account for the lower water content, and to ensure good flowability the amount
of high range water reducer was increased slightly. This addition was done at the site and
will be discussed in more detail in section 6.6. Additionally, it was decided that for ease
of future use, the amount of stabilizer recommended would follow the manufacturer’s
recommendation or engineer’s recommendation.
6.5 Phase Two Construction
As mentioned previously, phase two of the Grove Street construction began on
Friday, September 23, 2005 when traffic was shifted over to the newly constructed
sections and work progressed on the west half of Grove Street. Photographs of the
construction process, including essential portions of the link slab detailing are shown in
Figures 6.29 – 6.33.
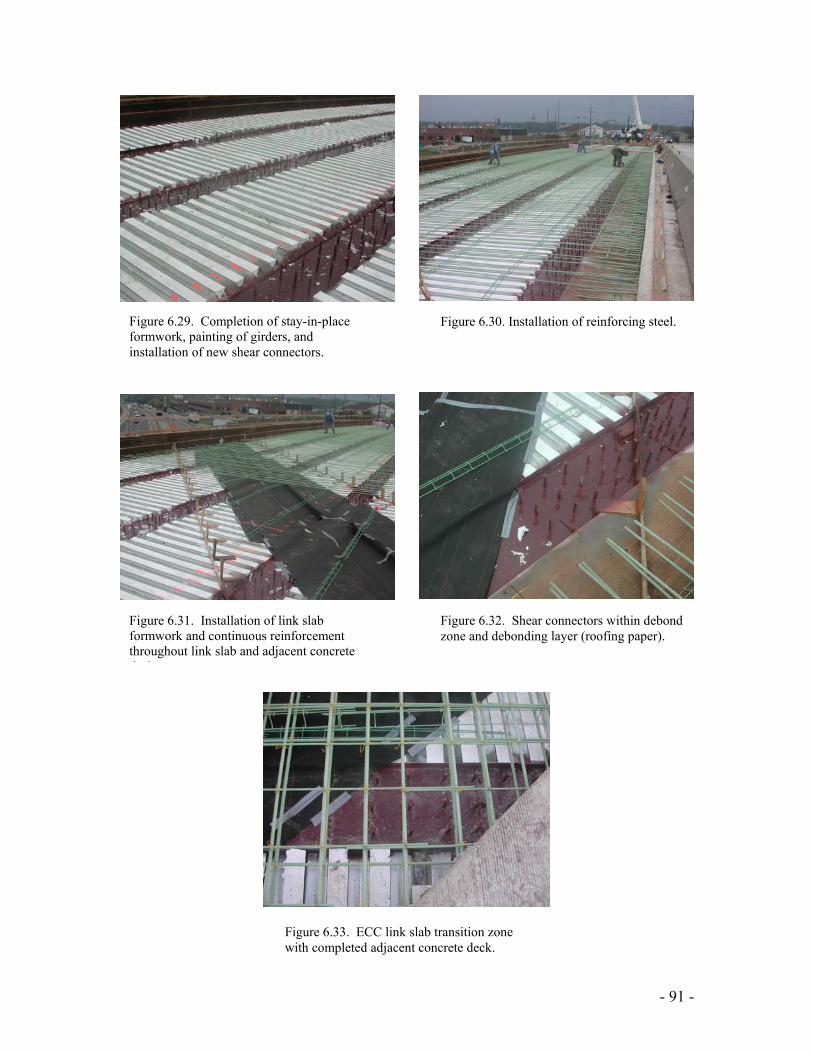
- 91 -
Figure 6.29. Completion of stay-in-place formwork, painting of girders, and installation of new shear connectors.
Figure 6.30. Installation of reinforcing steel.
Figure 6.31. Installation of link slab formwork and continuous reinforcement throughout link slab and adjacent concrete d k
Figure 6.32. Shear connectors within debond zone and debonding layer (roofing paper).
Figure 6.33. ECC link slab transition zone with completed adjacent concrete deck.

- 92 -
Once again, throughout this process regularly scheduled project progress meetings
were conducted with the general contractor every two weeks. Minutes of applicable
meetings can be found in Appendix F. Research personnel attended all meetings
throughout the implementation to answer questions, maintain open lines of
communication, and keep track of overall progress. As in phase one, coordination with
the bridge contractor and the reinforcement subcontractor was crucial prior to
construction of the actual link slab to guarantee the instrumented reinforcement was
installed in the correct locations, and the instrumentation was not damaged during
construction.
6.6 Construction of ECC Link Slab – Phase Two
Construction of the ECC link slab for phase two took place on Tuesday, October
18, 2005. The two bridge spans adjacent to the ECC link slab had been poured overnight
on October 15, 2005 to ensure that they were sufficiently cured to pour the neighboring
ECC link slab. Once again, research team personnel were placed at both the concrete
batching plant and onsite at the Grove Street Bridge to observe, monitor, and document
all aspects of the material mixing, placing, and finishing. As before, research team
members at the Clawson Concrete batching plant assisted by answering questions and
performing flowability and general rheology inspections before concrete trucks left the
plant. Research personnel at the Grove Street site were responsible for answering onsite
questions, conducting fresh material testing (i.e. flowability tests, rheology inspections,
temperature, air content, etc.), approval of the fresh material, and oversight of the ECC
material placement, finishing, and curing.
As in phase one, approximately 20 cubic yards of ECC material was needed for
the link slab pour so three trucks with 7 cubic yards of ECC material each were batched
and sent to the site. Fresh material tests were conducted for each truck, along with
preparing specimens for testing hardened mechanical properties. The placement and
finishing of the ECC material for phase two is shown in Figures 6.34 – 6.39.

- 93 -
Figure 6.34. Placing of ECC material at the link slab location – phase two
Figure 6.35. Flowability of ECC material discharging from truck.
Figure 6.36. Placing of ECC material at the site – phase two
Figure 6.37. Screeding of ECC link slab finished surface.
Figure 6.38. Steel trowel finishing of ECC link slab surface.
Figure 6.39. Tining of ECC link slab riding surface.

- 94 -
The results of both fresh property testing and hardened property testing are shown
below in Figures 6.40 – 6.43 and Tables 6.8 – 6.9 (ranges shown are standard deviation).
Figure 6.40. Representative Tensile Responses of ECC Link Slab - Phase Two
Figure 6.41. Tensile Strength Development of ECC Link Slab – Phase Two
0
100
200
300
400
500
600
700
800
900
1000
0 0.5 1 1.5 2 2.5 3 3.5
Strain, e (%)
7 Day
14 Day
28 Day
Stre
ss, σ
(PSI
)
Strain, ε (%)
0
100
200
300
400
500
600
700
800
900
1000
0 0.5 1 1.5 2 2.5 3 3.5
Strain, e (%)
7 Day
14 Day
28 Day
Stre
ss, σ
(PSI
)
Strain, ε (%)
0
100
200
300
400
500
600
700
800
0 5 10 15 20 25 30
Age, days
PSI
Truck 1
Truck 2
Truck 3Tens
ile S
tren
gth,
f t(P
SI)
Age, d (days)
0
100
200
300
400
500
600
700
800
0 5 10 15 20 25 30
Age, days
PSI
Truck 1
Truck 2
Truck 3Tens
ile S
tren
gth,
f t(P
SI)
Age, d (days)

- 95 -
Figure 6.42. Tensile Strain Capacity Development of ECC Link Slab – Phase Two
Figure 6.43. Compressive Strength Development of ECC Link Slab – Phase Two
0
1000
2000
3000
4000
5000
6000
7000
8000
9000
0 5 10 15 20 25 30
Age, days
PSI
Truck 1
Truck 2
Truck 3
Com
pres
sive
Str
engt
h, f’
c(P
SI)
Age, d (days)
0
1000
2000
3000
4000
5000
6000
7000
8000
9000
0 5 10 15 20 25 30
Age, days
PSI
Truck 1
Truck 2
Truck 3
Com
pres
sive
Str
engt
h, f’
c(P
SI)
Age, d (days)
0.0
0.5
1.0
1.5
2.0
2.5
3.0
3.5
0 5 10 15 20 25 30
Age, days
%
Truck 1
Truck 2
Truck 3
Tens
ile S
trai
n,ε u
(%)
Age, d (days)
0.0
0.5
1.0
1.5
2.0
2.5
3.0
3.5
0 5 10 15 20 25 30
Age, days
%
Truck 1
Truck 2
Truck 3
Tens
ile S
trai
n,ε u
(%)
Age, d (days)

- 96 -
Table 6.8. Statistical Parameters for Compressive and Tensile Testing of ECC Link Slab – Phase Two
Age Actual Req'd. # Actual Req'd. # Actual Req'd. # 4 4639 PSI ± 372 - 6 494 PSI ± 36 2.7 % ± 0.3 - 67 6305 PSI ± 381 3200 6 573 PSI ± 56 500 6 2.5 % ± 0.2 2.0 6
14 7137 PSI ± 486 4000 6 613 PSI ± 40 500 6 2.4 % ± 0.3 2.0 628 7622 PSI ± 642 4500 6 643 PSI ± 38 500 6 2.2 % ± 0.1 2.0 6
Tensile Strength Tensile Strain Test
Compressive
Table 6.9. Fresh Properties of ECC Link Slab – Phase Two Required
Test Plant SiteTemperature Truck 1 - 76°F -
Truck 2 - 79°F -Truck 3 - 86°F -
Slump Truck 1 16" dia. 24" dia. 30" dia.Truck 2 16" dia. 24" dia. 30" dia.Truck 3 18" dia. 22" dia. 30" dia.
Air Content Truck 1 - 7% -Truck 2 - 9% -Truck 3 - 6.70% -
Result
Once again, as was seen in phase one construction, all minimum material
parameters were met for each mechanical and fresh property requirement, aside from the
flowability test. Additionally, the effect of lower water content can be seen in the slightly
higher compressive strengths and tensile cracking strengths. In terms of fresh ECC
properties, the change in water content, along with tighter regulation of washing water,
led to much lower flowability values at the mixing plant. While the material had good
fiber dispersion and overall rheology, once at the construction site and additional 7% of
high range water reducer was added into the truck to make the material more flowable
and easier to work with while not increasing the water content. This boosted the
proportion of high range water reducer from 0.014 as shown in Table 6.2 to 0.015 as
shown in Table 6.7. As mentioned, this was done primarily for workability
considerations to place the ECC material. Similar to observations discussed previously
in section 5.2, the higher air content within the phase two material (as seen in Table 6.9)
can be attributed primarily to the lower flowability of the material. Air content within
ECC material is heavily dependent upon the amount of air entrapped during mixing
rather than the amount of air entrained through entraining agents as in concrete. Due to

- 97 -
the lower flowability of ECC material in phase two, the air content is significantly higher
than in material used in phase one.
At the batching plant, greater care was also taken to regulate the amount of
washing water that was used in the charging process. Drivers were instructed only to
wash out after all charging had been complete, and immediately prior to leaving the
batching plant. Further, they were instructed to use exactly 5 gallons of water for this
washing process. This amount of water was kept in reserve from the batching tower for
washing purposes. These steps ultimately led to a material at the site that was much
closer in appearance to laboratory grade ECC regularly mixed by research personnel.
The difference in material appearance between trucks was also negligible in both fresh
properties (Table 6.7) and mechanical properties (Figures 6.41 – 6.43). One additional
side effect of lower slump was a significant increase in air entrainment within the ECC
material. While high levels of air entrainment are not a requirement for good freeze-thaw
resistance in ECC (Li et al 2003), any increase in the amount of air content within the
material simply serves as a greater barrier to freeze-thaw damage. Much of this increase
can likely be attributed to increased entrapment of air during the mixing of the stiffer
ECC material used in phase two. After surface finishing, a white curing compound was
applied to the surface of the link slab and the entire slab was covered with plastic and
burlap after 2 hours of setting time.
6.7 Early Age Performance – Phase Two
Over the first few days following construction of the link slab, numerous visits
were made to the link slab site to monitor the formation of cracks, and confirm the proper
curing procedures were being followed. Over the 6 days of wet curing, no significant
cracking could be found on the link slab surface. However, much of the surface was
inaccessible due to the large burlap and plastic sheets covering the entire deck. After
removal of the curing covers, a number of cracks were found on the surface of the link
slab once again averaging in width from 0.006” to 0.007”. While the number of these
cracks is reduced from phase one construction, a number of cracks had formed and are
shown in a crack map of the phase two link slab in Figure 6.44. While the exact time of
crack formation is not known due to burlap, plastic, and light construction materials

- 98 -
covering of the link slab, it can be assumed that they appeared at roughly the same age as
cracking in the phase one link slab. Those cracks were first discovered about 3 days after
casting. Load testing of phase two of the link slab proceeded on Saturday, October 22,
2005. The procedure and results of the load tests will be discussed in section seven.
Figure 6.44. Diagram of cracking in ECC link slab – Phase Two
As can be seen when comparing the crack maps of the two link slab construction
phases, the decrease in water content had a significant impact on the number of cracks
formed within the link slab. Roughly a 30% decrease in the number of mapped cracks
can be seen. However, still of concern is the width of these cracks. Once again, while
their strain-hardening nature does not pose a large structural reliability problem, their
impact on the overall durability of the link slab may be large. As discussed in previous
research by Li et al (2003), cracks that remain under 0.004” in width have shown to be
nearly equivalent to sound concrete with respect to some transport properties. Further
reasons for the larger crack widths in the link slab may be temperature gradients within
CL
Ref Lin
e 2
Sidewalk
N
Grove Street
39’-0”
8’-5 1/2” 8’-5 1/2”
#5 reinforcing bars protrudingfrom deck surface for sidewalk
#5 rebar protruding from construction joint edge of link slab
CL
Ref Lin
e 2
Sidewalk
N
Grove Street
39’-0”
8’-5 1/2” 8’-5 1/2”
#5 reinforcing bars protrudingfrom deck surface for sidewalk
#5 rebar protruding from construction joint edge of link slab
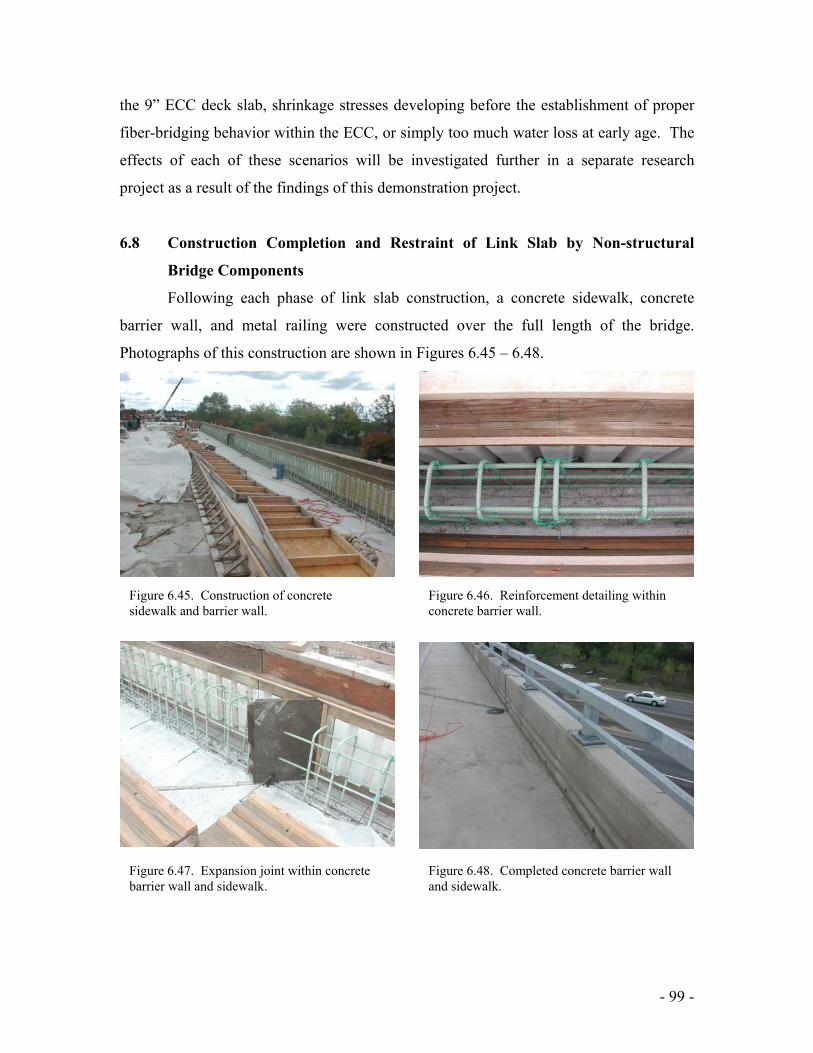
- 99 -
the 9” ECC deck slab, shrinkage stresses developing before the establishment of proper
fiber-bridging behavior within the ECC, or simply too much water loss at early age. The
effects of each of these scenarios will be investigated further in a separate research
project as a result of the findings of this demonstration project.
6.8 Construction Completion and Restraint of Link Slab by Non-structural
Bridge Components
Following each phase of link slab construction, a concrete sidewalk, concrete
barrier wall, and metal railing were constructed over the full length of the bridge.
Photographs of this construction are shown in Figures 6.45 – 6.48.
Figure 6.45. Construction of concrete sidewalk and barrier wall.
Figure 6.46. Reinforcement detailing within concrete barrier wall.
Figure 6.47. Expansion joint within concrete barrier wall and sidewalk.
Figure 6.48. Completed concrete barrier wall and sidewalk.

- 100 -
Following completion of the Grove Street construction drawings and release of
the project to bidding, it was realized that while the ECC link slab was designed
following the intent of the research team, the design of a concrete sidewalk and barrier
wall resting on, and connected with, the concrete link slab could represent potential long
term problems. As shown in Figures 6.49 – 6.50b, the concept of a the ECC link slab
requires that the link slab be allowed to strain in tension freely, and not be restrained by
other more brittle bridge components (i.e. concrete sidewalk and barrier walls).
Thermal stresses within the Grove street bridge link slab can be separated into
two classes; uniform thermal stresses and gradient thermal stresses. Uniform thermal
stresses are uniform across the entire cross section of the link slab and result from bearing
deformation at the supporting piers, expansion joint deformation at expansion joints at
either end of the bridge or spans, or restrained functioning of the link plate assembly as
part of the pin-and-hanger assemblies within spans 2 and 3. Gradient thermal stresses are
non-uniform throughout the cross section but rather are a result of differential heating and
cooling of the bridge deck resulting in a temperature gradient and therefore a distribution
of stresses. The relative magnitudes of these stresses are considered when allowing
concrete sidewalk and barrier wall to be used in conjunction with the ECC link slab.
Figure 6.49. ECC design concept for link slab made from strain hardening cementitious composites.
µ C R A C K I N G
Steel Beam
Concrete DeckContinuous Reinforcement Shear Stud
Debonding Paper
ECC Link Slab Deck Interface
Thermal Stresses
Thermal Stresses

- 101 -
Figure 6.50a. Concrete sidewalk and barrier wall defoming incompatibly with ECC link slab resulting in
localization of cracking at ends of link slab or under concrete expansion joint. (Potential stress
concentration locations highlighted by circling.)
Figure 6.50b. Concrete sidewalk and barrier wall defoming incompatibly with ECC link slab resulting in
distributed cracking within the concrete sidewalk and barrier wall.
As seen in Figure 6.49, the thermal deformation of the adjacent bridge decks is
accommodated over the entire length of the ECC link slab. For this deformation to be
distributed over a reasonable length, and not simply concentrated over the small gap
between the steel girders, a debond zone is constructed to allow the highly ductile ECC
material to diffuse large deformations throughout the entire link slab evenly. This
diffusion generates the characteristic microcracking behavior commonly seen in ECC
Concrete SidewalkConcrete Railing
Rebar within Sidewalk & Railing making them defrom with Deck and Beams
Open Joint in Walk and Railing
Restraint Forces (Blue Arrows) Due to Inability of Concrete to Strain
Thermal Stresses
Thermal Stresses
Thermal Stresses
Thermal Stresses
C R A C K I N G
C R A C K I N G

- 102 -
material. However, if a stiff concrete sidewalk and barrier wall are constructed upon the
ECC link slab, and connected to the link slab by steel reinforcement, the ability of the
ECC material to deform freely is compromised. This may result in two failures
depending upon the amount shear transfer between sidewalk and ECC link slab. As
shown in Figure 6.50a, the stiff concrete sidewalk and barrier may restrain the link slab
from deforming over its entire length and localize all deformation at each end of the link
slab and immediately under the 1” expansion joint within the sidewalk and barrier at
reference line 2 (Figure 6.47). Another scenario may result in the link slab deformation
simply being transferred to the concrete sidewalk and barrier (Figure 6.50b), resulting in
large cracks within the sidewalk and barrier immediately above the link slab. This is less
likely however, since the low reinforcing ratio within the sidewalk and barrier is not high
enough to allow the concrete to deform in this manner. To achieve highly ductile
deformation in reinforced concrete before failure, similar to that seen in ECC material,
reinforcement ratios must typically be on the order of 4%+. Due to the low reinforcing
ratio within the sidewalk and barrier walls in the longitudinal direction, the likelihood of
achieving this highly ductile performance is unlikely. Therefore the likelihood of these
concrete members acting as a restraining member increases.
The ultimate impact of the concrete restraint on the ECC link slab would likely be
a large number of localized cracks forming at each end of the link slab at the gutter, along
with at the centerline of the link slab (under the 1” open joint in the sidewalk and barrier
wall) near the gutter. Once away from the gutter, these cracks would likely dissipate as
the restraint provided by the sidewalk and barriers at the edge of the bridge deck would
also dissipate.
A number of solutions were discussed to resolve this problem. Two such
solutions are shown in Figures 6.51 and 6.52.
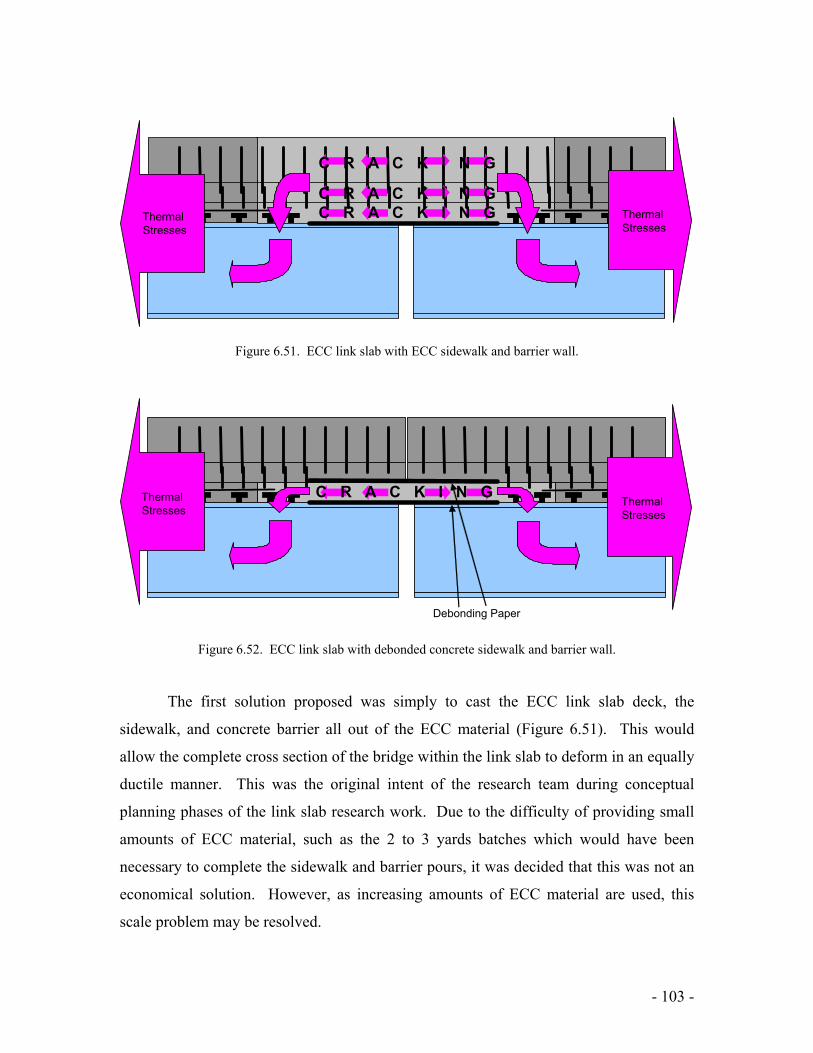
- 103 -
Figure 6.51. ECC link slab with ECC sidewalk and barrier wall.
Figure 6.52. ECC link slab with debonded concrete sidewalk and barrier wall.
The first solution proposed was simply to cast the ECC link slab deck, the
sidewalk, and concrete barrier all out of the ECC material (Figure 6.51). This would
allow the complete cross section of the bridge within the link slab to deform in an equally
ductile manner. This was the original intent of the research team during conceptual
planning phases of the link slab research work. Due to the difficulty of providing small
amounts of ECC material, such as the 2 to 3 yards batches which would have been
necessary to complete the sidewalk and barrier pours, it was decided that this was not an
economical solution. However, as increasing amounts of ECC material are used, this
scale problem may be resolved.
C R A C K I N GC R A C K I N G
C R A C K I N G
Thermal Stresses
Thermal Stresses
Thermal Stresses
Thermal Stresses
C R A C K I N G
Debonding Paper

- 104 -
A second more practical solution was also proposed which allowed the use of
concrete sidewalk and barrier wall, while still allowing the ECC link slab to deform as
intended (Figure 6.52). Within this solution, a second layer of debonding paper is used to
separate the ECC link slab from the concrete sidewalk and barrier. Additionally, no
reinforcement is placed connecting the sidewalk or barrier to the link slab. This allows
the ECC material, which is sandwiched between the steel girders and concrete sidewalk,
to strain freely. Floating freely on top of the ECC, the concrete sidewalk and barrier can
deform through the 1” expansion joint provided at reference line 2. Ultimately, this
solution was also abandoned due to the potential durability impacts of the freely floating
concrete sidewalk and barrier on top of the ECC link slab.
Within this demonstration project, the ECC link slab is not being used to
completely replace expansion joints within the Grove Street bridge. Rather, this
demonstration is intended to investigate the overall processing of the ECC material on a
large scale, introduce practicing engineers and contractors to the material, address any
implementation problems which may arise, and monitor the long term performance of the
ECC material under traffic and environmental loads. The Grove Street bridge, in
addition to the ECC link slab, has two conventional expansion joints to accommodate
thermal expansion and contraction within the structure. One expansion joint is on each
end of the main center spans at reference lines 1 and 3. The complete replacement of
expansion joints may be considered in the future, which is already accommodated within
the design examples provided in section three and Appendix D.
Using standard LRFD calculation procedures for stresses within the deck due to
temperature deformation (Section 3.12.3), the stress level in the link slab was calculated
accounting for the presence of the conventional link plate assembly and expansion joints
on either end of adjacent spans. The stress levels within the ECC link slab are shown in
Table 6.10 with associated calculations given in Appendix G. Within this table the
maximum tensile and compressive stresses in the ECC link slab are shown under two
conditions both with and without the concrete walk. Further, both a positive and negative
temperature gradient are shown, along with the uniform stresses due to temperature
change.

- 105 -
Table 6.10. Maximum Tensile and Compressive Stresses within the ECC Link Slab and ECC Link Slab
with Concrete Sidewalk Due to Positive and Negative Temperature Gradients and Uniform Stresses
ECC Deck
Maximum ECC Tensile Stress (ksi)
Maximum ECC Compressive Stress (ksi)
Temperature Gradient Increase 0.143 0.485Temperature Gradient Decrease 0.148 0.042
ECC Deck with Conc WalkTemperature Gradient Increase 0.149 N/ATemperature Gradient Decrease N/A 0.044
Uniform Stress 0.005 N/A
Within this specific application, the stress level within the link slab due to
temperature deformations within the adjacent spans remains far below the 500psi
cracking strength of the ECC material in tension (as seen in Table 6.10). Therefore, the
demand for tensile deformation within the link slab can be considered negligible. If the
link slab is never subjected to tensile loads or deformations, there remains little concern
over the restraint provided by the concrete sidewalk and barrier wall. In this
demonstration application the use of concrete sidewalk and barrier wall was permitted.
The impacts that these concrete elements may have on the overall performance of the link
slab will be monitored over time, and this design change may be disallowed if proven
detrimental to the link slab performance.
In addition to the concrete sidewalk and barrier walls, other construction practices
were found to interfere with the overall performance of the ECC link slab. One such
practice was the use of stay-in-place formwork under the link slab. As shown in Figure
6.29, it is essential that the link slab be able to deform over the entire length of the
debond zone. To allow for this, while still using stay-in-place formwork, it was
suggested to expand the use of the debonding material over the entire bottom side of the
link slab within the debond zone, rather than just over the girders. In this fashion, roofing
paper was placed over the entire debond zone over both the girders and the stay-in-place
formwork before casting of the link slab. This is one such example of the lessons learned

- 106 -
by accommodating the link slab technology to current construction practices, with the
understanding that some of these practices may have large unintended impacts on the
performance of the link slab. The ECC link slab design guidelines and other
accompanying documents have been altered to reflect these changes. Please see the
relevant appendices for complete details.

- 107 -
7.0 Load Testing
To validate the performance of the ECC link slab adopted for the Grove Street
Bridge, static load testing was proposed for the bridge immediately following its
construction. This opportunity permitted the design team to validate design assumptions
and to monitor the response of the ECC link slab under static loading. One design
assumption to be validated is that the ductile link slab element allows bridge spans to
behave as simply supported spans. In particular, the instrumentation adopted in the study
will focus upon two response parameters of the link slab under static loading. First, to
verify the live loading (AASHTO HS-25 truck load) does not induce beam end rotations
larger than those calculated in the design, the strain of the ECC link-slab top surface will
be measured under various loading scenarios. In addition, to validate the design
procedures for flexible link slab elements set forth by Li et al (2003), the rotation of the
steel girders will be measured immediately below the link slab. Measured beam rotations
can be used to theoretically determine the maximum strain in the link-slab surface;
predicted strains in the vicinity of measured surface strain would serve as verification of
the design process.
In order to examine the performance of the ECC jointless bridge under its most
severe design live load condition, an HS 25-44 truck is required to load the bridge during
testing. Due to the unavailability of an HS-25 truck and the safety requirements of the
State of Michigan, a truck that creates the equivalent load effect of an HS-25 truck was
selected. In particular, a 6-axle carting truck obtained from Hendrickson Trucking
(Jackson, Michigan) was selected for loading the Grove Street Bridge during static load
testing. Figure 7.1 shows the standard AASHTO specification of an HS 25-44 truck and
the loading details of the Hendrickson 6-axle truck used during load testing. Prior to load
testing, the trucks are accurately weighed using weigh scales at the trucking company and
at a high-precision highway load station (Grass Lake I-94 Weigh Station, Michigan)
operated by the Michigan State Police.

- 108 -
7.1 Predicted Bridge Response
Prior to load testing, an analytical model of the target bridge is formulated so as to
predict the response of the ECC link slab under static loading. Since construction of the
Grove Street Bridge is carried out in two phases with each phase constructing one half of
the bridge, a half-width analytical bridge model is formulated. The analytical model
assumes the link slab is sufficiently soft such that the spans on both sides of the link slab
behave as simply supported concrete deck-steel girder composite spans. Thus,
conservative responses (end rotation and surface strain) serving as upper limits for the
anticipate true response are calculated.
Figure 7.2 provides the half-width section details:
(a)
(b)
Figure 7.1. (a) AASHTO HS25 truck loading, (b) 6-axle carting truck used during load testing

- 109 -
33'-2" (including side walk)
9"
4@7'=28'1'-7" 3'-7"
Concrete
Steel Girder
18"
48"
0.625"
0.75"
1.75"
Single Steel Girder
Half Bridge Deck Cross Section
38.4"
N.A
Figure 7.2. Details of the half width bridge section
The following elastic properties are assumed for the concrete deck (since the load testing
was scheduled earlier than 28 days after casting, fc’ was assumed to be a lower value than
the design strength of 5000 psi):
psifc 4000'= Equation 7-1
ksifE cc 3605'57000 == Equation 7-2
The following properties are assumed for the steel:
ksiEs 29000= Equation 7-3
0.8==c
s
EE
n Equation 7-4
To carry out the analysis, the half-width bridge section is transformed to be made
of steel, as shown in Figure 7.3:

- 110 -
Figure 7.3. Transformed half width bridge section The properties of the transformed section (neutral axis and inertia) are then calculated:
bottomfromawayAN "6.37. = 4372542 inI total =
In the analysis, the Hendrickson 6-axles truck loading is used (see Figure 7.4):
18
12' 4'-6" 9'-6" 3'-9" 3'-9"
16 16 13 13 13 (kips)
Figure 7.4. HS25-44 axle loading profile
Based on the link slab design concept, a simply supported beam is modeled for
Span 2 & 3 (see Figure 7.5):
Figure 7.5. Simply supported beam model
By assuming elastic deformation and applying the superposition method, an
influence line analysis provides the location of the truck from the beam end, x, that
induces maximum beam end rotations. Here, the 111’-3” length corresponds to Span 2 &
3 spanning from the center line of the pin connection provided by the cantilever spans to
the center of the bridge pier.
111’-3”

- 111 -
Distance:
'66.34=x Maximum mid-span deflection (NOTE: link slab is designed to undergo elastic response
due to a maximum mid-span displacement of Lspan/800) and span end rotation due to the
corresponding load testing truck are:
in39.0=∆
rad00104.0=θ
Based upon this maximum relative span end rotation, the corresponding bending
moment developed in the link slab is then obtained (Caner and Zia 1998):
θdz
lsls L
EIM 2= Equation 7-5
where E is the elastic modulus of link slab material (here, ECC) and Ils is the section
moment of inertia of the link slab; Ldz is the length of debonding zone.
Due to the placement of roofing paper to debond the link slab from the girder
ends, E and I are associated with the material and section properties of the ECC link slab
only. Consistent with the guidelines specified by Caner and Zia (1998), the
reinforcement in the ECC link slab is neglected in this analysis. According to beam
theory, the strain on the central top surface of the link slab is:
µεθε 3.682 ===dz
ls
Ld
EI
dM Equation 7-6
where d is the depth of the link slab (9 in), and Ldz is the length of debonding zone (137
in).
7.2 Instrumentation Strategy
Instrumentation of the Grove Street Bridge is intended to assess the performance
of the ECC link-slab and the adjoining free spans of the bridge. The stated goals of

- 112 -
testing are to ascertain two response parameters of the bridge: 1) the rotation of the girder
ends of both simply supported spans in the vicinity of the link slab, and, 2) the maximum
tensile strain of the link slab top surface under static live loading conditions (HS25
trucks). Before describing the specific sensors selected, it should be noted that the Grove
Street Bridge is constructed in two stages. First, phase one specifies the removal of half
of the bridge deck with 2 lanes of bidirectional traffic directed to the remaining portion of
the bridge. Once the removed portion of the bridge is reconstructed and fully cured, it is
reopened to traffic with the other side of the bridge closed for reconstruction. The two
stages of construction allow the behavior of the link slab to be tested twice. First, the
half-section span newly constructed at the end of phase one, was tested on September 19,
2005 (which was roughly 9 days after the initial deck placement). After the second half
of the bridge was reconstructed, the full width bridge was tested on October 29, 2005
(which was roughly 12 days after the initial deck placement).
7.2.1 Strain Gage Installation upon the Link Slab Steel Reinforcement
The strain response of the ECC link slab element was monitored using strain
gages mounted to the continuous steel reinforcement that runs parallel to the bridge
centerline. The epoxy coating on the reinforcement steel was removed and thin film
strain gages (Texas Measurements FLA-5) were mounted to a flat smooth surface
machined on the steel face. The gage factor of these 120 Ω strain gages were 2 and their
Strain gage
(a) (b)
Figure 7.6. Metal foil strain gages embedded in link slab: (a) position within the link slab, and (b)
strain gage mounted to a reinforcement bar surface

- 113 -
gage length was 0.2 in. After the strain gages were securely mounted (Texas
Measurements CN bonding adhesive), epoxy was recoated upon the bar to protect it from
long-term corrosion. The wires that originate from the gages were carried to the slab’s
top surface where they connected to the data acquisition system. In total, six FLA-5
gages were installed upon the buried reinforcement in the link slab. Three gages were
mounted upon a reinforcement bar in the center of the reconstructed bridge span
completed in phase one while the remaining three were embedded in the reconstructed
span of phase two. Figure 7.6 provides details on the placement of the strain gages.
7.2.2 Strain Gage Installation upon the Link Slab Top Surface
Mounted to the top surface of the Grove Street Bridge link slab was an additional
set of metal foil strain gages (Texas Measurements metal-backing Strain Gage FLM-60-
(a)
Wireless sensing
unit
Metal foil strain gage
Bridge Diagnostics strain transducer
(b)
Figure 7.7. (a) Positions of surface strain gages, (b) instrumentation to measure link slab strain: metal foil strain gage, Bridge Diagnostics strain transducer and wireless sensing unit

- 114 -
11 with a 2.4 in. gage length, 2.0 gage factor and 120 Ω resistance). In total, 12 thin film
gages were mounted to the road surface. Six were installed in the center of the roadway
for the phase one link slab while the remaining six were installed upon the phase two slab.
As shown in Figure 7.7a, the surface mounted gages were situated immediately above the
strain gages surface mounted to the buried reinforcement (which are shown in Figure 7.6).
Since the anticipated strain level in the Grove Street Bridge was quite small (~70
µε), the metal foil strain gages mounted to both the reinforcement and link slab surface
might not be able to accurately measure the strain. As an alternative, a high precision
strain transducer manufactured by Bridge Diagnostics, Inc was adopted to measure the
link slab surface strain during phase two testing. The full bridge strain transducer had an
effective 3 in gage length and sensitivity of 300 µε/mV/V. To mount the strain
transducer to the link slab surface, pegs were first epoxy mounted to the bridge deck; the
strain transducer was then bolted to the pegs. Unlike all of the other transducers selected
in this study, the Bridge Diagnostics transducer was recorded using a data acquisition
system provided by Bridge Diagnostics. A picture of both a metal foil strain gage and
Bridge Diagnostic strain transducer are presented in Figure 7.7b.
7.2.3 Linear Variable Differential Transducers (LVDT) for Beam Rotation
To measure the rotation of the bridge spans located to the left and right of pier 2, a
set of identical LVDTs were installed at the top and bottom surfaces of two adjacent steel
beam webs. The LVDT selected in this study was the Novotechnik TR10 (maximum
displacement of 10 mm). Aluminum blocks to which the LVDTs could be screwed were
epoxy mounted to the girder webs. To attach the LVDTs to the adjacent girder ends,
another aluminum block was attached to the other girder. A small hook was screwed into
this second block so that a piece of fishing string could be attached between the LVDT
and hook. With one LVDT measuring the relative displacement of the girder tops and
another for measuring the relative displacement of the girder bottoms, an accurate means
of measuring beam rotation was derived. Two girders immediately below the center of
the roadway had LDVTs installed at the girder ends (the second and third girder as
counting from the side of the bridge). Please see Figure 7.8 for an illustration of the

- 115 -
LVDT configuration as well as a picture of the actual installation. Table 7.1 summarizes
the specifications of all the sensors used during the loading tests.
Table 7.1. Summary of sensing transducers
Texas Measurements
FLM-60-11
Texas Measurements
FLA-5
Bridge Diagnostics
Strain Sensor
Novotechnik TR-10 LVDT
Gage Length 2.4 in 0.2 in 3 in - Gage Factor 2 2 - - Resistance 120 Ω 120 Ω 350 Ω 1 kΩ Sensitivity - - 300 µε/mV/V 12.7 V/in
Stroke - - - 0.4 in DAQ System Wireless Wireless Wired (BDI) Wireless
7.2.4 Data Acquisition
For the collection of bridge response data, a wireless monitoring system
assembled from wireless sensing units was employed (Wang, Lynch and Law 2005). The
wireless sensing units are not sensor per se, but rather are autonomous nodes of a
wireless data acquisition system to which traditional sensors (e.g. accelerometers, strain
gages, among others) can be interfaced. The wireless sensors were assembled from off
the shelf electrical components to offer true 16-bit data acquisition capabilities. The
advantages of using a wireless monitoring system are their easy installation that can be
quicker than the installation time needed for wired systems. The wireless sensing units
employed in this study were academic prototypes designed and fabricated at the
University of Michigan. They featured 4-sensor channels for simultaneous data
collection. In addition, the wireless sensors could achieve communication ranges of up to
1000 ft. When deployed upon the Grove Street Bridge, the wireless sensing units were
powered by batteries (5 AA batteries) that offered an operational life expectancy of 30
continuous hours. A picture of the completed wireless sensing unit prototype employed
in this study is shown in Figure 7.9.
The wireless sensing unit was capable of reading sensor outputs ranging from 0 to
5 V. This permitted the LVDTs to be easily connected to the wireless sensors. However,
a large portion of the field study was the collection of data from strain gages. To
accommodate the reading of strain from strain gages in the field, a Wheatstone bridge
circuit was required. A separate signal conditioning board was designed and fabricated

- 116 -
that allows the 120 Ω strain gage to be connected to a Wheatstone bridge circuit with the
bridge output amplified and modulated on a 2.5 V mean signal. The result was a small
circuit that amplifies the bridge output by 50 before superimposing it upon a 2.5 V output
that was connected to the wireless sensing unit. A picture of the strain gage circuit is
shown in Figure 7.9b.
As previously described, the Bridge Diagnostic strain transducer required a
special data acquisition system (wired). The data acquisition system was the Structural
Testing System II from Bridge Diagnostics. This data acquisition system was a multi-
LVDTs
2nd girder from side walk
3rd girder from side walk
LVDTs
N
Girder 1
Girder 2
Girder 3
Girder 4
Girder 5
Girder 6
Girder 7
Girder 8
Girder 9
Girder 10
(a)
(b)
Figure 7.8. (a) Linear displacement transducers installation location and (b) LVDT mounted to the top of Girder 2’s web

- 117 -
(a) (b)
Figure 7.9. (a) Fully assembled wireless sensing unit prototype (battery and external container not shown for clarity) and (b) strain gage interface circuit
channel (maximum channel count of 128) system and had variable hardware gain on the
sensor channel inputs. Internally, the data acquisition system had an analog-to-digital
conversion resolution of 14-bits.
7.3 Loading Tests
Two HS-25 trucks were reserved for static load testing on both test dates
(September 19 and October 29, 2005). Prior to arrival on-site, the weight distribution of
each truck axle was measured. For load testing on September 19, 2005, the two trucks
are accurately measured at the Grass Lake Weigh Station. Due to the closure of this
weight station on the weekends, the trucks used on October 29 (Saturday) were weighed
using a less accurate scale at the trucking company. Table 7.2 summarizes the axle
weights for each set of trucks used during both load tests.
Table 7.2. Axle weights of trucks used for load testing
Load Test 1 (September 19, 2005) Load Test 2 (October 29, 2005) * Truck A Truck B Truck A Truck B
Axle 1(Front) 14830 lb 14680 lb 14800 lb 13380 lb Axle 2 15460 lb 16750 lb 15500 lb 18080 lb Axle 3 15430 lb 16310 lb 15500 lb 11520 lb Axle 4 15200 lb 11730 lb 14500 lb 16380 lb Axle 5 13590 lb 14250 lb 13610 lb 13180 lb Axle 6 (Back) 13740 lb 15250 lb 13990 lb 16500 lb
* Note: Measured at the trucking company (Hendrickson)

- 118 -
7.3.1 Phase One Load Testing - September 19, 2005
The first load test was intended to measure the static response of the link slab
under truck loading after the first stage of construction was completed. After phase one,
a 1 ft construction gap existed between the reconstructed bridge span and the original
span that remained open to traffic, as shown in Figure 7.10. This allowed the link slab in
its half width configuration to be loaded and its corresponding response measured. It
should be noted that the response of the link slab in this configuration would be
consistent with the analytical model previously presented where the bridge was
considered half width.
During this stage of load testing, two types of sensing transducer were installed:
LVDTs and metal foil strain gages. Unfortunately, a construction crew had cut the
fishing string between the LVDT and the hook. This situation was not noticed till the day
of testing (due to the absence of a variable sensor output during loading). With
accessibility to the LVDT limited, the day of testing did not leave sufficient time to repair
the fishing string. As a result, the rotation of the girder ends were not measured during
the load tests.
26'
26'
N
Figure 7.10. Plan view of bridge span loaded on September 19, 2005

- 119 -
0 200 400 600 800 1000 1200 1400 1600 1800
0
50
100
Test #1 Strain Responses−−S1
Time (sec)
Mic
ro S
trai
n
0 200 400 600 800 1000 1200 1400 1600 18000
50100150
Test #1 Strain Responses−−S2
Time (sec)
Mic
ro S
trai
n
0 200 400 600 800 1000 1200 1400 1600 1800
0
50
100
Test #1 Strain Responses−−S3
Time (sec)
Mic
ro S
trai
n
50 Hz
50 Hz
50 Hz
Figure 7.12. Strain response of link slab during Test #1
(a)
(b)
Figure 7.11. (a) Transverse truck location of Test #1; (b) Load plan for Test #1

- 120 -
Using the analytical model as a guide, two Hendrickson trucks were positioned
upon Span 2 and 3 in locations to induce maximum rotation of the beam ends. As shown
in Figure 7.11, the two trucks were slowly (5 mph) driven to a position 35 feet from the
center of the link slab with each side of the truck 10 feet away from the curb and edge of
construction gap. Once the trucks arrived to their position, they stopped and parked.
While the trucks were driven to this position, the wireless monitoring system was
recording (at 50 Hz) the strain from the three strain gages mounted to the reinforcement
(denoted as S1, S2 and S3 as shown in Figure 7.6a). In addition, the surface mounted
strain gages were simultaneously monitored, but the results from these gages suffered
from extreme zero-mean drifts and were not considered reliable. In contrast, the strain
gages mounted to the reinforcement bar provided good strain response measures of the
link slab. As shown in Figure 7.12, the mean strain at strain gage S2 was roughly 95 µε
while at S1 and S3 it was lower at 48 µε. This is expected since strain gage S2 was at the
center of the link slab while S1 and S3 were situated 2 ft from S1. At some location
along the length of the link slab, the link slab must have zero curvature suggesting the
strains would reduce as the measurement point is moved away from the link slab center.
As can be seen by the strain gage time history plots, the strain gages suffered from some
variation in their zero-mean signal.
During the second load test, the trucks were positioned on the same side of the
bridge. The two trucks drove to the 35 ft position from the link slab center in concert.
The trucks were held in this position for about 2 minutes before being requested to move
back to their initial position at the bridge abutment. The position of the trucks are shown
in Figure 7.13. Again, the strain in the reinforcement bar at strain gage locations S1, S2
and S3 were recorded by the wireless monitoring system throughout the duration of the
load test (again sampled at 50 Hz). The recorded response is presented in Figure 7.14.
When the bridge is initially loaded by the trucks, the strain in the link slab reinforcement
initially decreased due to the deflection of the cantilever span under the two trucks. This
deflection resulted in the cantilever pin connection to raise inducing compressive loading
on the link slab. Once the trucks crossed over the expansion joint located over the
cantilever pin connection, the strain in the link slab was tensile strain. Ultimately when
the trucks stopped, the strain in S1, S2 and S3 were 110, 51 and 43 µε, respectively. This

- 121 -
(a)
Figure 7.13. (a) Transverse truck location of Test #2; (b) Load plan for Test #2
result is reasonable considering two trucks are loaded on one side of the link slab;
therefore S1 should provide the greatest strain in the link slab. After one minute, the
trucks were requested to go in reverse to their original positions at the bridge abutment.
Two strain gages, S1 and S2, returned to their initial zero-mean position and S3 did not.
The maximum tensile strain before strain hardening was initiated in the ECC link slab is
above 150 µε. As a result, we conclude that the ECC link slab remained elastic during
both load test #1 and #2.

- 122 -
0 200 400 600 800 1000 1200−60
0
60
120Test #2 Strain Responses−−S1
Time (sec)M
icro
Str
ain
0 200 400 600 800 1000 1200−50−25
0255075
Test #2 Strain Responses−−S2
Time (sec)
Mic
ro S
trai
n
0 200 400 600 800 1000 1200−60
0
60
120Test #2 Strain Responses−−S3
Time (sec)
Mic
ro S
trai
n
Loading Stop
Reverse Off
Loading
Loading
Stop
Stop
Reverse
Reverse
Off
Off
Figure 7.14. Strain response of link slab during Test #2
To summarize the field experience during the first phase of testing, we see that
the strain gages on the link slab reinforcement provided reasonably accurate results for
strain. However, many of the metal foil gages suffered from mean drifts. In response to
the poor performance encountered, it was decided that for the second phase of testing, a
more accurate means of measuring surface strain in the link slab would need to be
selected. In response to this need, the Bridge Diagnostic strain measurement system was
explored for use in phase two static load testing.
7.3.2 Phase Two Load Testing (Full Width) - October 29, 2005
After phase two construction was completed, the bridge was again tested under
static loading. During this second phase of testing, the bridge was now full width with
the newly constructed portion joined to the span constructed during phase one.
Throughout the static load test, the phase one portion of the bridge was kept open to
routine traffic. Because the analytical model was based on a half width bridge section,
smaller responses from this loading test are anticipated. However, as will be shown in
the next section, a complete finite element model of the bridge was constructed to
provide a more accurate check on the numbers measured in the field. Prior to testing,

- 123 -
LVDTs were fastened to the ends of girders 2 and 3 (see Figure 7.8) to measure beam
rotations. In addition, it is decided to not employ metal foil strain gages due to their
serious zero mean drifts and to adopt the Bridge Diagnostics strain transducers securely
fastened to the link slab surface immediately above strain gage location S2. Figure 7.15
presents a plan view of the bridge with the side of the bridge reserved for loading testing
clearly labeled.
The tests were divided into several runs with different truck speeds and different
loading locations. In order to examine the sensitivity of the link slab response to loading
rate, two truck speeds were adopted: 5 and 10 mph. From the analytical model, the
maximum induced moment in the link slab occurs when the two trucks are moving
toward the link slab and stop with their first axels 35 feet away from the link slab center.
Figure 7.16 through 7.20 present the 5 different load tests prescribed for the Grove Street
Bridge on October 29, 2006. Test 1 consisted of the trucks driving (10 mph) from
opposite ends of the bridge and parking 35 ft from the link slab center to induce
maximum strain in the link slab. In a similar fashion, Test 2 achieved the same loading
position but the trucks are driven slower (5 mph). Test 3 had the two trucks on the same
side of the bridge driving at 10 mph to 35 ft from the link slab center. Test 4 droves the
trucks at 10 mph up to the link slab boundary. Finally, Test 5 droves one truck over from
one bridge end to the other at 10 mph; this test was not static and considered dynamic.
26'
26'
N
Figure 7.15. Plan view of bridge span loaded on October 29, 2005

- 124 -
(a)
(b)
Figure 7.16. (a) Transverse truck location of Test #1; (b) Load plan for Test #1
10 MPH 10 MPH

- 125 -
(a)
(b)
Figure 7.17. (a) Transverse truck location of Test #2; (b) Load plan for Test #2
5 MPH 5 MPH

- 126 -
(a)
(b)
Figure 7.18. (a) Transverse truck location of Test #3; (b) Load plan for Test #3
10 MPH

- 127 -
(a)
(b)
Figure 7.19. (a) Transverse truck location of Test #4; (b) Load plan for Test #4
10 MPH

- 128 -
(a)
(b)
Figure 7.20. (a) Transverse truck location of Test #5; (b) Load plan for Test #5
In each test, the strain response measured by the Bridge Diagnostics strain
transducer was recorded by the wired data acquisition system at a sample rate of 50 Hz.
In contrast, the LVDTs on girders 2 and 3 were measured by the wireless sensing units at
a sample rate of 100 Hz. After the relative beam displacement at the girder tops and
bottoms were recorded, the rotation of the girder ends were calculated. End rotations of
the girders were calculated by the following formula and geometry shown in Figure 7.21:
D)-(D)D-(D2h' tb +=θ Equation 7-7
h'2D)-(Dt)D-(D b +
=θ Equation 7-8
10 MPH

- 129 -
Figure 7.21. Determination of beam rotations based on LVDT readings
According to the link slab design concept proposed by Caner and Zia (1998), the
induced moment of the link slab due to end rotation could be obtained by:
θdz
lsls L
EIM 2= Equation 7-9
where E is the Young’s modulus of link slab material, ECC in this project, and I is the
moment inertia of link slab gross section only. Ldz is the length of debonding zone. In
this project, Ldz is equal to 137 in. As a result, the upper surface strain of link slab could
also be calculated based on the measured end rotation:
θεdz
ls
Ld
EI
dM== 2 Equation 7-10
where d is the depth of link slab. It should be noted that this formula is under the
assumptions of pure bending and a symmetric cross section of the link slab.
Figures 7.22 to 7.26 show the measured responses of the bridge under loading
posed by Tests 1 through 5, respectively, as well as derived results such as the link slab
strain calculated from the LVDT readings. In each figure, part (a) shows the top LVDT
reading, bottom LVDT reading, total rotation, and the calculated surface strain (using
Equation 7-10) in sequence, while part (b) shows the measured surface strain from the
Bridge Diagnostics transducers, the calculated surface strain from part (a), and a
comparison of the two. As seen for each test, a strong correlation existed between the

- 130 -
surface strain measurement and the strain obtained from the span end rotations. The only
test for which this correlation was not quite true was for Test 5 in which the truck was
driven across the whole bridge (dynamic loading).
Table 7.3 summarizes all of the test results acquired during both phase one and
two of the study. The measured strain refers to strain responses recorded by the strain
gages on the reinforcement bars in phase one and by the surface strain gages during phase
two. The girder end rotations for the second and third girder of the full width span (see
Fig. 7.8) were calculated based on the readings of relative displacement recorded by the
LVDTs installed on the girders. The estimated strains were based on the design relations
provided by Caner and Zia (1998) (Equation 7-10) and were calculated using the
measured girder rotations. As predicted, these estimated surface strains were within 20%
of those measured by the strain transducer. This observation directly justifies the
feasibility of the ECC link slab design concept. Moreover, all of the measured link slab
responses, including surface strains and span end rotations, were much smaller than those
predicted by the analytical model. This is expected since the analytical model was based
on a half width bridge section where as during these load tests, the bridge was full width.
Finally, the load tests again confirmed the ECC link slab was well within its elastic
response regime under the different truck loadings.
Table 7.3. Summary of static load test results
PHASE I PHASE II Test 1 Test 2 Test 1 Test 2 Test 3 Test 4 Test 5
Measured Strain
95 µε (Rebar)
110 µε (Rebar)
42.1 µε (Slab Surf)
52.6 µε (Slab Surf)
27.6 µε (Slab Surf)
22.4 µε (Slab Surf)
36.8 µε (Slab Surf)
Girder 2 (G2) Rotation (Rad) N/A N/A 0.00075411 0.00075089 0.00084940 0.00060788 0.00098170
(Max) Strain Estimate
from Rotation G2 N/A N/A 49.5 µε 49.3 µε 27.9 µε 20.0 µε 32.2 µε
% Difference N/A N/A 17.5% -6.3% 1.1% -10.7% -12.5% Girder 3 (G3) Rotation (Rad) N/A N/A 0.00076077 0.00068957 0.00071902 0.00055954 0.00093874
(Max) Strain Estimate
from Rotation G3 N/A N/A 50.0 µε 45.3 µε 23.6 µε 18.4 µε 30.8 µε
% Difference N/A N/A 18.7% -13.9% -14.5% 17.8% -16.3%

- 131 -
0 50 100 150 20005
10x 10
−3 Test1 LVDT−−Second Girder−−Top
Time (sec)D
isp.
(in
)
0 50 100 150 200−0.04−0.02
0Test1 LVDT−−Second Girder−−Bottom
Time (sec)
Dis
p. (
in)
0 50 100 150 200−5
05
10x 10
−4 Test1 Second Girder Rotation
Time (sec)
Rot
atio
n (r
ad)
0 50 100 150 200−20
0204060
Test1 Calculated Surface Strain (from LVDTs)
Time (sec)
Mic
ro S
trai
n
(a)
0 50 100 150 200−20
0
20
40
60Test1 Measured Surface Strain
Time (sec)
Mic
ro S
trai
n
0 50 100 150 200−20
0204060
Test1 Calculated Surface Strain (from LVDTs)
Time (sec)
Mic
ro S
trai
n
0 50 100 150 200−20
0
20
40
60Strain Comparison
Time (sec)
Mic
ro S
trai
n
MeasuredCalculated
(b)
Figure 7.22. Test #1 results (a) LVDT measurement (b) Strain gage measurement

- 132 -
0 10 20 30 40 50
05
1015
x 10−3 Test2 LVDT−−Second Girder−−Top
Time (sec)D
isp.
(in
)
0 10 20 30 40 50−0.04−0.02
0Test2 LVDT−−Second Girder−−Bottom
Time (sec)
Dis
p. (
in)
0 10 20 30 40 50−5
05
10x 10
−4 Test2 Second Girder Rotation
Time (sec)
Rot
atio
n (r
ad)
0 10 20 30 40 50−20
0204060
Test2 Calculated Surface Strain (from LVDTs)
Time (sec)
Mic
ro S
trai
n
(a)
0 10 20 30 40 50−20
0
20
40
60Test2 Measured Surface Strain
Time (sec)
Mic
ro S
trai
n
0 10 20 30 40 50−20
0204060
Test2 Calculated Surface Strain (from LVDTs)
Time (sec)
Mic
ro S
trai
n
0 10 20 30 40 50−20
0
20
40
60Strain Comparison
Time (sec)
Mic
ro S
trai
n
MeasuredCalculated
(b)
Figure 7.23. Test #2 results (a) LVDT measurement (b) Strain gage measurement

- 133 -
0 20 40 60 80 100024
x 10−3 Test3 LVDT−−Second Girder−−Top
Time (sec)D
isp.
(in
)
0 20 40 60 80 100−0.03−0.02−0.01
0
Test3 LVDT−−Second Girder−−Bottom
Time (sec)
Dis
p. (
in)
0 20 40 60 80 100−5
05
10x 10
−4 Test3 Second Girder Rotation
Time (sec)
Rot
atio
n (r
ad)
0 20 40 60 80 100−10
0102030
Test3 Calculated Surface Strain (from LVDTs)
Time (sec)
Mic
ro S
trai
n
(a)
0 20 40 60 80 100−10
0
10
20
30Test3 Measured Surface Strain
Time (sec)
Mic
ro S
trai
n
0 20 40 60 80 100−10
0102030
Test3 Calculated Surface Strain (from LVDTs)
Time (sec)
Mic
ro S
trai
n
0 20 40 60 80 100−10
0
10
20
30Strain Comparison
Time (sec)
Mic
ro S
trai
n
MeasuredCalculated
(b)
Figure 7.24. Test #3 results (a) LVDT measurement (b) Strain gage measurement
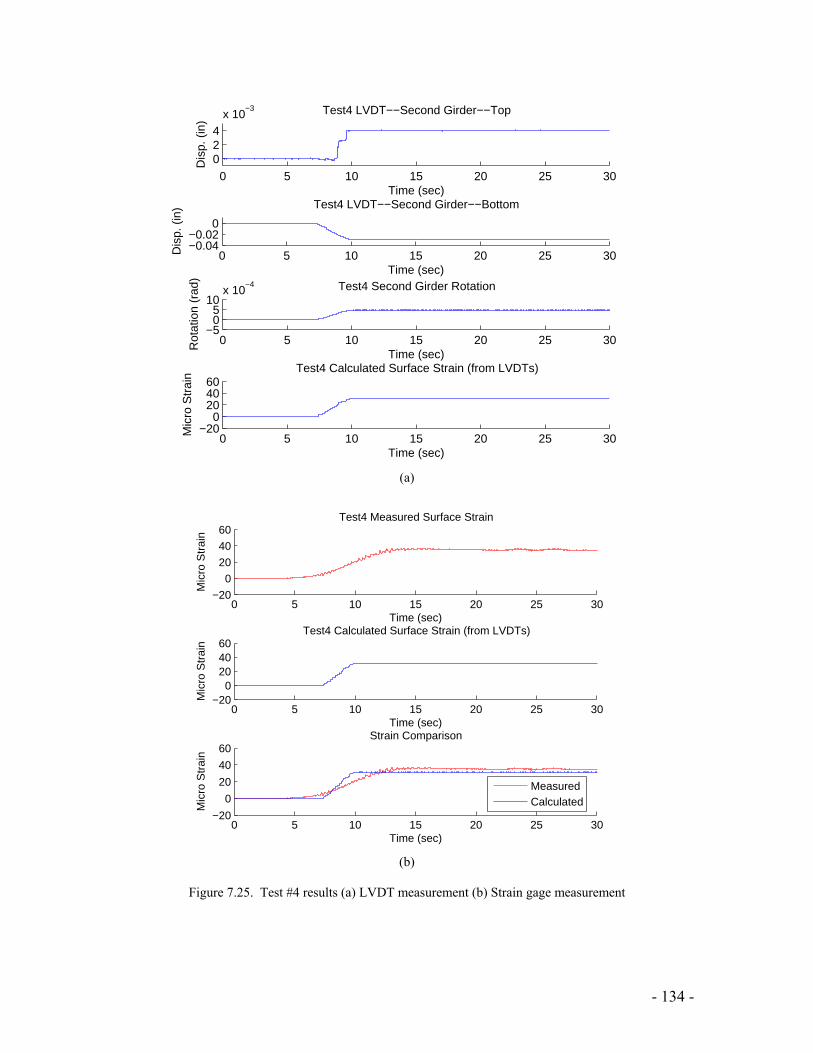
- 134 -
0 5 10 15 20 25 30024
x 10−3 Test4 LVDT−−Second Girder−−Top
Time (sec)D
isp.
(in
)
0 5 10 15 20 25 30−0.04−0.02
0
Test4 LVDT−−Second Girder−−Bottom
Time (sec)
Dis
p. (
in)
0 5 10 15 20 25 30−5
05
10x 10
−4 Test4 Second Girder Rotation
Time (sec)
Rot
atio
n (r
ad)
0 5 10 15 20 25 30−20
0204060
Test4 Calculated Surface Strain (from LVDTs)
Time (sec)
Mic
ro S
trai
n
(a)
0 5 10 15 20 25 30−20
0
20
40
60Test4 Measured Surface Strain
Time (sec)
Mic
ro S
trai
n
0 5 10 15 20 25 30−20
0204060
Test4 Calculated Surface Strain (from LVDTs)
Time (sec)
Mic
ro S
trai
n
0 5 10 15 20 25 30−20
0
20
40
60Strain Comparison
Time (sec)
Mic
ro S
trai
n
MeasuredCalculated
(b)
Figure 7.25. Test #4 results (a) LVDT measurement (b) Strain gage measurement

- 135 -
0 10 20 30 40 5005
1015
x 10−3 Test9 LVDT−−Second Girder−−Top
Time (sec)D
isp.
(in
)
0 10 20 30 40 50−10
−50
x 10−3 Test9 LVDT−−Second Girder−−Bottom
Time (sec)
Dis
p. (
in)
0 10 20 30 40 50−5
05
10x 10
−4 Test5 Second Girder Rotation
Time (sec)
Rot
atio
n (r
ad)
0 10 20 30 40 50
0
20
40Test5 Calculated Surface Strain (from LVDTs)
Time (sec)
Mic
ro S
trai
n
(a)
0 10 20 30 40 50
0
20
40Test5 Measured Surface Strain
Time (sec)
Mic
ro S
trai
n
0 10 20 30 40 50
0
20
40Test5 Calculated Surface Strain (from LVDTs)
Time (sec)
Mic
ro S
trai
n
0 10 20 30 40 50
0
20
40Strain Comparison
Time (sec)
Mic
ro S
trai
n
MeasuredCalculated
(b)
Figure 7.26. Test #5 results (a) LVDT measurement (b) Strain gage measurement
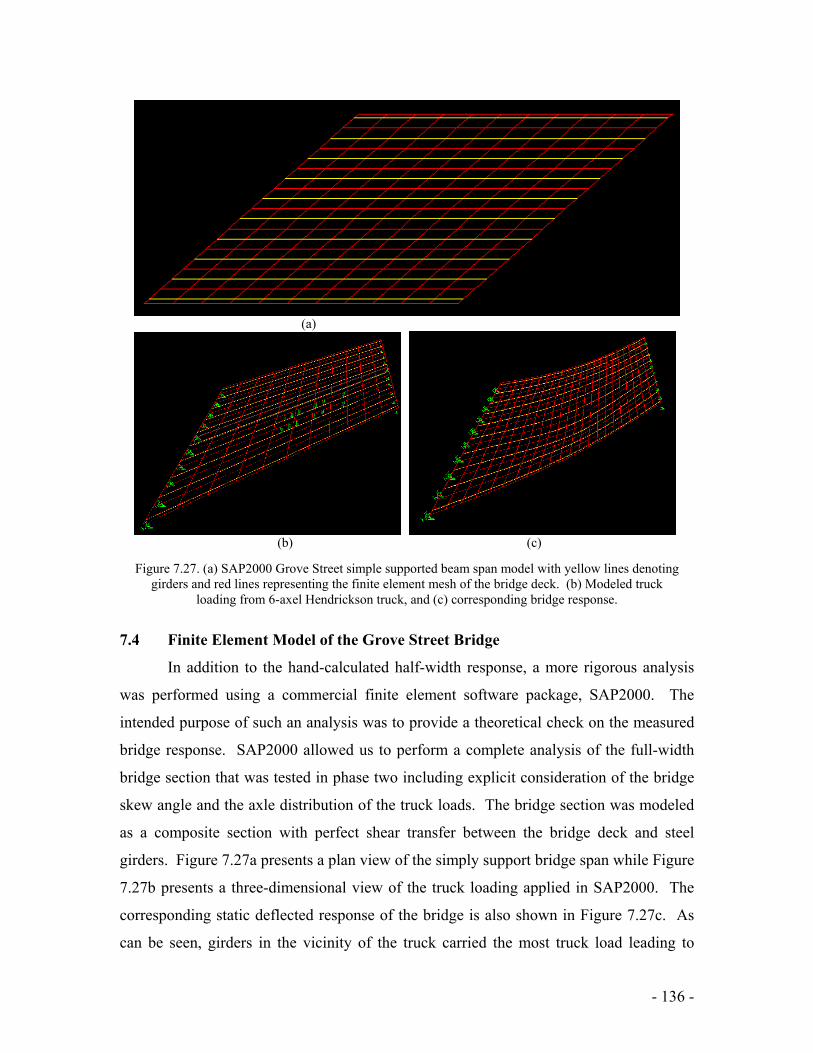
- 136 -
7.4 Finite Element Model of the Grove Street Bridge
In addition to the hand-calculated half-width response, a more rigorous analysis
was performed using a commercial finite element software package, SAP2000. The
intended purpose of such an analysis was to provide a theoretical check on the measured
bridge response. SAP2000 allowed us to perform a complete analysis of the full-width
bridge section that was tested in phase two including explicit consideration of the bridge
skew angle and the axle distribution of the truck loads. The bridge section was modeled
as a composite section with perfect shear transfer between the bridge deck and steel
girders. Figure 7.27a presents a plan view of the simply support bridge span while Figure
7.27b presents a three-dimensional view of the truck loading applied in SAP2000. The
corresponding static deflected response of the bridge is also shown in Figure 7.27c. As
can be seen, girders in the vicinity of the truck carried the most truck load leading to
(a)
(b) (c)
Figure 7.27. (a) SAP2000 Grove Street simple supported beam span model with yellow lines denoting
girders and red lines representing the finite element mesh of the bridge deck. (b) Modeled truck loading from 6-axel Hendrickson truck, and (c) corresponding bridge response.
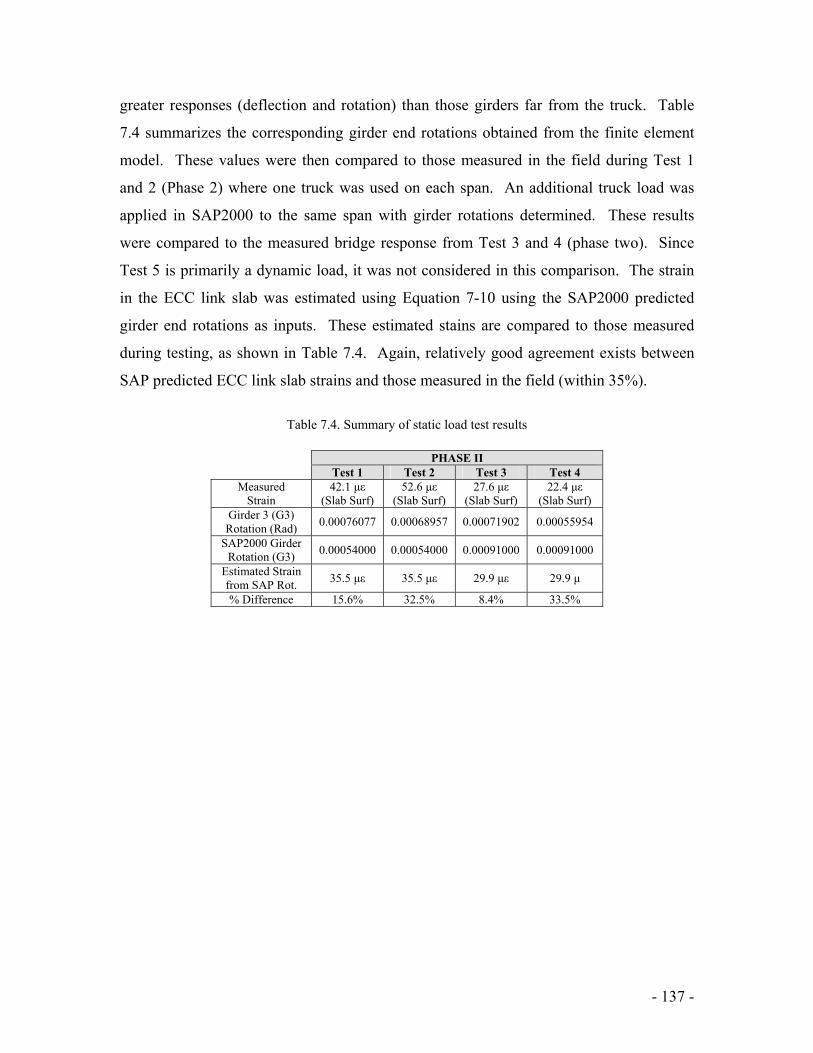
- 137 -
greater responses (deflection and rotation) than those girders far from the truck. Table
7.4 summarizes the corresponding girder end rotations obtained from the finite element
model. These values were then compared to those measured in the field during Test 1
and 2 (Phase 2) where one truck was used on each span. An additional truck load was
applied in SAP2000 to the same span with girder rotations determined. These results
were compared to the measured bridge response from Test 3 and 4 (phase two). Since
Test 5 is primarily a dynamic load, it was not considered in this comparison. The strain
in the ECC link slab was estimated using Equation 7-10 using the SAP2000 predicted
girder end rotations as inputs. These estimated stains are compared to those measured
during testing, as shown in Table 7.4. Again, relatively good agreement exists between
SAP predicted ECC link slab strains and those measured in the field (within 35%).
Table 7.4. Summary of static load test results
PHASE II Test 1 Test 2 Test 3 Test 4
Measured Strain
42.1 µε (Slab Surf)
52.6 µε (Slab Surf)
27.6 µε (Slab Surf)
22.4 µε (Slab Surf)
Girder 3 (G3) Rotation (Rad) 0.00076077 0.00068957 0.00071902 0.00055954
SAP2000 Girder Rotation (G3) 0.00054000 0.00054000 0.00091000 0.00091000
Estimated Strain from SAP Rot. 35.5 µε 35.5 µε 29.9 µε 29.9 µ % Difference 15.6% 32.5% 8.4% 33.5%

- 138 -
8.0 Conclusions
Within this demonstration project, a new cementitious composite was used on a
bridge deck within Michigan to replace a conventional joint within the deck. The
composite used, called Engineered Cementitious Composites or ECC, shows a unique
behavior of pseudo-strain hardening under tensile loads. The design concepts behind this
work have been detailed by others (Caner and Zia, 1998, Li et al, 2003). The initial
portions of this work specifically focused on the authoring of design guidelines,
contractual bidding documents, and material specifications. This was followed by
extensive demonstration of ECC materials processing in conventional concrete mixing
trucks, and ultimately casting of an ECC link slab within a bridge in southeast Michigan.
Following the construction, the bridge was load tested to examine the impact of the link
slab on the overall structural response. Photographs of the completed link slab project
are shown in Figures 8.1 – 8.4
Figure 8.1 Completed Grove Street Bridge – deck view
Figure 8.2 Completed ECC Link Slab

- 139 -
To begin the design of the link slab, a series of design guidelines, example
calculations, and sample material specifications were authored and provided to Michigan
Department of Transportation structural designers to incorporate an ECC link slab into
the design of the Grove Street bridge in southeast Michigan. Numerous conversations
with the designers resulted in the finalization of a full set of design aids for future
implementation of ECC link slab technology. These have been included within this
report as appendices.
Following the authoring of design and construction documents, preliminary steps
leading toward large scale trial mixing of ECC were undertaken. Prior to concrete truck
mixing, grain size distribution analysis was conducted, and preliminary test mixes in a
gravity mixing (capacity of 7 cubic feet) were completed. The 0.5” long PVA fiber used
previously in M45 ECC was changed to 0.33” long PVA fiber to promote easier mixing
and better fiber dispersion in a gravity mixer. A local concrete supplier was then
contracted to perform a series of trial mixes to process 1, 2, and 4 cubic yard trial batches
of ECC material. These trial mixes were intended to provide meaningful lessons on the
mixing of large amounts of ECC material in conventional concrete mixers.
The large scale mixes concluded by finding that large scale mixing of ECC material is
possible and can result in a material that is both high performing and commercially
viable. Using the batching sequence in section 4.6, the overall mixing of the material can
proceed quite smoothly and result in a fresh material that is homogeneous, flowable, and
Figure 8.3 Grove Street Pier Two Under Completed ECC Link Slab
Figure 8.4 Completed Grove Street Bridge – elevation view

- 140 -
rheologically stable. Further, the ECC material can maintain these fresh properties up to
the one hour time limit that is mandated by the ECC special provision. As was
demonstrated in the four cubic yard trial, the material can be batched at the plant,
transported a considerable distance, and still maintain its characteristically unique fresh
properties.
Testing of the hardened mechanical properties of large scale trial materials has
shown that the compressive strength gain of these materials is similar to that of laboratory
mixes, and continues to meet all requirements set forth within the special provision.
While tensile performance does exhibit a reduction from that typically seen in laboratory-
grade ECC material, the tensile mechanical performance thus far also continues to meet
all requirements set forth in the special provision. Further, ECC material has been shown
able to be cast on a 2% cross-slope, simulating the crown of a typical MDOT bridge.
While the final finishing of this material may pose new challenges to a bridge contractor,
an experienced concrete finisher should be able to finish this material with minimal
difficulty.
Following the three trial mixes, close coordination with the Grove Street bridge
contractor and project manager was maintained up until the time of link slab construction.
During this time a number of submitted raw material substitutions were approved by the
research team after laboratory testing of the new material compositions. Further, a four
cubic yard demonstration mix was completed by the material supplier contracted for the
link slab construction. As in the three trial mixes, this demonstration validated that ECC
material mixed in trucks is similar to that of laboratory mixes, and continues to meet all
requirements set forth within the special provision. Additionally, this demonstration
provided essential experience for the bridge contractor in placing and finishing the fresh
ECC material.
In accordance with the bridge contractor’s schedule, the first phase of the link slab
was cast in early September, 2005 requiring 20 cubic yards of ECC material. This
material was then tested for both compressive and tensile response, and determined equal
to material processed previously and in accordance with the ECC special provisions
within the construction contract. However, immediately following the placement of the
first phase of the partial width construction, a large number of shrinkage cracks were

- 141 -
found within the ECC link slab. These cracks are considered shrinkage cracks due to
their appearance at early age, their formation around reinforcing bars acting as stress
concentrators, and the full-depth nature of the cracking. After further laboratory testing
these were attributed to the possibility of higher water to cement ratios within the mix
due to excessive washing of the concrete trucks. To accommodate these conditions,
slight changes in the ECC mix design were made, and a significant reduction in cracking
was seen after the completion of phase two of the ECC link slab construction in late
October, 2005. Finally the completed bridge was opened to traffic on Monday, October
25, 2005. Further reductions in cracking will be investigated in future investigations.
Finally, a full scale load test was conducted to explore the response of an ECC
link slab constructed within the Grove Street Bridge. A series of loading tests have been
performed to validate the response of the ECC link slab, in both half- and full-width
configuration. Two main response parameters of interest included, surface strains of
ECC link slab and span end rotations; both are closely monitored during the two stages of
static load tests. To measure these responses, two kinds of data acquisition systems were
employed. A wireless monitoring system, designed and fabricated at the University of
Michigan is the primary data acquisition system that reliably collects displacement data
from LVDTs and strain data from metal foil strain gages. To enhance the quality of link
slab surface strain measurements, a separate wired data acquisition system is adopted to
read strain measurements from Bridge Diagnostic strain transducers.
A direct comparison of the responses measurements collected by these two data
acquisition systems reveal strong correlation between girder rotations and strain
measured upon the link slab surface. This compatibility between predicted strain from
LVDT measurements and actual surface strain measured by the strain transducers
validate the link slab design methodology. Based on the field measurements, maximum
tensile strain of the ECC link slab is roughly 110 µε, which is less than its elastic limit
(anticipated to be approximately 150 µε). In addition, the maximum end span rotation in
this series of loading test is well below 0.00375 rad, which corresponds to a maximum
live load deflection of L/800. As a result, it can be concluded that the ECC link slab is
expected to perform as designed.

- 142 -
The above conclusions support the contention that durable jointless concrete
bridge decks may be design and constructed with ECC link slabs. Based on the above
findings and with the future correction of excessive shrinkage cracking, it is
recommended that the use of ECC link slabs can result in dramatically increased
performance of concrete bridge decks within Michigan.
- 143 -
9.0 Future Research Needs
As was discussed in sections 6.3 and 6.7, early age cracking was found in the ECC
link slab after approximately 3 days. Figures 6.22 and 6.44 show the cracking pattern
and associated crack widths within the link slab. Although the structural functionality of
ECC link slab is not affected by this early age cracking due to the tensile strain hardening
properties of ECC as discussed in section 6.3, the long-term durability of the link slab is a
concern since crack widths are approximately 0.007” and large enough for aggressive
corrosion agents to penetrate to the steel reinforcement.
Several potential causes of those early age cracks have been identified and
itemized. The early age cracking observed in the link slab can be a combination result of
these potential sources.
High restraint – Dense steel reinforcing bars connected to the adjacent concrete
deck and shear studs with the link slab transition zone provide restraint to
shrinkage deformation within the ECC link slab. These mechanical interlocking
mechanisms restrain any change of volume in the slab due to early age shrinkage.
Excessive shrinkage – The ECC material version used in the Grove street link
slab has a larger free shrinkage compared to that of normal concrete due to high
cement content in ECC. This material property has been known about ECC for
some time, yet in all other circumstances shrinkage deformation resulted in the
formation of tightly spaced microcracking, rather than larger macrocracks.
Epoxy reinforcement as stress concentrator – Nearly all cracks within the Grove
Street link slab (shown in Figures 6.22 and 6.44) seem to initiate from steel
reinforcement (Figure 6.20). Those “holes” created by the epoxy coated rebars
within the ECC link slab can serve as stress concentrators and crack initiators due
to change of geometry and weak bonding between ECC and epoxy coated
reinforcements.
Early age shrinkage before σ-δ curve development – The tight crack width in the
hardened ECC is a result of effective fiber bridging provided by the present of
micro polymer fibers and optimized fiber/matrix interface properties. This fiber
bridging is quantified through the stress versus crack opening relation (i.e. σ-

- 144 -
δ relation) within the ECC material. Typically, this fiber bridging is built up with
time. In most cases, once mechanical loads are applied to the material, the σ−δ
relation has developed enough to resist any localized cracking. At early age
however, the σ-δ curve has not been fully developed, and therefore a larger crack
width can appear due to early age shrinkage.
Thermal gradient - Within the full scale link slab application, a higher hydration
temperature may have been realized in the field due to the larger pour size
compared to that in the laboratory. A larger pour size has two effects on
hydration heat. First, the larger volume to surface ratio of such large pours
decreases the amount of heat dissipated at early age resulting in higher internal
temperatures. Second, these higher internal temperatures act as a catalyst for
faster hydration exacerbating the problem even further. Ultimately, this higher
reaction temperature promotes highly accelerated early age hydration reactions
and introduces larger early age shrinkage strains and thermal stress gradients.
High skew angle – It is commonly known that bridge decks with a high skew
angle are particularly susceptible to shrinkage cracking at acute angle bridge
corners due to excessive restraint within that area. Within the ECC link slab,
cracking at the acute angle corners was also observed. The presence of a 45º
skew angle within the link slab may be a source for some crack formation.
In response to the above cracking mechanisms, several possible solutions are
viable. Since minimum steel reinforcement is required by AASHTO design codes,
removing the stress concentrators (epoxy coated reinforcement) is not a feasible solution.
Therefore, focus will be put on ECC material redesign to overcome the formation of early
age cracking. However, the newly developed ECC material should retain required
properties for the durable link slab application (i.e. fresh and hardened properties outlined
in Appendix D). Two approaches can be used to prevent early age cracking and/or to
reduce the width of any early age cracks which form. The first approach is to reduce the
cracking tendency of the ECC material. This can be done by lowering early age
shrinkage deformations within ECC. The second approach is increase the resistance to

- 145 -
shrinkage cracking within the material which relies on faster development of fiber
bridging (i.e. σ−δ relation) at early age.
Reducing early age shrinkage: Anti-shrinkage agents and expansive cements have
recently been used in ECC material incorporated within an ECC/steel composite deck
cable-stayed bridge in Japan. No early age cracking was found in that ECC full scale
application. It is expected that similar results can be obtained by applying these measures.
However, these agents may increase the cost of ECC material. Other methods, such as
increasing the amount of fly ash, using water absorbing media, or adopting low heat
hydration cement can reduce the early age shrinkage of ECC by lowering the amount of
cement, providing water throughout hydration to prevent autogenous shrinkage, and/or
reducing hydration temperature. All of these techniques will be considered in reducing
early age shrinkage within the ECC material.
Faster σ-δ development: To prevent wide crack width at early age, it is critical to
promote fiber bridging development soon after initial setting. It has been shown that a
tight crack width (0.0004”) can be achieved at age of 4 hours in versions of high early
strength ECC (Li 2005). That research indicates a faster σ-δ development compared to
that of ECC versions used on the Grove Street bridge. Reducing the dosage of hydration
stabilizer may be able to help the early development of fiber bridging, along with the use
of hydration accelerants.
Development of an ECC mixture which meets all requirements set by the ECC
material special provision set forth within Appendix D while maintaining tight crack
widths at both early age and over the complete service life is the last remaining hurdle
towards implementation of ECC link slab technology. Numerous hurdles have already
been overcome, such as the guidelines for ECC link slab design, the batching and mixing
sequences for large scale commercial concrete batching plant production, and
familiarization of MDOT personnel, contractors, and subcontractors with ECC material
and link slab technology. While complex in nature, the laboratory work remaining
towards the goal of full implementation is expected to result in a final version of ECC
material meeting all requirements and ready for future link slab projects across Michigan.

- 146 -
10.0 References
American Assoication of State Highways Transportation Officials (AASHTO), 1998,
LRFD Bridge Design Specifications, Washington D.C.
AASHTO, 2002, Standard specification for high way bridges, 16th edition, American
Association of State Highway and Transportation Officials, Washington D.C.
American Concrete Institute (ACI). 1995. “Design Code Specifications and Commentary
for Reinforced Concrete Structures”, American Concrete Institute. Detroit, Michigan.
Caner, A. and P. Zia, 1998, Behavior and Design of Link Slabs for Jointless Bridge
Decks, PCI Journal, May-June, pp. 68-80
Fischer, G., S. Wang, V.C. Li, 2003, Design of Engineered Cementitious Composites for
Processing and Workability Requirements, Seventh International Symposium on
Brittle Matrix Composites, Warsaw, Poland, pp. 29-36
Fuller, W.B, and S.E. Thompson, 1907, The Laws of Proportioning Concrete, ASCE 59,
pp. 67-143
Gilani, A. and Jansson, P., 2004, “Link Slabs for Simply Supported Bridges.” MDOT
Report Number MDOT SPR-54181, Structural Research Unit, Construction and
Technology Support Area, Michigan Department of Transportation. Lansing,
Michigan.
Funk, J.E. and D.R. Dinger, 1994, Particle Packing, Part VI – Applications of Particle
Size Distribution Concepts, Interceram, Vol. 43 No. 5, pp. 350-353
Kanda, T., T. Saito, N. Sakata, and M. Hiraishi, 2002, Fundamental Properties of Direct
Sprayed ECC, Proceedings of the JCI International Workshop on Ductile Fiber
Reinforced Cementitious Composites (DFRCC), Takayama, Japan, pp. 133-141
Kanda, T., H. Hiraishi, and N. Sakata, 2003, Tensile Properties of ECC in Full Scale
Production, Proceedings of the Fifth International Conference on Fracture Mechanics
of Concrete, Vail, Colorado, pp. 1013-1020
Kong, J.H., Bike, S. and Li, V.C., 2003 “Development of a Self-Consolidating
Engineered Cementitious Composite Employing Electrosteric

- 147 -
Dispersion/Stabilization”. Journal of Cement and Concrete Composites. Vol. 25 No.
3. pp. 301-309.
Li, V.C., 2002, Reflections on the Research and Development of Engineered
Cementitious Composites (ECC), Proceedings of the JCI International Workshop on
Ductile Fiber Reinforced Cementitious Composites (DFRCC) - Application and
Evaluation (DRFCC-2002), Takayama, Japan, Oct. pp.1-21.
Li, V.C., and G. Fischer, 2002, Reinforced ECC - An Evolution from Materials to
Structures, Proceedings of the First FIB Congress, Osaka, Japan, pp.105-122.
Li, V.C., G. Fischer, Y. Kim, M. Lepech, S. Qian, M. Weimann, and S. Wang, 2003,
Durable Link Slabs for Jointless Bridge Decks Based on Strain-Hardening
Cementitious Composites, Department of Civil and Environmental Engineering,
University of Michigan, pp. 1-96
Li. V.C., M. Li, and M. Lepech, “Progress Report on High Performance Material for
Rapid Durable Repair of Bridges and Structures” Submitted to MDOT, Nov. 2005.
MDOT Report Number MDOT SPR-54181, Structural Research Unit, Construction and
Technology Support Area, Michigan Department of Transportation. Lansing,
Michigan.
Michigan Department of Transportation (MDOT), 2003, Average Annual Daily Traffic
Maps, Michigan Department of Transportation, Lansing, Michigan
Ortega, F.S., R.G Pileggi, P. Sepulveda, and V.C. Pandolfelli, 1999, Optimizing Particle
Packing in Powder Consolidation, The American Ceramic Society Bulletin, pp. 106-
111
Wing, K. M., and Kowalsky, M. J., 2005, “Behavior, analysis, and design of an
instrumented link slab bridge,” ASCE Journal. of Bridge Engineering, May-June,
pp.331-344.
Wang, Y., Lynch, J. P. and Law, K., 2005, “A wireless structural health monitoring
system with multithreaded sensing devices: design and validation,” Structure and
Infrastructure Engineering, Taylor & Francis Group, United Kingdom, in press.
Zia, P., A. Caner, and El-Safte, A.K., 1995, Jointless Bridge Decks, Research Project
23241-94-4, Center for Transportation Engineering Studies, North Carolina State
University, pp. 1-117

A 1
11.0 Appendix A

A 2
A pool of 20 M45 tests were selected for verification of assumed M45 design
values, Figure A.1 shows additional stress-strain curves. Table A.1 shows the
accompanying statistical variations associated with these curves.
Figure A.1. Additional M45 Stress-Strain Curves
Table A.1. Statistical Variation of Assumed Design Values for M45 ECC
Mean Standard DeviationFirst Cracking Strain 0.023 0.004 Yield Strength 640psi 43psi Strain Capacity 3.1% 0.40%
0
100
200
300
400
500
600
700
800
900
0 0.5 1 1.5 2 2.5 3 3.5
Strain, ε (%)
Stre
ss, σ
(MPa
)

B 1
12.0 Appendix B

B 2
ECC Link Slab Design Example and Theoretical Basis
Prepared by the Advanced Civil Engineering Materials Research Laboratory Department of Civil and Environmental Engineering, University of Michigan October 28, 2004 Revised: December 21, 2005
Additional background information on this design procedure can be found in
MDOT C&T Research Report RC-1438 “Durable Link Slabs for Jointless Bridge Decks
Based on Strain Hardening Cementitious Composites” The design guidelines for an ECC
link slab were laid out previously in Li et al (2003). The following is a design example of
ECC link slab based on the concrete link slab design example provided to MDOT designers
by the MDOT Construction & Technology Division to aid in link slab design.
Given:
Centerline to Centerline Bearing = L = L1 = L2 = 61’-0”
Beam Spacing = S = 6’-0”
Gap Between Opposing Beam Ends = GAP = 2”
Elastic Modulus of Reinforcing Steel = Esteel = 29,000 ksi
Elastic Modulus of ECC = EECC = 2900 ksi
Deck Thickness = ts = 9”
TensileYield Strength of ECC = f’t = 500 psi
Yield Strain of ECC Material = 0.02%
Haunch = 1”
Length of Link Slab and Length of Link Slab Debond Zone:
Where,
Lls = Length of Link Slab (in)
Ldz = Length of Link Slab Debond Zone (in)
L1 = Length of First Adjacent Span (in)
( ) "8.111"2)"732"732(075.0GAPLL075.0L 21ls =++⋅=++⋅=
( ) "2.75"2)"732"732(05.0GAPLL05.0L 21dz =++⋅=++⋅=
Equation B1
Equation B2

B 3
L2 = Length of Second Adjacent Span (in)
The two above equations (equations B1 and B2) determine the extents of the ECC
link slab. Similar to concrete link slab design, the length of the debond zone (throughout
which all shear connectors are removed and a debonding mechanism is placed on the top
flange of the girder) is 5.0% of each adjacent bridge span. Unlike in concrete link slab
design, it was found necessary to extend the length of the ECC link slab 2.5% further into
each adjacent span to help transfer load from the girders into the ECC link slab through
additional shear connectors. Within the extended zone, known as the transition zone, the
number of shear connectors should be 50% more than the number required by AASHTO
design procedures. This can be achieved by multiplying the required connector spacing by
0.6667. Figure B.1 illustrates the schematic of these various portions of the link slab.
Figure B.1. Shematic of ECC link slab
End Rotation Angle of Adjacent Spans:
Where,
θmax = Maximum End Rotation Angle Imposed on Link Slab (rads)
θ = Acutal End Rotation Angle Imposed on Link Slab (rads)
∆max = Maximum Allowable Bridge Span Deflection (in)
θ∆
∆=θ max
max Equation B3
Debond zone (5.0% of span length)
Transition zone (2.5% of span length)
ECC link slab (7.5% of span length)
Shear Connectors

B 4
∆ = Actual Bridge Span Deflection (in)
Equation B3 is the basis for determining the maximum end rotation to which the ECC
link slab will be subjected. This end rotation is based solely on live load, as it is assumed
that the ECC link slab is constructed after all dead loads have been placed on the adjacent
bridge spans. Equation B3 confirms theoretically that the beam end rotation angle is
proportional to the mid span deflection of a simple beam. Due to this proportionality, if the
relationship between midspan deflection, ∆, and end rotation, θ, can be found for any
deflection, the maximum end rotation can be found by multiplying the ratio between θ and
∆ by the maximum allowable deflection, ∆max. This is based on the linear elastic nature of
both adjacent beams.
The ratio between midspan deflection and end rotation of a simple span beam can
be found from basic mechanics (Hibbeler, 1999) and is shown in equations B4, B5, and B6.
EI16PL2
=θ Equation B4
EI48PL3
=∆ Equation B5
L3
EI48PL
EI16PL
3
2
=
=∆θ
Where,
θ = Acutal End Rotation Angle Imposed on Link Slab (rads)
∆ = Actual Bridge Span Deflection (in)
P = Load on Adjacent Bridge Span Causing Deflections and Rotations (kip)
L = Bridge Span Length (in)
E = Composite Elastic Modulus of Adjacent Bridge Span (ksi)
I = Moment of Inertia of Adjacent Bridge Span (in4)
Equation B6

B 5
Combining equation B6 with equation B7 (shown below), a relationship can be
obtained relating maximum end rotation of the spans, θmax, and maximum allowable
midspan deflection, ∆max. This expression is shown as equation B8. The maximum
allowable midspan deflection, ∆max, is typically given by the design code. AASHTO has
used a value of L/800 in past editions, but this value can be set to a reasonable value
desired.
00375.0L3
800L
L3
EI48PL
EI16PL
max3
2
maxmaxmax =⋅=
⋅∆=
∆=∆θ
∆=θ
Where,
θmax = Maximum End Rotation Angle Imposed on Link Slab (rads)
θ = Actual End Rotation Angle Imposed on Link Slab (rads)
∆max = Maximum Allowable Bridge Span Deflection (in)
∆ = Actual Bridge Span Deflection (in)
P = Load on Adjacent Bridge Span Causing Deflections and Rotations (kip)
L = Bridge Span Length (in)
E = Composite Elastic Modulus of Adjacent Bridge Span (ksi)
I = Moment of Inertia of Adjacent Bridge Span (in4)
Determine Uncracked Moment of Inertia of Link Slab (per foot width of bridge deck):
Where,
Ils = Moment of Inertia of Link Slab (in4)
Bls = Transverse Width of Link Slab (in) (Assumed per foot width)
ts = Slab Thickness
433
slsls in729
12)"9("12
12tBI =
⋅== Equation B9
800L
max =∆ Equation B7
Equation B8

B 6
Determine the Moment Developed at θmax (per foot width of bridge deck):
The moment induced in the link slab due to end rotation can be determined as a
function of the curvature of the link slab using mechanics, as detailed below. The degree
of curvature within the link slab can be found through geometry, as shown in Figure B.2.
Figure B.2. Curvature of ECC Link Slab
From small angle geometry, the relation between the end rotations of the link slab
and its curvature can be found. This relation is derived below in equations B10 and B11.
dzL2R =θ⋅ Equation B10
dzL2
R1 θ==Φ Equation B11
Where,
R = Radius of Curvature of Deformed Link Slab (in)
Φ = Link Slab Curvature (1/in)
θ = ECC End Rotation (rads)
θ θ
Ldz
2θ
R

B 7
Ldz = Length of Link Slab Debond Zone (in)
From basic mechanics (Hibbeler, 1999), the relation between curvature and moment
can also be expressed as equation B12.
EIM
=Φ Equation B12
Where,
Φ = Link Slab Curvature (1/in)
M = Moment Within Link Slab (kip-in)
E = Elastic Modulus of ECC Link Slab (ksi)
I = Moment of Intertia of ECC Link Slab (in4)
Combining the two above equations (equations B11 and B12), equation B13 is
derived as the relation between the end curvature of the ECC link slab and the moment
induced within the ECC link slab as shown below.
θ=⇒=θ
dzdz LEI2M
EIM
L2
Using the relation shown in equation B13, the moment induced in the example link
slab due to the end rotations calculated in equation B8 can be found, as shown in equation
B14.
Where,
Mls = Moment Induced in the Link Slab due to End Rotation (kip-in)
EECC = Elastic Modulus of ECC Material (ksi)
Ils = Moment of Inertia of Link Slab (in4)
inkip9.21000375.0"2.75
in729ksi29002L
IE2M4
maxdz
lsECCls ⋅=
⋅⋅=θ= Equation B14
Equation B13

B 8
Ldz = Length of Link Slab Debond Zone (in)
θmax = Maximum End Rotation Imposed on Link Slab (rads)
Determine Required Longitudinal Reinforcement Ratio:
The amount of reinforcement is calculated by non-linear sectional analysis. This is
based on the assumption that ECC material is elastic-perfectly plastic. While ECC material
typically does show some strain hardening characteristics after first cracking (Figure B.3),
this phenomenon will not be relied upon for conservative design practice.
The “yield strain” of the ECC material is set to 0.02%. From a pool of tensile test
results, this value is chosen as a fair representative for the first cracking strain of ECC
material which will be used for the ECC link slab. The “yield stress” of the ECC material
is chosen to be 500psi. While the actual ultimate strength is typically above this value,
500psi was again chosen as a fair representative value from a pool of M45 tests.
As proposed by Caner and Zia (1998), a conservative working stress of 40% of the
yield strength of the reinforcment is used for design. Unlike the design assumptions for
concrete, in which no tensile force is carried by the concrete, a substantial stress of 500psi
is assumed to be carried by the ECC up to failure between 3% and 4% strain. Using non-
ε = 0.02%
f’t = 500psi
Figure B.3. Stress-Strain Curve of M45 and Idealized Elastic-Perfectly Plastic Behavior

B 9
linear sectional analysis, the moment capcity of the section can be computed for any
reinforcing ratio. The reinforcement ratio is then adjusted accordingly to resist the moment
due to maximum end rotation computed earlier (Equation B14). Figure B.4 shows the
cross sectional stress and strain distributions of a reinforced concrete link slab (R/C) and a
reinforced ECC link slab (R/ECC) (Li et al, 2003).
Initially, a reinforcement ratio is selected.
(a)
(b)
Figure B.4. Schematic Stress and Strain Distributions in a Cross Section of (a)Reinforced Concrete (R/C) and (b) Reinforced ECC (R/ECC) Link Slab
N.A. ts
Strain Section
b
Stress
sε
R/ECC
cε
ssEε
Strain Section Stress
N.A. ts
b
sε ss Eε
R/C
cε

B 10
Looking at the stress distribution for the reinforced ECC cross section, a simple force
balance is performed equating the compression forces and tension forces in the section.
The section dimensions used in this calculation are shown in Figure B.5.
Figure B.5. Section Dimension Used in Non-linear Sectional Analysis
The yield strain in the steel is assumed to be 0.08%. This is derived by taking 40% of
the yield stress of the reinforcing steel and multiplying by the elastic modulus of steel.
Knowing the yield strain (first cracking strain) of the ECC the yield strain ratio can be
determined, nε, to find the location of the kink in the tensile stress distribution, as shown in
equation B16. This relationship reflects the linear strain distribution assumption as shown
in Figure B.4(b).
To calculate the forces, the cross section is divided up into four regions. These are
schematically shown in Figure B.6.
N.A. ts
Section
b
Stress
cd nεd
%08.0ksi000,29ksi604.0
steely =⋅
=ε −
25.0%08.0%02.0
ddn
nsteely
ECCy ==ε
ε==
−
−εε
Equation B15
Equation B16

B 11
Figure B.6. Discritization of the Stress Distribution in Non-linear Sectional Analysis
Computing the force for each of these four sections individually (per foot width of
deck)
Where,
Tsteel = Tension Force in Reinforcing Steel (kip)
fy-steel = Yield Strength of Reinforcing Steel (ksi)
ρ = Reinforcement Ratio
ts = Slab Thickness (in)
TECC-1 = Tension Force in ECC Section 1 (kip)
N.A.
Stress Tsteel TECC-1 TECC-2 CECC
"12t)f4.0(T ssteelysteel ⋅ρ= −
( ) "12cd)n1('fT t1ECC ⋅+−= ε−
"12dn'f21T t2ECC ⋅
= ε−
( ) "12cdtd1
n1'f
21C 2
stECC ⋅−−
=
ε
Equation B17a
Equation B18a
Equation B19a
Equation B20a

B 12
f’t = Design Tensile Strength of ECC (ksi)
nε = Yield Strain Ratio
d = Distance from Neutral Axis to Centroid of Reinforcing Steel (in)
c = Distance from Tensile Face to Centroid of Reinforcing Steel (in)
TECC-2 = Tension Force in ECC Section 2 (kip)
CECC = Compression Force in ECC (kip)
Using the design chart given below within this document (Figure B.7), and knowing
the moment induced in the link slab is approximately 210.9 kip-in, a preliminary design
reinforcement ratio of 0.003 is selected. The computation of “d” for the example bridge is
shown using equations B17b through B20b.
Note: The distance from the top of the slab to the centroid of tensile steel reinforcement
within the link slab is assumed to be approximately 3.5”. This was assumed for 3” of clear
cover and 0.5” as an approximate assumed radius of the final rebar selection.
kip776.7"12)"9)(003.0)(ksi60)(4.0(Tsteel =⋅= Equation B17b
( ) 21d5.4"12"5.3d)25.01()ksi5.0(T 1ECC +=⋅+⋅−=− Equation B18b
d75.0"12d)25.0)(ksi5.0(21T 2ECC =⋅⋅
=−
Equation B19b
d12132d
363"12)"5.3d"9(d1
25.01)ksi5.0(
21C 2
ECC +−=⋅−−
= Equation B20b
By force equilibrium, the forces are balanced on each side of the neutral axis.
0d12132d
363d75.021d5.4776.7 =−+−+++ Equation B21b
Simplifying,
0d
363d75.6776.160 =−− Equation B21c
0CTTT ECC2ECC1ECCSteel =−++ −− Equation B21a

B 13
Solving this quadratic, the value of “d” can be found.
"526.2d =
Finally, to compute the moment capacity of the section, the moment of the four forces
is summed about the neutral axis.
Where,
M = Moment Resistance of the Link Slab (kip-in)
kip78.7T steel =
kip37.3221"526.25.4T 1ECC =+⋅=−
kip89.1"526.275.0T 2ECC =⋅=−
kip02.42"526.212132"526.2
363CECC =⋅+−=
+
⋅+
+⋅−+⋅= "526.225.0
2"5.3"526.2)25.01(kip367.32"526.2kip776.7M
kip5.211)"5.3"526.2"9(32kip018.42"526.225.0
32kip895.1 =−−⋅
⋅+⋅⋅
⋅
Once the moment resistance of the section is calculated for a particular reinforcement
ratio, if the resistance is less than the moment developed in the link slab due to end
rotation, Mls, a higher reinforcement ratio is selected. Since this process can involve a
number of iterations when determining the reinforcement ratio, the below design chart can
be used once again to refine the selection of reinforcement ratio. This chart is shown as
Figure B.7.
Assumptions in Design Chart:
Working Stress Factor = 40%
( ))cdt(
32Cdn
32Tdn
2cdn1
TdTM sECC2ECC1ECCsteel −−
+
+
⋅+
+−+⋅= ε−ε
ε− Equation B22a
Equation B22b

B 14
Yield Strain of Steel = 0.08%
Yield Strain of ECC = 0.02%
Yield Strength of Steel = 60 ksi
Yield Strength of ECC = 500 psi
Distance from Tensile Face to Centroid of Reinforcing Steel, c ~ 3.5”
Figure B.7. Link Slab Reinforcement Ratio Design Chart
From previous calculations (equation B14), the moment exerted on the link slab due
to end rotations is 210.9 kip-in per foot width of the bridge deck. For a deck thickness of
9”, the corresponding reinforcement ratio is 0.003.
Check that the moment resistance of the link slab is greater than the moment induced
by end rotation.
lsMM ≥ Equation B23
inkip9.210inkip5.211 ⋅≥⋅
0
50
100
150
200
250
300
350
400
450
0 0.002 0.004 0.006 0.008 0.01 0.012 0.014 0.016
Reinforcement Ratio, ρ
Link
Sla
b M
omen
t Res
ista
nce
(Per
Foo
t W
idth
), ki
p-in
/foot
ts = 10”
ts = 9”
ts = 8”
ts = 7”

B 15
Determine the required reinforcement spacing:
Where,
s = bar spacing (in)
Abar = Cross Sectional Area of Selected Bar Size (in2)
ρ = Calculated Reinforcement Ratio
ts = Slab Thickness (in)
Try #3 bars (Abar = 0.11in2) s = 4” (too small)
Try #5 bars (Abar = 0.31in2) s = 11” (selected)
Regardless of girder material (steel or prestressed concrete) the design procedure is the
same. However, the overall treatment of the design may be slightly different between the
two scenarios (i.e. checking beam end conditions, construction methods). These must be
evaluated by the designer on a case by case basis. Due to the inherently small crack width
of ECC materials (the crack width in ECC is independent of steel reinforcement), there is
no need to additionally check any crack width criterion.
Check Strain Capacity of ECC Material:
The strain capacity of the ECC material both in tension and compression must be
checked. Once the location of the neutral axis is found, computing the strain at both the
compression and tension face due to live loads on the adjacent spans is relatively simple
using the assumed linear strain distribution shown in Figure B.8. Knowing the strain in the
reinforcing steel is 0.08% (from equation B15), the strain at both the tensile and
compressive faces can be found using similar triangles.
s
bar
tAsρ
= Equation B24

B 16
Figure B.8. Linear Strain Distribution Within ECC Link Slab Section
From the above strain diagram the live load strains at the tensile and compressive faces
can be calculated from the equations B25a and B26.
d)dc(0008.0
LL+⋅
=ε Equation B25a
d)cdt(0008.0 s
comp−−⋅
=ε Equation B26
Once the strain due to live load is known, the overall tensile and compressive strains
can be computed using equations B27a and B28a.
LLshdz
longTls L
LTε+ε+
β⋅∆⋅α=ε
Equation B27a
εls = Maximum tensile strain exerted on ECC material in link slab due to temperature
loads, shrinkage loads, and live loads
αT = Coefficient of thermal expansion of steel = 0.0000065/ºF (1/ºF)
∆T = Annual temperature variation at bridge location ~ 90ºF (ºF)
LLε
N.A. ts
Strain Section
b
%08.0s =ε
compε
d
c

B 17
β = Link slab design value
β = 2.0 for joints with two roller bearings (one for each adjacent span)
β = 1.0 for joints with one roller bearing and one pin bearing for adjacent spans or
joints with two pin bearings
Llong = Span length of longer adjacent bridge span (inches)
Ldz = Length of link slab debond zone (inches)
εsh = Shrinkage strain for ECC material = 0.001
εLL = Tensile strain at tensile face due to live load on bridge spans
Within equation B27a, the three terms account for thermal deformation due to
shortening and lengthening of the adjacent bridge spans, shrinkage of ECC material, and
live load strain, respectively. The β factor within the first term accounts for the bearing
conditions located at the link slab. For joints with two roller bearings located at the link
slab, the link slab must be able to accommodate the thermal deformation from both
adjacent spans simultaneously thus multiplying the span length, Llong, by two. For joints
with one or two pin bearings, the ECC link slab only has to accommodate thermal
deformation from one adjacent span, and therefore the β factor is equal to one for those
conditions. The shrinkage strain of ECC is set to 0.1%. This is a material property
determined through experimental measurement and should not be adjusted.
For the case of compressive strains, only the live load will be used to calculate the
ultimate compressive strain. Shrinkage strains are tensile in nature, and only serve to
counteract the live load compressive strains. Conservatively, these are not accounted. For
constructability reasons, severe cold weather casting of ECC link slabs is not
recommended. Due to this, most thermal deformation imposed upon the ECC link slab will
be tensile in nature. Therefore, compressive strains due to thermal deformation will be
considered as well. The equation for ultimate compressive strain is then simply equation
B26 from above.
d)cdt(0008.0 s
comp−−⋅
=ε Equation B28a

B 18
Conservatively, the maximum tensile and compressive strain capacities for ECC
material are 2.0% and 0.5%, respectively. Checking the strains for the example bridge
outlined above we see that all checks are within acceptable limits, as shown below.
0016.0"872.2
)"872.2"3(0008.0LL =
+⋅=ε
Equation B25b
%0.2%4.1014.00016.0001.0"2.75
"7322900000065.0 o
ls <==++⋅⋅⋅
=ε Equation B27b
%5.0%09.000087.0"872.2
)"3"872.2"9(0008.0comp <==
−−⋅=ε
Equation B28b
If this check is not successful, the designer is left with two options. One is to redesign
the ECC material from a microstructural level to increase the strain capacity beyond the
strain demand imposed upon the ECC link slab. If this can not be done, another traditional
joint mechanism must be employed such as a mechanical expansion joint.
Debond Zone Detailing
Within the ECC link slab debond zone (see Figure B.1), all shear connectors from the
top flange of girders must be removed. The top flange is the covered with the specified
debond mechanism suggested below and secured over the entire length of the debond zone.
Girder Type Debond Mechanism
Steel…………………………2 layers of 30# roofing paper
Precast Concrete…………….2 layers of 6 mil plastic sheet
Transition Zone Detailing
Within the transition zone (this zone separates the debond zone on either side from the
adjacent bridge spans as seen on Figure B.1) continue shear connectors along the top flange
of the girder. The number of shear connectors in the transition zone should be increased by
50% over AASHTO design procedures to account for larger shear transfers within this zone
and to aid in maintaining a crack free interface between ECC link slab and concrete bridge

B 19
deck. This increase can be achieved by multiplying the design spacing between shear
connectors by 0.667.
Additional Reinforcement Detailing
During construction of adjacent concrete bridge decks, top continuous reinforcement
should be run into the transition zone far enough to allow for a class B splice beginning a
minimum of 6” from the construction joint. It is recommended that the rebar splices be
staggered according to typical MDOT design practice. The bottom mat of reinforcement
may be eliminated 6” into the debond zone, or may be continued with minimum
reinforcement throughout the link slab according to AASHTO design procedures with little
effect. The bottom mat of reinforcement is not included in reinforcement ratio calculations
carried out in this design example.
Only the determination of the top mat of longitudinal reinforcing steel is covered within
this design example. Other reinforcement, such as transverse reinforcement in both top and
bottom mats, along with any minimum reinforcement within the bottom mat are not
addressed. This reinforcement should be designed following AASHTO design procedures.
Similarly, all reinforcement detailing for walks, barrier walls, or other bridge features
should be completed following AASHTO design procedures.
Construction Sequencing
It must be noted that inherently assumed in this design example is a deck pour schedule
which places the ECC link slab last. This is due to the fact that the maximum end rotation
of the link slab is calculated using only the maximum allowable deflection under live load
(∆max = L/800). If the link slab is cast before all dead loads are applied to the adjacent
spans, the combined dead load end rotation and live load end rotation may exceed the
allowable 0.00375rad. To this end, care must be taken during construction to place all dead
loads on adjacent spans prior to ECC link slab casting.
Sidewalk and Barrier Wall Construction
To allow for complete longitudinal deformation of the link slab, the concrete sidewalk
and barrier walls, which are cast on top of the ECC material, must be designed with

B 20
additional attention. Initially, the stress levels due to temperature deformation within the
ECC deck, concrete sidewalk and barrier wall must be checked to determine if these are
high enough to form cracks within the ECC material. Thermal stresses within the link slab
can be separated into two classes; uniform thermal stresses and gradient thermal stresses.
Uniform thermal stresses are uniform across the entire cross section of the link slab and
result from sources such as bearing deformation at the supporting piers, expansion joint
deformation at expansion joints at either end of the bridge or spans, or restrained
functioning of link plate assemblies. Gradient thermal stresses are non-uniform throughout
the cross section and are a result of differential heating and cooling of the bridge deck
resulting in a temperature gradient and therefore a distribution of stresses throughout the
bridge. The relative magnitudes of these stresses must be considered when allowing
concrete sidewalk and barrier wall to be used in conjunction with the ECC link slab.
If ECC link slabs are used to move conventional expansion joints off of bridge decks
rather than replacing them completely, tensile stresses within the link slab due to thermal
stresses will likely remain below the design tensile strength (500psi in this case), and
concrete sidewalk and barrier wall may be placed directly on top of the link slab with little
concern. Using standard LRFD calculation procedures for gradient and uniform thermal
stresses within the deck due to temperature deformation (Section 3.12.3), the stress level in
the link slab should be calculated accounting for the presence of bearing deformation at the
supporting piers, expansion joint deformation, or link plate assemblies. See Appendix G
for sample calculations of gradient and uniform thermal stresses.
However if ECC link slabs are used to completely replace/remove expansion joints
within the bridge structure, elongations within the link slab may reach as much as 1% in
tension. Such tensile stresses or deformations within the link slab are sufficiently high to
crack the link slab, and this deformation must be allowed to occur freely and without
restraint. One method to accomplish this is through the use of ECC materials in the
sidewalk and barrier wall, along with the deck. Another option may be the complete
debonding of concrete sidewalk and barrier wall from the link slab through the use of
another layer of debonding paper between the ECC link slab and sidewalk and eliminating
any reinforcing steel which may connect the sidewalk and the deck within this debond
zone. However, debonding the sidewalk in this nature may lead to freeze-thaw and

B 21
unintended corrosion damage and should be considered a last resort. Ultimately, in the
case that large stresses and deformations are allowed within the constructed link slab due to
expansion joint elimination, every attempt should be made to allow the link slab to deform
freely in the longitudinal direction throughout the entire debond zone area.
Stay-in-place Formwork
In the event that stay-in-place steel formwork is used, it may be used under the ECC
link slab to speed construction. However, in this case the debonding mechanism (i.e.
roofing paper or plastic sheeting) should be expanded to cover the entire formwork under
the link slab debond zone limits in addition to the tops of the girders within the debond
zone. In such cases that the ECC link slab is used only to move expansion joints off of the
bridge deck rather than eliminate them completely, uniform temperature stresses remain far
below the cracking strength of ECC material and complete debonding is of little concern.
Ultimately, in the case that large stresses and deformations are allowed within the
constructed link slab due to complete expansion joint elimination, every attempt should be
made to allow the link slab to deform freely in the longitudinal direction throughout the
entire debond zone area.
References:
Caner, A. and P. Zia, 1998, Behavior and Design of Link Slabs for Jointless Bridge Decks, PCI Journal, May-June, pp. 68-80
Hibbeler, R.C. “Structural Analysis Fourth Edition”, Prentic Hall Publishers, Upper
Saddle River, New Jersey, 1999 pp.1-583 Li, V.C., G. Fischer, Y. Kim, M. Lepech, S. Qian, M. Weimann, and S. Wang, 2003,
Durable Link Slabs for Jointless Bridge Decks Based on Strain-Hardening Cementitious Composites, Department of Civil and Environmental Engineering, University of Michigan, pp. 1-96

B 22
ECC Link Slab Design Procedure Flow Chart (Figure B.9) Prepared by the Advanced Civil Engineering Materials Research Laboratory Department of Civil and Environmental Engineering, University of Michigan October 28, 2004 Revised : December 21, 2005
This flow chart is to be used in conjunction with the step-by-step procedure for ECC link slab design.
Gather Site Information About Bridge
Determine Overall Length of Link Slab (Step 1)
Determine Length of Link Slab Debond Zone (Step 2)
Calculate Maximum Beam End Rotation (Step 3)
Calculate Moment of Inertia of Link Slab (Step 4)
Calculate Moment Induced in Link Slab Due to Maximum End Rotation (Step 5)
Select Reinforcement Ratio and Calculate “d” Value (Step 6) May Use Design Chart for Selection of Reasonable Preliminary Reinforcement Ratio
Compute Moment Resistance of Link Slab (Step 7)
No
Yes Compute Reinforcement Spacing (Step 9)
Detail Debond Zone, Transition Zone, and
Additional Reinforcement (Steps 12,
13 &14)
Complete ECC Link Slab Design with ECC Sidewalk and Barrier Wall and Install Debond Mechanism Under
Entire Debond Zone
Is Moment Resistance in Link Slab Greater (Step 7) Greater Than Moment
Induced (Step 5)?
Step 8
Yes
No
Chose alternative design using traditional joint mechanisms
(i.e. mechanical expansion joint)
Alter ECC material structure to suit higher strain demands
Yes
Is ECC Tensile and Compressive Strain Capacity >
Demand
Steps 10 & 11
Are thermal stresses in link slab (gradient or
uniform) below cracking strength of
ECC (500psi)?
Complete ECC Link Slab Design with Concrete
Sidewalk and Barrier Wall
Step 15

B 23
ECC Link Slab Design Procedure Prepared by the Advanced Civil Engineering Materials Research Laboratory Department of Civil and Environmental Engineering, University of Michigan October 28, 2004 Revised: December 21, 2005 Additional background information on this design procedure can be found in MDOT C&T Research Report RC-1438 “Durable Link Slabs for Jointless Bridge Decks Based on Strain Hardening Cementitious Composites”
1. Overall Length of Link Slab
Lls = Overall length of link slab [inches] L1 = Length of adjacent bridge span [inches] L2 = Length of opposite adjacent bridge span [inches] GAP = Gap between adjacent beam girders [inches]
2. Length of Link Slab Debond Zone
Ldz = Length of link slab debond zone [inches] L1 = Length of adjacent bridge span [inches] L2 = Length of opposite adjacent bridge span [inches] GAP = Gap between adjacent beam girders [inches]
3. Maximum Beam End Rotation θmax = Maximum beam end rotation [radians] ∆max-short = Maximum allowable live load deflection for shorter of two adjacent bridge spans
(from AASHTO Bridge Design Code) [inches] Lshort = Span length of shorter of two adjacent spans [inches]
Note: Since maximum allowable live load deflections are specified in terms of span length, this number should be constant for all span lengths. If ∆max-short = L/800, θmax = 0.00375.
4. Moment of Inertia of Link Slab (per foot width of bridge deck)
Ils = Moment of inertia of link slab per foot width of link slab [in4] ts = Slab thickness [inches]
( ) GAPLL075.0L 21ls ++⋅=
( ) GAPLL05.0L 21dz ++⋅=
∆=θ −
shortshortmaxmax L
3
12t)"12(I
3s
ls =
Equation B29
Equation B30
Equation B31
Equation B32

B 24
5. Moment in Link Slab due to Maximum End Rotation Mls = Moment induced into link slab by maximum end rotation per foot width of link slab
[kip-in] EECC = Elastic modulus of ECC material = 2900ksi [ksi] Ils = Moment of inertia of link slab per foot width of link slab [in4] Ldz = Length of link slab debond zone [inches] θmax = Maximum beam end rotation [radians]
6. Select a Preliminary Design Reinforcement Ratio for Top Mat Reinforcement Note: The goal of Step 6 is to determine the distance from the neutral axis to the centroid of
the tensile reinforcing steel, “d” Note: This design procedure assumes 60 ksi yield strength for reinforcing steel, an elastic
modulus of 60,000 ksi, and a working stress of 40% of yield strength. To select a preliminary design reinforcement ratio, a design chart is given at the end of this
document for illustration and may be used as a guide by inputting the value of Mls found in Step 5. Once a preliminary design reinforcement ratio is selected, calculations of “d” can be completed in Step 6.
Tsteel = Tension force in steel reinforcement per foot width of link slab [kip] fy-steel = Yield strength of steel [ksi] ρ = Selected preliminary design reinforcement ratio ts = Slab thickness [inches] TECC-1 = Portion of tensile force in ECC material undergoing strain-hardening per foot width
of link slab [kip] f’t = Tensile strength of ECC material = 0.5ksi [ksi] nε = Strain ratio = 0.25 (based on design procedure assumptions regarding reinforcing steel) d = Distance from neutral axis to centroid of tensile reinforcing steel [inches] c = Distance from top of slab to centroid of tensile reinforcing steel [inches] TECC-2 = Portion of tensile force in ECC material undergoing elastic deformation per foot
width of link slab [kip] CECC = Compressive forced in ECC material per foot width of link slab [kip]
maxdz
lsECCls L
IE2M θ=
"12t)f4.0(T ssteelysteel ⋅ρ= −
( ) "12cd)n1('fT t1ECC ⋅+−= ε−
"12dn'f21T t2ECC ⋅
= ε−
( ) "12cdtd1
n1'f
21C 2
stECC ⋅−−
=
ε
Equation B33
Equation B34a
Equation B34b
Equation B34c
Equation B34d

B 25
To solve for the distance from the neutral axis to centroid of reinforcing steel the four above
forces must balance using the following equation. Using this non-linear algebraic equation, solve for “d”
7. Compute Moment Resistance of Link Slab
Using the “d” value computed in Step 6
M = Moment resistance of link slab for selected preliminary reinforcement ratio per foot width of link slab [kip-inch]
8. Check Moment Resistance
If moment resistance, M (from Step 7), is less than the moment induced in the link slab due to maximum end rotation, Mls (from Step 5), repeat Steps 6 through 8 with a higher reinforcement ratio. For illustration, a design chart based on Steps 6 through 8 is included at the end of this document, along with the design and geometry assumptions associated with its development.
Note: If calculated longitudinal reinforcement is less than required by AASHTO design
minimums, the AASHTO design minimums should be followed and Steps 9 through 11 completed using the required minimum reinforcement ratio.
9. Required Longitudinal Reinforcement Spacing
s = Spacing between longitudinal bars [inches] Abar = cross sectional area of selected bar size [in2] ρ = Selected reinforcement ratio ts = slab thickness [inches]
0CTTT ECC2ECC1ECCSteel =−++ −−
( ))cdt(
32Cdn
32Tdn
2cdn1
TdTM sECC2ECC1ECCsteel −−
+
+
⋅++−
+⋅= ε−εε
−
lsMM >
s
bar
tAsρ
=
Equation B35
Equation B36
Equation B37

B 26
10. Check Tensile Strain Capacity of ECC Material
LLshdz
longTls L
LTε+ε+
β⋅∆⋅α=ε
εls = Maximum tensile strain exerted on ECC material in link slab due to temperature loads,
shrinkage loads, and live loads αT = Coefficient of thermal expansion of steel = 0.0000065/ºF [1/ºF] ∆T = Annual temperature variation at bridge location ~ 90ºF [ºF] β = Link slab design value β = 2.0 for joints with two roller bearings (one for each adjacent span)
β = 1.0 for joints with one roller bearing and one pin bearing for adjacent spans or joints with two pin bearings
Llong = Span length of longer adjacent bridge span [inches] Ldz = Length of link slab debond zone [inches] εsh = Shrinkage strain for ECC material = 0.001 εLL = Tensile strain at tensile face due to live load on bridge spans
c = Distance from top of slab to centroid of tensile reinforcement [inches] d = Distance from neutral axis to centroid of tensile reinforcement [inches] Note: The equation for εLL assumes 60 ksi yield strength for reinforcing steel, an elastic
modulus of 60,000 ksi, and a working stress of 40% of yield strength. The maximum conservative ultimate tensile strain capacity for ECC material is
approximately 2.0% This is the upper limit for the tensile strain in ECC link slabs. Confirm : %0.2ls <ε If this confirmation is not met, another version of ECC material may be sought which meets
this requirement or more traditional joint mechanisms be recommended.
d)dc(0008.0
LL+⋅
=ε
Equation B38
Equation B39

B 27
11. Check Compressive Strain Capacity of ECC Material due to Live Load
d)cdt(0008.0 s
comp−−⋅
=ε
εcomp = Compressive strain in ECC material due to live load ts = Deck slab thickness [inches] d = Distance from neutral axis to centroid of tensile reinforcing steel [inches] c = Distance from top of slab to centroid of tensile reinforcing steel [inches] Note: The equation for εcomp assumes 60 ksi yield strength for reinforcing steel, an elastic
modulus of 60,000 ksi, and a working stress of 40% of yield strength.
The maximum conservative compressive strain capacity for ECC material is approximately 0.5%.
Confirm: %5.0comp <ε If this confirmation is not met, another version of ECC material may be sought which meets
this requirement or more traditional joint mechanisms be recommended.
12. Debond Zone Detailing Within the ECC link slab debond zone, all shear connectors from the top flange of girders
must be removed. The top flange is the covered with the specified debond mechanism suggested below and secured over the entire length of the debond zone.
Girder Type Debond Mechanism Steel…………………………2 layers of 30# roofing paper Precast Concrete…………….2 layers of 6 mil plastic sheet
13. Transition Zone Detailing Within the transition zone (this zone separates the debond zone on either side from the
adjacent bridge spans) continue shear connectors along the top flange of the girder. The number of shear connectors in the transition zone should be increased by 50% over AASHTO design procedures to account for larger shear transfers within this zone and to aid in maintaining a crack free interface between ECC link slab and concrete bridge deck. This increase can be achieved by multiplying the design spacing between shear connectors by 0.667.
During construction of adjacent concrete bridge decks, top continuous reinforcement should
be run into the transition zone far enough to allow for a class B splice beginning a minimum of 6” from the construction joint. It is recommended that the rebar splices be staggered according to typical MDOT design practice. The bottom mat of reinforcement
Equation B40

B 28
may be eliminated 6” into the debond zone, or may be continued with minimum reinforcement throughout the link slab according to AASHTO design procedures with little effect. The bottom mat of reinforcement is not included in reinforcement ratio calculations carried out in steps 6-8 of this design procedure.
14. Additional Reinforcement Detailing
Only the determination of the top mat of longitudinal reinforcing steel is covered within this
design document. Other reinforcement, such as transverse reinforcement in both top and bottom mats, along with any minimum reinforcement within the bottom mat are not addressed. This reinforcement should be designed following AASHTO design procedures. Similarly, all reinforcement detailing for walks, barrier walls, or other bridge features should be completed following AASHTO design procedures.
15. Sidewalk, Barrier Wall, and Stay-in-Place Formwork Considerations
To allow for complete longitudinal deformation of the link slab, the concrete sidewalk and barrier walls, which are cast on top of the ECC material, must be designed with additional attention. Initially, the stress levels due to temperature deformation within the ECC deck, concrete sidewalk and barrier wall must be checked to determine if these are high enough to form cracks within the ECC material. Thermal stresses within the link slab can be separated into two classes; uniform thermal stresses and gradient thermal stresses. Uniform thermal stresses are uniform across the entire cross section of the link slab and result from sources such as bearing deformation at the supporting piers, expansion joint deformation at expansion joints at either end of the bridge or spans, or restrained functioning of link plate assemblies. Gradient thermal stresses are non-uniform throughout the cross section and are a result of differential heating and cooling of the bridge deck resulting in a temperature gradient and therefore a distribution of stresses throughout the bridge. The relative magnitudes of these stresses must be considered when allowing concrete sidewalk and barrier wall to be used in conjunction with the ECC link slab.
Using standard LRFD calculation procedures for gradient and uniform thermal stresses within the deck due to temperature deformation (Section 3.12.3), the stress level in the link slab should be calculated accounting for the presence of temperature gradients, bearing deformation at the supporting piers, expansion joint deformation, or link plate assemblies. For cases in which ECC link slabs are use to move expansion joints off the bridge deck rather than replace them completely, gradient stresses will typically dominate the low levels of uniform stress. If uniform or gradient thermal tensile stresses within the link slab remain below the design tensile strength, then concrete sidewalk and barrier wall may be placed directly on top of the link slab with little concern. However, if tensile stresses within the link slab are sufficiently high to crack the link slab, this deformation must be allowed to occur freely and without restraint.
If ECC link slabs are used to move conventional expansion joints off of bridge decks rather than replacing them completely, tensile stresses within the link slab due to thermal stresses will likely remain below the design tensile strength (500psi in this case), and concrete sidewalk and barrier wall may be placed directly on top of the link slab with little concern. An example of such stress calculations using standard LRFD calculation procedures for gradient and uniform thermal stresses within the deck due to temperature deformation are shown in Appendix G of this report.

B 29
However if ECC link slabs are used to completely replace/remove expansion joints within the bridge structure, elongations within the link slab may reach as much as 1% in tension. Such tensile stresses or deformations within the link slab are sufficiently high to crack the link slab, and this deformation must be allowed to occur freely and without restraint. One method to accomplish this is through the use of ECC materials in the sidewalk and barrier wall, along with the deck. Another option may be the complete debonding of concrete sidewalk and barrier wall from the link slab through the use of another layer of debonding paper between the ECC link slab and sidewalk and eliminating any reinforcing steel which may connect the sidewalk and the deck within this debond zone. However, debonding the sidewalk in this nature may lead to freeze-thaw and unintended corrosion damage and should be considered a last resort. Ultimately, in the case that large stresses and deformations are allowed within the constructed link slab due to expansion joint elimination, every attempt should be made to allow the link slab to deform freely in the longitudinal direction throughout the entire debond zone area.
In the event that stay-in-place steel formwork is used, it may be used under the ECC link slab to speed construction. However, in this case the debonding mechanism (i.e. roofing paper or plastic sheeting) should be expanded to cover the entire formwork under the link slab debond zone limits in addition to the tops of the girders within the debond zone. In such cases that the ECC link slab is used only to move expansion joints off of the bridge deck rather than eliminate them completely, uniform temperature stresses remain far below the cracking strength of ECC material and complete debonding is of little concern. Ultimately, in the case that large stresses and deformations are allowed within the constructed link slab due to complete expansion joint elimination, every attempt should be made to allow the link slab to deform freely in the longitudinal direction throughout the entire debond zone area.
Note: Construction Sequencing
The ECC link slab must be constructed after both adjacent bridge decks have been placed. Since the determination of maximum beam end rotation (Step 3) is calculated based only on live load deflection limits, it is crucial for as much of the dead load within the adjacent spans to be in place as possible at the time of link slab construction.
Additional Information – Reinforcement Ratio Design Chart
This design chart is based on Steps 6 through 8 of this design procedure, along with the
assumptions outlined below. It can be used as the primary design tool for the top mat of longitudinal reinforcing steel to avoid progressing through numerous iterations of design Steps 6 through 8, or it can be used as a secondary check of design calculations. However, the final design values for “d” and “c” are used in checks for strain capacity (Steps 10 and 11) and must be accurately known.
Assumed: Working Stress Factor = 40% Yield Strain of Steel = 0.08% Yield Strain of ECC = 0.02% Yield Strength of Steel = 60 ksi Elastic Modulus of Steel = 60,000 ksi

B 30
Yield Strength of ECC = 500 psi Distance from Tensile Face to Centroid of Top Reinforcing Steel, c ~ 3.5” Simplified Design Equations from above design chart:
ts = 10” M = 13460ρ + 219.9 ts = 9” M = 10211ρ + 180.9 ts = 8” M = 7387ρ + 145.8 ts = 7” M = 4992ρ + 114.6
0
50
100
150
200
250
300
350
400
450
0 0.002 0.004 0.006 0.008 0.01 0.012 0.014 0.016
Reinforcement Ratio, ρ
Link
Sla
b M
omen
t Res
ista
nce
(Per
Foo
t W
idth
), ki
p-in
/foot
ts = 10”
ts = 9”
ts = 8”
ts = 7”
Equation B41a
Equation B41b
Equation B41c
Equation B41d

C 1
13.0 Appendix C

C 2
ECC Link Slab Design For Grove Street Bridge over I-94 (S02 of 81063)
Prepared by the Advanced Civil Engineering Materials Research Laboratory Department of Civil and Environmental Engineering, University of Michigan October 8, 2004 : Revised December 21, 2005 Disclaimer: Having not been performed or reviewed by a licensed professional engineer prior to submission to the Michigan Department of Transportation, the accuracy of these calculations and their adherence to applicable design codes and standard practices within the State of Michigan must be verified by a licensed professional engineer prior to incorporation within completed design documents. The original authors or their employers can accept no legal responsibility for the accuracy of these calculations or their adherence to applicable design codes or standard practices within the State of Michigan.
Given:
Span Length = L = L1 = L2 = 1335”
Gap Between Opposing Beam Ends = GAP = 3”
Deck Thickness = ts = 9”
Elastic Modulus of Reinforcing Steel = Esteel = 29,000 ksi
Yield Strength of Reinforcing Steel = fy-steel = 60 ksi
Working Strain of Steel = εy-steel = 0.08%
Elastic Modulus of ECC = EECC = 2900 ksi
Tensile Yield Strength of ECC = f’t = 500 psi
Yield Strain of ECC Material = εy-ECC = 0.02%
Maximum Allowable Live Load Deflection = L/800 (AASHTO Standard 8.9.3.1)
1. Overall Length of Link Slab
2. Length of Link Slab Debond Zone
3. Maximum Beam End Rotation
( ) GAPLL075.0L 21ls ++⋅=
( ) "203"3"1335"1335075.0Lls =++⋅=
( ) "137"3"1335"133505.0Ldz =++⋅=
( ) GAPLL05.0L 21dz ++⋅=
∆=θ −
shortshortmaxmax L
3
Equation C1a
Equation C1b
Equation C2a
Equation C2b
Equation C3a

C 3
4. Moment of Inertia of Link Slab (per foot width of bridge deck)
5. Moment in Link Slab due to Maximum End Rotation
From calculation, it can be seen that no reinforcement is needed for structural strength in addition to AASHTO minimum. In accordance with AASHTO Standard 8.20.1 and 8.20.2, a minimum of 1/8 square inches of reinforcing steel must be placed per foot in each direction, at a spacing of less than 18”. Therefore, the top layer of longitudinal reinforcing steel will meet that requirement. #3 bars at 10.5”
Find Neutral Axis to Determine Strain Demands
25.0%08.0%02.0n
steely
ECCy ==ε
ε=
−
−ε
rad00375.0L3
800L
max =
=θ
12t)"12(I
3s
ls =
43
ls in72912
)"9)("12(I ==
maxdz
lsECCls L
IE2M θ=
inkip7.115rad00375.0"137
)in729)(ksi2900(2M4
ls ⋅=⋅⋅
=
001164.0=ρ
kip018.312"9001164.0ksi604.0"12t)f4.0(T ssteelysteel =⋅⋅⋅⋅=⋅ρ= −
( ) 905.16d5.4"12)"8175.2d)25.01((ksi5.0"12cd)n1('fT t1ECC +=⋅+⋅−⋅=⋅+−= ε−
Equation C3b
Equation C4a
Equation C4b
Equation C5a
Equation C5b
Equation C6
Equation C7a
Equation C7b

C 4
d124.148d
7.458+−=
0d12kip4.148d
7.458d75.0kip905.16d5.4kip018.3 =−+−+++
0d
7.458d75.63.168 =−−
Solving for “d”, "114.3d =
6. Check Tensile Strain Capacity of ECC Material
LLshdz
longTls L
LTε+ε+
β⋅∆⋅α=ε
d75.0"12d)25.0)(ksi5.0(21"12dn'f
21T t2ECC =⋅⋅
=⋅
= ε−
( ) "12)"8175.2d"9(d1
25.01)ksi5.0(
21"12cdt
d1
n1'f
21C 22
stECC ⋅−−
=⋅−−
=
ε
0CTTT ECC2ECC1ECCSteel =−++ −−
d)dc(0008.0
LL+⋅
=ε
0015.0"114.3
)"114.3"8175.2(0008.0LL =
+⋅=ε
%0.2%82.00082.00015.0001.0"137
"13350.1900000065.0 o
ls <==++⋅⋅⋅
=ε
Equation C7c
Equation C7d
Equation C8a
Equation C8b
Equation C8c
Equation C9a
Equation C10a
Equation C10b
Equation C9b

C 5
7. Check Compressive Strain Capacity of ECC Material due to Live Load
d)cdt(0008.0 s
comp−−⋅
=ε
8. Debond Zone Detailing
Within the ECC link slab debond zone, all shear connectors from the top flange of
girders must be removed. The top flange is the covered with 2 layers of 30# roofing paper secured to the top flange.
9. Transition Zone Detailing
Within the transition zone continue shear connectors as along the top flange of the
girder. The number of shear connectors in the transition zone should be increased by 50% over AASHTO design procedures. This increase can be achieved by multiplying the current design spacing between shear connectors by 0.667.
During construction of adjacent concrete bridge decks, top continuous
reinforcement should be run into the transition zone far enough to allow for a class B splice beginning a minimum of 6” from the construction joint.
For a class B splice length for #4 epoxy-coated rebar
"12fd4.0l ybd >= (AASHTO Standard 8.25.1 and 8.25.4) For #3 bars ld = 12” Due to epoxy coating increase development length by 15%
(AASHTO Standard 8.25.2.3) For a Class B splice increase development length by 30% (AASHTO Standard 8.32.3.1)
"183.115.1"12lsplice =⋅⋅= The bottom mat of reinforcement may be eliminated 6” into the debond zone, or
may be continued with minimum reinforcement throughout the link slab according to AASHTO design procedures with little effect.
10. Thermal Stress Checks
To determine whether concrete sidewalk and barrier wall can be used within this project, the stress levels due to thermal gradient stresses and uniform stresses
%5.0%08.00008.0"114.3
)"8175.2"114.3"9(0008.0comp <==
−−⋅=ε
Equation C11a
Equation C11b
Equation C12a
Equation C12b

C 6
throughout the deck were calculated using LRFD Section 3.12.3. The stress level in the link slab was calculated accounting for the presence of the conventional link plate assembly and expansion joints on either end of adjacent spans. The stress levels within the ECC link slab are shown in Table C1 with associated calculations given in Appendix G. Within this table the maximum tensile and compressive stresses in the ECC link slab are shown under two conditions both with and without the concrete walk. Further, both a positive and negative temperature gradient are shown, along with the uniform stresses due to temperature change.
Table C1. Maximum Tensile and Compressive Stresses within the ECC Link Slab and ECC Link Slab with
Concrete Sidewalk Due to Positive and Negative Temperature Gradients and Uniform Stresses
ECC Deck
Maximum ECC Tensile Stress (ksi)
Maximum ECC Compressive Stress (ksi)
Temperature Gradient Increase 0.143 0.485Temperature Gradient Decrease 0.148 0.042
ECC Deck with Conc WalkTemperature Gradient Increase 0.149 N/ATemperature Gradient Decrease N/A 0.044
Uniform Stress 0.005 N/A
Within this specific application, the stress level within the link slab due to
temperature deformations under any condition within the adjacent spans remains far below those necessary to exceed the 500psi cracking strength of the ECC material in tension. Therefore, the demand for tensile deformation within the link slab can be considered negligible. If the link slab is never subjected to tensile loads or deformations, there remains little concern over the restraint provided by the concrete sidewalk and barrier wall. In this application the use of concrete sidewalk and barrier wall is permitted.
11. Stay-in-Place Formwork
It is essential that the link slab be able to deform over the entire length of the debond zone. To allow for this, while still using stay-in-place formwork, this application requires the use of the debonding material over the entire bottom side of the link slab within the debond zone, rather than just over the girders. Therefore, roofing paper must be placed over the entire debond zone over both the girders and the stay-in-place formwork before casting of the link slab.
12. Additional Reinforcement Detailing
Only the determination of the top mat of longitudinal reinforcing steel is covered
within this design document. Other reinforcement, such as transverse reinforcement in both top and bottom mats, along with any minimum reinforcement within the bottom mat are not addressed. This reinforcement

C 7
should be designed following AASHTO design procedures. Similarly, all reinforcement detailing for walks, barrier walls, or other bridge features should be completed following AASHTO design procedures.
Note: Construction Sequencing
The ECC link slab must be constructed after both adjacent bridge decks have been
placed and as much design dead load as possible has been placed on the adjacent spans


D 1
14.0 Appendix D

C&T:U/M:RDT 1 of 5 01-13-05
D
MICHIGAN DEPARTMENT OF TRANSPORTATION
SPECIAL PROVISION
FOR ECC BRIDGE DECK LINK SLAB
C&T:U/M:RDT 1 of 5 C&T:APPR:JFS:EMB:01-13-05 a. Description. This work consists of building a link slab of Engineered Cementitious Composite (ECC) within a newly constructed, rehabilitated, or retrofitted bridge. Except as modified by this special provision, all work is to be in accordance with the 2003 Standard Specifications for Construction. b. Materials. Fine aggregates used for ECC material must be virgin silica sand consisting of a gradation curve with 50% particles finer than 0.04 mils and a maximum grain size of 12 mils. Fine aggregates meeting this requirement are available from the following manufacturer under the trade name “F-110 Foundry Silica Sand.” Approved equal will be accepted.
US Silica Corporation 701 Boyce Memorial Drive Ottawa, Illinois 61350 Telephone (800) 635-7263
Fibers to be used for ECC material must be manufactured of poly-vinyl-alcohol (PVA) with a
fiber diameter of 1.5 mils and a length between 0.3 inch and 0.5 inch. The surface of the fiber must be oiled by the manufacturer with 1.2% (by weight) hydrophobic oiling compound along the length of the fiber. Fiber strength shall be a minimum of 232 ksi with a tensile elastic modulus of at least 5,800 ksi. Fibers meeting this requirement are available from the following manufacturer under the trade name REC-15. Approved equal will be accepted.
Kuraray America
101 East 52nd Street, 26th Floor New York, New York 10022 Telephone (212) 986-2230
Water Reducing, High Range Admixture: Water reducing, high range admixture
(superplasticizer) complying with ASTM C 494, Type F or G, ASTM C 1017, Type 1 or 2. In addition, the selected water reducing, high range admixture should be comprised of a polycarboxylate chemical composition. Water reducing, high range admixtures meeting this requirement are available from the following manufacturer under the trade name ADVACast ® 530. Approved equal will be accepted.
W.R. Grace & Company 62 Whittemore Avenue Cambridge, Massachusetts 02140 Telephone (617) 876-1400
2

C&T:U/M:RDT 2 of 5 01-13-05
D
Retarding Admixture: Retarding admixture complying with ASTM C 494, Type D. Retarding
admixture meeting this requirement is available from the following manufacturer under the trade name Daratard ® 17. Approved equal will be accepted.
W.R. Grace & Company
62 Whittemore Avenue Cambridge, Massachusetts 02140 Telephone (617) 876-1400
c. ECC Mix Design Requirements. The ECC mixture requirements are shown in Table 1. For the mixture proportions listed, fine aggregate weight is assumed to have a dry bulk density of 2.60. The Contractor will adjust the mix design for aggregate absorption (assumed Moisture Content = 0.1%, Absorption Capacity = 9.0%, Specific Gravity = 2.65), and for specific gravity if it differs by more than 0.02 from the assumed value. At the site, additional High Range Water Reducer (HRWR) may be added to the mix to adjust the workability of the mix with onsite approval of the Engineer. Water additions are not allowed at the bridge site or in transit.
The adjusted mix design must be submitted to the Engineer a minimum of five days prior to placement of the ECC link slab. Strength requirements for ECC material are shown in Table 2.
The ECC material supplier must be approved by the Engineer and should be familiar and
experienced with batching, mixing, and placement of ECC material. Adequate experience with ECC batching, mixing, and placement techniques is achieved after participating in ECC batching, mixing, and placement training to be arranged with MDOT personnel (or designated MDOT representatives) prior to the Contractor’s first project using ECC material.
Adequate workability of the ECC mixture can be verified using a standard slump cone.
Workability testing should be performed on a flat plexiglass or glass surface upon discharging of the ECC mixture at the site. Upon removal of the cone, the resulting pancake of ECC material which is formed must be greater than 30 inches in average diameter and less than 90 inches. No check on air content is necessary.
Table 1:
ECC Mix Design Parameter Value Mix Water (net) 544 lb/cyd
Portland Cement, Type I 973 lb/cyd
Fly Ash, Type F 1167 lb/cyd
Fine Aggregate, Dry 778 lb/cyd
High Range Water Reduced (HRWR) 14.6 lb/cyd
Poly-vinyl-alcohol Fibers 43.8 lb/cyd
3

C&T:U/M:RDT 3 of 5 01-13-05
D
Retarding Admixture Optional
Table 2: Minimum Strength of ECC Material 7 day 14 day 28 day
Compressive 3200 psi 4000 psi 4500 psi
Tensile (Uniaxial) 500 psi 500 psi 500 psi
Ultimate Tensile Strain Capacity 2% (uniaxial tension)
d. Trial Batch. The Contractor shall appoint a technical representative capable of making adjustments to the batching and mixing of ECC material. This representative must be familiar with the mixing, batching, and placement of ECC material. The technical representative will designate a batching sequence of ECC material to ensure uniform fiber dispersion, and homogeneity of the material. This batching sequence must be approved by the Engineer. The technical representative will be present at the trial batch and at the first placement of ECC material to make recommendations and adjustments.
A four cubic yard trial batch shall be mixed and placed at the mix plant or as designated by
the Engineer, a minimum of twenty eight working days prior to full production. The Engineer must be notified of the time of the trial batch mix a minimum of 48 hours before batching. Quality assurance specimens shall be cast from this trial batch according to section (f) and tested by MDOT personnel or designated MDOT representatives, to validate early age hardened properties of the ECC mixture.
The trial batch shall be prepared following the adjusted mix design and with the same
materials that will be used in the ECC link slab mixture. For the trial batch to be considered successful, workability, fiber dispersion, mixture rheology, 7 and 14, day compressive and tensile strengths, and uniaxial tensile strain capacity must meet the requirements of this special provision. Workability is evaluated as outlined in section c of this provision. Qualitative judgment must be made by the Engineer as to proper homogeneous fiber dispersion throughout the fresh material, and acceptable overall rheology of the mix for the intended application. If the trial batch does not meet these requirements, the trial batch shall be repeated at no additional cost to the department.
e. Preparation, Placement, and Cure of ECC Material. Trucks delivering ECC material to the project must be fully discharged within one hour of charging at the plant as required by subsection 701.03.B, Table 701-2. Preparation of the formwork and concrete surfaces shall proceed according to subsection 706.03.H. Prior to placement of the link slab, all concrete/ECC interfaces shall be wetted with a uniform spray application of water so that the surfaces are moist at the time of placement, with no standing water. Water collecting in depressions shall be blown out with clean, oil free, compressed air.
Because of the high flowability of ECC material and placement on a sloped bridge deck, any vibration may pose problems with maintaining the location of the ECC material, causing it to flow towards the low point of the crown before setting. Special methods with phased construction will be needed when vibrations are present during placement of the ECC material.
4

C&T:U/M:RDT 4 of 5 01-13-05
D
Finishing of the surface shall follow subsection 706.03.M. Special care must be taken to
ensure that creation of transverse surface grooves does not disturb fiber distribution on the finished surface. Light texturing with a rake can achieve this result. The careful use of a tining rake shortly after initial setting of the ECC material is allowed to produce a surface texture resulting in acceptable ride performance. When using the rake, care must be taken not to remove fibers from the top layer of ECC material. If this is not possible, texturing of the hardened surface must be undertaken to achieve an acceptable riding surface.
Application of curing compound and curing of the ECC material shall follow subsection
706.03.N. If necessary, the removal of the continuous wet curing system within the ECC portion of the construction is permitted after two days provided that the 7 day compressive and tensile strengths and tensile strain capacity given in Table 2 have been reached.
Sidewalk, curb, or barrier shall not be cast on the deck until the link slab has received a
minimum two day continuous wet cure. Heavy equipment will not be permitted on the link slab until the link slab has reached an age of at least 4 days, and then not until the ECC has attained the 28-day strength listed in Table 2. This sidewalk, curb, or barrier wall must be cast of ECC material over the link slab region unless calculations of both thermal gradient stresses and uniform thermal stresses show that stresses within the link slab remain below the cracking strength of ECC material.
If the workability limits outlined within Section c of this special provision cannot be met, or
due to other site circumstances, the Contractor is allowed to use hand held vibration equipment to aid in placement and consolidation of the ECC material if approved by the Engineer. Vibration should be used judiciously to promote proper consolidation, and only as a final measure in guaranteeing the quality of the construction. Care must be taken during vibration to not affect proper dispersion of the fibers within the fresh composite.
f. Quality Assurance. Quality assurance of ECC materials will be consistent with subsection 701.03.G.2. In addition to standard compressive cylinders, sets of four uniaxial tensile test plates will be cast on site at identical intervals to casting of compressive cylinders. Dimensions for uniaxial specimens are shown in Figure 1. Tolerances for these plates are ±0.05 inches for all dimensions and tensile forms should be properly treated with form oil or other approved releasing agent to facilitate easy form stripping. Uniaxial tension tests are to be performed by a testing organization or research facility designated by the Engineer. The testing organization or research facility shall be experienced and familiar with conducting uniaxial tension testing of strain hardening cementitious composites. Scheduling, completion, and reporting of all material testing are the responsibility of the Contractor. Uniaxial tension tests are to be run on a servo-hydraulic testing system under displacement control using a test speed of 0.1mil/sec. Testing of this type shall be conducted at the following location.
Advanced Civil Engineering Materials Research Laboratory University of Michigan 2326 George G. Brown Laboratory 2350 Hayward Street Ann Arbor, Michigan 48109-2125
5

C&T:U/M:RDT 5 of 5 01-13-05
D
Telephone (734) 764-3368 Under the direction of Professor Victor C. Li
Other testing laboratories must be approved by the Engineer prior to testing.
Figure 1
g. Measurement and Payment.
Contract Item (Pay Item) Pay Unit Bridge Deck Link Slab Construction……………………………………………..Square Yard ECC Material…………………………………………………………………………Cubic Yard
Bridge Deck Link Slab Construction includes formwork necessary for placement of link slab, consolidation (if necessary), finishing, texturing, and curing of the link slab ECC material. This work will be measured and paid for in square yards of surface constructed within the limits shown on the plans, including area of drain castings. ECC Material includes furnishing and placing the ECC material within the prepared link slab limits as shown on the plans. The quantity will be documented, measured, and paid for using batch plant tickets with deductions made for material wasted or rejected. The initial trial batch quantity will be included in this quantity. Any additional trial batches necessary to adjust the mix will be prepared at no additional cost to the Department.
6

E 1
15.0 Appendix E

E 2
Michigan Department of Transportation
HNTB Corporation The University of Michigan Advanced Civil Engineering Materials Research Laboratory
ECC Bridge Deck Link Slab Information Meeting
Meeting Minutes
Civil and Environmental Engineering Department The University of Michigan
Ann Arbor, Michigan
May 31, 2005 Group members of the Advanced Civil Engineering Materials Research Laboratory (ACE-MRL), MDOT and HNTB met on Tuesday, May 31, 2005 at 10:00 AM in the CEE Department Conference Room with the following in attendance: ACE-MRL Members Present: Dr. Victor Li, Principal Investigator [email protected] Dr. Jerome Lynch, Co-Principal Investigator [email protected] Mr. Tsung-Chin Hou [email protected] Ms. Mo Li [email protected] Mr. En-Hua Yang [email protected] MDOT Members Present: Mr. Daniel Garcia [email protected] Ms. Caroline Chappell [email protected] HNTB Members Present Mr. Tom Shultz [email protected] Ms. Nicki Baker [email protected] Mr. Shawn Tinkey [email protected] Call to Order Dr. Li called the meeting to order at approximately 10:30AM.

E 3
Meeting Agenda:
• Introduction of ACE-MRL, MDOT and HNTB Members • Presentation by Dr. Victor Li • Presentation by Dr. Jerome Lynch • Remaining Questions and Discussion
In the morning session, Professor Li gave a presentation on ECC material properties, ECC mix proportion, ECC link slab design, and ECC trial large scale mixing in ready mix truck. During the presentation by Dr. Victor Li, the floor was open to questions by research team members, MDOT members and HNTB members. Ms. Baker asked why people want the large deformation of ECC. Dr. Li answered that the large deformation capacity (ductility) of ECC is not “wanted”, but “needed”. For link slab application, generally the combination of environmental and mechanical loading will impose a tensile strain of 1.2% in the link slab, therefore the high strain capacity of ECC material is needed to accommodate the tensile strain. Mr. Shultz was concerned that quality control for large scale mixing might not be as good as in laboratory. Dr. Li responded that we have done not only test in lab, but also large scale trail batches (1, 2 and 4 cubic yard) in a ready mix truck. Specimens made from the large scale batches have been tested to have good tensile strain capacity up to 3%. Mr. Tinkey asked what kind of other application the ECC material has been used for. Dr Li responded that an R/ECC coupling beam had been constructed in a 27-story high-rise R/C residential building in central Tokyo, Japan. Besides, a cable stayed bridge (Mihara Bridge, Hokkaido, Japan) was constructed in 2004, with a 12 mm– thick steel deck overlayed by a 38 mm – thick layer of ECC. This cable-stayed bridge was expected to open to traffic in April, 2005. The tensile ductility and tight crack width control of ECC are features that contribute to a 40% reduction in weight and an expected service life of 100 years. A significant reduction in cost was also reported. There was also an ECC repair of the Mitaka Dam in the Hiroshima-Prefecture in 2003, Japan. In the US, a small ECC patch repair was placed on the deck of the Curtis Road bridge over M-14 in Michigan in Oct., 2002. This patch was placed one day after the surrounding repair concrete was placed. Under very heavily loaded 11-axle trucks, and almost three full winter freeze-thaw cycles, the ECC patch exhibits very tiny cracks, with crack width around 50 µm. In contrast, the maximum crack width in the surrounding concrete is significantly higher at the same age, which is about 3.8mm. Dr. Li talked that under Freeze-thaw testing according to ASTM C666, the durability factor for concrete is 10 compared with 100 for ECC, both without air entrainment. Mr. Tinkey asked about the freeze-thaw resistance of ECC compared to air-entrained concrete. Dr. Li answered that they are almost the same, but the goodness of ECC is that it does not need the air entrainment procedure. Dr. Li asked who is responsible for ordering the raw material. Mr. Shultz responded that the primary contractor, who will be present on Friday’s “Hands-on” training meeting, is responsible for this work. Mr. Shultz asked whether more suppliers were available and whether the raw materials could be

E 4
substituted. Dr. Li responded that it was not suggested to substitute the raw materials, because ACE-MRL had already provided the optimal composition. It would be not easy to guarantee the composites performance after changing the raw material or composition. Mr. Tinkey asked about the initial setting time of ECC. Dr. Li responded that the initial setting time is about an hour and can be extended as desired by adding adjusted amount of retarder. Mr. Yang added that based on the large scale trial batch experience, there was no problem to control the fresh property of ECC. Ms. Baker asked whether there will be any concern about large deflection when ECC is used in structural applications since the material is very ductile. Dr Li explained that material ductility is a property in the inelastic stage. ECC has an elastic modulus a little lower than normal concrete (~20GPa vs. ~24GPa). Under service loading, ECC structural member should not be expected to have large deflection because of its enough high elastic modulus. However under severe loading or other loading conditions when large deformation is imposed, the high ductility of ECC can accommodate the large deformation and prevent brittle failure. Mr. Tinkey asked about the density of ECC. Dr. Li responded that for the version of ECC (M45) which will be used in the link slab project, the density is about 20% lower than the normal concrete. Dr. Li commented that a three-cubic yard trial batch should be required, and compressive/tensile properties of ECC are necessary to be obtained at different ages in case that the mix design needs to be adjusted. An adjusted mix design must be submitted to the Engineer at least five days prior to the placement of the ECC link slab. In the afternoon, Professor Lynch presented the instrumentation strategy for the ECC link slab on the Groove Street Bridge. The details could be found in the document “Instrumentation Strategy for the Jointless ECC Bridge Deck on the Groove Street Bridge”. In the Q & A section, several questions were posed by Dr. Li, and answers from MDOT and HNTB members were invited. Q: What’s the time line for pouring ECC link slab? A: The estimated time for pouring ECC link slab will be during the 1st week of August, 2005. Mr. Tom Shultz will keep the time schedule updated. Q: Who is responsible for the on-site inspection? A: Ms. Nicki Baker and Mr. Shawn Tinkey from HNTB. Q: Are guests allowed to visit the job-site? Do they need permission? A: Mr. Daniel Garcia responded that MDOT is aware that there may be different people and groups to visit the job-site and the permission may not be necessary. Q: Will videotaping the pouring process be permitted for educational purpose? A: Mr. Daniel Garcia assumed there wouldn’t be any problem for videotaping. Q: Foaming problem? A: Dr. Li commented that from previous large scale casting experience, it had been noticed that a strong and non-leakage foam-work is critical due to extreme good flowability of ECC. Dr. Li suggested the contractor to pay good attention to this point.

E 5
Q: How to finish the surface of ECC link slab after casting? A: Dr. Li commented that hand finishing was used for Mihara bridge deck in Japan. In the US, the tinning rake was used for the patching. However, it was conducted in an upside-down manner in order to prevent fiber pullout at the surface. Q: Raw materials supply – On time? A: Dr. Li commented that the primary contractor and ECC material supplier (Clawson Concrete) should realize that ordering and delivery of raw material may take time. Dr. Li suggested them to get on this early. Mr. Tom Schultz will ask the contractor to start inquiring on where and when the raw material can be obtained. Q: Who has the ultimate oversight responsibility for this project? A: Mr. Tom Shultz The meeting adjourned at approximately 2:30PM. The next meeting were planned be held for “Hands-on” training on Friday, June 3rd, 9:00AM-12:00PM. .

F 1
16.0 Appendix F

F 2
I-94 Road & Bridge Rehabilitation Project
Washtenaw County Contract ID: 81063 – 59277
________________________________________________ Progress Meeting Minutes
July 7, 2005 Today’s meeting began at 9:00AM and was held at the Central Fire Station in Ypsilanti. A list of those who attended is attached. There were no corrections to the minutes of the meeting held on June 23, 2005. Chief Morabito and/or staff stated that they had no pressing issues and were pleased with all communication to date. There was some discussion pertaining to the schedule of the progress meetings. It is desired to have them every two weeks rather than the 2nd and 4th Thursdays of the month. Chief Morabito checked their schedule and stated that the conference room would be available for the meeting of 8/18/05 if the meeting starts at 10:00 AM. This should be no problem! He also stated that there could be a conflict for the meeting of 9/29/05. This will be addressed at a future progress meeting. It was also stated by the Chief and his staff that there should be no problem working on the Harris Road and Grove Street structures concurrently. Engineer Issues: Once again all of the contractor’s were reminded of the need to submit accurate and signed testing orders. Cooperation in this area is necessary to insure the processing of timely and accurate bi-weekly pay estimates. Testing Orders are still needed from the following contractors: State Barricading, Weyand Brothers and PK Contracting. With Cheryl’s assistance Form 1155’s were received from Doan Concrete, however nothing has yet been received from Clawson & Killin Concrete. A summary of additional testing deficiencies was given to Cheryl on this date. Mike Lepech from the University of Michigan and Hal Ballenger from Clawson/Killin Concrete were present today to assist in the discussion of the ECC mixture. Following is what was learned:
1.) Clawson has or soon will obtain supplies of the required fibers, sand and fly ash. 2.) The mixing of the required trial batch is scheduled for July 16, 2005. The
location will be at Clawson’s Wagner Road plant. 3.) Mike Lepech will be present for the trial batch to obtain mix samples for testing. 4.) Midwest has the epoxy coated re-steel that will be used in the link slab, and it will
soon be delivered to the U of M.

F 3
5.) Midwest representatives will be present at the trial batch to experiment with different tining procedures.
6.) It was suggested that when placing the ECC material onto the structure at Grove Street that a crane and bucket be used instead of a pump truck.
7.) Prior to the actual pouring of the link slab it will be desired to have additional conversation at a future progress meeting. Wayne State should be represented at this meeting.
8.) Applicable testing staff should be notified of the trial batch! Gary Watters presented additional information pertaining to the remaining demolition work at the Harris Road structure. It is scheduled to resume at 8:00 PM on 7/17/05. Closures will be needed on both EB & WB I-94. The EB off-ramp to Willow Run will be closed and detoured on this date. Demo work will continue, starting at 8:00 PM on 7/18/05, on this date the I-94 WB on-ramp from Willow Run will be closed. If necessary the demo work will be completed on 7/19/05. All lanes of traffic will be opened by 5:00 AM on 7/20/05 to accommodate the Ann Arbor Art Fair. Demolition of the tailspans at the Rawsonville Road structure will start on either 7/11 or 7/12/05. There will be no interference with I-94 traffic at this time. The remaining demo work at the Rawsonville Road structure will be completed from 7/13/05 thru 7/15/05. Work will be accomplished by reducing I-94 traffic to a single lane (both EB & WB) from 11:00 PM until 5:00 AM. The demolition of the Grove Street structure is scheduled to start on7/25/05. Hydrodemolition plans are still required from Rampart and Safety Grooving. Tom reminded all of the contractors of the need to have technicians involved with testing receive IAT’s from qualified MDOT staff since I-94 is a NHS route. Shawn Tinkey stated that he would check the placement of the delineators on Ramp C and report them for pay. Nicki Baker mentioned that structural steel pay weights for the new pin & hanger assemblies had not yet been received. She also mentioned that she would be paying for additional temporary supports. All parties received, reviewed and agreed with the present assessment of lane rental charges. Contractor Issues: Iafrate intends to close the I-94 WB exit-ramp to Rawsonville Road at 9:00 AM on Monday, 7/11/05. The entrance ramp from Rawsonville Road to WB I-94 will be closed at 9:00 AM on Tuesday, 7/12/05. They hope to have all of the required work completed in approximately three weeks. Gary Watters stated that the required epoxy overlay for S01 of 81041 is scheduled for the week of July 18th. Gary also submitted unit prices from Right Rail, Inc. to establish new

F 4
unit prices for rigid delineator posts and delineator reflectors. An updated critical path was also presented by Mr. Watters. Because of the aforementioned changes in the schedule of the remaining demolition work it will need to be updated again. Concern was expressed over the poor response time of the Detroit Edison Company in regards to providing power for the signals at McCartney. Subsequent to today’s meeting it was learned that Detroit Edison had made the asked for hook-up. MISCELLANEOUS: Chief Morabito and staff expressed concern over the upcoming Heritage Festival in the City of Ypsilanti. It is scheduled for the third week of August. Attention needs to be given to this event. This date coincides with the last race of the season at Michigan International Speedway. Thus there should be no closures on the I-94 mainline. The existing shoulder closure on WB I-94 over Wiard Road is scheduled to be removed on Friday, July 8, 2005. . The meeting was adjourned at 10:30 PM. The next meeting is scheduled for 9:00 AM on July 21, 2005 at the same location. _____________________________ Notes Recorded by Tom Shultz

F 5
I-94 Road & Bridge Rehabilitation Project Washtenaw County
Contract ID: 81063 – 59277 ________________________________________________
Progress Meeting Minutes August 4, 2005
Today’s meeting began at 9:00AM and was held at the Central Fire Station in Ypsilanti. A list of those who attended is attached. There were no corrections to the minutes of the meeting held on July 21, 2005. Chief Morabito and/or staff once again mentioned that they had no pressing issues and continue to be pleased with all communication to date. Chief Morabito is still out of town but wishes to be informed of any pending traffic restrictions. As of this date no immediate changes are planned. Engineer Issues: Again all of the contractor’s were reminded of the need to submit accurate and signed testing orders. Cooperation in this area is necessary to insure the processing of timely and accurate bi-weekly pay estimates. Testing Orders are still needed from the following contractors: State Barricading and PK Contracting. The trial batch of the ECC mixture, which was performed on July 23, 2005 appears to have been successful. Satisfactory strength results are being obtained. The first stage of the demolition work at the Grove Street structure has been completed. It will soon be possible to predict with some accuracy as to when the ECC mixture will be produced. Representatives from both the University of Michigan and Wayne State University were present this date to help coordinate all of the efforts associated with their respective research projects. Mike Lepech (UM) presented additional data pertaining to the trial ECC mixture. All results are very positive. He also presented Hal Ballenger of Clawson Concrete with several suggestions that should help with the field application of the ECC mixture. These suggestions pertained to amount of mixing water, desired slump measurements, mixing time required after the addition of the fibers, possible screeding techniques and texturing techniques. Mr. Ballenger stated that the he was ready to have all of the materials on hand when needed. Rod Cliff (Midwest) mentioned that he will be delivering the epoxy coated steel to UM’s lab next week in order for them to attach the required monitoring devices. Considerable discussion also took place with the representatives from Wayne State. They need to be notified in advance of the actual pour in order that they can attach their strain gauges to the reinforcing steel once it is in place. They were also encouraged to

F 6
contact the Detroit Edison Company as soon as possible if they wish to explore the possibility of using their electric power. It is more than likely that an auxiliary source will have to be used. Jerome Lynch (UM) is going to coordinate the load testing for both universities once the deck has been poured. Representatives from both Universities were encouraged to attend the next progress meeting. At that time more definite information should be known as to when the pour will actually take place. Hydrodemolition plans are still required from Rampart and Safety Grooving. These contractors will soon be returning to the project, therefore it is important that there plans are submitted for approval. Tom gave Gary Watters a copy of Standard Plan VIII-340E, which depicts a Type E Cantilever Foundation. Tom also stated that two requests for a Contract Extension of Time had been received from Iafrate. It was pointed out that these are not really an actual contract extension of time request, but are more in the form of a modification to lane/ramp rental assessments. This has been discussed with the MDOT and it does not appear as though they will be given much consideration. However, it will be noted that they were received in a timely manner. It was also noted that on August 2, 2005 that Midwest Bridge Company was made aware of the fact that some “High Structure” permits were needed in order to comply with FAA regulations. Cheryl Heckla is pursuing this for Midwest Bridge. A reminder was also given that word had again been received from MDOT about pending DEQ visits pertaining to bridge painting. Tom commented that numerous complaints were received yesterday concerning the containment in place at the Harris Road structure. It appears as if considerable blasting residue is escaping through the false decking. All parties received, reviewed and agreed with the present assessment of lane rental charges. Contractor Issues: Ron Roby (Iafrate) mentioned Ramps D and F were opened to the public at approximately 9:00 PM on July 28, 2005. At this time Iafrate is concentrating on clean-up and punch-list work in the I-94 & Rawsonville Road interchange area. Iafrate will be back on site when additional bridge approaches are ready to be paved. Ron asked that they receive a timely notification for this work. Gary Watters (Midwest) presented the following information and/or documents:

F 7
1.) Additional documentation to justify the price for the removal and replacement of the fascia beam on the Rawsonville Road structure.
2.) A summary of traffic control items used to date, which had been furnished by State Barricades, Inc.
3.) Documentation pertaining to the stockpiling of structural steel for future work on S08 of 81062.
4.) Gary also stated that a unit price of $8.50 per square yard would be acceptable for the HMA removal done on the Grove Street structure.
5.) Gary said that he was anticipating a letter from G&M Painting, which would guarantee the performance of a concrete surface sealer applied on new concrete only seven days old. This has not yet been received.
MISCELLANEIOUS: Dan Garcia was reminded of the need to review the proposed scheme for the completion of the painting of the Harris Road structure. It is especially important to discuss the painting of the structure, which involves the closing of the ramp to Willow Run from EB I-94. Dan also stated that the MDOT had received word on this date that barrels utilized in a shoulder closure and utilizing a restricted speed limit are to be placed on the edge of metal, and not the edge of the shoulder. A Work Order will be prepared to address this issue. It was stated that University Region Bridge Engineer, Terry Johnson had approved the color selection presented by G&M Painting for the beams at the Grove Street structure. G&M has not yet responded to a possible one-year warranty for a concrete surface sealer. Shawn Tinkey (HNTB) presented Marc Kellum (Iafrate) with a detailed punch-list pertaining to the Rawsonville Road interchange area. Shawn noted that considerable silt fence needed remedial work. Most of the damage appears to have been caused by the fencing subcontractor. It was also stated that Shawn and Marc were working on agreeing to final quantities for much of the work completed by Iafrate to date. Nicki Baker (HNTB) mentioned the probable pending DEQ visit to the project and also addressed concerns over some of the practices being utilized by G&M Painting. Repeated warnings have been given to this contractor pertaining to proper safety practices. It may soon be necessary to issue an Interim Contractor Evaluation to address these concerns. Gary Watters was aware of some of the issues and has already contacted G&M. The meeting was adjourned at 10:30 PM. The next meeting is scheduled for 10:00 AM on August 18, 2005 at the same location. ___________________________ Notes Recorded by Tom Shultz

F 8
I-94 Road & Bridge Rehabilitation Project Washtenaw County
Contract ID: 81063 – 59277 ________________________________________________
Progress Meeting Minutes August 18, 2005
Today’s meeting began at 10:00AM and was held at the Central Fire Station in Ypsilanti. A list of those who attended is attached. There were no corrections to the minutes of the meeting held on August 4, 2005. Chief Morabito and/or staff again mentioned that they had no pressing issues and continue to be pleased with all communication to date. Chief Morabito and staff have been informed of the deck pour scheduled for the nights of Tuesday and Wednesday, August 23, 24, 2005. Appropriate MDOT staff has also been made aware of this pour schedule. Engineer Issues: Again all of the contractor’s were reminded of the need to submit accurate and signed testing orders. Cooperation in this area is necessary to insure the processing of timely and accurate bi-weekly pay estimates. Mike Lepech represented the U of M this date to express concerns about the rapidly approaching ECC pour. Since Roger Till (MDOT) was unable to attend today’s meeting no final decisions could be reached. The issue being addressed is the combination of the ECC link slab being poured in conjunction with a concrete sidewalk and concrete railing. It was suggested that both Mike and Tom Shultz try to contact Roger Till as soon as possible to meet with him to arrive at the final resolution. It was suggested that a meeting be scheduled for 9:00 AM at the Fire Station on Friday, August 26, 2005. Chief Morabito has been contacted and the room is available for such a meeting. As of this date the link slab is scheduled to be poured on 8/31/05. It was again mentioned that Jerome Lynch is coordinating the load testing of the Grove Street structure. This testing will be done prior to opening to traffic. Gary Watters was asked to prepare a rough estimate of the additional cost in the event that ECC material was used for the sidewalk and railing. Representatives from Wayne State University indicated that they would be visiting the Grove Street site prior to the tentative deck pour dates in order to start placing some of their monitoring equipment. They also indicated that they would be using batteries to record the data. They were encouraged to contact Tom Shultz if they had any concerns prior to the pour date and to verify that everything was still on schedule.

F 9
Hydrodemolition plans are still required from Rampart and Safety Grooving. Rampart recently completed the hydro work at the Rawsonville Road structure. As of its completion they no longer have an approved plan for the remaining work. The MDOT informed HNTB that a Standard Plan utilizing a spread footing was needed for the Type E Cantilever Foundation. A Standard Plan depicting “Cantilever Foundation Spread Type C, D, E (Detail VIII-330(SP))”was furnished to Midwest Bridge. Midwest may want to submit an alternate design. Gary Watters was reminded of this and will send us another approved MDOT Standard Plan in the very near future. Tom inquired if Midwest had been successful in obtaining the required FAA permits. If so please supply HNTB with a copy for their files. Gary is going to check on this with Cheryl Heckla. A reminder was once again given that word had again been received from MDOT about pending DEQ visits pertaining to bridge painting. Many sites are presently being visited. These visits will also likely encompass the diamond grinding and this years remaining hydrodemolition work. It was noted that spent abrasive material on the beam flanges was being closely looked at. Concern was expressed about the timeliness of insuring that all Traffic Control Devices in use on the project are NCHRP – 350 compliant. State Barricading has been cooperative to date and all of the required paper work is contained in the project files. Tom asked that the contractors start thinking about the work for the 2006 Construction Season. Especially traffic concerns pertaining to construction activities in the vicinity of the US-23 and I-94 Interchange. It is not too soon to start be pro-active. Tom mentioned that he had been in contact with Dan Garcia of MDOT. Dan indicated that approval has been obtained for short-term closures of the ramps in the vicinity of the Harris Road structure to facilitate the completion of the steel coating. Time restrictions are going to be required for the closures and additional information will be forthcoming. There were no lane rental or ramp rental assessments this period. Contractor Issues: Marc Kellum (Iafrate) stated that they would return to the site on Monday, August 22, 2005. Their work will consist of punch-list items and then on Wednesday of next week they hope to be able to work on preparing the approach pavement on the Harris Road structure. Ron Roby (Iafrate) said that their survey personnel should soon be able to address the earthwork quantities in the interchange vicinity. It is hoped that plan quantity will be acceptable.

F 10
Gary Watters (Midwest Bridge) presented the following documents and or information:
1.) A signed copy of Contract Modification #9, which will be sent to the TSC for processing.
2.) Copies of some of their employee’s “Welder Certifications.” 3.) Material certifications from Consolidated Systems, Inc. 4.) A Certificate of Compliance from Miamisburg Coating. 5.) A request from PK Contracting to establish the following Extra item of work to
the contract: Remove Curing Compound Special @ $1.95 per sft. 6.) Correspondence notifying HNTB and the MDOT that they are filing a claim
under Section 104.09 of the Standard Specifications. This claim pertains to the required shot-blasting on S01. This is a requirement prior to placing the epoxy overlay.
7.) A revised Critical Path, which was dated 8/01/05. 8.) The ECC pour on Grove Street is scheduled for August 31, 2005. Conventional
deck pours will be done on the nights of August 29th and 30th. The ECC pour is scheduled for a daytime pour.
9.) The Stage II deck pour at Rawsonville Road is scheduled for August 25, 2005. 10.) Harris Road is scheduled to be poured on the nights of August 23rd and 24th. 11.) PK Contracting has been hired to perform the required shot-blasting in conjunction with the epoxy overlay work remaining. They will not be on site until after Labor Day. Tom Shultz reminded Midwest of the temperature restrictions associated with the epoxy work. In the interim Midwest is going to complete the rehabilitation work on S01 prior to doing the epoxy overlay.
MISCELLANEIOUS: Nicki Baker commented that she had noticed three bolts missing from a diaphragm on the Rawsonville Road structure. Rod will be shown there location and they will be replaced in the near future. Nicki also commented that she was pleased to note the improved safety practices being exhibited by G&M Painting. Shawn Tinkey noted that there still remained a significant amount of punch-list work remaining to be done in the vicinity of Rawsonville Road and I-94. It was noted that a significant amount of the remaining work pertained to Rite Rail. Shawn also commented that he and Marc (Iafrate) would soon be ready to address many final quantities pertaining to the work at the interchange. The meeting was adjourned at 11:20 AM. The next meeting is scheduled for 9:00 AM on September 1, 2005 at the same location. Notes Recorded by: _________________________

F 11
I-94 Road & Bridge Rehabilitation Project Washtenaw County
Contract ID: 81063 – 59277 ________________________________________________
Progress Meeting Minutes September 1, 2005
Today’s meeting began at 9:00AM and was held at the Central Fire Station in Ypsilanti. A list of those who attended is attached. There were no corrections to the minutes of the meeting held on August 18, 2005. Chief Morabito and/or staff once again mentioned that they had no pressing issues and continue to be pleased with all communication to date. They did request a tentative schedule of remaining bridge work pertaining to structures over I-94. See comments in the miscellaneous section of the minutes. Engineer Issues: Again all of the contractor’s were reminded of the need to submit accurate and signed testing orders. Cooperation in this area is necessary to insure the processing of timely and accurate bi-weekly pay estimates. Kelcris Contracting had a representative at today’s meeting and they were specifically reminded to submit all required testing information as soon as possible. Mike Lepech represented the U of M at today’s meeting. Mike reported that on 8/26/05 a conference call was held between Roger Till (MDOT) and several representatives from the U of M. It was determined that all Stage I pours pertaining to Grove Street will proceed as detailed in the construction plans. In other words regular concrete sidewalk and concrete railing will be poured on top of the ECC material. Mike visited the site on 8/30/05 to meet with Nicki Baker to review the placement of the reinforcing steel in the link slab area. This too will be placed as per plan for Stage I. Mike again stated that all test data from the ECC trial batch continues to be very satisfactory. He does not anticipate any problems with the scheduled Link Slab pour on 9/08/05. He also stated that all visitors associated with the University of Michigan will be equipped with proper safety attire and that they have been cautioned not to impede the work of the contractor. Following the completion of the first ECC pour it will be closely monitored in regards to the effect of placing concrete sidewalk and concrete railing on top of it. In the event that any test data is unsatisfactory Roger Till (MDOT) has indicated that he will not object to using ECC material for the sidewalk and railing in Stage II construction. Gary Watters asked that this information be made available as soon as possible in case the supplier (Clawson Concrete) might have to make arrangements to secure additional materials for the ECC mixture.

F 12
Mike also mentioned that load testing of the deck is tentatively scheduled for September 19, 2005. Jihang Feng represented Wayne State University at today’s meeting in regards to their research program. They intend to have representatives on site during the day on Tuesday to install all of their sensors prior to the scheduled night pour. Coordination of this activity is being handled through Rod Cliff (Midwest Bridge). Rod’s cell phone number is: 517-404-6530. Once again Tom Shultz, HNTB mentioned that hydrodemolition plans are still required from Rampart and Safety Grooving prior to performing any additional work on the project. Gary Watters stated that he would fax details pertaining to his proposal for the Type E Cantilever Foundation required for the project. This information will then be forwarded to the MDOT for their review and approval. Garry Watters stated that Midwest had successfully completed all applications for the required FAA permits. These also will be faxed to HNTB’s office in Tecumseh. Tom Shultz again mentioned the importance of timely responses to the Work Zone Traffic Reports and the importance of insuring NCHRP and 350 compliance. As a result of comments made during the last progress meeting pertaining to potential future traffic concerns a meeting has been held with MDOT staff and HNTB staff to discuss such concerns. All of the contractors again were reminded to be PRO-ACTIVE in regards to any issues that they foresee for next years work. Information was received from Dan Garcia (MDOT) since the last meeting which pertains to the closing of EB I-94 Ramp to EB US-12 near Harris Road. Ideally the ramp can be closed from 9:00am to 2:00pm on a Tuesday, Wednesday or Thursday. Of major concern is notification to the public and all emergency services. There were no lane rental or ramp rental assessments this period. Contractor Issues: Marc Kellum (Iafrate) stated that they were pouring the approaches to the deck at Rawsonville road today. Following their completion and curing this means that the traffic pattern at the I-94 and Rawsonville Road interchange will soon be restored to its normal traffic pattern. Marc also mentioned that he presently had staff on site that was in the process of completing the final cross sections for the interchange area. Once this is done it will be possible to determine if plan quantities are acceptable for earthwork items. Marc and Shawn Tinkey (HNTB) also plan to review all of the concrete items of work at the I-94 and Rawsonville Road interchange area in the near future.

F 13
Gary Watters stated that he had received a letter from Tom Shultz, which expressed concern over the progress of the contract to date. Gary responded that he was comfortable with the progress to date. Furthermore he presented a very aggressive work schedule, which will be implemented as soon as the Harris Road structure is completely opened to traffic. Once that occurs Midwest intends to implement a lane shift on EB I-94, which will facilitate the following work activities: concrete pavement repairs, diamond grinding, shoulder corrugations, bridge painting, structure work, concrete surface sealer and the construction of the maintenance cross over. This work is tentatively scheduled to commence on or about September 19, 2005. It is possible that 24 hour work days will be involved at this time. All parties are strongly encouraged to attend the next progress meeting to get all of the particulars of this schedule. MISCELLANEOUS: Nicki Baker commented on the over-all improvement pertaining to G&M Painting’s contract items of work. A significant improvement has been seen in both quality and safety. Shawn Tinkey reminded all of the contractors that there was still a significant amount of work remaining on the previously issued punch-list involving the I-94 and Rawsonville Road interchange area. Rod Cliff (Midwest Bridge) presented the following schedule to address the Townships interest in the progress of the work involving the structures over I-94.
1.) Rawsonville Road should be opened to normal traffic flow on or before 9/10/05. 2.) All work involving Wiard Road and McCartney Road should be completed within
two weeks. 3.) Harris Road should be completely opened to traffic within two weeks. 4.) Stage II construction at Grove Street should commence within three weeks, and
all of the work at Grove should be completed with 1.5 months. 5.) Work on the Huron Street structure is scheduled to commence the day after Harris
Road is completely opened to traffic. 6.) Work on S01 (US-12 By-pass) should be completed within three weeks.
All of the above dates are approximate and subject to weather delays. Tom Shultz mentioned that Midwest Bridge had been given direction to secure temporary barrier wall to the new deck on the Grove Street structure as per the old MDOT standard plan that had been distributed at a previous progress meeting. There will be some additional const associated with this work. The meeting was adjourned at 10:30 AM. The next meeting is scheduled for 9:00 AM on September 15, 2005 at the same location. Notes Recorded by: _________________________

F 14
I-94 Road & Bridge Rehabilitation Project Washtenaw County
Contract ID: 81063 – 59277 ________________________________________________
Progress Meeting Minutes September 15, 2005
Today’s meeting began at 9:00AM and was held at the Central Fire Station in Ypsilanti. A list of those who attended is attached. There were no corrections to the minutes of the meeting held on September 1, 2005. Chief Morabito and/or staff were represented at today’s meeting. Their main interest remains on future road restrictions. An update was given to the Chief by Rod Cliff, Midwest Bridge. These restrictions will be detailed later in the minutes. The Chief reminded today’s attendees that there was a scheduling conflict for the next scheduled Progress Meeting. It will be scheduled 1:00 PM on 9/29/05. Engineer Issues: Once again all of the contractor’s were reminded of the need to submit accurate and signed testing orders. Cooperation in this area is necessary to insure the processing of timely and accurate bi-weekly pay estimates. Kelcris responded with their required testing information following the last progress meeting. The first ECC pour was successfully completed on September 3, 2005 on the Grove Street structure. Mike Lepech from the University of Michigan has reported that all strength data generated to date has been very satisfactory. Mike visited the site on 9/13/05 to observe some temperature cracks in the link slab, which had been observed during the forming of the sidewalk. Although these cracks were not desired they are not thought to be detrimental to the ECC material. Load testing of the deck is scheduled for 9/19/05. This date is dependent upon the deck obtaining 80% of its 28 day strength on or before the 19th. NTH Consultants are scheduled to perform 7-day cylinder testing on 9/16. They will report the test results to both Midwest Bridge and HNTB. If needed an additional cylinder could be tested on Saturday. In order to schedule the load testing vehicle it is necessary to inform the University of Michigan research team of the cylinder results. Prior to the load testing the University of Michigan research team needs to install additional monitoring equipment on the Grove Street structure. This work should be coordinated by way of Rod Cliff, Midwest Bridge. Tom again reminded all parties that if a decision is made concerning additional usage of ECC material for Stage II construction this information must be made known ASAP in order that Clawson Concrete can insure that they have available materials on hand.

F 15
Wayne State representatives were at the Grove Street structure for the night pour on September 2, 2005. They felt that all of their required monitoring instruments were placed satisfactorily. Hydrodemolition plans were received from both Rampart Hydro Services and Inland Waters Pollution Control, Inc. Action will be taken as soon as possible to get these plans approved. Tom gave Gary Watters a copy of Standard Plan VIII – 330E SP, which has been specified for the needed cantilever foundation on this project. This design was mandated by the MDOT. In addition the following documents were also given to Gary:
1.) Plan Revision B-2 for “Changes to Slab and Screed Data” pertaining to S02 of 81063 JN 59281A, Grove St. over I-94 and S06 of 81063 JN 59277A, Harris Road over I-94. This information had been obtained prior to working on these structures.
2.) Plan Revision B-1 for “Change Steel for Beam P to 50 ksi” pertaining to S08-1 of 81062 JN 59277A, US-23 over I-94.
Tom again reminded all of the contractors again to be PRO-ACTIVE in regards to any issues that they foresee for next years work. A lane rental agreement form was signed and processed at today’s meeting. Contractor Issues: Rod Cliff and Gary Watters informed all attendees of the following traffic information:
1.) The Rawsonville Road & I-94 interchange is completely opened to traffic. 2.) All lanes of traffic have resumed their normal pattern on the Harris Road
structure. 3.) Rod Cliff is going to follow-up on making sure that State Barricading removes
the construction signing from the vicinity of the Harris Road structure. 4.) Rod stated that the current work on McCartney Road should be completed in
approximately three days. 5.) Traffic control on the Huron Road structure should be in place by this Friday.
This traffic control is being coordinated with an adjacent project, which is being administered by the Washtenaw County Road Commission.
In addition to the preceding statements the following traffic information was also discussed by Midwest Bridge representatives:
1.) A traffic shift for EB I-94 is scheduled to be implemented on Monday, September 19, 2005. This shift will be from approximately Harris Road to Rawsonville Road. The work area will consist of the right lane and the center lane.

F 16
2.) A traffic shift for WB I-94, which will encompass the same area as above is scheduled for September 31, 2005.
3.) The contractor hopes to have Stage I construction at Grove Street completed by September 23, 2005. Stage II is scheduled to be completed by October 24, 2005.
It should be noted that all of the indicated dates are contingent on the weather. Considerable discussion also ensued during today’s meeting about the EB I-94 Ramp to US-12 (Willow Run). It is essential that this ramp be able to be closed on an as-needed basis to facilitate the work that is going to be taking place during the lane shifts employed on EB I-94. Tom Shultz is going to contact the MDOT in regards to this issue. Ron Roby, Iafrate stated that they are willing to agree to plan quantity for the earthwork items of work associated with the completed construction at the I-94 and Rawsonville Road interchange area. He also mentioned that the concrete approaches for Stage I at Grove Street had been poured on 9/14/05. Ray Czenski, Kelcris mentioned that an extra item of work for C-2 joints might be needed for the larger concrete pavement repair areas. MISCELLANEOUS: MDOT Resident Engineer, Jim Daavettila was informed of an existing washout in the NE quadrant of the Harris Road structure. Following today’s meeting Jim looked at the area and decided that it was beyond the scope of this contract to attempt repairs. NOTE: DIFFERENT MEETING TIME FOR NEXT PROGRESS MEETING!!!! The meeting was adjourned at 10:10AM. The next meeting is scheduled for 1:00 PM on September 29, 2005 at the same location. Notes Recorded by: _________________________

F 17
I-94 Road & Bridge Rehabilitation Project Washtenaw County
Contract ID: 81063 – 59277 ________________________________________________
Progress Meeting Minutes September 29, 2005
Today’s meeting began at 1:00 PM and was held at the Central Fire Station in Ypsilanti. A list of those who attended is attached. There were no corrections to the minutes of the meeting held on September 15, 2005. Chief Morabito and/or staff were not represented at today’s meeting. However, prior to leaving the fire station Nicki Baker and Tom Shultz informed the appropriate staff of the pending traffic shifts scheduled for WB I-94 on Monday, October 3, 2005. Engineer Issues: Again all of the contractor’s were reminded of the need to submit accurate and signed testing orders. Cooperation in this area is necessary to insure the processing of timely and accurate bi-weekly pay estimates. It was also mentioned that tomorrow, 9/30/05, is MDOT’s year-end closing. As a result of this an estimate will be prepared for all work completed to date. Tom again reminded all parties that if a decision is made concerning additional usage of ECC material for Stage II construction this information must be made known ASAP in order that Clawson Concrete can insure that they have available materials on hand. Tom will attempt to contact the University of Michigan research team in regards to this matter. On Friday, 9/30/05, I spoke with Mike Lepech in regards to the ECC material. U of M is pleased with all strength results obtained so far and they continue to investigate the cracks that appeared in the first pour. Mike’s only concern pertaining to ECC materials concerns the fly ash that was used in the first mix. Additional information will be forthcoming and Mike intends to be at the next progress meeting. Hydrodemolition plans were approved for both Rampart Hydro Services and Inland Waters Pollution Control, Inc. Tom again reminded all of the contractors again to be PRO-ACTIVE in regards to any issues that they foresee for next years work. During the last progress meeting Gary Watters had presented Tom with several new contract items of work, which pertained to the completion of the concrete pavement repairs. Since then it has been noted that the existing contract contains price information for those items of work. These possible extra items of work involved several kinds of joints associated with the concrete pavement repairs.
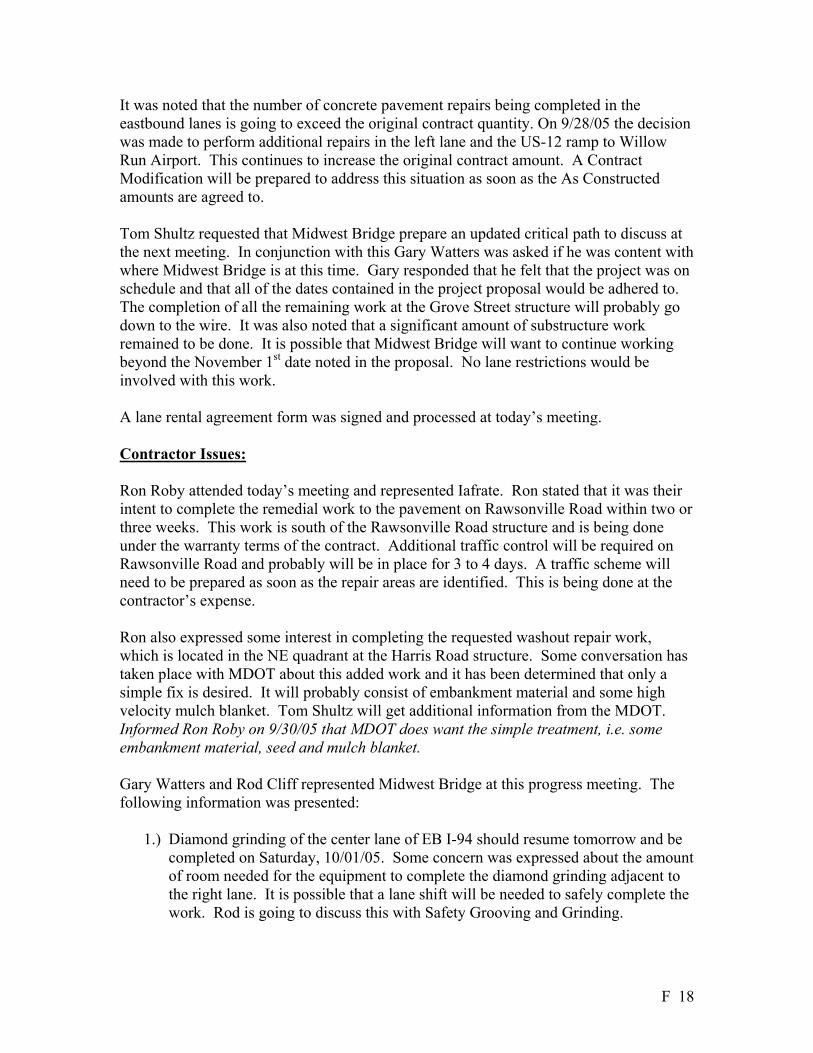
F 18
It was noted that the number of concrete pavement repairs being completed in the eastbound lanes is going to exceed the original contract quantity. On 9/28/05 the decision was made to perform additional repairs in the left lane and the US-12 ramp to Willow Run Airport. This continues to increase the original contract amount. A Contract Modification will be prepared to address this situation as soon as the As Constructed amounts are agreed to. Tom Shultz requested that Midwest Bridge prepare an updated critical path to discuss at the next meeting. In conjunction with this Gary Watters was asked if he was content with where Midwest Bridge is at this time. Gary responded that he felt that the project was on schedule and that all of the dates contained in the project proposal would be adhered to. The completion of all the remaining work at the Grove Street structure will probably go down to the wire. It was also noted that a significant amount of substructure work remained to be done. It is possible that Midwest Bridge will want to continue working beyond the November 1st date noted in the proposal. No lane restrictions would be involved with this work. A lane rental agreement form was signed and processed at today’s meeting. Contractor Issues: Ron Roby attended today’s meeting and represented Iafrate. Ron stated that it was their intent to complete the remedial work to the pavement on Rawsonville Road within two or three weeks. This work is south of the Rawsonville Road structure and is being done under the warranty terms of the contract. Additional traffic control will be required on Rawsonville Road and probably will be in place for 3 to 4 days. A traffic scheme will need to be prepared as soon as the repair areas are identified. This is being done at the contractor’s expense. Ron also expressed some interest in completing the requested washout repair work, which is located in the NE quadrant at the Harris Road structure. Some conversation has taken place with MDOT about this added work and it has been determined that only a simple fix is desired. It will probably consist of embankment material and some high velocity mulch blanket. Tom Shultz will get additional information from the MDOT. Informed Ron Roby on 9/30/05 that MDOT does want the simple treatment, i.e. some embankment material, seed and mulch blanket. Gary Watters and Rod Cliff represented Midwest Bridge at this progress meeting. The following information was presented:
1.) Diamond grinding of the center lane of EB I-94 should resume tomorrow and be completed on Saturday, 10/01/05. Some concern was expressed about the amount of room needed for the equipment to complete the diamond grinding adjacent to the right lane. It is possible that a lane shift will be needed to safely complete the work. Rod is going to discuss this with Safety Grooving and Grinding.

F 19
2.) Rampart is tentatively scheduled to return to the project on Tuesday. They will start the hydro demolition work at the Ford Lake structure in the WB lanes of I-94.
3.) The epoxy overlay work on S01 is scheduled for tomorrow. MDOT (Scott Geiger) reviewed the shot-blasting of the deck on this date and felt comfortable with its appearance.
4.) Barrett Paving is tentatively scheduled to return to the project on October 8th. Their work will consist of HMA approach work at the Ford Lake structure. Bret LaCoe, University Region TMI, has been contacted to make sure that Barrett has an approved JMF for a HMA 5E30 mix.
5.) Gary requested that following the processing of the next pay estimate that he be sent a copy of the account balance sheets for the contract items of work.
6.) Gary Watters asked that Tom check with the MDOT about a possible early opening of the deck at the Ford Lake structure. He said that they would use insulated blankets to expedite the strength gain of the deck. Beams would also be made. Tom expressed doubt that MDOT would agree to this, but he will check.
MISCELLANEOUS: Shawn Tinkey commented that he and Devon (Kelcris) were in agreement with the concrete repair quantities, which have been completed to date. He also stated that he hoped that it would be possible to use a HMA mix adjacent to the ramp patches that have been added to the contract. This is the desired treatment. Prior to the start of today’s meeting it was learned via Dan Garcia (MDOT) that the bridge project to the west of our contract intends to implement a lane shift on WB I-94 this next Monday. They intend to have the right lane closed under the Michigan Avenue structure for a period of four days. It is possible that this could be in conflict with the Midwest’s proposed lane shift for the same date. Midwest intends to have a shift in place from the Huron Street structure to the Harris Road structure. Traffic will be on the right shoulder and the right lane. Prior to these shifts it will be necessary to measure the distance between the structures to determine if the closures need to be connected. Tom asked that Kelcris revisit the cost of their re-mobilization costs pertaining to last week-end’s work. It was noted that Kelcris did not remove all of their equipment as was originally planned. The meeting was adjourned at 2:00 PM. The next meeting is scheduled for 9:00 AM on October 13, 2005 at the same location. Notes Recorded by: _________________________

F 20
I-94 Road & Bridge Rehabilitation Project Washtenaw County
Contract ID: 81063 – 59277 ________________________________________________
Progress Meeting Minutes October 13, 2005
Today’s meeting began at 9:30 AM and was held at the Central Fire Station in Ypsilanti. A list of those who attended is attached. There were no corrections to the minutes of the meeting held on September 29, 2005. Chief Morabito and/or staff were present for only a short portion of the meeting. Again their primary concern focused on pending traffic issues. Rod Cliff informed all present that next week would see the removal of traffic control devices in use on Wiard Road under I-94 and on McCartney Road. We will keep Chief Morabito informed as to when the epoxy overlay is scheduled for the Huron Road structure. A mainline traffic shift is tentatively scheduled for 10/18/05 on mainline WB I-94. Engineer Issues: Mike Lepech represented the University of Michigan at today’s meeting in regards to the next ECC pour. Mike informed all that no additional materials will be needed to complete the quantity of ECC material required for this project. It is Mike’s intent to modify some of the mix proportions in an attempt to modify shrinkage cracking. Mike also distributed a hand out which depicted ECC material test results from the first pour. Following is the schedule for the Grove Street structure:
1.) Saturday, 10/15/05: Stage II, first pour, 8:00 PM 2.) Monday, 10/17/05: Stage II, second pour, 8:00 PM 3.) Tuesday, 10/18/05: Stage II, Link Slab pour, 5:00 AM
Representatives from Wayne State are aware of this schedule and should be in contact with Rod in the very near future. Tom again reminded all of the contractors again to be PRO-ACTIVE in regards to any issues that they foresee for next years work. Jim Daavettila, MDOT RE, has contacted the Region Soils & Materials Engineer, Mark Melchiori in regards to taking some shoulder cores in the vicinity of the US-23 and I-94 interchange. Correspondence has been continuing with Kelcris in order to reach agreement concerning the As Constructed amount of the concrete pavement repairs completed in the EB lanes of I-94. A CM will be prepared as soon as agreement is reached. It was also mentioned that we have not yet reached agreement with all of Iafrate’s concrete items of work. This should be done in the near future.

F 21
Tom Shultz asked that Midwest Bridge prepare a critical path and present it at the next progress meeting. During the course of the meeting, warranty documents pertaining to the five year warranty on the new pavement at the I-94 and Rawsonville Road interchange were signed. These documents will be processed through the appropriate MDOT channels in the very near future. Gary Watters was reminded of the need to submit prices for three extra items of work. 1.) Crossover grading 2.) Welding of median structure covers in the median shoulder of EB I-94 3.) Repair of one existing drainage structure in the median shoulder of EB I-94 (Located at Sta 327 +/-) A lane rental agreement form was signed and processed at today’s meeting. Contractor Issues: Ron Roby attended today’s meeting and represented Iafrate. Ron stated that the new concrete approach pavement at the Ford Lake structure is being poured today. He is planning on placing the approach pavement at the Grove Street structure on Wednesday, 10/19/05. It was also noted that the required HMA material is scheduled to be placed at the Ford Lake structure on Friday and Saturday of this week. It is Iafrate’s intent to start and complete the remedial work on Rawsonville Road following the completion of the approach work at the Grove Street structure. The erosion repair in the NE quadrant of the Harris Road structure will be scheduled once traffic is shifted on WB I-94. Gary Watters and Rod Cliff represented Midwest Bridge at this progress meeting. The following information was presented:
1.) The remaining epoxy overlay work at the Huron Road structure will be scheduled as soon as possible. This work is weather dependent! It was stated that based on the past epoxy overlay work completed that HNTB staff would determine when the deck was ready to receive the epoxy.
2.) Midwest hopes to be ready to shift traffic on WB I-94 on Tuesday, 10/18/05. It is then their intent to have all lanes of I-94 open on Monday, 10/31/05.
3.) Gary asked that the recommended Standard Plan pertaining to the new cantilever foundation be reviewed once again. The new foundation is going to be placed on a slope, thus a spread footing does not appear to be desirable. Tom will check into this.
4.) Gary presented a letter to HNTB, which requested permission to work beyond 11/01/05 on substructure repairs. He indicated that no lane closures would be needed, but that this work would require a shoulder closure. This request will be reviewed with MDOT personnel.

F 22
MISCELLANEOUS: Nicki Baker mentioned that extreme caution will be required during the hydro demolition work, which remains at the Ford Lake structure. The existing deck appears to be very deteriorated in some areas. Nicki also mentioned that the plans do not indicate that a new road name side is required for the WB side of the Grove Street structure. Gary Watters indicated that he would get the new sign ordered. In addition Nicki suggested that it would be a good idea to have some insulating blankets on site for the remaining deck pours. Shawn Tinkey again mentioned some of Iafrate’s remaining punch-list items of work. They included: downspouts at Rawsonville Road, additional riprap needs to be placed at specified locations, repair of existing median drainage structure, approach sidewalk and curb at Grove Street, yard clean-up, removal of silt fence where directed and the remedial pavement repairs on Rawsonville Road. Nicki Baker gave Midwest bridge a detailed list of work remaining at the following locations: S03 (Rawsonville Rd. over I-94), S02-3 & S02-4 (I-94 over Wiard and McCartney Roads) S01-4 (US-12 Ramp over I-94) and S06 (Harris Road over I-94). Tom Shultz stated that all work pertaining to bridge connections should be done in accordance with the newest Standard Plan. An older version exists in the contract documents. The meeting was adjourned at 10:30 AM. The next meeting is scheduled for 9:00 AM on October 27, 2005 at the same location. Notes Recorded by: _________________________

F 23
I-94 Road & Bridge Rehabilitation Project Washtenaw County
Contract ID: 81063 – 59277 ________________________________________________
Progress Meeting Minutes October 27, 2005
Today’s meeting began at 9:00 AM and was held at the Central Fire Station in Ypsilanti. A list of those who attended is attached. Subsequent to the last meeting, Ron Roby (Iafrate) contacted Tom and informed him that the information pertaining to the tentative pour date of the approach pavement for the Grove Street structure was noted incorrectly in the last meeting minutes. Iafrate’s tentative pour date was said to be the 21st not the 17th as shown in the minutes. They were poured on the 22nd. No additional corrections were noted. Chief Morabito and/or staff were present for today’s meeting. Arrangements were made to schedule one additional progress meeting for this season. This was done with Chief Morabito’s concurrence. Appreciation was voiced for being kept continuously in the loop of traffic control issues throughout the project. Working with Chief Morabito and his staff has been very beneficial to all parties. Engineer Issues: Since this construction season is winding down, Tom again reminded all of the contractors to be PRO-ACTIVE in regards to any issues that they foresee for next years work. A Contract Modification had been prepared and sent to Midwest, which addressed the increased quantities associated with the concrete pavement repairs on eastbound I-94. Gary returned the signed copy at the meeting, it will be sent to MDOT for processing. Tom Shultz asked that Gary Watters contact G&M Painting in regards to the warranty aspects of the structural steel painting. It is not felt that any work is yet 100% complete. However, if some of the work is ready to start the warranty period, it should be addressed. Gary Watters was reminded of the need to submit prices for four extra items of work. 1.) Crossover grading 2.) Welding of median structure covers in the median shoulders of I-94. 3.) Erosion repair work, recently completed in the NE quadrant of the Harris Road structure. 4.) An appropriate price for the bridge connections being used on this project. It was
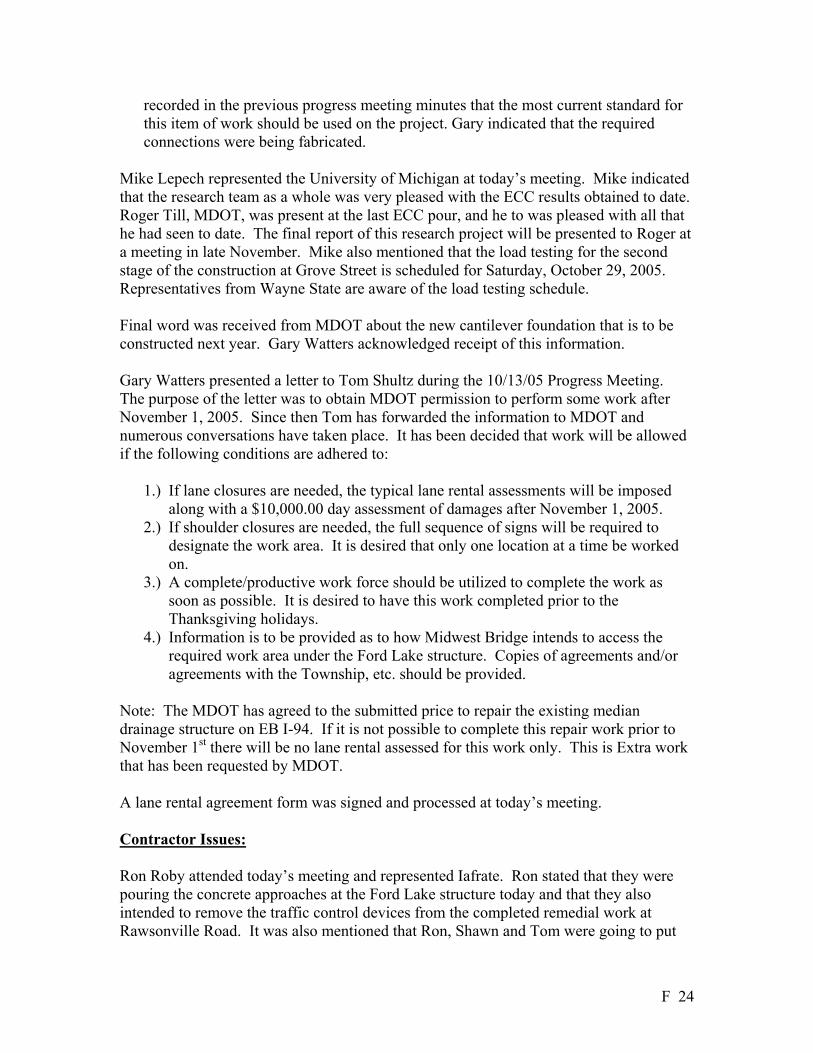
F 24
recorded in the previous progress meeting minutes that the most current standard for this item of work should be used on the project. Gary indicated that the required connections were being fabricated.
Mike Lepech represented the University of Michigan at today’s meeting. Mike indicated that the research team as a whole was very pleased with the ECC results obtained to date. Roger Till, MDOT, was present at the last ECC pour, and he to was pleased with all that he had seen to date. The final report of this research project will be presented to Roger at a meeting in late November. Mike also mentioned that the load testing for the second stage of the construction at Grove Street is scheduled for Saturday, October 29, 2005. Representatives from Wayne State are aware of the load testing schedule. Final word was received from MDOT about the new cantilever foundation that is to be constructed next year. Gary Watters acknowledged receipt of this information. Gary Watters presented a letter to Tom Shultz during the 10/13/05 Progress Meeting. The purpose of the letter was to obtain MDOT permission to perform some work after November 1, 2005. Since then Tom has forwarded the information to MDOT and numerous conversations have taken place. It has been decided that work will be allowed if the following conditions are adhered to:
1.) If lane closures are needed, the typical lane rental assessments will be imposed along with a $10,000.00 day assessment of damages after November 1, 2005.
2.) If shoulder closures are needed, the full sequence of signs will be required to designate the work area. It is desired that only one location at a time be worked on.
3.) A complete/productive work force should be utilized to complete the work as soon as possible. It is desired to have this work completed prior to the Thanksgiving holidays.
4.) Information is to be provided as to how Midwest Bridge intends to access the required work area under the Ford Lake structure. Copies of agreements and/or agreements with the Township, etc. should be provided.
Note: The MDOT has agreed to the submitted price to repair the existing median drainage structure on EB I-94. If it is not possible to complete this repair work prior to November 1st there will be no lane rental assessed for this work only. This is Extra work that has been requested by MDOT. A lane rental agreement form was signed and processed at today’s meeting. Contractor Issues: Ron Roby attended today’s meeting and represented Iafrate. Ron stated that they were pouring the concrete approaches at the Ford Lake structure today and that they also intended to remove the traffic control devices from the completed remedial work at Rawsonville Road. It was also mentioned that Ron, Shawn and Tom were going to put

F 25
forth some effort to get all of the concrete items of work finaled for the I-94 and Rawsonville Road interchange area. Gary Watters and Rod Cliff represented Midwest Bridge at this progress meeting. The following information was presented:
1.) It is their intent to open the Huron Road and Grove Street structures to normal traffic configuration either Sunday or Monday.
2.) Traffic control devices have recently been removed from Wiard and McCartney. 3.) All structures are intended to be open to normal traffic flow by Tuesday,
November 1, 2005. 4.) There was also considerable discussion pertaining to traffic control plans for the
coming week-end. Following the progress meeting, numerous conversations evolved with MDOT staff to discuss the proposed plans. Following is what was determined: Westbound I-94 will be reduced to one lane of traffic between Wiard Road and Grove Street. The closure will begin on Friday at 8:00 PM and end on Saturday at 10:00 AM. Eastbound I-94 traffic will be reduced to one lane between Huron Street and Grove Street. The closure will begin Friday at 8:00 PM and end on Saturday at 10:00 AM. If the desired work is not completed during the indicated time frames an additional closure will be needed.
MISCELLANEOUS: Nicki Baker mentioned that she was going to check on the amount of substructure repair work required at the Huron Street structure. Shawn Tinkey stated that Iafrate still had additional punch-list work to complete and that he and Ron Roby would be working on finaling all concrete quantities. Tom Shultz mentioned that he would check with MDOT to inquire if they wanted any construction signing left in place during the winter shut down. The meeting was adjourned at 10:20 AM. The next meeting is scheduled for 9:00 AM on November 10, 2005 at the same location. It is assumed that this will be the last meeting of the 2005 Construction Season. Notes Recorded by: _________________________

F 26
I-94 Road & Bridge Rehabilitation Project Washtenaw County
Contract ID: 81063 – 59277 ________________________________________________
Progress Meeting Minutes November 10, 2005
Today’s meeting began at 9:00 AM and was held at the Central Fire Station in Ypsilanti. A list of those who attended is attached. There were no corrections to the meeting minutes of October 27, 2005. Chief Morabito and staff were present for today’s meeting. Appreciation was expressed by MDOT, the Contractors and HNTB for the hospitality displayed by Chief Morabito and his staff. Chief Morabito also expressed his appreciation of being informed of the progress and pending road closures experienced to date. Chief Morabito suggested that when next years progress meetings are ready to resume that we contact Alan D’agastino at the Pittsfield twp. Fire Department. The address is 6227 W. Michigan / Ann Arbor, Mi. 48108. Mr. D’agastino may be reached at 734-944-8191 or 734-944-4911. Arrangements will be made prior to commencing next year’s construction activities. Engineer Issues: Since this is the last scheduled Progress Meeting for this construction season, all parties were again reminded of the need to be PRO-ACTIVE in regards to any issues that they foresee for next years work. Gary Watters was reminded of the need to submit prices for three extra items of work. 1.) Welding of median structure covers in the median shoulders of I-94. 2.) Erosion repair work, recently completed in the NE quadrant of the Harris Road structure. 3.) An appropriate price for the bridge connections being used on this project. It was
recorded in the previous progress meeting minutes that the most current standard for this item of work should be used on the project. Gary indicated that the required connections were being fabricated. The subject connections have now been installed; two were placed on the Grove Street structure and one on the Harris Road structure. A statement of charges for the “Emergency Crossover” grading was submitted by Mr. Watters at today’s meeting. A Contract Modification will be prepared to address this extra item of work.

F 27
Mike Lepech represented the University of Michigan at today’s meeting. Mike expressed appreciation for all of the cooperation exhibited by Midwest Bridge, MDOT and HNTB. In turn Mike was informed that all parties felt that there was minimal inconvenience experienced in regards to conducting the experimental ECC pours. Mike also stated that the formal report would be submitted to MDOT later this month. A meeting has been scheduled with Roger Till of MDOT. Mike was encouraged to provide some feedback in regards to MDOT’s feelings about the ECC Link Slab.
Tom Shultz stated that he had been in contact with State Barricading in regards to their quantities used to date on this project. They are concerned with the number of lighted drums on the project, versus the number that have been reported for pay. Gary Watters was asked to discuss this issue with them.
Midwest Bridge was reminded of the need to be cognizant of the colder weather in regards to their substructure repair work. With cooler weather the provisions of Section 706.03 of the 2003 Standard Specifications for Construction need to be adhered to.
PUNCH-LISTS: It was noted that Nicki Baker had previously presented Midwest Bridge with a comprehensive punch-list on 10/13/05. This list has been up-dated and was again presented to the contractors at today’s meeting. In addition two additional punch-lists had been prepared and were distributed. One list addressed only issues pertaining to G&M Painting and the other list primarily dealt with roadwork items. It was noted that following the completion of G&M’s punch-list the required “Warranty Acceptance” paperwork would be initiated if deemed to be appropriate. Gary and Kim are to discuss this issue and let Tom know.
A lane rental agreement form was signed and processed at today’s meeting. Total lane rental fees assessed to date amount to $1,716,500.00. Contractor Issues: Ron Roby attended today’s meeting and represented Iafrate. Ron stated that by the end of next week that Iafrate should have their portion of the clean-up completed at the storage yard located at the I-94 and Rawsonville Road interchange. In addition Ron stated that he is continuing to work on their final quantities for contract items of work completed to date. Gary Watters and Rod Cliff represented Midwest Bridge at this progress meeting. Rod commented that clean-up adjacent to the mainline at the Grove Street and Harris Road structures is progressing in a satisfactory manner. Preparations are also underway to start the substructure repair work at the Ford Lake structure. It was noted that it is still the intent of Midwest Bridge to complete all of this year’s work by the Thanksgiving holidays.

F 28
MISCELLANEOUS: Nicki Baker reminded Midwest Bridge of the need to complete the slope paving repairs at the Wiard Road structure and the return wall at the Harris Road structure. Rod mentioned that both would be completed in the very near future. Tom Shultz previously had mentioned that he would check with MDOT to inquire if they wanted any construction signing left in place during the winter shut down. Prior to today’s meeting Tom had been in contact with Jim Daavettila in regards to this subject. It was decided that at the completion of this year’s work that all construction signing could be removed. It will be relocated for next year’s work. The meeting was adjourned at 10:15 AM. INFORMATION WILL BE FORTHCOMING AS TO THE DATE, TIME AND LOCATION OF THE NEXT PROGRESS MEETING. Notes Recorded by: Tom Shultz

G 1
17.0 Appendix G

Michael Lepech
G 2
Michael Lepech
Michael Lepech
Michael Lepech
Michael Lepech
Michael Lepech
Michael Lepech

Michael Lepech
G 3
Michael Lepech
G
Michael Lepech
Michael Lepech
Michael Lepech

Michael Lepech
G 4
Michael Lepech
G
Michael Lepech
Michael Lepech
Michael Lepech
Michael Lepech

Michael Lepech
G 5
Michael Lepech
Michael Lepech
Michael Lepech
Michael Lepech
Michael Lepech
Michael Lepech
Michael Lepech
Michael Lepech

Michael Lepech
G 6
Michael Lepech
Michael Lepech
Michael Lepech
Michael Lepech

Michael Lepech
G 7
Michael Lepech
Michael Lepech
Michael Lepech
Michael Lepech

Michael Lepech
G 8
Michael Lepech
Michael Lepech
Michael Lepech
Michael Lepech
Michael Lepech
G

Michael Lepech
G 9
Michael Lepech
Michael Lepech
Michael Lepech
Michael Lepech

Michael Lepech
G 10
Michael Lepech
Michael Lepech
Michael Lepech
Michael Lepech

Michael Lepech
G 11
Michael Lepech
Michael Lepech
Michael Lepech
Michael Lepech

Michael Lepech
G 12
Michael Lepech
Michael Lepech
Michael Lepech
G 12
Michael Lepech
Michael Lepech

Michael Lepech
G 13
Michael Lepech
Michael Lepech
Michael Lepech
Michael Lepech

Michael Lepech
G 14
Michael Lepech
Michael Lepech
Michael Lepech
Michael Lepech

Michael Lepech
G 15
Michael Lepech
Michael Lepech
Michael Lepech
Michael Lepech

Michael Lepech
G 16
Michael Lepech
Michael Lepech
Michael Lepech
Michael Lepech
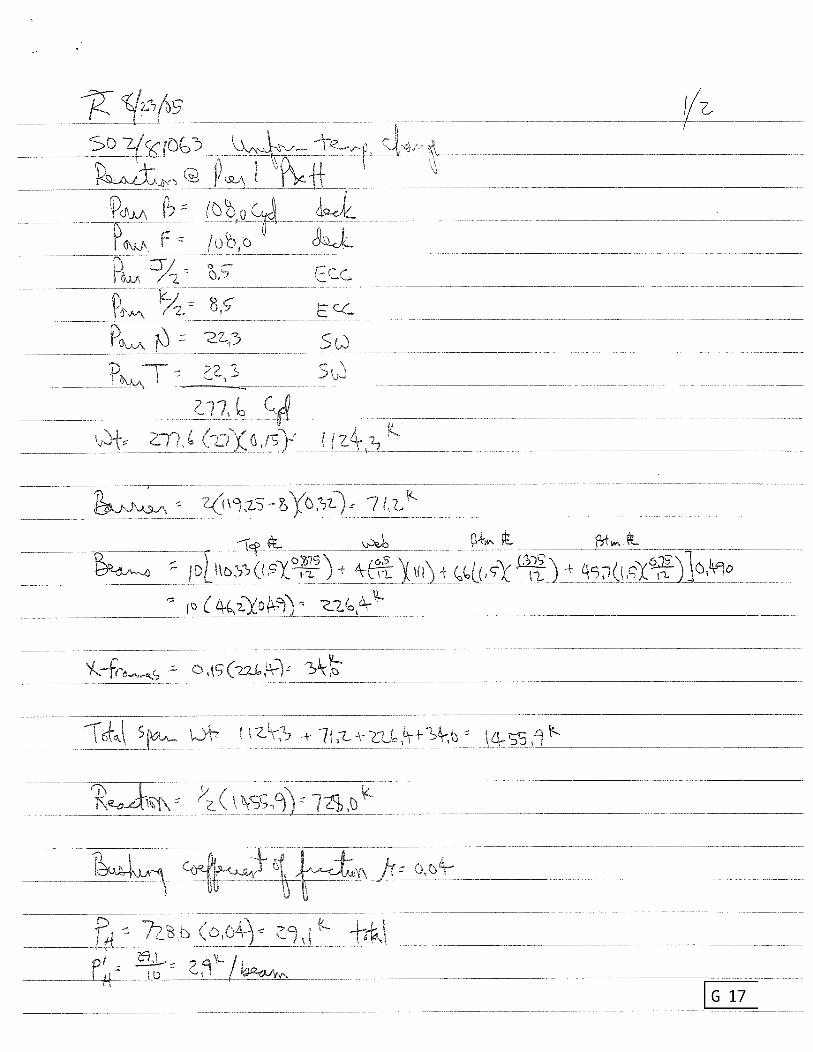
Michael Lepech
G 17
Michael Lepech
Michael Lepech
Michael Lepech
Michael Lepech
Michael Lepech

Michael Lepech
G 18
Michael Lepech
Michael Lepech
Michael Lepech
Michael Lepech

Michael Lepech
G 19
Michael Lepech
Michael Lepech
Michael Lepech
Michael Lepech
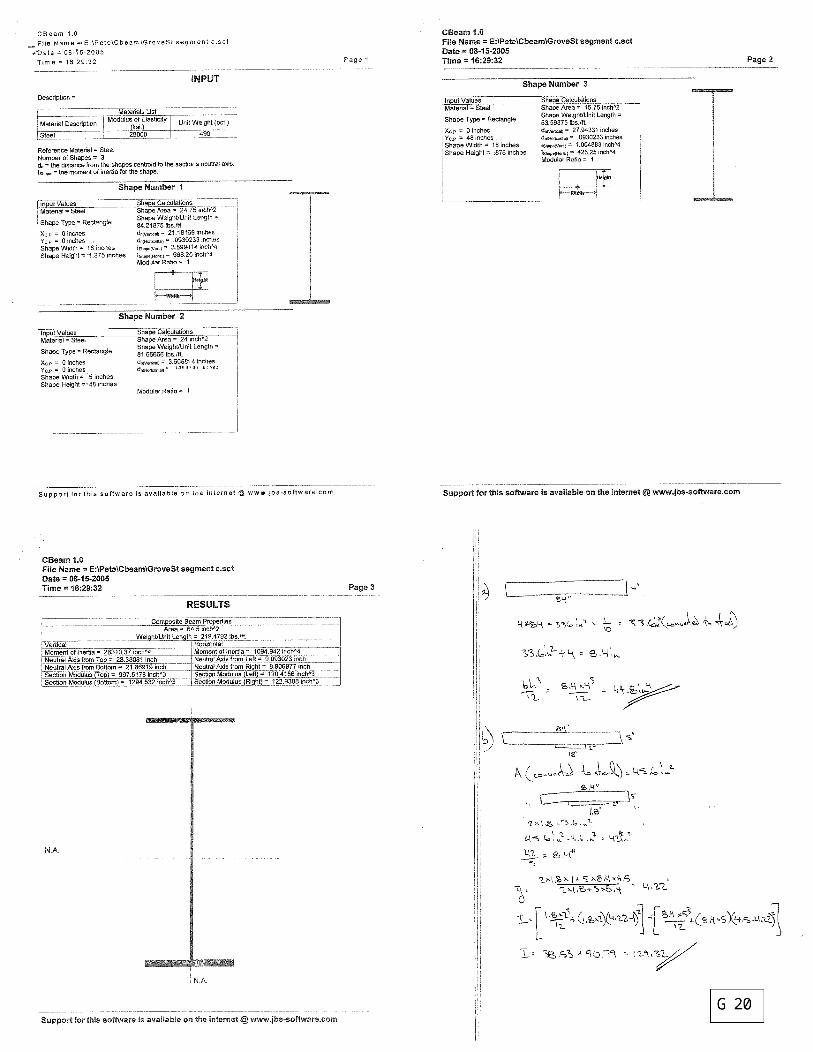
Michael Lepech
G 20
Michael Lepech
Michael Lepech
Michael Lepech
Michael Lepech
Michael Lepech

Michael Lepech
G 21
Michael Lepech
G 21
Michael Lepech
Michael Lepech
Michael Lepech
Michael Lepech
G 21

Michael Lepech
G 22
Michael Lepech
Michael Lepech
Michael Lepech
Michael Lepech

Michael Lepech
G 23
Michael Lepech
Michael Lepech
Michael Lepech
Michael Lepech