
RBMK simulator - Theseus
65
RBMK SIMULATOR LAHTI UNIVERSITY OF APPLIED SCIENCES Faculty of Technology Degree Programme in Information Technology Computer Electronics Bachelor's Thesis Mikael Nosa Spring 2013
Transcript of RBMK simulator - Theseus

RBMK SIMULATOR
LAHTI UNIVERSITY OF APPLIED SCIENCESFaculty of TechnologyDegree Programme in Information Technology Computer ElectronicsBachelor's ThesisMikael NosaSpring 2013
Lahti University of Applied SciencesDegree Programme in Information Technology
NOSA, MIKAEL: RBMK simulator
Bachelor's Thesis in Computer Electronics, 45 pages, 3 appendices
Spring 2013
ABSTRACT
The objective of this thesis was to design and build a simple simulator to simulate a Soviet nuclear reactor type, RBMK. This covers both RBMK-1000 and RBMK-1500 reactors. It is important to note that only the reactor itself was simulated, not all other systems in a real nuclear power plant. Thus left out are turbines, electri-city transferring systems, storage of used nuclear fuel, supply of fresh fuel and all other buildings except the reactor hall. The simulator is simplified due to the amount of redundant systems in a real reactor. Not much of importance is lost be-cause of this as everything was simulated in a smaller scale. The reactor start-up and shut-down procedures were not implemented because they take several hours to complete.
The simulator consists of a self-made electronic board with a microcontroller unit, led lights and LCD displays as indicators, and switches and potentiometers as controls. The board and everything else is mounted on an aluminium frame. Power is provided by a battery. The program inside the microcontroller is written in C language and consists of a loop that is executed once every second. Accident generation and positive void coefficient are included in the code.
The objectives were met: the simulator works and is accurate enough for explain-ing how RBMK reactors work. Not everything is perfectly accurately modelled and some phenomena, like reactor poisoning, are left out completely. Most of the time was spent on researching the reactor type and the underlying physics. Some values in the code are based on estimations instead of proven facts.
Key words: nuclear physics, RBMK, nuclear reactor, simulator
Lahden ammattikorkeakouluTietotekniikan koulutusohjelma
NOSA, MIKAEL: RBMK -simulaattori
Tietokone-elektroniikan opinnäytetyö, 45 sivua, 3 liitettä
Kevät 2013
TIIVISTELMÄ
Tämän opinnäytetyön tavoitteena oli suunnitella ja toteuttaa yksinkertainen simu-laattori, joka simuloi neuvostoliittolaista RBMK -reaktoria. Tämä kattaa sekä RBMK-1000 että RBMK-1500 reaktorityypit. On tärkeää huomioida että vain itse reaktoria simuloidaan, ei ydinvoimalan muita osia. Täten pois on jätetty turbiinit, sähkön siirtojärjestelmät, käytetyn polttoaineen varastointi, tuoreen polttoaineen toimitus, sekä kaikki muut rakennukset paitsi itse reaktorihalli. Simulaattori on yksinkertaistus todellisesta reaktorista, jossa olisi huomattavasti suurempi määrä varajärjestelmiä. Paljoa oleellista ei ole kuitenkaan jätetty pois, vaan kaikki tärkeä on simuloitu pienemmässä mittakaavassa, joskin reaktorin käynnistys- ja sammu-tusprosessit on jätetty toteuttamatta, koska ne kestävät useita tunteja. Erilaisten onnettomuuksien generointi sekä positiivinen tyhjiökerroin ovat sisällytettyinä ohjelmakoodissa.
Simulaattori koostuu elektroniikkalevystä, jolla on mikrokontrolleri, led -valoja ja näyttöjä indikaattoreina sekä kytkimiä ja potentiometrejä hallintalaitteina. Levy ja kaikki muu mainittu on kiinnitetty alumiiniseen runkoon. Laitteiden tarvitseman virran tuottaa paristo. Mikrokontrolleri on ohjelmoitu C-kielellä. Pääohjelma on suuri silmukka, joka suoritetaan kerran sekunnissa.
Työn tavoitteet saavutettiin: simulaattori toimii ja on riittävän tarkka RBMK -reaktorien toiminnan selostamiseen. Kaikkea ei kuitenkaan ole mallin-nettu täydellisesti, vaan joitakin ilmiöitä, kuten reaktorin myrkyttyminen, on jätetty kokonaan pois. Suurin osa käytetystä ajasta kului reaktorityyppiin ja sen taustalla olevaan fysiikkaan perehtymiseen. Jotkut ohjelmakoodissa esiintyvät ar-vot perustuvat vain arvioihin, eivätkä eksaktehin faktoihin.
Avainsanat: ydinfysiikka, RBMK, ydinreaktori, simulaattori
TABLE OF CONTENTS
1 INTRODUCTION 1
2 INTRODUCTION TO RBMK REACTORS 2
2.1 Nuclear fuel in detail 3
2.2 Control rods 7
2.3 Main Coolant Circuit 10
2.4 Physical Power Density Distribution Control System 16
2.5 Other instrumentation 19
3 DESIGN PROCESS AND SIMPLIFICATIONS 21
3.1 Inputs to be considered 21
3.2 Outputs 22
3.3 Calculations during simulation 25
3.4 Accident generation 32
4 ELECTRONICS USED 35
4.1 Microcontroller unit 35
4.2 Power supply 36
4.3 LCD display chain 37
4.4 Printed Circuit Board 39
5 FRAME 41
6 CONCLUSION 42
REFERENCES 44
APPENDICES 46

1 INTRODUCTION
The idea for this thesis rose from my longlasting interest in nuclear physics and
nuclear engineering. Nuclear reactor simulators are very rare. While a large full
scale simulator can be used to train reactor operators, even a small one can help to
give a basic understanding of the simulated reactor type and the underlying phys-
ics in it. These reasons, combined with the challenge this presents, were the mo-
tivation for me choosing this subject.
The decision to choose RBMK as the reactor type stems from its tendency for
catastrophic incidents and a very different design compared to other types. This
very same reactor type was used in the Chernobyl nuclear power plant. While this
thesis does not discuss the 1986 Chernobyl accident, the resulting investigations
by the International Atomic Energy Agency (IAEA) were the most important
source for my work. Also, I decided at the beginning that my simulator must be
able to reproduce the accident. This serves the purpose of showing simulator users
what the signs and causes of the aforementioned accident are.
Because microcontrollers are convenient, I decided to use one in this simulator to
execute the program. It would be programmed in C language to read controls, cal-
culate physical phenomena in the reactor and display different kinds of informa-
tion using visual indicators. I chose a microcontroller made by Microchip as I was
familiar with them and had all necessary development software available. All
electronics would be made to either a breadboard or a properly designed printed
circuit board. This would in turn be mounted to some kind of hull together with
other parts.
All images in this thesis are made and copyrighted by the author.
2
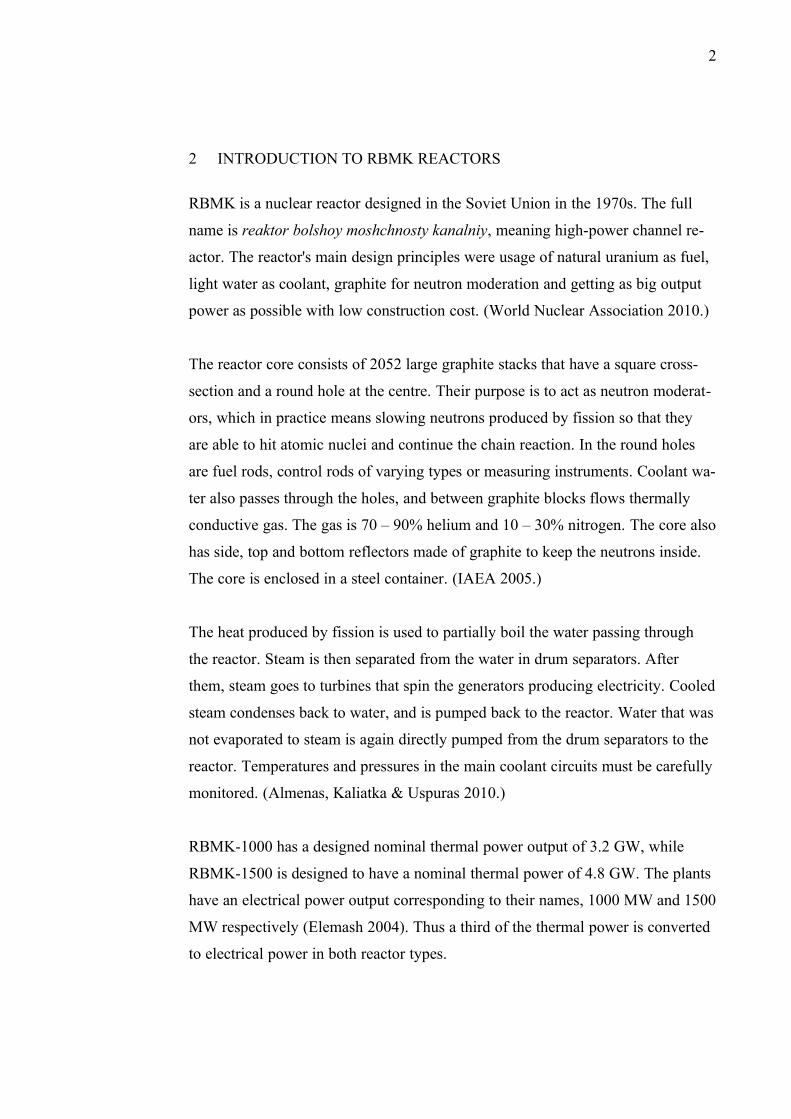
2 INTRODUCTION TO RBMK REACTORS
RBMK is a nuclear reactor designed in the Soviet Union in the 1970s. The full
name is reaktor bolshoy moshchnosty kanalniy, meaning high-power channel re-
actor. The reactor's main design principles were usage of natural uranium as fuel,
light water as coolant, graphite for neutron moderation and getting as big output
power as possible with low construction cost. (World Nuclear Association 2010.)
The reactor core consists of 2052 large graphite stacks that have a square cross-
section and a round hole at the centre. Their purpose is to act as neutron moderat-
ors, which in practice means slowing neutrons produced by fission so that they
are able to hit atomic nuclei and continue the chain reaction. In the round holes
are fuel rods, control rods of varying types or measuring instruments. Coolant wa-
ter also passes through the holes, and between graphite blocks flows thermally
conductive gas. The gas is 70 – 90% helium and 10 – 30% nitrogen. The core also
has side, top and bottom reflectors made of graphite to keep the neutrons inside.
The core is enclosed in a steel container. (IAEA 2005.)
The heat produced by fission is used to partially boil the water passing through
the reactor. Steam is then separated from the water in drum separators. After
them, steam goes to turbines that spin the generators producing electricity. Cooled
steam condenses back to water, and is pumped back to the reactor. Water that was
not evaporated to steam is again directly pumped from the drum separators to the
reactor. Temperatures and pressures in the main coolant circuits must be carefully
monitored. (Almenas, Kaliatka & Uspuras 2010.)
RBMK-1000 has a designed nominal thermal power output of 3.2 GW, while
RBMK-1500 is designed to have a nominal thermal power of 4.8 GW. The plants
have an electrical power output corresponding to their names, 1000 MW and 1500
MW respectively (Elemash 2004). Thus a third of the thermal power is converted
to electrical power in both reactor types.

3
Fuel rods are inserted to the reactor from top using a refueling machine. This is
possible even while operating the reactor. The same machine can also be used to
inspect fuel channels. A total of 147 control rods are inserted from the top and
there are 40 lower control rods. For purposes of emergency shut-down, there are
24 fast-acting control rods that are inserted through the top plate. These rods are
allowed free fall to the core for 5 seconds before being braked by an electrical
system to prevent damage. (Almenas et al. 2010.)
For simplified presentation of the RBMK reactor's core with its main coolant cir-
cuits and manual control rods, see Figure 1.
FIGURE 1. Simplified structure of RBMK reactor.
2.1 Nuclear fuel in detail
As mentioned before, RBMK is able to use natural uranium, which consists of
0.7% uranium-235, 99.3% uranium-238 and traces of uranium-234. However, us-
ing natural uranium is inefficient, so in practice the uranium used is enriched to
contain 2% of 235U. After the Chernobyl accident enrichment was increased to
4
2.4% of 235U. This is still much less enrichment than what other reactor types use
(3 – 4%) and thus cheaper. (Almenas, Kaliatka & Uspuras 2010)
Lowly enriched uranium is mixed together with oxygen to create uranium diox-
ide. This is then powdered and pressed to pellets. Pellets are 15 mm long and
11.5 mm in diameter with a 2 mm diameter hole axially. The purpose of this hole
is to dissipate heat from middle parts of the pellet. Pellets are stacked to tubes that
are made of 99% zirconium and 1% niobium. This alloy is very resistant to corro-
sion and able to withstand high temperatures. Also, it does not absorb many neut-
rons, but lets them pass to react with heavier nuclei (Almenas et al. 2010).
However, the alloy has one major disadvantage: at high enough temperatures the
zirconium reacts with water according to Formula 1, producing hydrogen (Integ-
rated Publishing 2007). This, however, requires excess temperature in the core
(IAEA 2005, 48). Hydrogen also leaks from the coolant to the reactor hall at
estimated rate of 2 Mg/h (British Nuclear Energy Society 1987, 13).
Zr + 2 H2O → ZrO2 + 2 H2 (1)
Fuel rods made of zirconium alloy are 13 mm in diameter and 3.64 m in length.
In addition to fuel pellets, the rods are filled with helium at a pressure of 500 kPa
before sealing. Pellets are kept in place inside the rod by a radial retaining ring
and an axial spring. These rods are then combined to fuel assemblies that consist
of 36 fuel rods placed around a central support rod, 18 in the lower half and an-
other 18 in the upper half. The support rod is a 15 mm tube made of zirconium
running the whole length of the assembly and is connected to a connecting rod at
the top and an end cap at the bottom of the fuel assembly. The assembly also con-
tains 20 spacing grids, the lowest of them made of zirconium, others made of
stainless steel. These are welded to the support rod at intervals of 360 mm. The
top half of the assembly also has 30 turbulence enhancing spacers at intervals of
120 mm. (Almenas et al. 2010.) A cross-sectional drawing of a fuel assembly is
presented in Figure 2.

5
FIGURE 2. Cross-sectional drawing of fuel assembly viewed from top. Fuel rods
marked yellow.
The length of the fuel rods in the assembly is roughly 7.2 meters. In addition,
there is a suspension system on top of it. This suspension system consists of the
aforementioned connecting rod, an adapter around it, a top cap on it and a suspen-
sion bracket fixed to the top cap. This makes the total length to 10.015 m. The
fuel assembly is suspended to the reactor through the top plate via special caps on
the plate. These should only be operated with the refuelling machine specifically
designed for this purpose. Some fuel assemblies also contain neutron flux indicat-
ors inside their support rods. Then the rod has a different wall thickness than or-
dinary support rods. (Almenas et al. 2010.)
An RBMK-1000 reactor contains a total of 1693 fuel channels, while the RBMK-
1500 has 1661 fuel channels. The difference is mainly due to heat exchange in-
tensifiers in the fuel assemblies used on RBMK-1500, to give it higher effective
thermal power (Elemash 2004). As one fuel rod contains 3.5 kg of uranium diox-
ide, and one assembly has 36 rods, the total mass of uranium dioxide is 126 kg. It
is important to note that one fuel assembly contains only 111.2 kg of uranium it-
self (enrichment rate 2.4%). The difference is the oxygen in uranium dioxide. See

6
Formula 2 for calculations of mass without oxygen, using enrichment rate of 2%.
(Almenas et al. 2010.)
mU = 3.5 kg * 36 * ( maU[2%] / ( 2 * maO + maU[2%] )) (2)
3.5 kg * 36 * ( 237.94 / ( 2 * 15.999 / 237.94)) = 111.064 kg
This is really close to the 111.2 kg by Almenas et al. The difference can be ex-
plained by different enrichment rates and the 3.5 kg of UO2 can also be a rounded
number. Simple use of algebra can provide us with a mass of 3.504 kg, which can
be rounded to 3.5 kg, thus offering one explanation for the difference.
The fuel pellets are rated for a maximum temperature of 2373 K. Their zirconium
cladding is rated for a maximum of 973 K. Even lower temperatures can cause
rapid hydrogen formation according to Formula 1, and increasing temperature
naturally causes chemical reactions to speed up. The hydrogen can cause hydro-
gen embrittlement in fuel rods, leading to frailness in zirconium cladding (Integ-
rated Publishing 2007).
As one fuel assembly has a maximum energy output of 2.5 gigawatt days, the
total output of the nuclear fuel in the reactor can be calculated using Formula 3
(Almenas et al. 2010). This result can then be divided with the total mass of fuel
in the reactor as shown in Formula 4 to get the maximum burn-up. This value
tells how much energy is produced when a kilogram of fuel has undergone fis-
sion. Values used are for RBMK-1500 with 2.4% enrichment and match closely
with the values claimed by the fuel assembly manufacturer (Elemash 2004). For-
mula 5 shows the time a full load of nuclear fuel lasts if the reactor is constantly
run on full power.
Ethmax = 2.5 GWd * 1661 = 4.15 TWd (3)
burn-upmax = 4.15 TWd / (111.2 kg * 1661) = 22.4 MWd/kg (4)
tmax = 4.15 TWd / (4.8 GW * 1 d) = 864.58 d ≈ 2 a 4 m (5)

7
2.2 Control rods
Boron carbide is used to absorb neutrons in the reactor and thus reduce further fis-
sions and lower the total thermal power of the reactor. There are three different
kinds of control rods: standard control rods, fast-acting scram-rods and power dis-
tribution balancing control rods. The reactor has 147 standard control rods, 24
scram-rods and 40 balancing rods. The latter are inserted from the bottom to the
reactor while the standard rods and fast-acting scram-rods are inserted from the
top. (Almenas et al. 2010.)
The standard rods are mainly used to lower and raise the reactor's activity by
lowering and raising the rods. They can also be used for power distribution radi-
ally among the reactor area, while the 40 lower control rods are used to control
power distribution axially. Fast-acting scram-rods are used for emergency power
reduction and reactor shut-down. The shut-down process can be augmented by
lowering normal control rods to the reactor. All control rods move in their own
channels, which are cooled by separate circuits (IAEA 2005). Scram-rods are
cooled by gas, others by water (Almenas et al. 2010).
A standard control rod consists of a graphite tip used to displace water and to
slow neutrons. Above the graphite there is a telescopic joint made of aluminium
alloy, which shortens when the graphite touches the bottom damping support of
the channel so that the boron carbide itself sets exactly to the active area of the re-
actor. On top of the telescopic joint there is the boron carbide, which acts as a
neutron absorber, slowing the reaction. This is affixed to a suspension unit, where
a steel cable is connected. After the Chernobyl accident these steel wires were re-
placed with steel tapes. The suspension unit absorbs mechanical shocks from
movement and prevents rods from twisting in their channels. For details on a
post-Chernobyl control rod, see Figure 3 (Almenas et al. 2010). Different sources
can give very different lengths for the telescopic joint. The figure is based on
drawings by Almenas et al.

8
FIGURE 3. Standard manual control rod, steel wire replaced by steel tape.
The other end of the steel tape or wire is fixed on a rotating drum where it
wounds when the rod is raised. The drum is driven by a DC motor through a set
of gears and an electromagnetic clutch. The clutch can be used to brake the move-
ment of the control rod. There is also a self-synchronised indicator, which has a
dial that rotates to show the position of the control rod. This can be seen when
manually inspecting a control rod drive. In case the electronic system fails, rods
can be controlled manually by a mechanism on top of the DC motor. If electricity
is lost when moving the rods, the clutch locks and stops the rods. This is to pre-
vent them from falling freely. (Almenas et al. 2010.)

9
The control rod drive is similar to those rods that are moved to the reactor from
the bottom. The clutch is replaced by a version acting inversely, the dial on selsyn
indicator is replaced and the suspension wire or tape is replaced with 8.035 m
long version. Lower control rods have the boron carbide neutron absorber at the
bottom, then a telescopic joint, a graphite displacer on top of it and that connected
to the fastening unit. The neutron absorbing part is 4.088 m long, while the tele-
scopic joint is 500 mm long when at full length. The graphite part is 6.7 m long.
(Almenas et al. 2010.)
Fast-acting scram rods are driven by a similar drive as the standard rods, but they
are given a valve to let the gas into the channel. If the channel becomes flooded
with coolant water, the valve closes until the water is pumped away. As an 8 m
free fall would generate a strong change of acceleration when the fall finally
stops, causing structural damage to rods and their suspension, the scram-rods are
braked dynamically after about 5 seconds of falling. This is measured using a ta-
chometer. Also the gear train is modified to have less inertial resistance. Scram-
rods consist of 7.2 m long boron carbide absorber fixed to the fastening unit.
There is no graphite displacer or telescopic joints. These types of rods are a post-
Chernobyl modification (Almenas et al. 2010). Apparently before the accident
these 24 channels were used for standard control rods.
Both the standard control rod channels and lower control rod channels are cooled
by water pumped from top. The gas-cooled fast-acting scram-rod channels pump
nitrogen from top together with a small amount of water that is sprayed lightly in
the channel to achieve film flow on the rods. The channels have their own coolant
circuit, separate from the main coolant circuit. This coolant is kept at about 313 –
363 K. (Almenas et al. 2010.)
Due to the fluid dampening effect of water, standard control rods and lower con-
trol rods move slowly in their channels. As they move with a velocity of
0.4 ± 0.1 m/s, the distance of 6.55 m for standard rods and 3.68 m for lower rods
takes 16.375 ± 4.36 s and 9.2 ± 2.45 s to travel respectively. Almenas et al. states
that the time to fully insert the rods is 12 – 14 s in both cases, which does not
match even though the initial values of distance and velocity are taken from their
writings. According to the IAEA, the time to fully lower standard control rods

10
pre-Chernobyl was about 18 – 21 s (IAEA 1992, 41). As the fast-acting scram-
rods introduced post-Chernobyl are dropped freely to gas-filled channels, they
only take 5 – 7 s when initiated by a manual scram-signal and 2 – 2.5 s when
dropped by an automatic system (Almenas, Kaliatka & Uspuras 2010).
Some control rods are left fully to reactor operators, while others are assigned to
the Reactor Control and Protection System. This system monitors reactor activity
and keeps it within desired limits using its two subsystems: Local Automatic Con-
trol and Local Emergency Protection. These use signals and instrumentation data
provided by the Physical Power Density Distribution Control System (IAEA
1992, 39). This system is in some sources called Power Density Distribution
Monitoring System (Almenas et al. 2010). Further in this thesis, abbreviation PP-
DDCS is used, as is done by IAEA report INSAG-7.
The aforementioned subsystems, LAC and LEP, drive some control rods to keep
the reactor stable. In total, 40 standard control rods, 4 lower control rods and all
24 scram-rods are controlled by these automated systems. Rods controlled auto-
matically have some modifications on their drive, to allow faster insertion
(Almenas et al. 2010). It is possible to convert manual control rods to automatic
and automatic control rods to manual by the operators (IAEA 1992, 41).
2.3 Main Coolant Circuit
The RBMK reactor has two main coolant circuits that are essential in keeping the
reactor cooled and providing steam for the turbines to function. The circuits are
symmetrical and each provides coolant to half of the reactor, one to the left half,
and the other to the right half when looking from the main control room. Ordinary
but purified water is used instead of the more expensive heavy water that contains
deuterium and some tritium. (Almenas et al. 2010.)
11
Starting from the separation drums, two for each circuit, water flows to the suc-
tion header through 24 pipes in total. Each separation drum has a total volume of
335.6 m3 and the suction header has a volume of 13.4 m3. From there it is drained
through 4 pipes to the main coolant pumps, which are centrifugal pumps and are
powered by electric motors. Normally, three pumps are used while the fourth is
on standby for backup purposes if one of the others fails. Before the pumps there
are gate valves, used to disconnect the line for maintenance. After the pumps
there are a set of valves, beginning with a check valve, then a throttling valve and
finally a gate valve. Together with the valves are flow rate meters. These pipes
then lead to a pressure header. The pressure header has a volume of 11.8 m3. The
pressure header combines all pump lines of one circuit to one. (Almenas et al.
2010.)
After the pressure header the coolant water flows through 20 pipes. In each there
are a set of valves, first a gate valve and then a check valve. The gate valve is
used to disconnect lines for maintenance while the check valve prevents back-
flow to the pressure header. After those valves there is a mixer that mixes water
from Emergency Core Cooling System to the Main Coolant Circuit. After the
mixer the pipeline goes to a group distribution header that has a volume of 32.6
m3. Each of the 20 group distribution headers in one half circuit divides the lines
to 40 – 43 bottom pipes. Thus the Main Coolant Circuit has in total 40 group dis-
tribution headers and a maximum of 1720 bottom pipes. As the reactor only has
1693 channels for RBMK-1000 and 1661 for RBMK-1500, this is enough to cool
each fuel channels and thus many distribution group headers are not fully occu-
pied. Each bottom pipeline has a control valve that is also capable of isolating the
pipe from the rest of the circuit. (Almenas et al. 2010.)
The bottom pipes lead to the fuel channels and cool the reactor where 23 – 29.1%
of water mass boils to steam. These then return through top pipelines back to the
drum separators, where the steam goes to turbines and water continues to the suc-
tion header. One fuel channel is 78.6 dm3 in volume. (Almenas et al. 2010.)
Steam coming from turbines is condensed back to water and then pre-heated,
filtered and de-aerated before being pumped by seven main feed water pumps
through mixers to the drum separators. One of the pumps serves as backup. There

12
are also 6 auxiliary pumps that are used to pump the Main Coolant Circuit full
when starting the reactor, as well as to keep the pressures if the main feed water
pumps are tripped. They can also be used during start-up, shut-down and low-
power operations. (Almenas et al. 2010.)
A bypass line goes between the suction header and pressure header in each half of
the circuit. This pipeline is used to ensure natural flow due to gravity if the main
coolant pumps are not in operation. The pipeline consists of 6 separate pipes, each
with their own set of valves to control the flow. These valves are a gate valve to
disconnect a pipe, and a check valve to prevent back-flow. (Almenas et al. 2010.)
Figure 4 represents one half of the Main Coolant Circuit. This does not include
any of the water feedback circuit or emergency cooling system.
FIGURE 4. One half of main coolant circuit.
The drum separators are large cylinders with an outer diameter of 2.83 m and
length of 33.76 m (Almenas et al. 2010). The length mentioned here is a modific-
ation done on Ignalina Nuclear Power Plant; other plants use about 30 m long

13
drum separators. The separators are also used to store coolant due to their high
volume (335.6 m3 for each) and mixing of feed water with water already in circu-
lation. Inside the drums there are special plates that the water-steam -mixture im-
pacts with. After them, steam goes through perforated submerged plates to the up-
per part of the drum. Water stays in lower parts as it loses a lot of kinetic energy
when impacting with the special plates and is denser than steam. Feed water flows
to the drum from the top to a special header, where it is injected to the rest of the
liquid. Feed water mixes with coolant water already in circulation and proceeds
down to downcomer pipes. Temperatures inside the drums are measured using
thermocouples while water levels are measured by floats. The drums are designed
to withstand pressures of 7.5 MPa. (Almenas et al. 2010.)
Suction headers are 21.074 m long cylinders with an outer diameter of 1.02 m.
They serve to connect the downcomers to one and then distribute the line to four
pipes for the main coolant pumps. The pressure headers are also cylinders, with a
length of 18.204 m and an outer diameter of 1.04 m. Their function is to connect
all pump lines to one, then divide it to the group distribution headers and to sup-
ply water to the purification and cooling system. (Almenas et al. 2010.)
Main coolant pumps have a capacity of about 8000 m3 of water in hour for each
pump. Their rated shaft power is about 4.3 MW for each pump. This power is
provided by electric motors on top of the pumps. These have an input power of
5.6 MW each. The motors are three-phase AC motors run on 6 kV lines. Their ro-
tation speed is quite low, only 1000 rotations per minute, while most of the power
is used on torque to handle high pressures. Motor shafts are equipped with fly-
wheels to provide rotational inertia for a while even when electricity is lost. Due
to the combination's massive inertia, accelerating the pump to full rotations will
take 16 s, while deceleration takes 2 – 5 minutes. The pumps are used to create a
pressure of about 1.962 MPa to an outlet pipe with an inner diameter of 206 mm.
Pump seals are rated to withstand pressures of up to 9.81 MPa. Excess pressure
causes leaks. A single pump measures 9.85 m in height, 3.07 m in length and 2.75
m in width. (Almenas et al. 2010.)
14
Each group distribution header is a horizontally mounted cylinder with an outer
diameter of 325 mm. Each of them branches to 40 – 43 pipelines that have built-
in isolation valves and flow rate meters. The readings of these meters can be seen
in the main control room. The bottom pipelines leading to fuel channels have an
inner diameter of 50 mm. The fuel channels themselves have an inner diameter of
80 mm. The pressure in each fuel channel can be as high as 8.6 MPa, and it drops
to about 7.4 MPa on top of a channel. In practice the pressures as well as other
parameters in channels are kept a little lower. After the channel, the steam-water
-mixture flows through 68 mm inner diameter top pipes to the drum separators.
(Almenas et al. 2010.)
The total volume of the Main Coolant Circuit is 1992.7 m3 (Almenas et al. 2010).
Even though this is a sizeable amount of water, the loss of coolant accidents
(LOCA) can be potentially catastrophic, and thus are classified as design basis ac-
cidents (DBA) and in two cases even beyond design basis accidents (BDBA). A
guillotine break of a pressure header or a critical break of group distribution head-
er are BDBA and can cause core damage. (IAEA 2005, 10 – 14.)
Every second, 111 kg of coolant water is directed to the purification and cooling
system from the main coolant circuit. The purpose of this system is to filter cor-
rosive minerals, salts and radioactive particles from the coolant, while at the same
time cooling it and supplying it to auxiliary pumps and de-mineralized water stor-
age tank. When the water first enters the system from the pressure headers, it is
pre-cooled in a regenerator to about 341 K utilising returning purified coolant
flow to absorb heat. After that the incoming water is cooled again with an addi-
tional cooler, this time to about 323 K before it flows through filters. The first fil-
ter is a a metal cylinder with a filtration bed of perlite used to filter mechanical
particles and possible leaked in lubricants. There are four perlite bed cylinders
available, but only on of them is used at a time. The second filtering stage is made
of ion exchangers utilising cations and anions. This binds potentially corrosive
ions to the exchanger material instead of letting them bind to materials in the
coolant circuit to cause corrosion. The ion exchanger is followed by a further
mechanical filter. (Almenas et al. 2010.)
15
The mechanical filters are rated for pressures up to 12 Mpa. Other parts of the
system also have similar pressure ratings, while in operation the pressures in the
system range on both sides of 9 MPa. After filtering, the coolant should not have
more than 3 ppm of chloride ions, 100 ppm of mineral oils, 10 ppm of iron, less
than 2 µg/kg of copper and practically no silica acids. After filtration, the water is
passed through the regenerator to absorb heat, afterwards being up to 513 K. Then
the purified and heated coolant is pumped to the drum separators, passing through
flow rate meters and thermocouples. Excess water can be pumped to a de-miner-
alized water storage tank. (Almenas et al. 2010.)
The contents of the aforementioned de-mineralized water tank is used to fill four
de-aerator tanks that are used by the Emergency Core Cooling System. This tank
has a volume of 1500 m3, and it is forbidden to start the reactor without there be-
ing at least 1000 m3 of water in the tank. The total volume of the de-aerators is
480 m3. There are also 16 accumulator tanks which are used for emergency cool-
ing. They have a total of 212 m3 of water, blanketed with pressurized nitrogen.
Hot condensate chambers in the feed water system contain 1000 m3 of water that
can be used to cool the reactor core. All this water is pumped by several pumps of
various capacities. (Almenas et al. 2010.)
In case of emergency, the short term cooling is provided by connecting water
from the accumulators to the damaged half of the Main Coolant Circuit using spe-
cial fast-acting valves. This system is not capable of replacing the whole MCC
(Almenas et al. 2010). The accumulators are only able to provide cooling for
roughly 100 seconds (British Nuclear Energy Society 1987, 10). Long term cool-
ing can be provided by pumping water from the de-aerator tanks, condensate
chambers and de-mineralized water storage tank. All these pumps can be used on
diesel generators, thus they work even if all electricity in the plant is lost. The
short term cooling from accumulators is supposed to be used only for the time it
takes to start diesel generators and begin pumping from larger reservoirs. The
long term system can replace both halves of the MCC. (Almenas et al. 2010.)
16
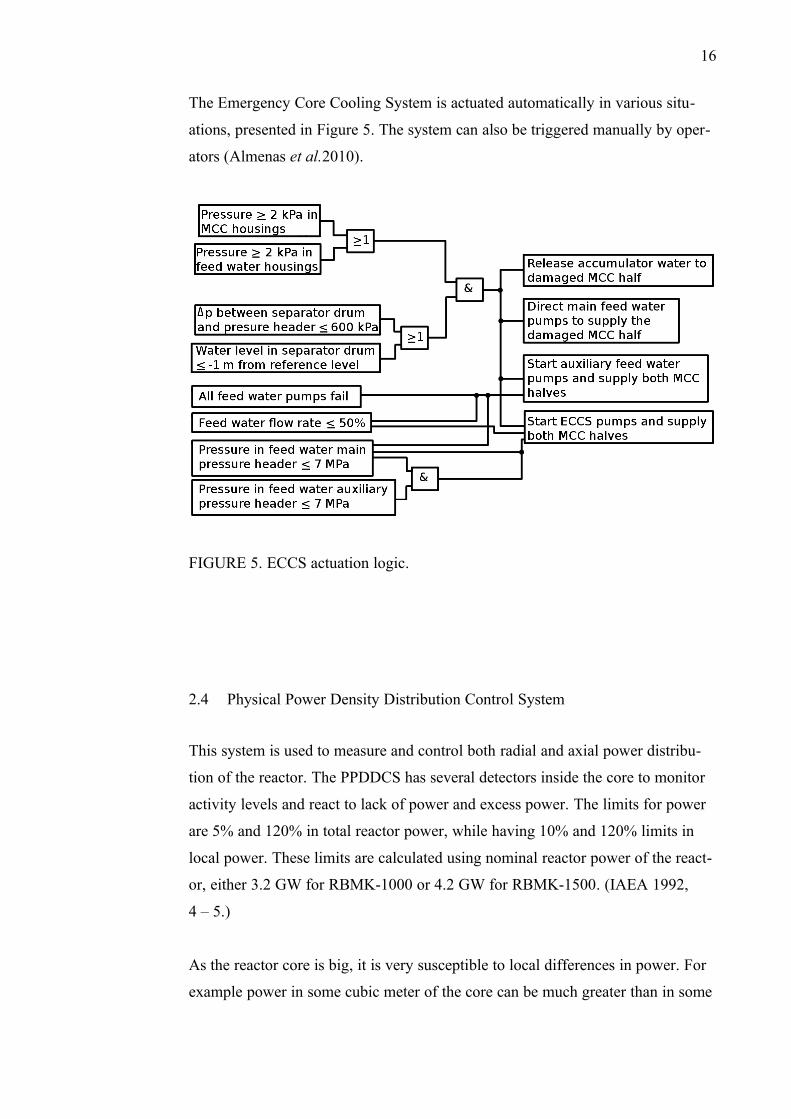
The Emergency Core Cooling System is actuated automatically in various situ-
ations, presented in Figure 5. The system can also be triggered manually by oper-
ators (Almenas et al.2010).
FIGURE 5. ECCS actuation logic.
2.4 Physical Power Density Distribution Control System
This system is used to measure and control both radial and axial power distribu-
tion of the reactor. The PPDDCS has several detectors inside the core to monitor
activity levels and react to lack of power and excess power. The limits for power
are 5% and 120% in total reactor power, while having 10% and 120% limits in
local power. These limits are calculated using nominal reactor power of the react-
or, either 3.2 GW for RBMK-1000 or 4.2 GW for RBMK-1500. (IAEA 1992,
4 – 5.)
As the reactor core is big, it is very susceptible to local differences in power. For
example power in some cubic meter of the core can be much greater than in some

17
other cubic meter on the other side of the reactor. This can cause problematic situ-
ations if the operators are either not aware of this, or do not react to it, as excess-
ive reactor power in some areas can cause damage to graphite blocks and fuel rod
cladding (IAEA 2005, 20 – 22). The PPDDCS counters such problems by balan-
cing power differences in the reactor through usage of control rods assigned to it
(Almenas et al. 2010). The Local Automatic Control system also keeps certain
areas of the reactor balanced as mentioned before on Chapter 2.2.
Reactor activity is measured by 24 radial ionization chambers and 252 power
density measurement instruments in special channels. They have varying scales
and provide data to Reactor Control and Protection System, which shares the data
with the PPDDCS. Measured values are transmitted to a central computer that
makes calculations of the reactor power and power distribution. Possible actions
are then triggered to keep the power distribution balanced and total reactor power
stable. (Almenas et al. 2010.)
Neutron flux in the reactor is measured using four high precision fission cham-
bers, 16 ionization chambers in the core and eight separate ionization chambers
that are active during reactor start-up procedure. These instruments are placed in-
side thermal insulator tubes that are then placed in an inner tube, which is hermet-
ically sealed. This inner tube is then placed inside an outer tube and again hermet-
ically sealed. The cable from the instrument inside passes through these sealing
caps in a protective tube. All this is secured to a suspension bracket that rests on
top of the channel edges on a support plate. The ionization chambers are structur-
ally little different, lacking double tubes inside the bracket and being inside a ni-
trogen atmosphere. (Almenas et al. 2010.)
Ionization chambers used during normal operation use linear scales, while those
used during the reactor start-up use logarithmic scales, as do the fission chambers.
These scales vary depending on the ionization chamber's position in the reactor.
For example some ionization chambers have a range from 10-10 Nnom to 104 Nnom,
while others have a range from 10-8 Nnom to 10-1 Nnom. (Almenas et al. 2010.)

18
Of the 252 power density measurement chambers, 127 are non-inertial and use
hafnium oxide, while 125 are inertial with silver used inside. The latter are di-
vided equally to the reactor while the former are divided among Local Automatic
Control and Local Emergency Protection zones. These measurement devices con-
sist of a sensitive element with a length of 8.5 m placed inside the reactor core,
suspended by a steel cable that goes through a 1.095 m long biological shielding
plug that prevents radiation from leaking to the reactor hall. After the plug, the
cable bends downwards to a sealed connector that connects the device to the PP-
DDCS computer. The sensitive element itself is a 3 mm diameter cylinder made
of either hafnium oxide or silver, which is enclosed in a stainless steel container
coated with magnesium oxide and filled with argon (Almenas et al. 2010.). See
Figure 6 for a drawing of a radial measurement chamber unit.
FIGURE 6. Radial power distribution monitoring unit.
19
Apparently all these sensors work by producing a small electric pulse when the
sensitive material is hit by ionizing radiation. The amounts and amplitudes of
these pulses can then be measured and used as a basis for calculations about the
neutron flux and power in the reactor.
If the system detects too high neutron flux in some areas, it lowers some control
rods in the area to maintain values set by reactor operators. In case of too low val-
ues, control rods in the respective area are raised to allow greater power. Radial
and axial power distributions calculated by the PPDDCS are presented to the op-
erators in the control room on a display screen. Some other data measured is also
shown using various dials and alarm lights. The PPDDCS is very important in
maintaining balanced reaction in the reactor, so it should not be disabled or auto-
matic control of some control rods circumvented. (Almenas et al. 2010.)
2.5 Other instrumentation
Safe operation of a nuclear reactor requires a wide range of information which ac-
tions of the operators are based on. Such is naturally the case with RBMK react-
ors as well. Important values to be measured are temperatures, pressures, radio-
activity, flow rates and neutron fluxes.
Temperatures measured in RBMK are the following: temperatures of graphite
stacks, temperatures of biological shielding, temperatures of other structural
items, inlet and outlet water temperatures of control rod channels, fuel channels
and feed water circuits, temperatures of fuel assemblies, temperatures of gas mix-
tures in the protective gas systems and temperatures of control rod servo drives.
The term structural items in above refers, but is not limited to, reactor pressure
vessel, reactor hall, support rollers, bellows compensators, supporting steel struc-
tures and channel guide tubes. (Almenas et al. 2010.)
Pressures measured are the following: pressure difference between reactor core
and the surrounding space, pressures in separator drums, pressures after different
kinds of pumps and pressures in gas circuits. Coolant pressures are not directly
measured, but their flow rates are. Coolant pipes are protected by valves to vent

20
over pressurised water as discussed in Chapter 2.3. In addition to coolant flow
rates, protective gas flow rates are also measured and monitored. Some of these
are paired with humidity sensors to indicate coolant leaking to gas circuits.
(Almenas et al. 2010.)
Most of this data goes to a central computer that can record the values for future
checking, for example when analysing accidents in reactor operation. The values
measured by various systems are indicated to the operators using small displays,
dials, papers attached to rotating drums, alarm lights and sounds. Radioactivity of
working areas is also monitored using both permanently installed and portable
devices, mainly spectrometers. (Almenas et al. 2010.)

21
3 DESIGN PROCESS AND SIMPLIFICATIONS
The main design principle in this simulator is that it is based on a microcontroller
unit which runs the program code. Another idea that I came up with early was to
use a time-based loop that is executed once every second. As major processes in
the reactor do not happen in less than a second, this is not a problem. Instead,
simple one-second time frames ease calculations that have time as one of their
variables. Thus also all inputs are read in one part of the loop and there is no need
to implement any real-time features to the program code. This keeps the program
itself simple to understand, debug and modify.
3.1 Inputs to be considered
This is where the first simplifications take place. As mentioned in Chapter 2,
RBMK reactors have a great number of different kinds of devices and systems to
control the reactor and its parts. Naturally, creating a simulator without any sim-
plifications at all would result in a very large and expensive project that would re-
quire nearly the same number of operators as a real reactor.
After some consideration, I decided to limit the number of control rods to six, and
two automatic rods. Actually these six can be thought of as each representing one
sixth of the control rods in the reactor, they are just all controlled together. And,
with two automatic control rods, each can be thought to represent half of the total
control rods under the automatic systems. I also decided that instead of exact val-
ues, the control rods would work using relative values instead. Thus with six con-
trol rods, the reactor's total power can be anything from 0% to 120%. That makes
the effect of a single control rod to be 20% on the reactivity. Both automatic con-
trol rods also have the impact of 20% on the reactivity. This prevents reactor shut
down by using only automatic control rods, but as the start up and shut down pro-
cedures were excluded from the objective to begin with, this does not pose a
problem.

22
The next important thing after the control rods are the main coolant pumps. As
stated in Chapter 2.3, there are a total of eight pumps in the system, four in each
half. Of these eight, two are on reserve for backup purposes. I simplified these to
be three pumps: the first and second represent three pumps in one half, while the
third represents the backup pumps combined. Two backup pumps cannot provide
the same capacity as three pumps would, but it can be thought that the backup
pump would include at least one of the working pumps on the tripped side. Thus
with three pumps I can believably simulate eight pumps divided to three groups.
As in a real RBMK reactor, many systems can be bypassed or deactivated (Park
1989, 148). Based on that knowledge, I decided that PPDDCS can be deactivated
and the automatic control rods assigned to it bypassed to prevent them from mov-
ing. The latter would mean that while PPDDCS is active, one or both of the auto-
matic control rods can be locked to their positions to prevent PPDDCS from actu-
ally moderating activity.
Other notable inputs are controls to start the short-term emergency core cooling
system and reactor hall ventilation. The emergency cooling system leads to anoth-
er simplification; it is very large and consists of several pumps and tanks from
where water can be pumped to the main coolant circuits. For these reasons I de-
cided to only implement the short-term system, the accumulators and one collect-
ive fast-acting valve that represents them all. The ventilation system is also rep-
resented by a single control for all possible switches and buttons in a real reactor.
The purpose of this system is to remove hydrogen and other gases from the react-
or hall through a filtering system and the chimney (Almenas et al. 2010.).
3.2 Outputs
The outputs also require several simplifications as a real reactor has indicators for
many measured physical quantities. In addition to these, there are various alarms
and displays that show information. I made a decision that a limited number of
LCD displays would have to do for the numerical values and the rest would
simply have a simple light emitting diode to indicate their status.
23
As for the numerical values, the most important would be the total thermal power
calculated by the computer from the radioactivity data. This can range from a few
megawatts to a few gigawatts. I could not find valid evidence about how this is
shown in a real reactor, but I suspect it is done with either a display screen with
the power shown in megawatts or Nixie tubes that display the power in mega-
watts. I decided that this shall be displayed on a display in megawatts.
A real RBMK reactor has its neutron flux and activity measured using several in-
struments that are used as inputs to the central computer that either displays this
kind of information to the operators or not. I decided that activity shall be indic-
ated on the displays as well. The neutron flux throughout the reactor is very im-
portant in a real reactor, thus I decided to display information for three depths of
the reactor. These are activity in the top parts, activity in the middle parts and
activity in the bottom parts. Radial power distribution is not evident as these only
represent axial distribution, but dividing the reactor to more parts which have to
be monitored and calculated could complicate the simulation considerably. Also I
deduced that axial power distribution is more important to know if coolant starts
boiling too early or control rods' graphite displacers increase activity. Thus axial
activity is implemented but radial is not.
But how much should these activities be, and what prefix should be used in front
of becquerels? To find the answer, one must first estimate the total activity of the
reactor. In this case, RBMK-1000 is used. A good way to get started is to get the
total energy produced in one second, as the becquerel is defined as one nuclear
decay per one second. Formula 6 shows the chain of thought starting from the
total thermal power of RBMK-1000.
Pth = 3.2 GW = 3.2 GJ/s = 1.997*1028 eV/s (6)
The fission energy of one 235U is 193.7 MeV, not counting anti-neutrinos (Kaye &
Laby, 2005). The total number of fissions happening in the reactor in a time of
one second can be calculated using Formula 7.

24
A = 1.997*1028 eV/s / 193.7*106 eV
= 1.0309*1020 Bq ≈ 103.1 EBq (7)
This estimation does not take into account other isotopes undergoing fission, as
the main fuel is 235U. In reality different isotopes and especially fission products
themselves undergoing further fission causesthese values to be very different.
Such accurate calculations would be fitting for a completely different thesis, but
too complex for this one. With all this information, I decided to divide this activ-
ity value to three axial parts and present it using LCD displays.
The third important parameter is temperature. The most important of them are
likely the coolant liquid temperatures. As stated in Chapter 2.5, these are meas-
ured using sets of thermocouples in the coolant circuits. As in reality the circuits
contain many thermocouples and indicators to display their values, a full scale
version would be too large for my simulator. Thus temperature measuring is also
simplified. Two values are very important: the temperature of water at the core
inlet and the temperature at the core outlet. I decided to implement these, and in
addition, create some kind of a measurement for water in the middle parts of the
reactor. The nominal temperature for coolant at the inlet is 543 K and the nominal
temperature at the outlet is 557.5 K (British Nuclear Energy Society 1987, 9).
These too are on LCD displays.
As important as coolant water temperatures are the flow rates of the main pumps.
As stated before, I simplified the system by representing everything with just
three pumps. These pumps have the same nominal capacity of 8000 m3/h as in
reality all operating three pumps of one coolant circuit half would have. But
again, how does one get the flow rate, and what order of magnitude has it? Using
pressure value and inner pipe diameter from Chapter 2.3 and water density of 784
kg/m3 at 535 K, Formula 8 provides the solution (The Engineering Toolbox
2012).

25
q = A / 4 * √(2 * p / ρ)
= ( π * (0.206 m)2 ) / 4 * √(2 * 1.962*106 Pa / 784 kg/m3)
= 2.358 m3/s (8)
This is the flow rate at the outlet of main coolant pumps. I decided to implement
this on LCD displays as well for all three pumps present in the simulator. Another
feature to add together with these flow rates is the capacity of the short term
emergency core cooling system. As mentioned in Chapter 2.3, the accumulators
are only enough for about 100 seconds. Thus a logical way to represent the capa-
city is to use its percentage.
The last numerical values to get themselves on displays are radioactivity in the re-
actor hall, the flow rate of the inert protective gas between the graphite stacks and
the humidity of this gas.
Other outputs implemented in the simulator are just light emitting diodes that act
as warning signals. They are the following: three alarm lights for tripping of three
main coolant pumps, an alarm light for high water level in drum separators, an
alarm light for low water level in drum separators, an alarm light for underpres-
sure in MCC, an alarm light for overpressure in MCC, an alarm light for excess
humidity in protective gas, an alarm light for protective gas pump tripping, an in-
dicator light for actuation of PPDDCS and an indicator light for reactor hall vent-
ilation status. All the alarm lights can be bypassed by a simple switch that opens
their circuits and thus prevents current from getting to the LEDs. These together
with the numerical values on LCD displays provide enough information to oper-
ate the reactor in this simulation.
3.3 Calculations during simulation
While accurate calculations using absolute values could be very difficult and po-
tentially straining to the microcontroller, acceptable results can be reached
through use of relative values, assuming real life phenomena are linear. With such
assumptions in mind I created Formula 9 for calculating activity of the reactor.
26
Control rod rate is a relative value that represents the reactor's reactivity through
the number of control rods in the reactor. It has a range of values from 0.03 to
1.2. The lower limit is based on relative thermal power of RBMK-1500 one hour
after scram (Almenas et al. 2010).
A = 103.098*1018 Bq * control rod rate (9)
The 103 exabecquerels are explained by Formula 7. As mentioned before, in the
simulation this is divided among three axial areas of the core: top, middle and
bottom. In addition, each part gets added a random number between -5 and 4.
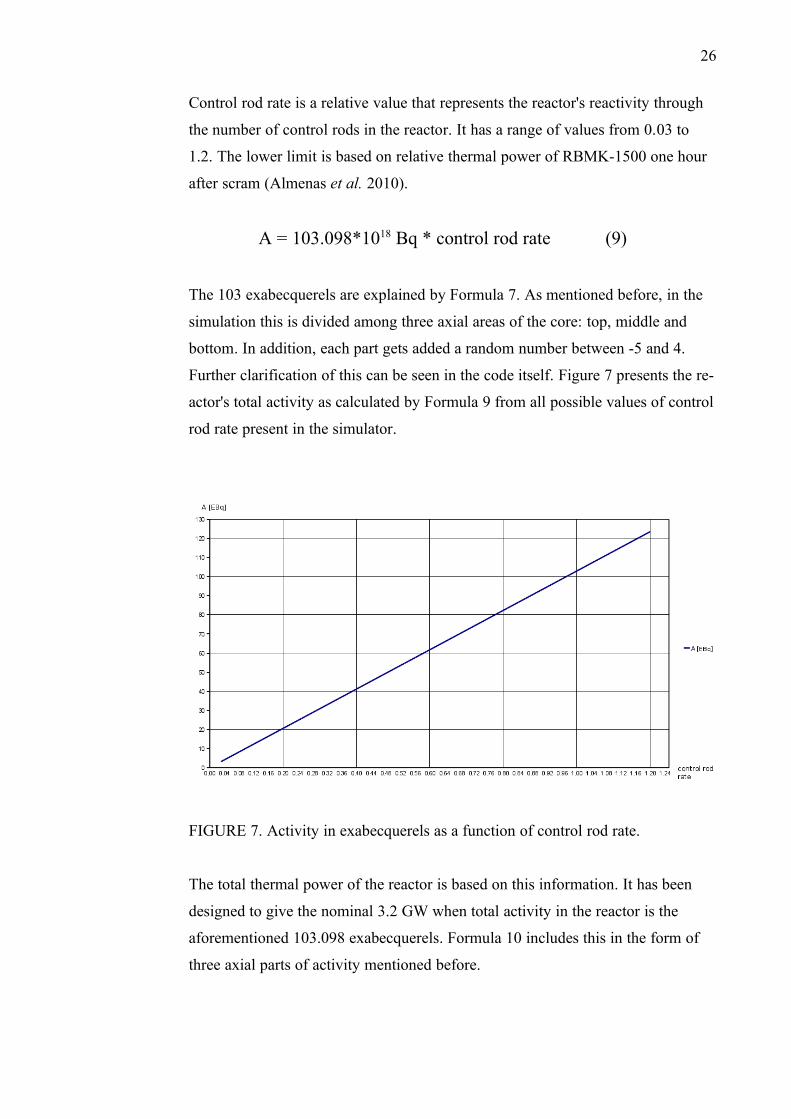
Further clarification of this can be seen in the code itself. Figure 7 presents the re-
actor's total activity as calculated by Formula 9 from all possible values of control
rod rate present in the simulator.
FIGURE 7. Activity in exabecquerels as a function of control rod rate.
The total thermal power of the reactor is based on this information. It has been
designed to give the nominal 3.2 GW when total activity in the reactor is the
aforementioned 103.098 exabecquerels. Formula 10 includes this in the form of
three axial parts of activity mentioned before.

27
Pth = ((Atop + Amiddle + Abottom) / 3) * 31.04 (10)
A real RBMK reactor calculates thermal power from the activity as stated in
Chapter 2.4, so I decided to do the same. This has the feature to react to imbal-
ances of activity in different reactor parts as well as being independent from tem-
peratures of coolant, thus being quite different to the electrical power the generat-
ors would give. I have reason to believe this is why the designers based their
power calculations on actual activities of the reactor instead of anything based on
temperatures.
Coolant temperatures are calculated using the control rod rate, pressures, inlet and
outlet temperatures. These are balanced to maintain the outlet coolant temperature
at 557 K when at nominal power. The inlet coolant temperature is also balanced
to remain at 543 K when the outlet temperature is nominal. The middle temperat-
ure is an exact arithmetic mean of these two. Some hysteresis is included in the
outlet temperature to prevent too fast changes in temperatures, as a huge mass of
water does not lose its thermal energy easily. These mentioned coolant temperat-
ures are calculated using Formula 11 for outlet temperature, Formula 12 for inlet
temperature and Formula 13 for middle temperature.
Ttop = Tbottom(prev) + (14 K * control rod rate) +
(2 – ((p1 + p2 + p3) / 2 MPa)) (11)
Tbottom = Ttop – 14 K (12)
Tmiddle = (Ttop + Tbottom) / 2 (13)
The pressure part in Formula 11 is designed to drop the megapascals, and provide
the pressure difference in the circuit compared to the nominal 2 MPa. The coolant
temperature is controlled by adjusting the main coolant pumps and control rods in
the reactor, the former being quicker to react. Figure 8 shows Ttop with control rod
rate of 1.0 and different total pressures.

28
FIGURE 8. Ttop with 4 different ptot as a function of time in seconds.
Pressures here refer to the pressures at outlets of main coolant pumps; the pres-
sure is significantly higher inside the fuel channels themselves.
Hydrogen build-up is calculated based on Ttop and existing amount of hydrogen. It
has been designed to produce 555.6 g of H2 per second. The reasoning for this is
the claim by the British Nuclear Energy Society that RBMK reactors produce two
tons of hydrogen in an hour. From this can be deduced the amount produced in a
second with simple algebra by Formula 14. As flammability of hydrogen-air mix-
tures is given in Vol-%, calculations should be made using volumes instead of
masses. Formula 15 shows how the simulation calculates produced amounts of
hydrogen using the density of hydrogen in standard temperature and pressure.
2000000 g/h / 3600 = 555.555... g/s ≈ 555. 6g/s (14)
VH2 = VH2(prev) + ((0.556 kg / 0.0899 kg/m3) * (Ttop / 557 K))
= VH2(prev) + (6.185 m3 * (Ttop / 557 K)) (15)
Hydrogen is removed through ventilation. This ventilation can process air at a
rate of 1196200 m3/h, which is about 332.28 m3/s (Almenas et al. 2010). This also
reduces the amount of hydrogen in the air. Formula 16 gives us the volume of hy-
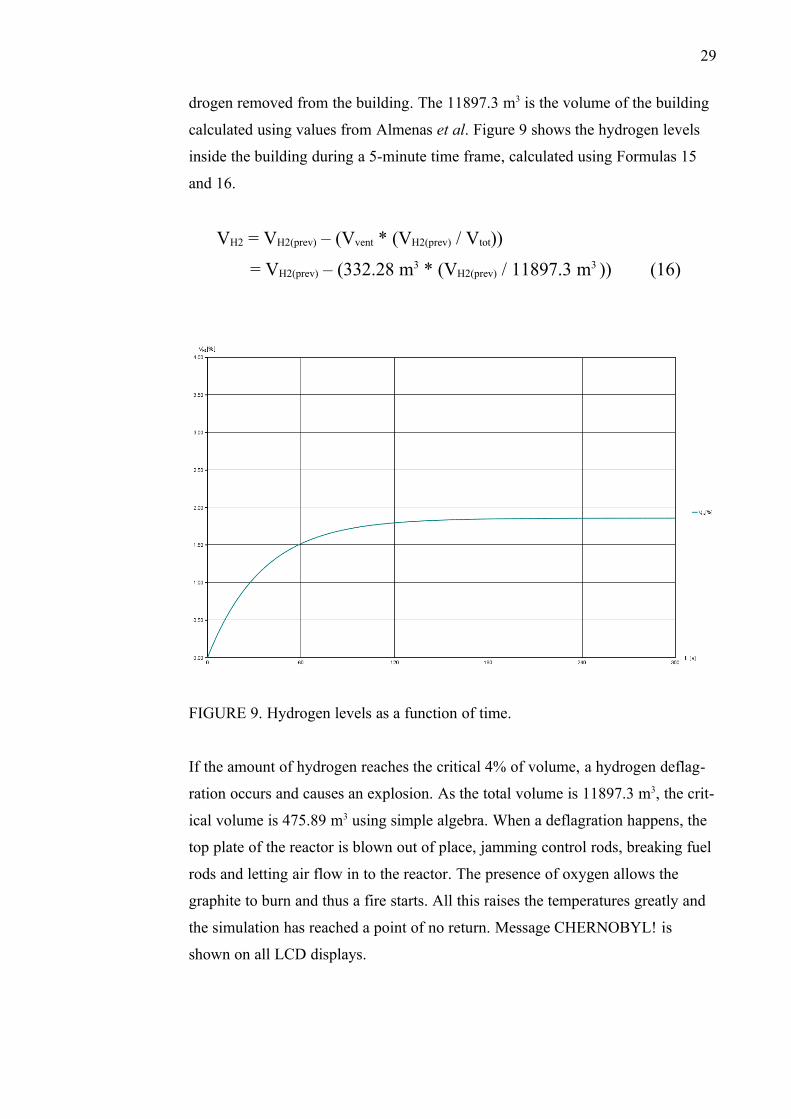
29
drogen removed from the building. The 11897.3 m3 is the volume of the building
calculated using values from Almenas et al. Figure 9 shows the hydrogen levels
inside the building during a 5-minute time frame, calculated using Formulas 15
and 16.
VH2 = VH2(prev) – (Vvent * (VH2(prev) / Vtot))
= VH2(prev) – (332.28 m3 * (VH2(prev) / 11897.3 m3 )) (16)
FIGURE 9. Hydrogen levels as a function of time.
If the amount of hydrogen reaches the critical 4% of volume, a hydrogen deflag-
ration occurs and causes an explosion. As the total volume is 11897.3 m3, the crit-
ical volume is 475.89 m3 using simple algebra. When a deflagration happens, the
top plate of the reactor is blown out of place, jamming control rods, breaking fuel
rods and letting air flow in to the reactor. The presence of oxygen allows the
graphite to burn and thus a fire starts. All this raises the temperatures greatly and
the simulation has reached a point of no return. Message CHERNOBYL! is
shown on all LCD displays.

30
The flow of the protective gas is simulated only as a randomized number between
1.24 and 1.44 m3/s. The exact values for this could not be found, and thus this has
only been reduced to a number of some curiosity. More important is the humidity
of this gas, as it indicates a leak of coolant and stops the ventilation. The humidity
starts at 21% and during coolant accidents can rise it up to 100%. If the humidity
rises above 70%, ventilation is stopped and an alarm activated. In time the humid-
ity falls down to normal.
Reactor hall radioactivity is also a random number between 104.79 GBq and
124.79 GBq. This is based on combined activity of beta and gamma particles that
would give an average sized adult an equivalent dose of 42.9 nSv/h. This amount
is still well below the accepted activity levels inside the buildings (Almenas et al.
2010). Using decay of 137Cs, beta particles have an energy of 82.3 fJ and gamma
particles have an energy of 106 fJ (Kaye & Laby, 2005). From these an arithmetic
mean is calculated using Formula 17. Then a nominal activity is calculated using
Formula 18. Caesium 137 was chosen because it is a common fission product that
could be expected to exist in the air.
Eβγ = (82.85*10-15 J + 106.01*10-15 J) / 2 = 94.18*10-15 J (17)
Ar.hall = (H/t * m * t) / Eβγ
= (42.9*10-9 Sv/h * 70 kg * 3600s) / 94.18*10-15 J
= 114.79*1012 Bq ≈ 114.8 GBq (18)
Water levels in drum separators are calculated using Formula 19. This value is
balanced to stay at 90% when the main coolant pumps are at the nominal pressure
of 2.36 m3/s. If water levels rise above 93%, temperatures rise a little as the steam
entering the drums loses too much heat energy to the water instead of retaining it.
If the water levels fall below 87%, temperatures fall as water cools too much in
the drums. A critical water level below 25% causes severe temperature risings and
radioactivity risings as there is not enough water in the circuit to absorb heat and
neutrons. The exact amounts of how this affects the reactor are just estimates and
not guaranteed values.
31
levelH2O = levelH2O(prev) – 2.36 + ((q1 + q2 + q3) / 2) (19)
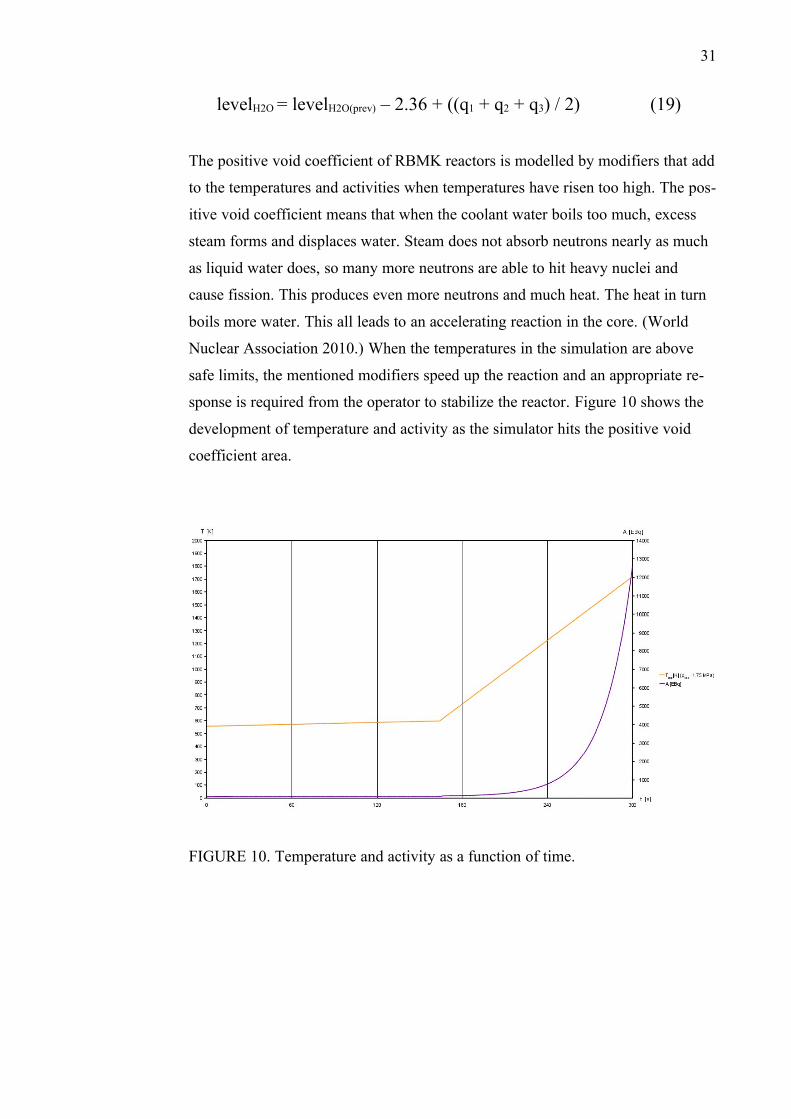
The positive void coefficient of RBMK reactors is modelled by modifiers that add
to the temperatures and activities when temperatures have risen too high. The pos-
itive void coefficient means that when the coolant water boils too much, excess
steam forms and displaces water. Steam does not absorb neutrons nearly as much
as liquid water does, so many more neutrons are able to hit heavy nuclei and
cause fission. This produces even more neutrons and much heat. The heat in turn
boils more water. This all leads to an accelerating reaction in the core. (World
Nuclear Association 2010.) When the temperatures in the simulation are above
safe limits, the mentioned modifiers speed up the reaction and an appropriate re-
sponse is required from the operator to stabilize the reactor. Figure 10 shows the
development of temperature and activity as the simulator hits the positive void
coefficient area.
FIGURE 10. Temperature and activity as a function of time.
32
3.4 Accident generation
Accidents and mishaps are an important part of a successful simulation, thus they
had to be implemented on this as well. The International Atomic Energy Agency
has done good research on accidents in RBMK reactors, and their research was
used as a basis for accident generation in this simulator. Nuclear reactor accidents
are divided to three categories: typical accidents, design basis accidents and bey-
ond design basis accidents. The latter two are usually abbreviated DBA and
BDBA. Typical accidents are minor incidents that can happen quite often, and in
fact they are anticipated to happen in the reactor's lifetime. Design basis accidents
are rarer accidents that can occur roughly once in one hundred reactor years. Bey-
ond design basis accidents are severe accidents that are further divided to ones
that do not cause core damage and ones that do. These should happen only once
in one million reactor years. (IAEA 2005, 9.)
In the simulator, a random number between 0 and 1000000 is generated each
second, which means every cycle of the main loop. This number is multiplied by
one reactor year in seconds, to get the number of seconds for one million reactor
years. This makes it possible to initiate accidents that have a probability of 1 per
1000000 reactor years to happen. Next, the random number is compared to differ-
ent ranges of numbers to see if some kind of accident takes place. For BDBA,
both core damaging and others, are given one value that the random number must
match for an accident to happen. For DBA the number must land in the same
thousand for an accident to occur. For typical accidents the number must land in
the same million to trigger an accident.
For certain accidents that are critical or would take over an hour to repair, acci-
dent generation is frozen so that no further accidents can happen. This makes it a
little easier to stabilize the situation and decrease reactor power safely. As the
simulator does not have proper scram-functions it would be much harder to pre-
vent the reactor from reaching dangerous temperatures and activities if further ac-
cidents would affect it. The accidents just give values to modifiers that are added

33
to the results of actual calculations. Affected parameters are coolant temperatures,
reactor activities, pump pressures, protective gas humidity, emergency core cool-
ing system's valve and reactor hall activity.
Some anomalies normalize over time while damages can be repaired. In the simu-
lator these are represented by simple counters that decrease by one every cycle.
There are two counters, one for pressure-related incidents and one for temperat-
ure-related incidents. Other abnormalities use either one of these or are corrected
by the operator. With each repairable accident, these counters are given random
values based on the seriousness of the damages. These values can be anything
from 6 to 45 minutes. Minor fluctuations and malfunctions even out in less than a
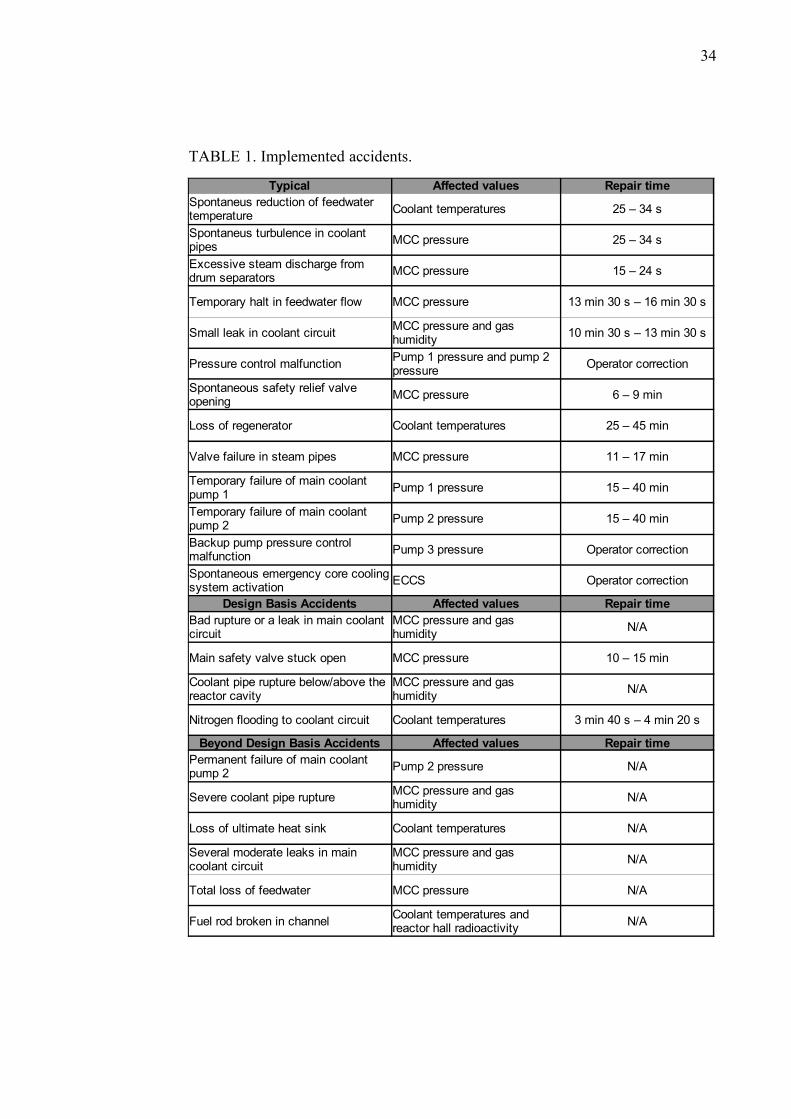
minute. Table 1 includes all accidents included in the simulation, parameters they
affect and possible time it takes to repair the situation.
Some accidents also require other conditions to be met to happen. For example,
severe coolant pipe rupture requires excess pressure in the circuit and backup
pump tripping requires the pump to be active in the first place. Thus it it possible
to avoid certain accidents by not exceeding safe operational limits in pressure etc.
34
TABLE 1. Implemented accidents.
Typical Affected values Repair time
Coolant temperatures 25 – 34 s
MCC pressure 25 – 34 s
MCC pressure 15 – 24 s
Temporary halt in feedwater flow MCC pressure 13 min 30 s – 16 min 30 s
Small leak in coolant circuit 10 min 30 s – 13 min 30 s
Pressure control malfunction Operator correction
MCC pressure 6 – 9 min
Loss of regenerator Coolant temperatures 25 – 45 min
Valve failure in steam pipes MCC pressure 11 – 17 min
Pump 1 pressure 15 – 40 min
Pump 2 pressure 15 – 40 min
Pump 3 pressure Operator correction
ECCS Operator correction
Design Basis Accidents Affected values Repair time
N/A
Main safety valve stuck open MCC pressure 10 – 15 min
N/A
Nitrogen flooding to coolant circuit Coolant temperatures 3 min 40 s – 4 min 20 s
Beyond Design Basis Accidents Affected values Repair time
Pump 2 pressure N/A
Severe coolant pipe rupture N/A
Loss of ultimate heat sink Coolant temperatures N/A
N/A
Total loss of feedwater MCC pressure N/A
Fuel rod broken in channel N/A
Spontaneus reduction of feedwater temperature
Spontaneus turbulence in coolant pipes
Excessive steam discharge from drum separators
MCC pressure and gas humidity
Pump 1 pressure and pump 2 pressure
Spontaneous safety relief valve opening
Temporary failure of main coolant pump 1
Temporary failure of main coolant pump 2
Backup pump pressure control malfunction
Spontaneous emergency core cooling system activation
Bad rupture or a leak in main coolant circuit
MCC pressure and gas humidity
Coolant pipe rupture below/above the reactor cavity
MCC pressure and gas humidity
Permanent failure of main coolant pump 2
MCC pressure and gas humidity
Several moderate leaks in main coolant circuit
MCC pressure and gas humidity
Coolant temperatures and reactor hall radioactivity

35
4 ELECTRONICS USED
4.1 Microcontroller unit
The centre of the simulator is Microchip PIC24FJ256GA108. This 16-bit unit has
all the features required. As 8-bit integers would not be enough to store the large
numbers involved, a 16-bit device was chosen. Analog to digital converters are
used to read values adjusted by potentiometers to control main coolant pumps.
Other functionality is mainly basic digital inputs for switches and outputs for in-
dicators. All digital I/O-pins use TTL levels. The chosen package for this device
is TQFP with 80 pins. The controller uses 3.3 V fed on pins 32, 48 and 71.
Ground is connected to pins 12, 32, and 51.
Bits 4 to 7 of port E are used to send data to four LCD displays 4-bit mode of op-
eration. The displays are controlled by multiplexing their EN-signals in bits 12 to
15 of port B. Their RS-signal is sent via bit 14 in port A.
Three 10 kΩ potentiometers are connected to analog inputs AN0, AN1 and AN2.
The reference voltage for this A/D-converter is provided by the 3.3 V to pin 71
and a 100 nF capacitor connected between ground and pin 70. The converter has
10 bits, thus having values from 0 to 1023, with 0 V on input being 0 and 3.3 V
being 1023. These values are then converted to pressures of the three main
coolant pumps in the software.
Bits 0 to 8 in port F are used for different kinds of alarm indicators. Bit 0 of port
F is used for an alarm of high water levels in drum separators and bit 1 of the
same port is for low water levels. Bits 2, 3 and 8 represent the alarms for pump
tripping. Bit 4 is for protective gas humidity alarm and bit 5 for gas flow stop
alarm. Bit 6 controls an alarm signal for activation of automatic control rods. Fi-
nally bit 7 is used for the building's ventilation status indicator. Bit 0 of port G
36
represents high pressure alarm in the main coolant circuit and bit 1 represents low
pressure alarm.
Port D is used for input switches. Bits 0 and 1 allow overriding the automatic
control rods. Bits 2 to 7 are used to raise or lower the control rods. Bit 8 is for dis-
abling the PPDDCS. Bit 9 is used for switching the ventilation on or off. Bit 10 is
for the ECCS while bit 11 switches on the backup coolant pump. On these inputs,
simple switches are connected that let voltage of 3.3 V from a nearby voltage rail
to the pins. This is a logical 1 and is used on the software to activate things. When
a switch is off, there is 0 volts in a pin, which means a logical 0. All these inputs
are simple boolean inputs.
Programming the microcontroller is done by the In-Circuit Serial Programming
system. In this system, a programming device, such as PICkit2, is connected to a
row header that has six pins. The first pin of this header is connected to the micro-
controller's master clear pin, which resets the device before and after program-
ming. The second pin and the third pin are for VDD and VSS. The fourth is for the
ICSP clock while the fifth is for the ICSP data. The sixth pin is not used and is
left unconnected. When being programmed, the programming device provides a
voltage of 3.3 volts and controls the MCLR by pulling it down. When in normal
operation, the MCLR is pulled down using a self-made jumper with a 4.7 kΩ res-
istor in it, which connects the master clear and VDD together through the resistor.
4.2 Power supply
The aforementioned microcontroller unit is designed to use 3.3 volts as its core
voltage, while the LCD displays require 5 volts. Thus different kinds of voltages
must be produced for the devices. A 9 V battery was chosen as a source of power,
and a small regulator was designed to provide the required lower voltages.
This power supply module has a main switch that can safely cut off a current of
10 A. Following the switch is a 10 µF capacitor to keep the input voltage smooth.
After that is a 7805 linear regulator that provides the 5 V output with another

37
10 µF capacitor to filter the output. From this point there is a wire that provides
the 5 V to the displays and an indicator in the form of a 150 Ω resistor and a
green LED. The 5 V is also given as input to a UA78M33 regulator that produces
the 3.3 V. That regulator is once again followed by a 10 µF capacitor. After the
last capacitor the line is branched to a wire that takes the 3.3 V to the microcon-
troller unit and another indicator, consisting of a 65 Ω resistor and a yellow LED.
Both regulators are cooled by aluminium heat sinks affixed to them. Figure 11
shows the completed power supply unit switched on. Accurate schematic is
shown in Appendix 1.
FIGURE 11. The power supply unit.
4.3 LCD display chain
The displays chosen were Midas Components MC41605B6W-SPR. This 4x16
display has yellow-green back-light with black pixels. It uses Hitachi's HD44780

38
interface for wiring and data transfer. The display itself is mounted on a small
PCB that has some control electronics as well as a set of soldering pads on both
sides of the lower edge. Their being on both sides makes it easy to create a chain
of them by soldering wires on both sides. Then some wires go to a previous dis-
play and the others to the next.
As mentioned before, to save pins in the microcontroller, the LCD displays share
everything else but their enable-signals. Thus they all can be connected together
in a bus topology. 4-bit operation was chosen because soldering 4-wired ribbon
cable is easier than an 8-wired one. Thus also cable clutter is less likely when the
displays are installed on a frame. There will only be writing data to the displays'
memories, no reading from them. Hence there is no need to give the R/W pins
any signal wires, so they are just connected to ground. The Register Select is con-
nected together in all displays as well. The back-light luminosity is set static by
creating a voltage division with two 4.7 kΩ resistors. The luminosity control to-
gether with all VDD and VSS wires are connected from one display to the next.
During the first soldering try, data cables were accidentally soldered to the wrong
bits, 0 – 3, when the correct ones are bits 4 – 7. Also RS wires were forgotten.
These mistakes were later corrected. Figure 12 shows the display chain after these
corrections.
FIGURE 12. LCD-display chain, orange wires are for enables.

39
4.4 Printed Circuit Board
I originally planned to use a simple breadboard for all the components. In this
board would be rows of headers where another small board would be mounted.
On this smaller board would be just the microcontroller. All connections would
be done with single wires to connectors on the edges of the breadboard. After a
small test, this proved to be impractical. So a proper Printed Circuit Board was
designed using GEDA PCBdesigner software. This one layer design consists of
the MCU in the middle of the board, with the VCAP near it for maximal voltage
quality. There are no other components on the board except those, as everything
is connected using different kinds of connectors. Near the edges around the whole
board is a ground lane. Making a proper ground plane is quite complicated so in-
stead only a wide lane was created. This is more than enough as no high currents
or high frequencies travel on the PCB. There are 4 mm mounting holes in the
corners of the board. PCB layout is shown in Appendix 2.
The design was exported as an Extended Gerber file and sent to Beta Layout Ltd
for manufacturing. The printed circuit board was designed with soldermask, silk-
screen printed markings and chemical tin coating on the soldering pads. Due to
carelessness, the silkscreen texts in the design were written in Finnish rather than
English. The board was complete in four days and shipped to Finland in three
days.
Assembling began by soldering the microcontroller to its place. As the TQFP
used has a pin spacing of 500 µm with pins 220 µm wide it is better to be
soldered using an oven instead of soldering iron. Lacking a proper re-flow oven, I
used an ordinary kitchen oven heated to 473 K. Before putting the PCB in the
oven, the pads were given a pretinning using a soldering wire that consisted of
60% tin 40% lead. Also the microcontroller was soldered to place from all
corners by hand. The microcontroller was protected from heat by a small alumini-
um piece that covered only the chip part, leaving the pins bare. Seven minutes in
40
the oven ensured a proper result. All connections were measured using a multi-
meter.
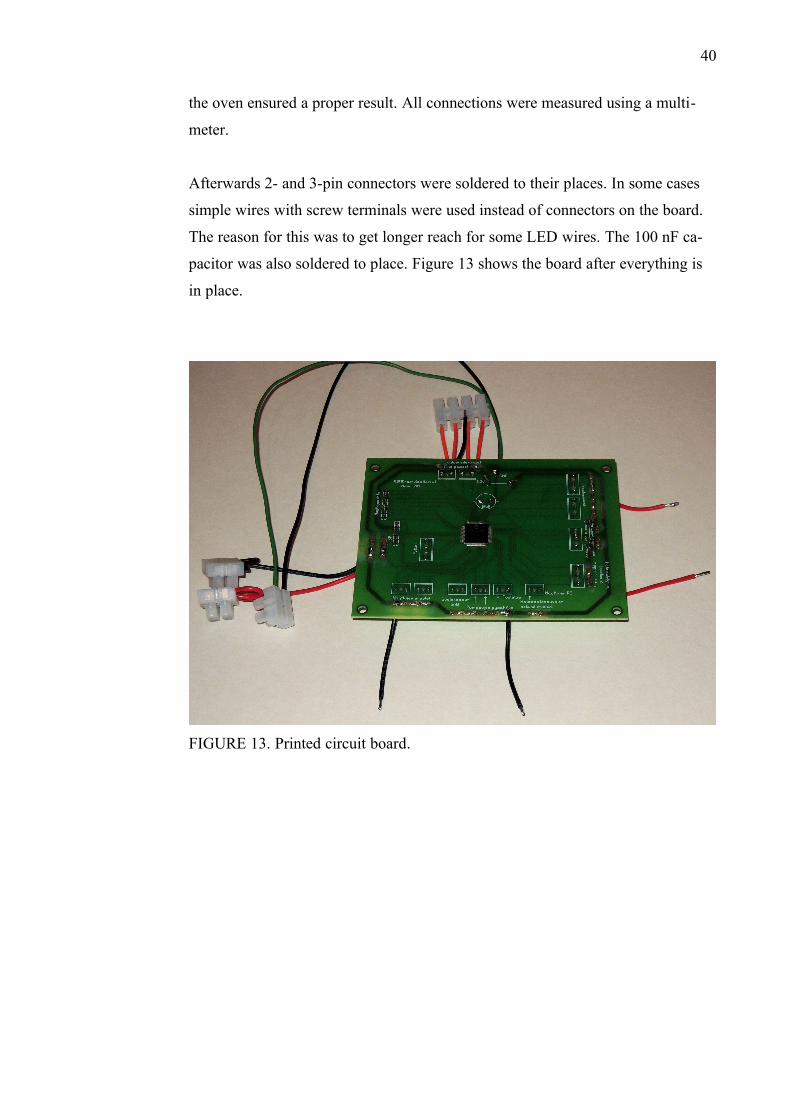
Afterwards 2- and 3-pin connectors were soldered to their places. In some cases
simple wires with screw terminals were used instead of connectors on the board.
The reason for this was to get longer reach for some LED wires. The 100 nF ca-
pacitor was also soldered to place. Figure 13 shows the board after everything is
in place.
FIGURE 13. Printed circuit board.
41
5 FRAME
All these electronics need to be affixed to something that makes operating
switches and reading LCD displays easy. It must also be able to hold the printed
circuit board and the power supply unit firmly in place. Thus a frame is required.
First, corrosion-resistant steel was considered as the material to produce a frame,
but due to sudden availability of cheap aluminium sheets, the final frame was
made of aluminium.
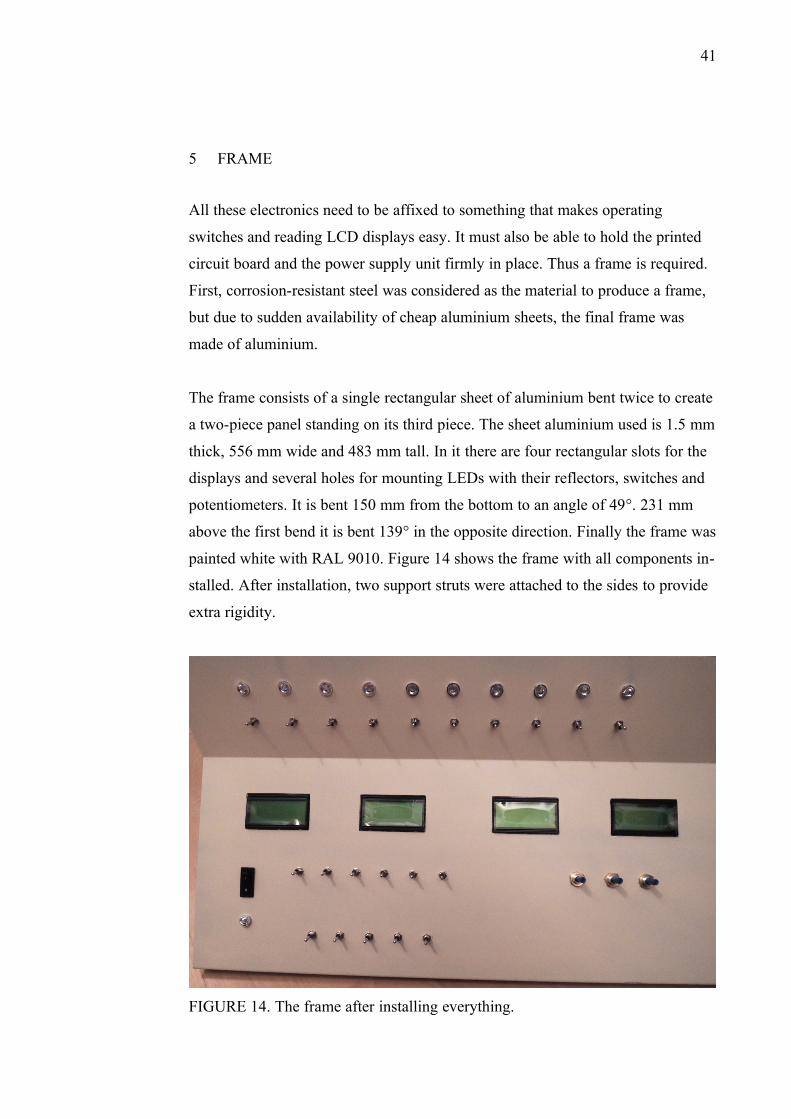
The frame consists of a single rectangular sheet of aluminium bent twice to create
a two-piece panel standing on its third piece. The sheet aluminium used is 1.5 mm
thick, 556 mm wide and 483 mm tall. In it there are four rectangular slots for the
displays and several holes for mounting LEDs with their reflectors, switches and
potentiometers. It is bent 150 mm from the bottom to an angle of 49°. 231 mm
above the first bend it is bent 139° in the opposite direction. Finally the frame was
painted white with RAL 9010. Figure 14 shows the frame with all components in-
stalled. After installation, two support struts were attached to the sides to provide
extra rigidity.
FIGURE 14. The frame after installing everything.

42
6 CONCLUSION
Considering the complexity of the subject, this thesis has given me an adequate
challenge. The decision to leave out the turbines and everything else related to
power generation was indeed correct as it would have complicated several things.
Of course these simplifications mean that several important functions are left out,
but as the purpose of this simulator is to show others how the reactor works, the
losses are acceptable.
Much time was spent on researching the reactor type and physical phenomena re-
lated to it. My understanding of theories behind nuclear reactions gained much
depth. Also, insight into accidents and incidents, and their categorisation was ac-
cumulated. Even though some assumptions about linearity may be incorrect, the
end result is still workable and serves the purpose of showing what factors correl-
ate with what events. As the simulator is not meant to be run for periods of tens of
hours, particularly long procedures were left out. Among these are start-up, shut-
down and serious damage repairing. The simulator puts the user in the place of
the operator in the main control room, where almost everything can be controlled
by a group of several operators under their supervisor. Refuelling, repairing and
all actions carried out in other buildings are left out. Only repairing is simulated
as timers that represent technicians working somewhere in the plant.
Considering the electronics the simulator is quite a simple device. A powerful Mi-
crochip PIC24 is used to calculate everything, read controls and drive indicators.
The PIC24-family was new to me and it differs from its smaller cousins. The
main difference is of course the bit-length of 16 bits. Other differences to what I
had worked earlier on are VDD of 3.3 volts and the system of providing correct
voltage to core either with direct input of 2.5 V or a 10 µF capacitor on VCAP pin.
Using the 4x16 LCD-displays was easy as they all follow HD44780 interface.
The program itself turned out to be quite simple. Implementing all calculations
was simple when they were first formulated on paper. Using 4 LCD displays
chained together was more exotic, but proved to be easy because multiplexing

43
their EN-signals determines which one reacts to commands. Reading A/D-con-
verter channels was also easy as the datasheet specified the range of their result
from 0 to 1023. Thus dividing the result with 1024 and multiplying with what I
wanted the maximum pump pressures to be was the obvious choice. The code is
full of conditions to be checked and modifiers to be added to simulate different
kinds of situations. The code was compiled in MPLAB and written to the micro-
controller using PICkit2.
In the end this simulator was a success and certainly a very unique project among
my peers. It incorporates independent research of sciences, creation of formulae
to simulate the reactor and program code to implement all this. All electronics are
kept simple to reduce possibilities of unexpected failures. As the microcontroller
was chosen using sensible criteria, there is no need for external electronics to
provide features. For future development, more research could be done on physics
and the simulation model could be improved to be a more accurate representation
of the reactor. Also, an extension featuring the feed-water circuit and turbines
could be designed as an addition to the existing device.
44
REFERENCES
Almenas, K., Kaliatka, A. & Uspuras, E. 2010. The Ignalina Source Book [refer-
enced 11th January 2013]. Available: http://www.lei.lt/insc/sourcebook/
British Nuclear Energy Society. 1987. Chernobyl: a technical appraisal. ISBN: 0-
7277-0394-3. 1st edition. London: Robert Hartnoll Ltd.
Elemash. 2004. RBMK-1000 and RBMK-1500 nuclear fuel [referenced 22nd
January 2013]. Available:
http://www.elemash.ru/en/production/Products/NFCP/RBMK/
The Engineering Toolbox. 2012. Water – Thermal properties [referenced 3rd Feb-
ruary 2013]. Available: http://www.engineeringtoolbox.com/water-thermal-prop-
erties-d_162.html
Integrated Publishing Inc. 2007. Material Science Volume 1 of 2 [referenced 13th
January 2013]. Available:
http://nuclearpowertraining.tpub.com/h1017v1/css/h1017v1_90.htm
International Atomic Energy Agency. 1992. The Chernobyl Accident: Updating
of INSAG-1: INSAG-7. ISBN: 92-0-104692-8. 1st edition. Vienna: IAEA.
International Atomic Energy Agency. 2005. Accident analysis for nuclear power
plants with graphite moderated boiling water RBMK reactors. ISBN: 92-0-
112804-5. 1st edition. Vienna: IAEA.
Kaye & Laby Online. 2005. Tables of Physical & Chemical Constants. 4 Nuclear
Physics [referenced 22nd January 2013]. Available: http://www.kayelaby.n-
pl.co.uk/atomic_and_nuclear_physics/

45
Park, C. 1989. Chernobyl: the long shadow. ISBN: 0-415-03553-8. 2nd edition.
Guildford and King's Lynn: Biddles Ltd.
World Nuclear Association. 2010. RBMK Reactors [referenced 11th January
2013]. Available: http://www.world-nuclear.org/info/inf31.html

46
APPENDICES
APPENDIX 1/3. Schematic
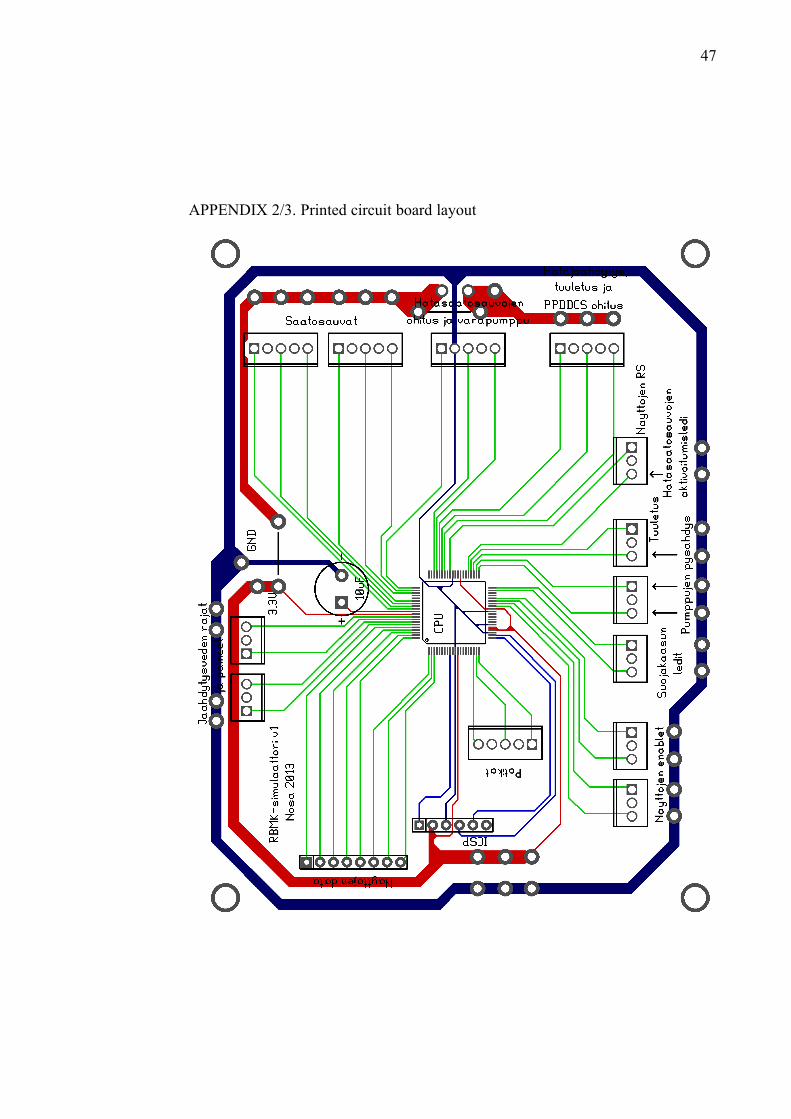
47
APPENDIX 2/3. Printed circuit board layout

48
APPENDIX 3/3. Source code
/* Program for RBMK-simulator. Version 1.0. Copyright (C) 2012 Mikael Nosa
This program is free software: you can redistribute it and/or modify it under the terms of the GNU General Public License as published by the Free Software Foundation, either version 3 of the License, or (at your option) any later version.
This program is distributed in the hope that it will be useful, but WITHOUT ANY WARRANTY; without even the implied warranty of MERCHANTABILITY or FITNESS FOR A PARTICULAR PURPOSE. See the GNU General Public License for more details.
You should have received a copy of the GNU General Public License along with this program. If not, see <http://www.gnu.org/licenses/>.
The author can be contacted by email: [email protected] */
/* WARNING! This is only a simulator code used on electronics to teach others how RBMK works. Do not even try using this in a real reactor. Also do not use this as an official training material for reactor operators, this only a simplified simulator for feeding curiosity.
If you build your own nuclear reactor (no matter how small or simple), send me an e-mail describing it, I'm truly interested. */
#define XTAL_FREQ 1 // 1MHz/* Change this and CLKDIV if using another frequency */
#include <stdio.h>#include <stdlib.h>#include <math.h>#include <adc.h>#include <timer.h>#include <p24FJ256GA108.h>#include "delay.h"#include "lcd.h"
/* Pinout for PIC24FJ256GA108 * * Pin3 RE7 - LCD-data 4-bit operation * Pin2 RE6 - LCD-data 4-bit operation * Pin1 RE5 - LCD-data 4-bit operation * Pin80 RE4 - LCD-data 4-bit operation * * Pin9 MCLR - Master clear for ICSP and booting up * Pin11 Vss - Vss for ICSP * Pin12 Vdd - Vdd for ICSP * * Pin18 AN2 - A/D-converter channel for main coolant pump 1 * Pin19 AN1 - A/D-converter channel for main coolant pump 2 * Pin20 AN0 - A/D-converter channel for main coolant pump 3 * * Pin21 PGEC2 - Programming clock for ICSP * Pin22 PGED2 - Programming data for ICSP * * Pin33 RB12 - Enable signal for LCD-display 1 * Pin34 RB13 - Enable signal for LCD-display 2 * Pin35 RB14 - Enable signal for LCD-display 3 * Pin36 RB15 - Enable signal for LCD-display 4 * * Pin39 RF4 - Protective gas humidity alarm * Pin40 RF5 - Protective gas flow stop alarm * * Pin41 RF3 - Main coolant pump 1 stop alarm * Pin42 RF2 - Main coolant pump 2 stop alarm * Pin43 RF8 - Main coolant pump 3 stop alarm *

49
* Pin44 RF7 - Ventilation status * * Pin45 RF6 - Automatic control rod activation * * Pin52 RA14 - Display RS * * Pin54 RD8 - PPDDCS disable * * Pin55 RD9 - Ventilation toggle * * Pin56 RD10 - Emergency Core Cooling System activation * * Pin57 RD11 - Backup pump activation * * Pin58 RD0 - Automatic control 1 rod override * Pin61 RD1 - Automatic control 2 rod override * * Pin62 RD2 - Control rod 1 * Pin63 RD3 - Control rod 2 * Pin66 RD4 - Control rod 3 * Pin67 RD5 - Control rod 4 * Pin68 RD6 - Control rod 5 * Pin69 RD7 - Control rod 6 * * Pin70 VCAP - 10µF capacitor * * Pin72 RF0 - High water level alarm * Pin73 RF1 - Low water level alarm * Pin74 RG1 - High pressure alarm * Pin75 RG0 - Low pressure alarm * * Vdd, Vss, AVdd and AVss not mentioned here */
int main(void){
/* Can I replicate Chernobyl disaster with this? How? Yes. Simply allow the coolant liquid to overheat and start lowering control rods only after it's too late. */
/* Initialization */ OSCCON=0x7704; /* Internal oscillator with no PLL or sleep modes */ CLKDIV=0x0300; /* 8MHz / 8 = 1MHz, no slower frequency on sleep mode */
AD1PCFGL=0xFFF8; /* AN0, AN1 and AN2 as analog inputs */ AD1CON2=0x0400; /* Voltage reference between AVdd and AVss */ AD1CON3=0x8f3f; /* ADC uses internal clock and quick timing */ AD1CON1=0x80e4; /* ADC-module operational, produces integers and automatic conversion timing */
/* Set digital I/O-pins */ TRISA=0x0000; TRISB=0x0000; TRISD=0xFFFF; TRISE=0x0000; TRISF=0x0000; TRISG=0x0000;
/* Intialize all four LCD-displays */ LATBbits.LATB12=1; lcd_init(); LATBbits.LATB12=0;
LATBbits.LATB13=1; lcd_init(); LATBbits.LATB13=0;
LATBbits.LATB14=1; lcd_init(); LATBbits.LATB14=0;
LATBbits.LATB15=1; lcd_init(); LATBbits.LATB15=0; /* The enable-multiplexing is done manually to have strict control over it */
/* Variables for control rods and their positions in the reactor core */ int rod1,rod2,rod3,rod4,rod5,rod6; int rod1_position,rod2_position,rod3_position,rod4_position,rod5_position,rod6_posi-tion; rod1=rod2=1; rod3=rod4=rod5=rod6=0;
50
rod1_position=rod2_position=21; rod3_position=rod4_position=rod5_position=rod6_position=0; /* Variable for emergency valve */ int emergency_valve=0;
/* Variables for automatic control rods */ int override_a_rod1=0; int override_a_rod2=0; int automatic_rod1=0; int automatic_rod2=0; int a_rod1_position=0; int a_rod2_position=0;
/* Variables for main coolant pumps, first 3 are pressure in MPa values, last is 0/1-value */ double p_pump1=1.96; double p_pump2=1.96; double p_pump3=0; int backup_pump=0;
/* Variable for checking if PPDDCS is active, 0/1-value */ int ppddcs_disabled=0;
/* Variable for the PPDDCS to start working */ int ppddcs_delay=6;
/* Variable for reactorhall ventilation */ int ventilation_active=1;
/* Variables for reactor core temperatures in Kelvins */ double t_reactor_top,t_reactor_middle,t_reactor_bottom; t_reactor_bottom=538;
/* Variables for reactor core radioactivities in exabecquerels */ double a_reactor_top,a_reactor_middle,a_reactor_bottom;
/* Variable for the thermal power of the reactor in megawatts */ int p_thermal=0;
/* Variable for activity rising due to control rods' graphite tip displacing neutron absorbing water */ double a_rod_modifier=1;
/* Variable for relative humidity of the protective gas */ int gas_humidity=21;
/* Variable for flow of protective gas in m^3/h */ double gas_flow=2.7;
/* Variable for reactorhall radioactivity in becquerels. Small amounts leak from the channels */ int a_reactorhall=149;
/* Variables for main coolant pump flow rates */ double q_pump1,q_pump2,q_pump3;
/* Variable for capacity of the emergency cooling water tank, in percent */ int v_emergency_tank=100;
/* Constant used in calculations of dynamic pressure in coolant circuits, dens-ity of water in 538K */ static const int density=784;
/* Do I really have to explain this one? */ static const double pi=3.14159625;
/* This variable is used on all kinds of calculations, it is based on the number of control rods inserted into the reactor */ double control_rod_rate=0.8;
/* Variable for storing the volume of hydrogen in the reactorhall, measured on m^3 */ double V_H2=0;
/* The Chernobyl flag. If this ever goes '1' everything is hopeless... */ int chernobyl=0;
/* Variable for reactor water level in percent */ double water_level=90;
/* Variable for storing temporary pump values */ double temp_pump=0;
/* Variable for random mishaps and failures */ int accident=0;
/* This represents one reactor year in seconds, used in accident generation */ long int reactor_year=(60L*60L*24L*365L);

51
/* This variable is used to freeze new accident generation, so that huge amounts of bad things don't happen after another */ int freeze_accident=0;
/* These variables calculate time in seconds for some smaller faults to be re-paired by reactor technicians, this usually takes lots of time */ int t_repair_counter=0; int p_repair_counter=0;
/* Variables for accident modifiers */ int pump1_modifier=0; int pump2_modifier=0; double pressure_modifier=0; double temperature_modifier=1.0; int a_reactorhall_modifier=0; int gas_humidity_modifier=0; /* Variable for storing activity in positive void coefficient loop */ double a_storage=0; /* Variable for LCD-texts */ char * stuff ="Empty";
/* Seed random number generator, let's hope the potentiometer is at a different value each time this is started */ AD1CON1bits.ADON=0; AD1CHS0=0x0101; AD1CON1bits.ADON=1; ConvertADC10(); p_pump2=ReadADC10(0); srand(p_pump2); while(1){
/* All controls are disabled if this happens */ if(chernobyl==0){ /* Really there are more, but this has been simplified. These 6 rods keep re-actor power between 0% and 120%... */ rod1=PORTDbits.RD2; rod2=PORTDbits.RD3; rod3=PORTDbits.RD4; rod4=PORTDbits.RD5; rod5=PORTDbits.RD6; rod6=PORTDbits.RD7;
/* In case of reactor heating too much, emergency water reserves can be pumped in for 100 seconds to cool it */ emergency_valve=PORTDbits.RD10;
/* Again, simplification. These lower reactor power 20% per rod, PPDDCS con-trols these, but the operators can disable individual rods */ override_a_rod1=PORTDbits.RD0; override_a_rod2=PORTDbits.RD1;
/* This simplified version has 2 main coolant pumps, and 1 backup coolant pump */ AD1CON1bits.ADON=0; AD1CHS0=0x0202; AD1CON1bits.ADON=1; ConvertADC10(); p_pump1=ReadADC10(0); p_pump1=(p_pump1/1024)*5.0; AD1CON1bits.ADON=0; AD1CHS0=0x0101; AD1CON1bits.ADON=1; ConvertADC10(); p_pump2=ReadADC10(0); p_pump2=(p_pump2/1024)*5.0;
/* The backup pump can keep coolant flowing in case other main pump fails, pressure set in the if below */ backup_pump=PORTDbits.RD11; if(backup_pump==1){ AD1CON1bits.ADON=0; AD1CHS0=0x0000; AD1CON1bits.ADON=1; ConvertADC10(); p_pump3=ReadADC10(0); p_pump3=(p_pump3/1024)*5.0; }
/* PPDDCS=Physical Power Density Distribution Control System, it keeps the re-action power about equal in different parts of reactor */ ppddcs_disabled=PORTDbits.RD8;
/* Reactorhall ventilation shuts down when humidity rises too high, afterwards

52
it must be started manually. This keeps hydrogen amounts low */ ventilation_active=PORTDbits.RD9;
} /* End of control block */
/* Physical anomalities and accidents happening randomly */
if(freeze_accident==0){
/* This generates a random second among all seconds in one million reactor years. If the simulator is run continuously for one year, enough seconds to represent them all are generated, and on these are based the accidents below. Their probabilities are given by IAEA. Typical: 0.1 to 0.01 chance per reactor year. DBA: 0.01 to 0.0001 chance per reactor year. BDBA: on in a million chance per reactor year. Note that these are by classical probabilities, in real-ity incidents can pile up nastily and make mess of things. */ accident=rand()%(1000000*reactor_year);
/* Beyond Design Basis Accidents (the worst accidents) by IAEA */
if(accident==999999999){ /* Permanent failure of main coolant pump 2 */ pump2_modifier=1; freeze_accident=1; }
if(accident==999999998 && (((p_pump1+p_pump2+p_pump3)/2)>=7)){ /* Severe coolant pipe rupture, this also requires nasty overpressures (>7MPa) */ pressure_modifier=-1.9; gas_humidity_modifier=2; freeze_accident=1; }
if(accident==999999997){ /* Loss of ultimate heat sink, meaning the pipelines to river or sea */ temperature_modifier=1.1; freeze_accident=1; }
if(accident==999999996 && (((p_pump1+p_pump2+p_pump3)/2)>=6.1)){ /* Several moderate leaks in main coolant circuit, this also requires nasty overpressures */ pressure_modifier=-1.2; gas_humidity_modifier=2; freeze_accident=1; }
if(accident==999999995){ /* Total loss of feedwater, this is very bad, the circuit however can still uphold at least some pressure for a while */ pressure_modifier=-0.8; freeze_accident=1; }
if(accident==1){ /* Fuel rod broke in channel, this causes temperature to rise as water contacts uraniumdioxide */ a_reactorhall_modifier=681; temperature_modifier=1.2; freeze_accident=1; }
/* Design Basis Accidents (really bad accidents) by IAEA */
if(accident>=1000 && accident<2000){ /* Bad rupture or a leak in main coolant circuit */ pressure_modifier=-0.7; gas_humidity_modifier=1; freeze_accident=1; }
if(accident>=3000 && accident<4000 && (((p_pump1+p_pump2+p_pump3)/2)>=9.8)){ /* Main safety valve stuck open, this only occurs after substantial over-pressure */ pressure_modifier=-0.8; /* This can be repaired by a group of technicians in about 10 to 15 minutes */ p_repair_counter=p_repair_counter+600+(rand()%300); }
if(accident>=5000 && accident<6000 && (((p_pump1+p_pump2+p_pump3)/2)>=6.8)){ /* Coolant pipe rupture below/above the reactor cavity, this only occurs after very high overpressure */ gas_humidity_modifier=2;
53
pressure_modifier=-0.4; }
if(accident>=7000 && accident<8000 && emergency_valve==1){ /* Nitrogen flooding to coolant circuit, nitrogen does not bind heat as well as water so it weakens cooling */ temperature_modifier=1.02; /* Nitrogen dissipates through steam ducts and chimney in about 4 minutes */ t_repair_counter=t_repair_counter+240+(rand()%40)-19; }
/* Typical Accidents (still bad) by IAEA */
if(accident>=1000000 && accident<2000000){ /* Spontaneus reduction of feedwater temperature */ temperature_modifier=0.99; /* Minor fluctuation that evens out in 25 to 34 seconds */ t_repair_counter=t_repair_counter+30+(rand()%10)-5; }
if(accident>=3000000 && accident<4000000){ /* Spontaneus turbulence in coolant pipes */ pressure_modifier=pressure_modifier+0.05; /* Minor fluctuation that evens out in 25 to 34 seconds */ p_repair_counter=p_repair_counter+30+(rand()%10)-5; }
if(accident>=5000000 && accident<7000000){ /* Excessive steam discharge from drum separators */ pressure_modifier=pressure_modifier-0.20; /* Minor fluctuation that evens out in 15 to 24 seconds */ p_repair_counter=p_repair_counter+20+(rand()%10)-5; }
if(accident>=7000000 && accident<8000000){ /* Temporary halt in feedwater flow */ pressure_modifier=pressure_modifier-0.22; /* Technicians can fix the feedwater systems in about 15 minutes */ p_repair_counter=p_repair_counter+900+(rand()%180)-89; }
if(accident>=9000000 && accident<10000000){ /* Small leak in coolant circuit */ pressure_modifier=pressure_modifier-0.10; gas_humidity_modifier=1; /* Technicians can fix the leaks in about 12 minutes */ p_repair_counter=p_repair_counter+720+(rand()%180)-89; }
if(accident>=11000000 && accident<12000000){ /* Pressure control malfunction */ p_pump1=p_pump1+((rand()-0.5)/4); p_pump2=p_pump2+((rand()-0.5)/4); }
if(accident>=13000000 && accident<14000000){ /* Spontaneous safety relief valve opening */ pressure_modifier=-1.0; /* This can be repaired by a group of technicians in about 6 to 9 minutes */ p_repair_counter=p_repair_counter+360+(rand()%180); }
if(accident>=15000000 && accident<16000000){ /* Loss of regenerator (this pre-cools and pre-heats feedwater before and after purification), yes this is bad, but at least takes under an hour to repair */ temperature_modifier=1.02; /* This can be repaired by a group of technicians in about 25 to 45 minutes */ t_repair_counter=t_repair_counter+1500+(rand()%1200); }
if(accident>=17000000 && accident<18000000){ /* Valve failure in steam pipes */ pressure_modifier=0.1; /* This can be repaired by a group of technicians in about 11 to 17 minutes */ p_repair_counter=p_repair_counter+660+(rand()%360); }
if(accident>=19000000 && accident<20000000){ /* Temporary failure of main coolant pump 1 */ pump1_modifier=1; /* This can be repaired by a group of technicians in about 15 to 40 minutes */ p_repair_counter=p_repair_counter+900+(rand()%1800);
54
}
if(accident>=21000000 && accident<22000000){ /* Temporary failure of main coolant pump 2 */ pump2_modifier=1; /* This can be repaired by a group of technicians in about 15 to 40 minutes */ p_repair_counter=p_repair_counter+900+(rand()%1800); }
if(accident>=23000000 && accident<24000000 && backup_pump==1){ /* Backup pump pressure control malfunction */ p_pump3=p_pump3+((rand()-0.5)/4); }
if(accident>=25000000 && accident<26000000 && emergency_valve==0){ /* Spontaneous emergency core cooling system activation */ emergency_valve=1; }
} /* End of accident generation */
/* Accident modifier processing */
/* Pump failures */ if(pump1_modifier==1){ p_pump1=0; q_pump1=0; } if(pump2_modifier==1){ p_pump2=0; q_pump2=0; }
/* Pressure anomalies */ p_pump1=p_pump1+pressure_modifier; p_pump2=p_pump2+pressure_modifier; p_pump3=p_pump3+pressure_modifier; if(p_pump1<0){ p_pump1=0; } if(p_pump2<0){ p_pump2=0; } if(p_pump3<0){ p_pump3=0; }
/* Temperature anomalies */ t_reactor_top=t_reactor_top*temperature_modifier;
/* Technicians repairing things */ if(t_repair_counter!=0){ t_repair_counter--; }else{ temperature_modifier=1.0; }
if(p_repair_counter!=0){ p_repair_counter--; }else{ pressure_modifier=0; gas_humidity_modifier=0; }
/* Coolant leaks cause protective gas humidity to rise */ if(gas_humidity_modifier==0){ /* The humidity drops over time */ gas_humidity--; }else{ gas_humidity=gas_humidity+gas_humidity_modifier; } /* Humidity normalization to 21% */ if(gas_humidity<21){ gas_humidity=21; } /* Humidity normalization to 100% */ if(gas_humidity>100){ gas_humidity=100; }
/* Some variables are set to "fucked up" when Chernobyl occurs. Naturally a strong hydrogen explosion wrecks stuff badly... */ if(chernobyl==1){ /* PPDDCS faults due to sensor damages */ ppddcs_disabled=1;

55
/* Automatic control rods become jammed to their positions, both mechanic-ally and electrically as PPDDCS is down */ override_a_rod1=1; override_a_rod2=1; /* Hydrogen explosion causes ruptures in all piping, preventing even the ECCS */ emergency_valve=0; /* Shockwave wrecks the ventilation fans and collapses ducts (but at least we get fresh air as the roof has been blasted off) */ ventilation_active=0; }
/* Physical calculations begin */
/* Control rod movements are processed here. According to IAEA, the first gen-eration rods took 21s to fully lower to the reactor core, and as the electronical simulation is planned to have one iteration every second, we have 21 for the rods. */ if(rod1==1 && rod1_position<21){ rod1_position++; }else if(rod1==0 && rod1_position>0){ rod1_position--; } if(rod2==1 && rod2_position<21){ rod2_position++; }else if(rod2==0 && rod2_position>0){ rod2_position--; } if(rod3==1 && rod3_position<21){ rod3_position++; }else if(rod3==0 && rod3_position>0){ rod3_position--; } if(rod4==1 && rod4_position<21){ rod4_position++; }else if(rod4==0 && rod4_position>0){ rod4_position--; } if(rod5==1 && rod5_position<21){ rod5_position++; }else if(rod5==0 && rod5_position>0){ rod5_position--; } if(rod6==1 && rod6_position<21){ rod6_position++; }else if(rod6==0 && rod6_position>0){ rod6_position--; } if(automatic_rod1==1 && a_rod1_position<12){ a_rod1_position++; }else if(automatic_rod1==0 && a_rod1_position>0){ a_rod1_position--; } if(automatic_rod2==1 && a_rod2_position<12){ a_rod2_position++; }else if(automatic_rod2==0 && a_rod2_position>0){ a_rod2_position--; }
/* Note that really the rods can be stopped to any position in between the up-per and lower limit, but I have not implemented that feature */
/* Now that the rod movements have been processed, we process their effects on the nuclear reaction */
/* This block calculates a rate of control rods in the reactor and thus the power rate at which the reactor is driven ranges from 1.2 to -0.4 */ /* Instead of exact fission energy calculations I simply use relative energy output values from 0% to 120% */ control_rod_rate=1.2; if(rod1_position>0 && rod1_position<=5){ t_reactor_bottom++; /* Actually this heats up the top parts, but as the calculations below use the bottom temperature for the new temperatures this is used */ a_rod_modifier=a_rod_modifier*1.03; /* The graphite tip of these rods displaces water, and thus weakens neutron absorbtation, raising radioactivity and temperature */ }else if(rod1_position>5){ control_rod_rate=control_rod_rate-0.2; } if(rod2_position>0 && rod2_position<=5){ t_reactor_bottom++; a_rod_modifier=a_rod_modifier*1.03; }else if(rod2_position>5){ control_rod_rate=control_rod_rate-0.2; } if(rod3_position>0 && rod3_position<=5){ t_reactor_bottom++;

56
a_rod_modifier=a_rod_modifier*1.03; }else if(rod3_position>5){ control_rod_rate=control_rod_rate-0.2; } if(rod4_position>0 && rod4_position<=5){ t_reactor_bottom++; a_rod_modifier=a_rod_modifier*1.03; }else if(rod4_position>5){ control_rod_rate=control_rod_rate-0.2; } if(rod5_position>0 && rod5_position<=5){ t_reactor_bottom++; a_rod_modifier=a_rod_modifier*1.03; }else if(rod5_position>5){ control_rod_rate=control_rod_rate-0.2; } if(rod6_position>0 && rod6_position<=5){ t_reactor_bottom++; a_rod_modifier=a_rod_modifier*1.03; }else if(rod6_position>5){ control_rod_rate=control_rod_rate-0.2; } if(a_rod1_position>0 && a_rod1_position<=7){ /* Even these automatic control rods have the damned graphite tip, and it actually is longer than on the standard rods */ t_reactor_bottom++; a_rod_modifier=a_rod_modifier*1.03; }else if(a_rod1_position>7){ control_rod_rate=control_rod_rate-0.2; } if(a_rod2_position>0 && a_rod2_position<=7){ t_reactor_bottom++; a_rod_modifier=a_rod_modifier*1.03; }else if(a_rod2_position>7){ control_rod_rate=control_rod_rate-0.2; }
if(control_rod_rate<0.2){ /* Reactor power will never go to negative values, instead it can go very low and keep residual heat and activity */ control_rod_rate=0.03; /* This value is based on Ignalina sourcebook, after 1h of inactivity, the reactor still has a thermal power of 3.35% */ }
/* Heat buildup is dependant of neutron absorbtation by control rods and pres-sure of cooling water, more pressure raises boiling point of water */ t_reactor_top=t_reactor_bottom+(14*control_rod_rate)+(2-((p_pump1+p_pump2+p_pump3)/2)); /* Drum separators etc are able to cool the steam+water about 14K before the cooled water is pumped back to the reactor */ t_reactor_bottom=t_reactor_top-14; /* Temperature at the middle parts is the arithmetic mean of top and bottom temperatures */ /* This is my own guess based on that the water heats evenly when it passes through the reactor */ t_reactor_middle=((t_reactor_top+t_reactor_bottom)/2); /* So the temperature is not calculated from fission energies directly, but is based on them through the relative power output. Let me explain: the reactor's nominal power is 3.2GW (RBMK-1000), this is 100% or control_rod_rate=1.0. According to British Nuclear Energy Society, the water is 543K when it enters the core and 557K when it leaves it, when the reactor is at 100% power. As the control_rod_rate is my variable for relative power, it is present here, and the calculations are balanced to produce these temperature values when at nominal power and nominal pressure (2MPa in both circuit halves). Thus we achieve calculation using indirect and relative values. Now the only things of question are whether these things are linear or not. I have reason to assume they are. */
/* Activity in reactor is based on neutron moderators and has a small random-ization */ a_reactor_top=103.1*a_rod_modifier*control_rod_rate/3+((rand()%10)-5); /* Ran-dom number between -5 and 4 */ a_reactor_middle=103.1*a_rod_modifier*control_rod_rate/3+((rand()%10)-5); a_reactor_bottom=103.1*a_rod_modifier*control_rod_rate/3+((rand()%10)-5); a_rod_modifier=1; /* Modifier is reset after calculations */ /* Nominal activity is about 103.098 exabeqcuerels. This is based on the 3.2GW thermal power which is 3.2GJ/s and thus 1.997*10^28eV/s Now as the fission energy of U-235 is 193.7MeV (not counting antineutrinos) the amount of fissions to happen in a second to get that energy per second leads to 1.03098*10^20Bq = 103.098EBq. This is then divided between 3 axial areas. This is in RBMK-1000. */
/* This has been balanced to produce 3200MW when in nominal activity, see above for numbers */ p_thermal=((a_reactor_top+a_reactor_middle+a_reactor_bottom)/3)*31.04;

57
/* This is the PPDDCS code that controls the automatic control rods */ if(ppddcs_disabled==0){ /* First we check if operators have disabled PPDDCS */ if(a_reactor_top>41 || a_reactor_middle>41 || a_reactor_bottom>41){ /* When over 120% power, try to lower both automatic rods */ if(ppddcs_delay==0){ /* Yes this has a small delay before anything happens, can't remember where I picked the 6 seconds tho... */ if(override_a_rod1!=1){ /* Of course the operators can override either of the automatic rods, forcing them to stay where they are now */ automatic_rod1=1; } if(override_a_rod2!=1){ automatic_rod2=1; } ppddcs_delay=6; }else{ ppddcs_delay--; } }else if(a_reactor_top>35 || a_reactor_middle>35 || a_reactor_bottom>35){ /* When over 100% power, try to lower one automatic rod */ if(ppddcs_delay==0){ if(override_a_rod1!=1){ automatic_rod1=1; } if(override_a_rod2!=1){ automatic_rod2=0; } ppddcs_delay=6; }else{ ppddcs_delay--; } }else if(a_reactor_top<2 || a_reactor_middle<2 || a_reactor_bottom<2){ /* When under 5% power, try to raise both automatic rods */ if(ppddcs_delay==0){ if(override_a_rod1!=1){ automatic_rod1=0; } if(override_a_rod2!=1){ automatic_rod2=0; } ppddcs_delay=6; }else{ ppddcs_delay--; } } } /* Of course, if the reactor is quickly overheating and radioactivity rises, even PPDDCS can't save the day, as the rods need some time to work */
/* IAEA estimates that the emergency accumulators last for 100s, and in elec-tronics we have one iteration of main loop per 1s */ if(emergency_valve==1 && v_emergency_tank!=0){ v_emergency_tank--; water_level++; /* The short term solution of emergency cooling is to pump water from accu-mulators to the reactor. They have only 212m^3 of water and are not able to do much, considering that the main circuit contains 1992.7m^3. This should be enough until powering up the long term emergency cooling features. So this thing is not very effective, it is not even meant to be. 10% addition of water does not really do much when the reactor is heating rapidly, especially as the main coolant itself is hot and is not removed when this is pumped in (unless ruptures in piping). */ t_reactor_top=t_reactor_top-0.7; t_reactor_middle=t_reactor_middle-0.7; t_reactor_bottom=t_reactor_bottom-0.7; }
/* Automatic ventilation stops if protective gas humidity rises too high, value from Ignalina sourcebook */ if(gas_humidity>70){ ventilation_active=0; /* Because leaked water contains hefty amounts of fission products and deu-terium/tritium it is not cool to vent it to the atmosphere with just the ordinary filtering. Instead little extra care and time are used to remedy the situation. But first the leak must be fixed and steam suctioned to somewhere else. Meanwhile the full ventilation is not activated. */ }
/* Hydrogen buildup calculations, based on British Nuclear Energy Society (and IAEA) estimations of 2Mg/h */ V_H2=V_H2+(6.191*(t_reactor_top/557)); /* If the temperature stays nominal, this produces 6.191m^3 of hydrogen (dens-ity 0.0899kg/m^3) */ if(ventilation_active==1){ /* As long as the ventilation keeps working the hydrogen will not be a prob-
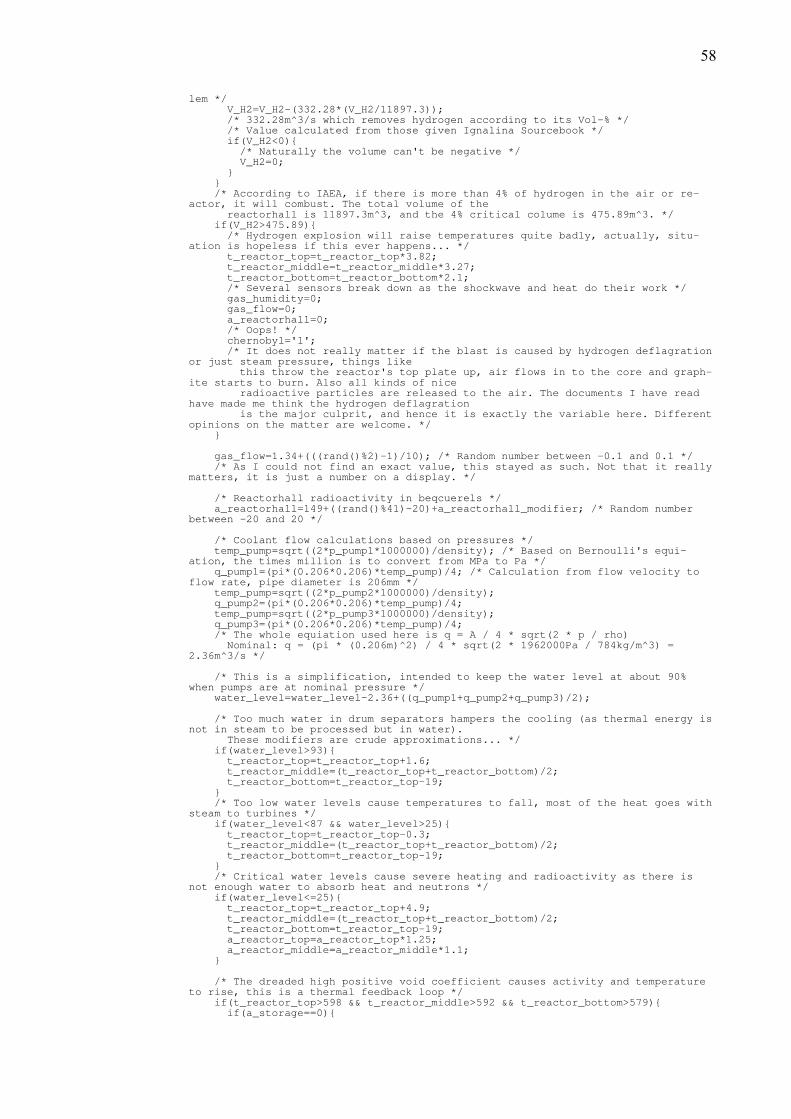
58
lem */ V_H2=V_H2-(332.28*(V_H2/11897.3)); /* 332.28m^3/s which removes hydrogen according to its Vol-% */ /* Value calculated from those given Ignalina Sourcebook */ if(V_H2<0){ /* Naturally the volume can't be negative */ V_H2=0; } } /* According to IAEA, if there is more than 4% of hydrogen in the air or re-actor, it will combust. The total volume of the reactorhall is 11897.3m^3, and the 4% critical colume is 475.89m^3. */ if(V_H2>475.89){ /* Hydrogen explosion will raise temperatures quite badly, actually, situ-ation is hopeless if this ever happens... */ t_reactor_top=t_reactor_top*3.82; t_reactor_middle=t_reactor_middle*3.27; t_reactor_bottom=t_reactor_bottom*2.1; /* Several sensors break down as the shockwave and heat do their work */ gas_humidity=0; gas_flow=0; a_reactorhall=0; /* Oops! */ chernobyl='1'; /* It does not really matter if the blast is caused by hydrogen deflagration or just steam pressure, things like this throw the reactor's top plate up, air flows in to the core and graph-ite starts to burn. Also all kinds of nice radioactive particles are released to the air. The documents I have read have made me think the hydrogen deflagration is the major culprit, and hence it is exactly the variable here. Different opinions on the matter are welcome. */ }
gas_flow=1.34+(((rand()%2)-1)/10); /* Random number between -0.1 and 0.1 */ /* As I could not find an exact value, this stayed as such. Not that it really matters, it is just a number on a display. */
/* Reactorhall radioactivity in beqcuerels */ a_reactorhall=149+((rand()%41)-20)+a_reactorhall_modifier; /* Random number between -20 and 20 */
/* Coolant flow calculations based on pressures */ temp_pump=sqrt((2*p_pump1*1000000)/density); /* Based on Bernoulli's equi-ation, the times million is to convert from MPa to Pa */ q_pump1=(pi*(0.206*0.206)*temp_pump)/4; /* Calculation from flow velocity to flow rate, pipe diameter is 206mm */ temp_pump=sqrt((2*p_pump2*1000000)/density); q_pump2=(pi*(0.206*0.206)*temp_pump)/4; temp_pump=sqrt((2*p_pump3*1000000)/density); q_pump3=(pi*(0.206*0.206)*temp_pump)/4; /* The whole equiation used here is q = A / 4 * sqrt(2 * p / rho) Nominal: q = (pi * (0.206m)^2) / 4 * sqrt(2 * 1962000Pa / 784kg/m^3) = 2.36m^3/s */
/* This is a simplification, intended to keep the water level at about 90% when pumps are at nominal pressure */ water_level=water_level-2.36+((q_pump1+q_pump2+q_pump3)/2);
/* Too much water in drum separators hampers the cooling (as thermal energy is not in steam to be processed but in water). These modifiers are crude approximations... */ if(water_level>93){ t_reactor_top=t_reactor_top+1.6; t_reactor_middle=(t_reactor_top+t_reactor_bottom)/2; t_reactor_bottom=t_reactor_top-19; } /* Too low water levels cause temperatures to fall, most of the heat goes with steam to turbines */ if(water_level<87 && water_level>25){ t_reactor_top=t_reactor_top-0.3; t_reactor_middle=(t_reactor_top+t_reactor_bottom)/2; t_reactor_bottom=t_reactor_top-19; } /* Critical water levels cause severe heating and radioactivity as there is not enough water to absorb heat and neutrons */ if(water_level<=25){ t_reactor_top=t_reactor_top+4.9; t_reactor_middle=(t_reactor_top+t_reactor_bottom)/2; t_reactor_bottom=t_reactor_top-19; a_reactor_top=a_reactor_top*1.25; a_reactor_middle=a_reactor_middle*1.1; }
/* The dreaded high positive void coefficient causes activity and temperature to rise, this is a thermal feedback loop */ if(t_reactor_top>598 && t_reactor_middle>592 && t_reactor_bottom>579){ if(a_storage==0){

59
a_storage=((a_reactor_top+a_reactor_middle+a_reactor_bottom)/3)/6; a_reactor_top=a_reactor_top*1.05; a_reactor_middle=a_reactor_middle*1.05; a_reactor_bottom=a_reactor_bottom*1.05; }else{ a_storage=a_storage*1.05; a_reactor_top=a_reactor_top+a_storage; a_reactor_middle=a_reactor_middle+a_storage; a_reactor_bottom=a_reactor_botton+a_storage; } /* As the heat causes the water to boil too quickly, the forming bubbles in the water do not absorb neutrons, so the reactivity rises */
t_reactor_top=t_reactor_top+8; t_reactor_middle=(t_reactor_top+t_reactor_bottom)/2; t_reactor_bottom=t_reactor_top-19; /* As do temperatures */ }else{ a_storage=0; /* Reset modifier */ }
/* Heat normalization, did someone actually think that this thing could freeze? */ if(t_reactor_top<413){ t_reactor_top=413; } if(t_reactor_middle<407){ t_reactor_middle=407; } if(t_reactor_bottom<393){ t_reactor_bottom=394; }
/* Physical calculations end, thus indicators are processed */
/* Note that these physical calculations have simplifications (this is only a bachelor's thesis), not every little detail is included and Rosatom certainly does not share all the details I would have liked. A good list of what has been left out is here:
-reactor poisoning due to fission products -long term emergency cooling systems -everything added/modified post-Chernobyl -neutron flux monitoring and control -operational reactivity margin calculations
Some of those are important in RBMK, but as I don't have the necesary data about them, I can't implement them. */
if(chernobyl=='1'){ sprintf(stuff,"CHERNOBYL!\nCHERNOBYL!\nCHERNOBYL!\nCHERNOBYL!");
LATBbits.LATB12=1; lcd_clear(); lcd_puts(stuff); LATBbits.LATB12=0;
LATBbits.LATB13=1; lcd_clear(); lcd_puts(stuff); LATBbits.LATB13=0;
LATBbits.LATB14=1; lcd_clear(); lcd_puts(stuff); LATBbits.LATB14=0;
LATBbits.LATB15=1; lcd_clear(); lcd_puts(stuff); LATBbits.LATB15=0;
}else{ LATBbits.LATB12=1; lcd_clear(); sprintf(stuff,"Temperatures\nTop: %4.0fK\nMiddle: %4.0fK\nBottom: %4.0fK",t_reactor_top,t_reactor_middle,t_reactor_bottom); lcd_puts(stuff); LATBbits.LATB12=0;
if(a_reactor_middle<6){ LATBbits.LATB13=1; lcd_clear(); sprintf(stuff,"Power: -----MW\nTop: -----EBq\nMiddle: -----EBq\nBottom: -----EBq"); /* These indicators do not work if activity is too low */ lcd_puts(stuff);

60
LATBbits.LATB13=0;
LATBbits.LATB14=1; lcd_clear(); sprintf(stuff,"G.flow: %1.2fm3/s\nG.humidity: ---%%\nReactorhall\nactiv-ity: ----Bq",gas_flow); /* This doesn't work if activity is too low */ lcd_puts(stuff); LATBbits.LATB14=0; }else{ LATBbits.LATB13=1; lcd_clear(); sprintf(stuff,"Power: %5dMW\nTop: %5.0fEBq\nMiddle: %5.0fEBq\nBottom: %5.0fEBq",p_thermal,a_reactor_top,a_reactor_middle,a_reactor_bottom); /* Exa = 10^18, with 5 digits this allows values from 1Ebq to 99ZBq */ lcd_puts(stuff); LATBbits.LATB13=0; LATBbits.LATB14=1; lcd_clear(); sprintf(stuff,"G.flow: %1.2fm3/s\nG.humidity: %3d%%\nReactorhall\nactiv-ity: %4dBq",gas_flow,gas_humidity,a_reactorhall); lcd_puts(stuff); LATBbits.LATB14=0; } LATBbits.LATB15=1; lcd_clear(); sprintf(stuff,"1.pump: %1.2lfm3/s\n2.pump: %1.2lfm3/s\nBackup: %1.2lfm3/s\nECCS: %3d%%",q_pump1,q_pump2,q_pump3,v_emergency_tank); lcd_puts(stuff); LATBbits.LATB15=0;
/* All kinds of warnings when certain limits have been passed */ if(gas_humidity>70){ LATFbits.LATF4=1; }else{ LATFbits.LATF4=0; }
if(gas_flow==0){ LATFbits.LATF5=1; }else{ LATFbits.LATF5=0; }
if(q_pump1==0){ LATFbits.LATF3=1; }else{ LATFbits.LATF3=0; }
if(q_pump2==0){ LATFbits.LATF2=1; }else{ LATFbits.LATF2=0; }
if(q_pump3==0 && backup_pump==1){ LATFbits.LATF8=1; }else{ LATFbits.LATF8=0; }
if(water_level>100){ LATFbits.LATF0=1; }else{ LATFbits.LATF0=0; }
if(water_level<40){ LATFbits.LATF1=1; }else{ LATFbits.LATF1=0; } /* Overpressure alarm limit as roughly 200% nominal pressure */ if(((p_pump1+p_pump2+p_pump3)/2)>=3.84){ LATGbits.LATG1=1; }else{ LATGbits.LATG1=0; } /* Approximation by calculations based on reactor temperatures */ if(((p_pump1+p_pump2+p_pump3)/2)<=0.7){ LATGbits.LATG0=1; }else{ LATGbits.LATG0=0; }

61
if(automatic_rod1==1 || automatic_rod2==1){ LATFbits.LATF6=1; }else{ LATFbits.LATF6=0; }
if(ventilation_active==1){ LATFbits.LATF7=1; }else{ LATFbits.LATF7=0; }
} DelayMs(1000); /* Once in a second, not 100% exact as I have not counted operations and time used on executing all the above */ }
return 0;}