raytheon Q3 Earnings Release
15
Media Relations News release FOR IMMEDIATE RELEASE Media Contact: Investor Relations Contact: Mac Jeffery Greg Smith 781-522-5111 781-522-5141 Raytheon Reports Strong Third Quarter 2006 Results and Increases 2006 Full-year Guidance Highlights • Earnings per share (EPS) from continuing operations of $0.72, up 41 percent • Strong operating cash flow; net debt at $2.8 billion, lowest in over 11 years • Strong bookings of $6.1 billion; sales of $5.7 billion, up 7 percent • 2006 full-year guidance increased for EPS, bookings, operating cash flow, and return on invested capital (ROIC) WALTHAM, Mass., (October 26, 2006) – Raytheon Company (NYSE: RTN) reported third quarter 2006 income from continuing operations of $323 million or $0.72 per diluted share compared to $231 million or $0.51 per diluted share in the third quarter 2005. Third quarter 2006 net income was $321 million or $0.71 per diluted share compared to $228 million or $0.50 per diluted share in the third quarter 2005. Third quarter 2006 net income was higher primarily due to improved operating results at Integrated Defense Systems (IDS) and Raytheon Aircraft Company (RAC), combined with a reduction in pension expense. “Raytheon had another very strong quarter,” said William H. Swanson, Raytheon's Chairman and CEO. “Our operating results demonstrate the Company’s continued focus on execution, and as a result, the Company is able to increase its full-year EPS, bookings, cash flow, and ROIC guidance.” Net sales for the third quarter 2006 were $5.7 billion, up 7 percent from $5.3 billion in the third quarter 2005. Government and Defense sales for the quarter (after the elimination of 1
-
Upload
finance12 -
Category
Economy & Finance
-
view
503 -
download
1
description
Transcript of raytheon Q3 Earnings Release

Media Relations
News release FOR IMMEDIATE RELEASE Media Contact: Investor Relations Contact: Mac Jeffery Greg Smith 781-522-5111 781-522-5141 Raytheon Reports Strong Third Quarter 2006 Results and Increases 2006 Full-year Guidance
Highlights
• Earnings per share (EPS) from continuing operations of $0.72, up 41 percent • Strong operating cash flow; net debt at $2.8 billion, lowest in over 11 years • Strong bookings of $6.1 billion; sales of $5.7 billion, up 7 percent • 2006 full-year guidance increased for EPS, bookings, operating cash flow,
and return on invested capital (ROIC) WALTHAM, Mass., (October 26, 2006) – Raytheon Company (NYSE: RTN) reported third
quarter 2006 income from continuing operations of $323 million or $0.72 per diluted share
compared to $231 million or $0.51 per diluted share in the third quarter 2005. Third
quarter 2006 net income was $321 million or $0.71 per diluted share compared to $228
million or $0.50 per diluted share in the third quarter 2005. Third quarter 2006 net income
was higher primarily due to improved operating results at Integrated Defense Systems
(IDS) and Raytheon Aircraft Company (RAC), combined with a reduction in pension
expense.
“Raytheon had another very strong quarter,” said William H. Swanson, Raytheon's
Chairman and CEO. “Our operating results demonstrate the Company’s continued focus
on execution, and as a result, the Company is able to increase its full-year EPS, bookings,
cash flow, and ROIC guidance.”
Net sales for the third quarter 2006 were $5.7 billion, up 7 percent from $5.3 billion in the
third quarter 2005. Government and Defense sales for the quarter (after the elimination of
1
intercompany sales) increased 5 percent to $4.7 billion from $4.5 billion in the third quarter
2005. RAC sales for the quarter increased 18 percent to $758 million from $642 million in
the third quarter 2005.
Operating cash flow from continuing operations for the third quarter 2006 was $750 million
versus $798 million for the third quarter 2005. Year-to-date operating cash flow from
continuing operations was $1,194 million versus $1,344 million for the comparable period
in 2005. The decrease in both the third quarter and year-to-date 2006 versus the
comparable periods in 2005 is primarily due to higher cash tax payments in 2006.
During the third quarter 2006, the Company repurchased 5.5 million shares of common
stock for $250 million as part of the Company’s previously announced share repurchase
programs. The Company has repurchased 7.9 million shares of common stock year-to-
date for $352 million.
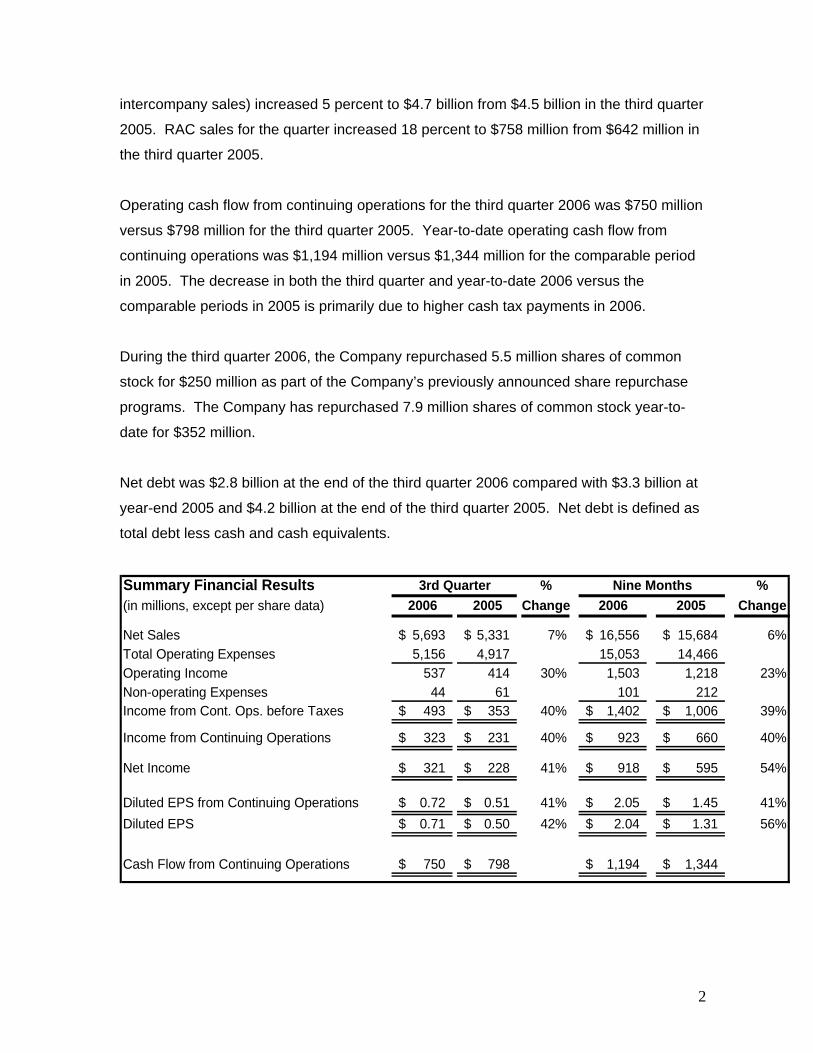
Net debt was $2.8 billion at the end of the third quarter 2006 compared with $3.3 billion at
year-end 2005 and $4.2 billion at the end of the third quarter 2005. Net debt is defined as
total debt less cash and cash equivalents.
Summary Financial Results % %(in millions, except per share data) 2006 2005 Change 2006 2005 Change
Net Sales 5,693$ 5,331$ 7% 16,556$ 15,684$ 6%Total Operating Expenses 5,156 4,917 15,053 14,466 Operating Income 537 414 30% 1,503 1,218 23%Non-operating Expenses 44 61 101 212 Income from Cont. Ops. before Taxes 493$ 353$ 40% 1,402$ 1,006$ 39%
Income from Continuing Operations 323$ 231$ 40% 923$ 660$ 40%
Net Income 321$ 228$ 41% 918$ 595$ 54%
Diluted EPS from Continuing Operations 0.72$ 0.51$ 41% 2.05$ 1.45$ 41%Diluted EPS 0.71$ 0.50$ 42% 2.04$ 1.31$ 56%
Cash Flow from Continuing Operations 750$ 798$ 1,194$ 1,344$
3rd Quarter Nine Months
2

Bookings and Backlog
Bookings(in millions) 2006 2005 2006 2005
BookingsGovernment and Defense 5,237$ 3,422$ 14,655$ 15,317$ Commercial 883 737 2,386 2,187
Total Bookings 6,120$ 4,159$ 17,041$ 17,504$
Backlog(in millions) 09/24/06 12/31/05
Backlog 34,587$ 34,419$ Funded Backlog 18,860$ 17,580$
3rd Quarter Nine Months
Period ending
The Government and Defense businesses reported third quarter 2006 bookings of $5.2
billion compared to $3.4 billion in the third quarter 2005, an increase driven by several
programs in Missile Systems (MS) and Network Centric Systems (NCS). RAC reported
third quarter 2006 bookings of $717 million compared to $572 million in the third quarter
2005.
The Government and Defense businesses ended the third quarter 2006 with a backlog of
$31.7 billion compared to $31.2 billion at the end of 2005. The Company ended the
quarter with a backlog of $34.6 billion compared to $34.4 billion at the end of 2005.
Outlook
2006 Financial Outlook Current Prior *
Bookings ($B) 23.0 - 24.0 22.0 - 23.0Net Sales ($B) 23.1 - 23.6 23.1 - 23.6FAS/CAS Pension Expense ($M) 378 378Interest Expense, net ($M) 200 - 210 220 - 230Diluted Shares 449 - 451 449 - 451EPS from Cont. Ops. ($) 2.70 - 2.80 2.60 - 2.70
Net Debt ($B) 2.0 - 2.2 2.3 - 2.5Operating Cash Flow ($B) 2.3 - 2.5 2.0 - 2.2ROIC (%) 8.4 - 8.8 8.2 - 8.6
* As of July 27, 2006
3

The Company has increased full-year 2006 guidance for earnings per share from
continuing operations, bookings, operating cash flow, and return on invested capital
(ROIC). In addition, the Company’s full-year 2006 guidance reflects a reduction in both net
interest expense and net debt.
2007 Financial OutlookBookings ($B) 24.5 - 25.5
Net Sales ($B) Government and Defense 22.2 - 22.7 Eliminations of Intercompany Sales (1.7) Government and Defense after Elims 20.5 - 21.0
Raytheon Aircraft 3.3 Other 0.8
Total Company 24.6 - 25.1
EPS from Cont. Ops. ($) 2.95 - 3.05
Operating Cash Flow ($B) 1.7 - 1.9
ROIC (%) 9.0 - 9.4
Charts containing additional information on the Company’s 2006 and 2007 guidance are
available on the Company's website at www.raytheon.com. See attachment F for the
Company's calculation and use of ROIC, a non-GAAP financial measure.
Segment Results
Integrated Defense Systems
% %(in millions, except margin percent) 2006 2005 Change 2006 2005 Change
Net Sales 1,030$ 919$ 12% 3,031$ 2,765$ 10%Operating Income 167$ 134$ 25% 502$ 394$ 27%Operating Margin 16.2% 14.6% 16.6% 14.2%
3rd Quarter Nine Months
Integrated Defense Systems (IDS) had third quarter 2006 net sales of $1,030 million, up
12 percent compared to $919 million in the third quarter 2005, primarily due to growth in
DDG 1000 and international programs. IDS recorded $167 million of operating income
compared to $134 million in the third quarter 2005. The increase in operating income was
4

primarily due to higher volume and program performance improvements on domestic and
international programs.
During the quarter, IDS booked $92 million to provide torpedoes, spares and support for
the U.S. Navy.
Intelligence and Information Systems
% %(in millions, except margin percent) 2006 2005 Change 2006 2005 Change
Net Sales 626$ 649$ -4% 1,870$ 1,821$ 3%Operating Income 58$ 57$ 2% 171$ 166$ 3%Operating Margin 9.3% 8.8% 9.1% 9.1%
3rd Quarter Nine Months
Intelligence and Information Systems (IIS) had third quarter 2006 net sales of $626 million
compared to $649 million in the third quarter 2005, a decrease primarily due to the timing
of funding on certain classified programs. IIS recorded $58 million of operating income
compared to $57 million in the third quarter 2005.
During the quarter, IIS booked $294 million on a number of classified contracts, including
$111 million on a major classified contract.
Missile Systems
% %(in millions, except margin percent) 2006 2005 Change 2006 2005 Change
Net Sales 1,081$ 1,005$ 8% 3,187$ 3,002$ 6%Operating Income 109$ 104$ 5% 341$ 313$ 9%Operating Margin 10.1% 10.3% 10.7% 10.4%
3rd Quarter Nine Months
Missile Systems (MS) had third quarter 2006 net sales of $1,081 million, up 8 percent
compared to $1,005 million in the third quarter 2005, primarily due to a ramp up on
Standard Missile and several development programs. MS recorded $109 million of
operating income compared to $104 million in the third quarter 2005.
5

During the quarter, MS booked $369 million for the production of Phalanx Weapons
Systems for the U.S. Navy. MS also booked $311 million for additional development work
on the Exoatmospheric Kill Vehicle (EKV) program, $267 million for the production of
Standard Missile-3 (SM-3) for the Missile Defense Agency, and $163 million for the
production of Tube-launched Optically guided Wire controlled (TOW) missiles for the U.S.
Army.
Network Centric Systems
% %(in millions, except margin percent) 2006 2005 Change 2006 2005 Change
Net Sales 879$ 833$ 6% 2,550$ 2,399$ 6%Operating Income 87$ 87$ NM 262$ 244$ 7%Operating Margin 9.9% 10.4% 10.3% 10.2%
3rd Quarter Nine Months
Network Centric Systems (NCS) had third quarter 2006 net sales of $879 million, up 6
percent compared to $833 million in the third quarter 2005, primarily due to growth in the
Combat Systems business. NCS recorded operating income of $87 million in the third
quarter 2006 and in the third quarter 2005.
During the quarter, NCS booked $285 million for the production of Improved Target
Acquisition System (ITAS) for the U.S. Army and the U.S. Marine Corps. NCS also
booked $97 million to provide Horizontal Technology Integration (HTI) forward-looking
infrared kits to the U.S. Army.
Space and Airborne Systems
% %(in millions, except margin percent) 2006 2005 Change 2006 2005 Change
Net Sales 1,069$ 1,013$ 6% 3,144$ 3,030$ 4%Operating Income 148$ 143$ 3% 445$ 444$ NMOperating Margin 13.8% 14.1% 14.2% 14.7%
3rd Quarter Nine Months
Space and Airborne Systems (SAS) had third quarter 2006 net sales of $1,069 million, up
6 percent compared to $1,013 million in the third quarter 2005, primarily due to growth in
6

the Advanced Targeting Forward Looking Infrared (ATFLIR) and Airborne Radar
Production programs. SAS recorded $148 million of operating income compared to $143
million in the third quarter 2005.
During the quarter, SAS booked $96 million to supply the Hellenic Air Force with
dvanced Self-Protection Integrated Suite (ASPIS) equipment for its F-16 aircraft fleet. A
SAS also booked $192 million on a number of classified contracts.
Technical Services
% %(in millions, except margin percent) 2006 2005 Change 2006 2005 Change
Net Sales 509$ 479$ 6% 1,445$ 1,455$ -1%Operating Income 36$ 38$ -5% 100$ 107$ -7%Operating Margin 7.1% 7.9% 6.9% 7.4%
3rd Quarter Nine Months
Technical Services (TS) had third quarter 2006 net sales of $509 million, up 6 percent
ompared to $479 million in the third quarter 2005, primarily due to growth in the Logistics
rd
ystems business contracts.
c
and Training Systems business. TS recorded operating income of $36 million in the thi
quarter of 2006 compared to $38 million in the third quarter 2005. Operating income was
lower primarily due to favorable program profit adjustments recorded in the prior year.
During the quarter, TS booked $145 million on a number of Logistics and Training
S
Aircraft
% %(in millions, except margin percent) 2006 2005 Change 2006 2005 Change
Net Sales 758$ 642$ 18% 1,996$ 1,771$ 13%Operating Income 70$ 34$ 106% 127$ 69$ 84%Operating Margin 9.2% 5.3% 6.4% 3.9%
3rd Quarter Nine Months
7

Raytheon Aircraft Company (RAC) had third quarter 2006 net sales of $758 million, up 18
nt
fter the quarter, RAC received an order from NetJets® Inc. for the purchase of 48
t are
ther
percent compared to $642 million in the third quarter 2005, primarily due to increased new
aircraft deliveries. RAC recorded operating income of $70 million compared to $34 million
in the third quarter 2005. Operating income was higher due to continued improved
operating performance, favorable aircraft volume and mix, and a favorable adjustme
related to warranty expense.
A
additional Hawker® aircraft, 30 Hawker 750s and 18 Hawker 900XPs. These aircraf
expected to be delivered in the 2007 – 2009 timeframe and have a value totaling more
than $500 million.
O
et sales for the Other segment in the third quarter 2006 were $190 million compared to
aytheon Company (NYSE: RTN), with 2005 sales of $21.9 billion, is an industry leader in
isclosure Regarding Forward-looking Statements
N
$185 million in the third quarter 2005. The segment recorded an operating loss of $11
million in the third quarter 2006 compared to an operating loss of $25 million in the third
quarter 2005.
R
defense and government electronics, space, information technology, technical services,
and business and special mission aircraft. With headquarters in Waltham, Mass.,
Raytheon employs 80,000 people worldwide.
D
rward-looking statements, including This release and the attachments contain foinformation regarding the Company’s 2006 and 2007 financial outlook, future plans, objectives, business prospects and anticipated financial performance. These forward-looking statements are not statements of historical facts and represent only the Company’s current expectations regarding such matters. These statements inherently involve a wide range of known and unknown risks and uncertainties. The Company’s actual actions and results could differ materially from what is expressed or implied by these statements. Specific factors that could cause such a difference include, but are not limited to: risks associated with the Company’s U.S. government sales, including changes or shifts in defense spending, uncertain funding of programs, potential termination of contracts, and difficulties in contract performance; the ability to procure new contracts; the risks of conducting business in foreign countries; the ability to comply with extensive governmental regulation, including import and export policies and procurement, aircraft manufacturing and other regulations; the impact of competition; the ability to develop
8

products and technologies; the risk of cost overruns, particularly for the Company’s fixed-price contracts; dependence on component availability, subcontractor performance and key suppliers; risks of a negative government audit; the use of accounting estimates in the Company’s financial statements; the potential impairment of the Company’s goodwill; risks associated with the general aviation, commuter and fractional ownership aircraft markets; accidents involving the Company’s aircraft; the outcome of contingencies and litigation matters, including government investigations; the ability to recruit and retain qualified personnel; risks associated with acquisitions, joint ventures and other business arrangements; the impact of changes in the Company’s credit ratings; risks associated with exploring strategic alternatives for RAC, including the uncertainty of whether a transaction will be consummated and the potential disruption to RAC’s business during such transaction; and other factors as may be detailed from time to time in the Company’s public announcements and Securities and Exchange Commission filings. In addition, these statements do not give effect to the potential impact of any acquisitions, divestitures or business combinations, including any potential RAC transaction, that may be announced or closed after the date hereof. The Company undertakes no obligation to make any revisions to the forward-looking statements contained in this release and the attachments or to update them to reflect events or circumstances occurring after the date of this release.
Conference Call on the Third Quarter 2006 Financial Results
ctober 26, 2006 at 9 a.m.
he dial-in number for the conference call will be (866) 800 - 8651. The conference call
Raytheon’s financial results conference call will be Thursday, O
ET. Participants will include William H. Swanson, Chairman and CEO, David C. Wajsgras,
senior vice president and CFO, and other Company executives.
T
will also be audiocast on the Internet at www.raytheon.com. Individuals may listen to the
call and download charts that will be used during the call. These charts will be available
for printing prior to the call.
terested parties are urged to check the website ahead of time to ensure their computers
# # #
In
are configured for the audio stream. Instructions for obtaining the free required
downloadable software are posted on the site.
9

Attachment A
Raytheon CompanyPreliminary Statement of Operations InformationThird Quarter 2006
(In millions except per share amounts) Three Months Ended Nine Months Ended24-Sep-06 25-Sep-05 24-Sep-06 25-Sep-05
Net sales 5,693$ 5,331$ 16,556$ 15,684$
Cost of sales 4,656 4,445 13,529 13,053 Administrative and selling expenses 373 348 1,124 1,053 Research and development expenses 127 124 400 360
Total operating expenses 5,156 4,917 15,053 14,466
Operating income 537 414 1,503 1,218
Interest expense 64 79 201 237 Interest income (17) (14) (58) (38) Other (income) expense, net (3) (4) (42) 13
Non-operating expense, net 44 61 101 212
Income from continuing operations before taxes 493 353 1,402 1,006
Federal and foreign income taxes 170 122 479 346
Income from continuing operations 323 231 923 660
Loss from discontinued operations, net of tax (2) (3) (5) (65)
Net income 321$ 228$ 918$ 595$
Earnings per share from continuing operationsBasic 0.73$ 0.52$ 2.09$ 1.47$ Diluted 0.72$ 0.51$ 2.05$ 1.45$
Loss per share from discontinued operationsBasic -$ (0.01)$ (0.01)$ (0.14)$ Diluted -$ (0.01)$ (0.01)$ (0.14)$
Earnings per shareBasic 0.73$ 0.51$ 2.08$ 1.33$ Diluted 0.71$ 0.50$ 2.04$ 1.31$
Average shares outstandingBasic 441.9 445.6 442.3 448.4Diluted 451.6 452.1 450.5 454.4

Attachment B
Raytheon CompanyPreliminary Segment InformationThird Quarter 2006
(In millions)
Operating IncomeNet Sales Operating Income As a Percent of Sales
Three Months Ended Three Months Ended Three Months Ended24-Sep-06 25-Sep-05 24-Sep-06 25-Sep-05 24-Sep-06 25-Sep-05
Integrated Defense Systems 1,030$ 919$ 167$ 134$ 16.2% 14.6%Intelligence and Information Systems 626 649 58 57 9.3% 8.8%Missile Systems 1,081 1,005 109 104 10.1% 10.3%Network Centric Systems 879 833 87 87 9.9% 10.4%Space and Airborne Systems 1,069 1,013 148 143 13.8% 14.1%Technical Services 509 479 36 38 7.1% 7.9%Aircraft 758 642 70 34 9.2% 5.3%Other 190 185 (11) (25) -5.8% -13.5%FAS/CAS Pension Adjustment - - (93) (117) Corporate and Eliminations (449) (394) (34) (41)
Total 5,693$ 5,331$ 537$ 414$ 9.4% 7.8%
Operating IncomeNet Sales Operating Income As a Percent of Sales
Nine Months Ended Nine Months Ended Nine Months Ended24-Sep-06 25-Sep-05 24-Sep-06 25-Sep-05 24-Sep-06 25-Sep-05
Integrated Defense Systems 3,031$ 2,765$ 502$ 394$ 16.6% 14.2%Intelligence and Information Systems 1,870 1,821 171 166 9.1% 9.1%Missile Systems 3,187 3,002 341 313 10.7% 10.4%Network Centric Systems 2,550 2,399 262 244 10.3% 10.2%Space and Airborne Systems 3,144 3,030 445 444 14.2% 14.7%Technical Services 1,445 1,455 100 107 6.9% 7.4%Aircraft 1,996 1,771 127 69 6.4% 3.9%Other 582 566 (34) (66) -5.8% -11.7%FAS/CAS Pension Adjustment - - (283) (349) Corporate and Eliminations (1,249) (1,125) (128) (104)
Total 16,556$ 15,684$ 1,503$ 1,218$ 9.1% 7.8%

Attachment C
Raytheon CompanyOther Preliminary InformationThird Quarter 2006
FundedBacklog Backlog
(In millions) (In millions)24-Sep-06 31-Dec-05 24-Sep-06 31-Dec-05
Integrated Defense Systems 7,411$ 8,010$ 3,277$ 3,009$ Intelligence and Information Systems 4,009 4,077 748 642 Missile Systems 8,913 8,040 4,805 4,443 Network Centric Systems 4,532 4,307 3,374 2,839 Space and Airborne Systems 5,257 5,220 2,724 2,851 Technical Services 1,546 1,594 1,013 916 Aircraft 2,656 2,891 2,656 2,600 Other 263 280 263 280
34,587$ 34,419$ 18,860$ 17,580$
Government and Defense businesses 31,668$ 31,248$ 15,941$ 14,700$
Bookings(In millions)
Three Months Ended24-Sep-06 25-Sep-05
Government and Defense businesses 5,237$ 3,422$ Commercial businesses 883 737
6,120$ 4,159$
24-Sep-06 25-Sep-05
Hawker 800XP 18 13 Premier 9 2 Hawker 400XP 12 14 King Air 36 27 Pistons 20 8 T-6A 18 16
Total 113 80
Three Months EndedNew Aircraft Deliveries (Units)

Attachment D
Raytheon CompanyPreliminary Balance Sheet InformationThird Quarter 2006
(In millions)
Balance sheets24-Sep-06 31-Dec-05
AssetsCash and cash equivalents 1,162$ 1,202$ Accounts receivable, less allowance for doubtful accounts 367 425 Contracts in process 3,799 3,469 Inventories 2,139 1,722 Deferred federal and foreign income taxes 341 435 Prepaid expenses and other current assets 273 314
Total current assets 8,081 7,567
Property, plant and equipment, net 2,588 2,675 Goodwill 11,617 11,554 Other assets, net 2,501 2,585
Total assets 24,787$ 24,381$
Liabilities and Stockholders' EquityNotes payable and current portion of long-term debt 582$ 79$ Subordinated notes payable - 408 Advance payments and billings in excess of costs incurred 1,965 2,012 Accounts payable 1,084 962 Accrued salaries and wages 971 987 Other accrued expenses 1,285 1,403 Liabilities from discontinued operations 50 49
Total current liabilities 5,937 5,900
Accrued retiree benefits and other long-term liabilities 3,695 3,559 Deferred federal and foreign income taxes 209 125 Long-term debt 3,401 3,969 Minority interest 165 119 Stockholders' equity 11,380 10,709
Total liabilities and stockholders' equity 24,787$ 24,381$

Attachment E
Raytheon CompanyPreliminary Cash Flow InformationThird Quarter 2006
(In millions)
Cash flow information Three Months Ended Nine Months Ended
24-Sep-06 25-Sep-05 24-Sep-06 25-Sep-05
Net income 321$ 228$ 918$ 595$ Depreciation 90 86 271 262 Amortization 23 23 70 65 Working capital 37 245 (621) (106) Discontinued operations 2 (4) (2) (56) Net activity in financing receivables 35 (12) 141 79 Other 244 228 415 449
Net operating cash flow 752 794 1,192 1,288
Capital spending (68) (71) (173) (183) Internal use software spending (25) (25) (51) (61) Acquisitions (40) (39) (87) (99) Investment activity and divestitures - - 50 7 Dividends (108) (99) (313) (289) Repurchase of common stock (250) (198) (352) (390) Debt repayments (74) (31) (445) (93) Other 50 35 139 84
Total cash flow 237$ 366$ (40)$ 264$

Attachment F
Raytheon CompanyNon-GAAP Financial MeasuresThird Quarter 2006
Return on Invested Capital (ROIC) is a "non-GAAP" financial measure under SEC regulations. The Company defines ROIC as income from continuing operations plus after-tax net interest expense plus one-third of operating lease expense after-tax (estimate of interest portion of the operating lease expense), divided by average invested capital after capitalizing operating leases (operating lease expense times a multiplier of 8) andadding financial guarantees. ROIC is not a measure of financial performance under generally accepted accounting principles (GAAP) and may not be defined and calculated by other companies in the same manner. ROIC should be considered supplemental to and not a substitute for financial information prepared in accordance with GAAP. The Company uses ROIC to make the most efficient and effective use of capital and as an element of management incentive compensation.
Return on Invested Capital
(In millions)Low end of range High end of range
Income from Continuing OperationsNet Interest Expense, after-tax* Combined CombinedLease Expense, after-tax*Return 1,415$ 1,460$ Net Debt **Equity** Combined CombinedLease Expense x 8 plus Financial Guarantees**Invested Capital 16,775$ 16,575$ ROIC 8.4% 8.8%
Low end of range High end of rangeIncome from Continuing OperationsNet Interest Expense, after-tax* Combined CombinedLease Expense, after-tax*Return 1,510$ 1,555$ Net Debt **Equity** Combined CombinedLease Expense x 8 plus Financial Guarantees**Invested Capital 16,700$ 16,500$ ROIC 9.0% 9.4%
* effective tax rate of 33.9% (2006 Guidance) and 34.0% (2007 Guidance)** two-point average
Current 2006 Guidance
2007 Guidance