Raymond James 37th Annual Institutional Investors Conference

March 5, 2019
Waste Management, Inc.
RAYMOND JAMES & ASSOCIATES 40TH ANNUAL INSTITUTIONAL INVESTORS CONFERENCE

2
Certain statements provided in this presentation are “forward-looking statements” within the
meaning of Section 27A of the Securities Act of 1933 and Section 21E of the Securities Exchange Act of 1934. Forward-
looking statements are often identified by the words, “will,” “may,” “should,” “continue,” “anticipate,” “believe,” “expect,” “plan,”
“forecast,” “project,” “estimate,” “intend” and words of similar nature, and such statements generally contain projections about
accounting and finances; strategy, plans and objectives for the future and outcomes from such strategic plans and
objectives; projections, estimates, or assumptions relating to our performance; results of investments in new technologies;
implementation of innovation and efficiency projects; predictions or assumptions about future trends or conditions in our
industry; or our opinions, views or beliefs about the effects of current or future events, circumstances or performance. You
should view these statements with caution. These statements are not guarantees of future performance, circumstances or
events. They are based on the facts and circumstances known to us as of the date the statements are made. All phases of
our business are subject to uncertainties, risks and other influences, many of which we do not control. Any of these factors,
either alone or taken together, could have a material adverse effect on us and could cause actual results to be materially
different from those set forth in such forward-looking statement. We assume no obligation to update any forward-looking
statement, including financial estimates, whether as a result of future events, circumstances or developments or otherwise.
Some of these risks and uncertainties are described in greater detail in Waste Management’s Form 10-K for the year ended
December 31, 2018, as filed with the Securities and Exchange Commission.
Cautionary Statement
3
This presentation contains non-GAAP financial measures under Regulation G of the Securities Exchange Act of 1934, as
amended. The Company believes that these non-GAAP financial measures are useful to investors to assess the Company’s
performance, results of operations and cash available for the Company’s capital allocation program. These non-GAAP
measures are meant to supplement, not replace, comparable GAAP measures, and such non-GAAP measures may be
different from similarly titled measures used by other companies. A reconciliation of these non-GAAP financial measures to
their most directly comparable financial measures calculated and presented in accordance with generally accepted
accounting principles can be found in the Appendix at the end of this presentation and under the Investor Relations tab on
our website: www.wm.com.
Non-GAAP Financial Measures

4
Waste Management Investment Thesis
• Largest and most diverse
asset and customer base
• Unmatched return on
invested capital
• Experienced and
committed management
team and employees
INDUSTRYLEADERSHIP
• A customer-centric culture
• Pricing discipline
• Volume growth in our
highest return businesses
• Continuous improvement
to reduce costs and
expand margins
• Earnings and free cash
flow growth
STRATEGICFOCUS TO DRIVE
• Recession-resilient
revenues
• Strong and consistent
free cash flow to fund
balanced return of cash
to shareholders
• Strong balance
sheet that provides
strategic flexibility
FINANCIALAND BUSINESSPROFILE PROVIDES
5
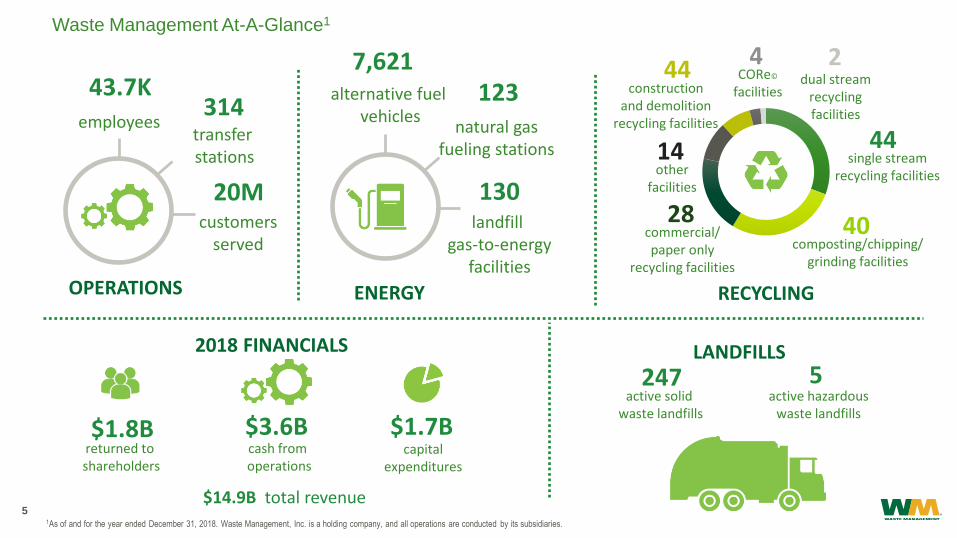
Waste Management At-A-Glance1
1As of and for the year ended December 31, 2018. Waste Management, Inc. is a holding company, and all operations are conducted by its subsidiaries.
7,621
$3.6B
alternative fuelvehicles
123natural gas
fueling stations
130landfill
gas-to-energyfacilities
ENERGY
customersserved
OPERATIONS
transfer stations
43.7Kemployees
RECYCLING
$1.8Breturned to shareholders
2018 FINANCIALS
$1.7Bcash from operations
capitalexpenditures
$14.9B total revenue
5247active solid
waste landfillsactive hazardous
waste landfills
LANDFILLS
44single stream
recycling facilities
40composting/chipping/
grinding facilities
28commercial/paper only
recycling facilities
14other
facilities
444
CORe©
facilities
2dual stream
recycling facilities
constructionand demolition
recycling facilities
20M
314

6
Geographic & Operational Diversification
• Largest and most diverse
asset and customer base
• Unmatched return on
invested capital
• Experienced and
committed management
team and employees
• A customer-centric culture
• Pricing discipline
• Volume growth in our
highest return businesses
• Continuous improvement
to reduce costs and
expand margins
• Earnings and free cash
flow growth
• Recession-resilient
revenues
• Strong and consistent
free cash flow to fund
balanced return of cash
to shareholders
• Strong balance
sheet that provides
strategic flexibility

7
Broad and Diverse Customer Base
Serve over 20 million
customers across the U.S.
and Canada
Waste Management’s largest
customer accounts for about
1% of revenue
Long-standing customer
relationships with significant
contracted business
54%
20%
10%
7%
9%
2018 REVENUE MIX
Collection
Landfill
Transfer
Recycling
Other
41%
26%
29%
4%
2018 COLLECTION REVENUE MIX
Commercial
Residential
Industrial
Other

8
Asset and Customer Base Produce Strong Earnings and Cash Flow
Serve over 20 million
customers across the US
and Canada
Waste Management’s largest
customer accounts for less
than 2% of revenue
Long-standing customer
relationships with significant
contracted business
-
2,000
4,000
6,000
8,000
10,000
12,000
14,000
16,000
2018 REVENUE($=millions)
WM RSG WCN
-
500
1,000
1,500
2,000
2,500
3,000
2018 ADJUSTED INCOME FROM OPS1
($=millions)
WM RSG WCN
-
500
1,000
1,500
2,000
2,500
3,000
3,500
4,000
2018 NET CASH PROVIDED BY OPERATING ACTIVITIES
($=millions)
WM RSG WCN
1 In the case of WM, see the appendix at the end of this presentation for the reconciliation of this non-GAAP financial measure to the most comparable GAAP measure.
Source: Company filings
9
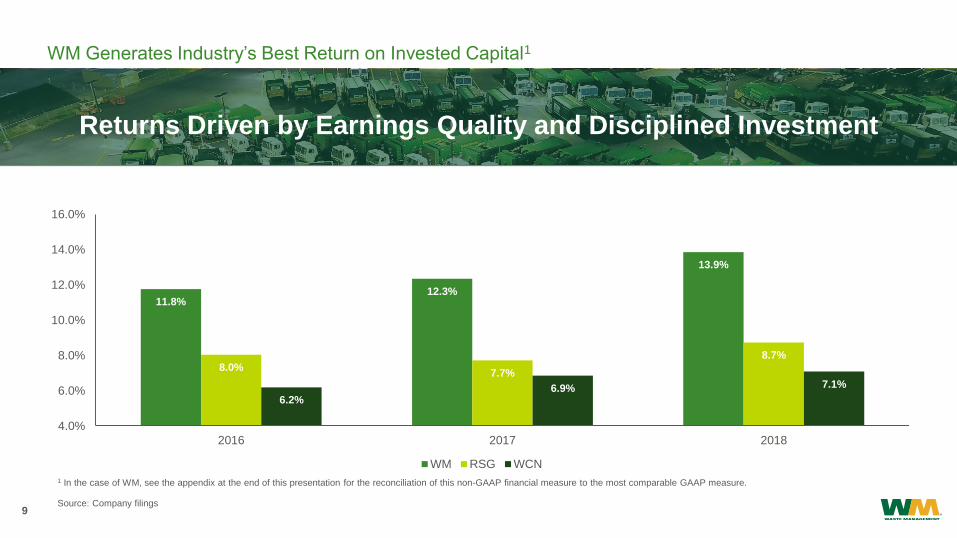
WM Generates Industry’s Best Return on Invested Capital1
Serve over 20 million
customers across the US
and Canada
Waste Management’s largest
customer accounts for less
than 2% of revenue
Long-standing customer
relationships with significant
contracted business
1 In the case of WM, see the appendix at the end of this presentation for the reconciliation of this non-GAAP financial measure to the most comparable GAAP measure.
Source: Company filings
Returns Driven by Earnings Quality and Disciplined Investment
11.8%12.3%
13.9%
8.0%7.7%
8.7%
6.2%6.9% 7.1%
4.0%
6.0%
8.0%
10.0%
12.0%
14.0%
16.0%
2016 2017 2018
WM RSG WCN

10
Strategic Execution
Waste Management’s largest
customer accounts for less
than 2% of revenue
Long-standing customer
relationships with significant
contracted business
Our strategy, or how we compete, leverages our unique resources and assets.Successful execution of our strategic priorities will help us achieve our financial and non-financial goals.
What we will deliver
Our unique resources
How we will compete
Operating:
Customer Service, Culture, Diversity
Financial:
EPS, Operating EBITDA, and FCF Growth
People Asset
Network
Technology Growth
Engine
Focused Differentiation & Continuous Improvement
11
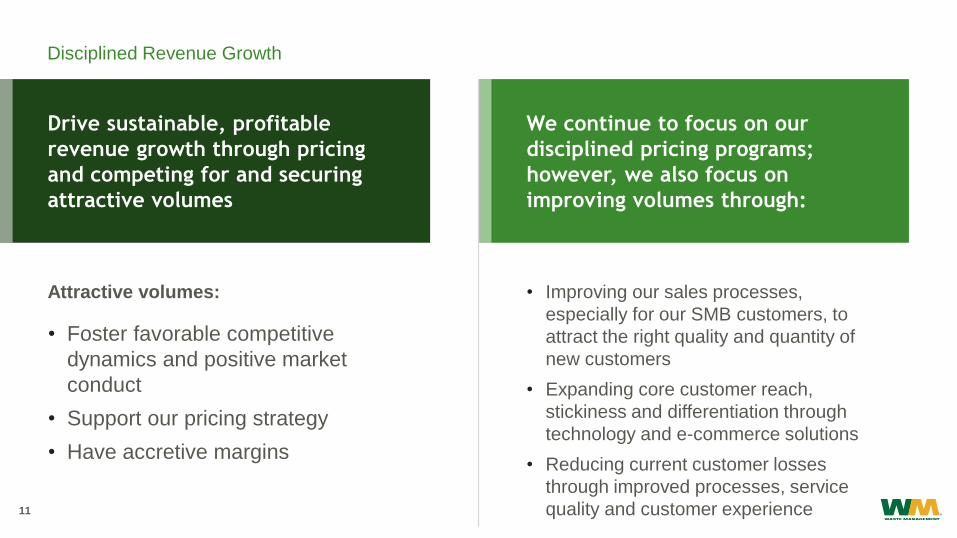
Disciplined Revenue Growth
Serve over 20 million
customers across the US
and Canada
Waste Management’s largest
customer accounts for less
than 2% of revenue
Long-standing customer
relationships with significant
contracted business
We continue to focus on our
disciplined pricing programs;
however, we also focus on
improving volumes through:
Attractive volumes:
• Foster favorable competitive
dynamics and positive market
conduct
• Support our pricing strategy
• Have accretive margins
Drive sustainable, profitable
revenue growth through pricing
and competing for and securing
attractive volumes
• Improving our sales processes,
especially for our SMB customers, to
attract the right quality and quantity of
new customers
• Expanding core customer reach,
stickiness and differentiation through
technology and e-commerce solutions
• Reducing current customer losses
through improved processes, service
quality and customer experience

12
Core Optimization and Cost Controls
Serve over 20 million
customers across the US
and Canada
Long-standing customer
relationships with significant
contracted business
We continue to focus on our
industry-leading yield programs;
however, we also focus on
improving volumes through:Improve core operations, customer
satisfaction and service reliability thereby
minimizing customer defections
We have maintained strong focus on
costs over the last three years, and we
intend to continue that focus and
expand it into other areas of the
business through:
Achieve operating and SG&A cost reduction
goals from continued efficiency focus
• Continued reduction in collection operating
costs from ongoing Service Delivery
Optimization (SDO)
• Application of learnings from SDO deployment
to fleet maintenance practices to enhance
standardization (MSDO)
• Improved alignment between field operations
and call centers
• Continuously raising our standard for customer
service excellence

13
Using Technology to Improve Customer Service and to Reduce Costs
Serve over 20 million
customers across the US
and Canada
Long-standing customer
relationships with significant
contracted business
CUSTOMER SOLUTIONS
• Enhanced WM.com and mobile applications improve customer
interactions and increase ease of doing business with WM
• Complete customer service channel of choice
(self-service, chat, phone, etc.)
DATA & ANALYTICS
• Customer interaction analytics to enable predictive
customer solutions
• Enhanced pricing tools reduce churn resulting from
pricing program
OPERATIONAL TECHNOLOGIES
• Integration of map, traffic and vehicle data to
optimize routes
• Predictive maintenance and parts purchasing
• Piloting smart bins and containers
14
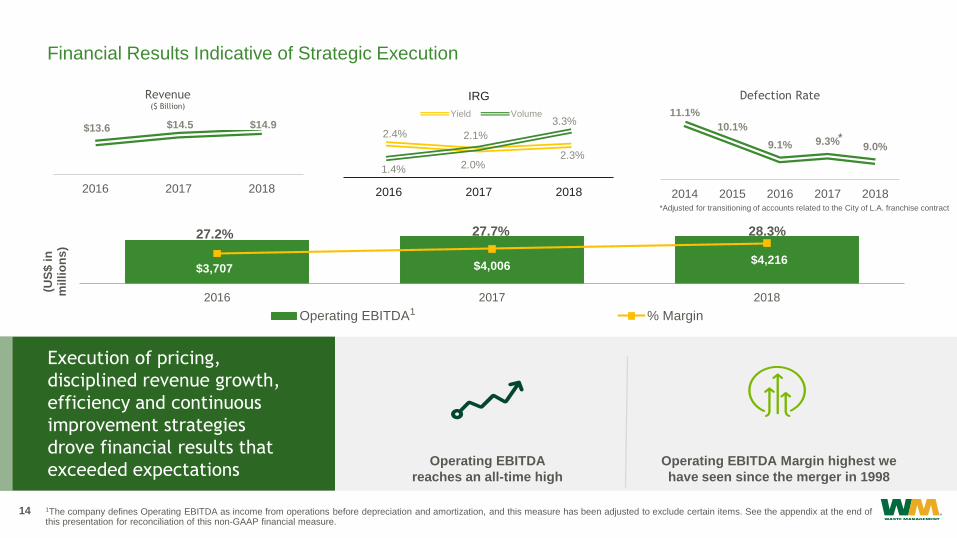
2.4%
2.0%2.3%
1.4%
2.1%
3.3%
2016 2017 2018
IRG
Yield Volume
Financial Results Indicative of Strategic Execution
Serve over 20 million
customers across the US
and Canada
Long-standing customer
relationships with significant
contracted business
$13.6 $14.5 $14.9
2016 2017 2018
Revenue($ Billion)
Defection Rate
11.1%
10.1%
9.1% 9.3%9.0%
2014 2015 2016 2017 2018
$3,707 $4,006 $4,216
27.2% 27.7% 28.3%
2016 2017 2018
(US
$ i
n
mil
lio
ns
)
Operating EBITDA % Margin
Operating EBITDA
reaches an all-time high
Operating EBITDA Margin highest we
have seen since the merger in 1998
Execution of pricing,
disciplined revenue growth,
efficiency and continuous
improvement strategies
drove financial results that
exceeded expectations
1The company defines Operating EBITDA as income from operations before depreciation and amortization, and this measure has been adjusted to exclude certain items. See the appendix at the end of this presentation for reconciliation of this non-GAAP financial measure.
1
*
*Adjusted for transitioning of accounts related to the City of L.A. franchise contract

15
Significant Cash Generated by OperationsSupports Investment in the Business and Return of Cash to Shareholders
Serve over 20 million
customers across the US
and Canada
$726 $750 $802
$1,339 $1,509
$1,694
$3,003
$3,180
$3,570
$0
$500
$1,000
$1,500
$2,000
$2,500
$3,000
$3,500
$4,000
2016 2017 2018
(US
$ i
n m
illi
on
s)
Dividends Capex Operating Cash Flow
16
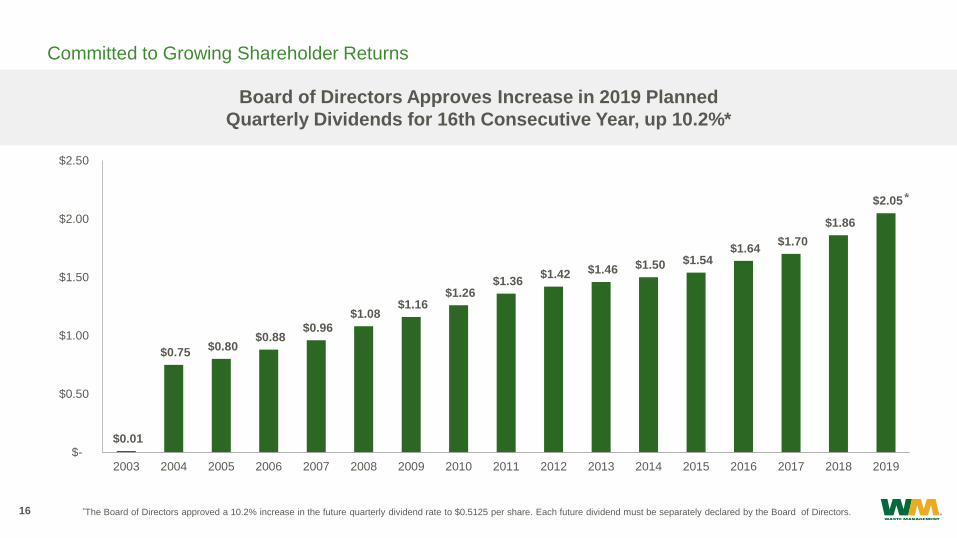
Committed to Growing Shareholder Returns
Serve over 20 million
customers across the US
and Canada
$0.01
$0.75 $0.80
$0.88 $0.96
$1.08 $1.16
$1.26 $1.36
$1.42 $1.46 $1.50 $1.54 $1.64
$1.70
$1.86
$2.05
$-
$0.50
$1.00
$1.50
$2.00
$2.50
2003 2004 2005 2006 2007 2008 2009 2010 2011 2012 2013 2014 2015 2016 2017 2018 2019
Board of Directors Approves Increase in 2019 Planned
Quarterly Dividends for 16th Consecutive Year, up 10.2%*
*The Board of Directors approved a 10.2% increase in the future quarterly dividend rate to $0.5125 per share. Each future dividend must be separately declared by the Board of Directors.
*
17
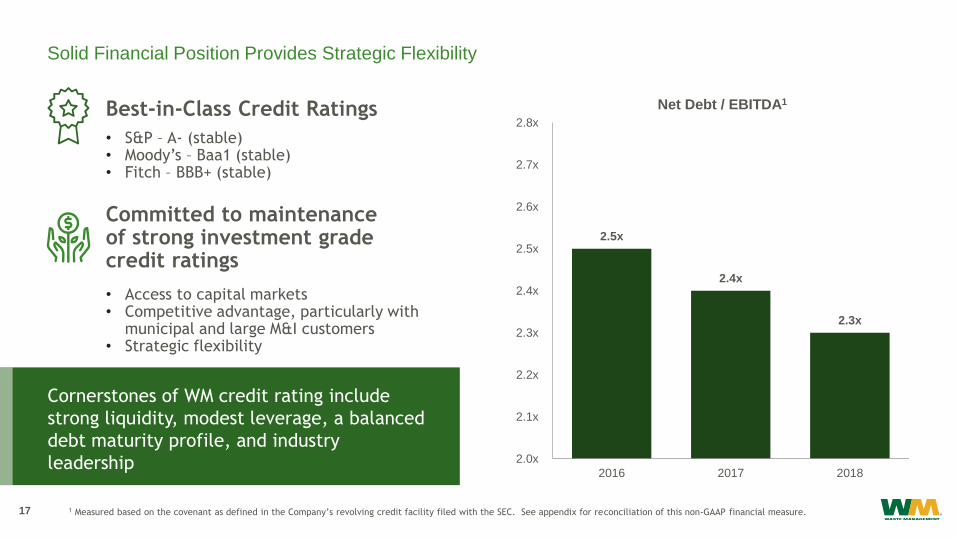
Solid Financial Position Provides Strategic Flexibility
Best-in-Class Credit Ratings
• S&P – A- (stable)• Moody’s – Baa1 (stable)• Fitch – BBB+ (stable)
Committed to maintenanceof strong investment gradecredit ratings
• Access to capital markets• Competitive advantage, particularly with
municipal and large M&I customers• Strategic flexibility
2.3x
2.4x
2.5x
2.0x
2.1x
2.2x
2.3x
2.4x
2.5x
2.6x
2.7x
2.8x
201820172016
Net Debt / EBITDA1
Cornerstones of WM credit rating include
strong liquidity, modest leverage, a balanced
debt maturity profile, and industry
leadership
1 Measured based on the covenant as defined in the Company’s revolving credit facility filed with the SEC. See appendix for reconciliation of this non-GAAP financial measure.
• 2018 was a record year
• Highest operating EBITDA
• Returned $1.8 billion to shareholders
• ROIC expanded 160 basis points
• 2019 expected to continue that success
• Expected 10.2% increase in dividends
• $1.5 billion share repurchase authorization
SUMMARY

19
GET IN TOUCH WITH US
Ed Egl
713.265.1656 (o)
713.725.7222 (c)
Heather Miller
713.265.1507 (o)
Twitter: @WM_Investor

Appendix
Financial Information and Reconciliation
of Non-GAAP Measures
21
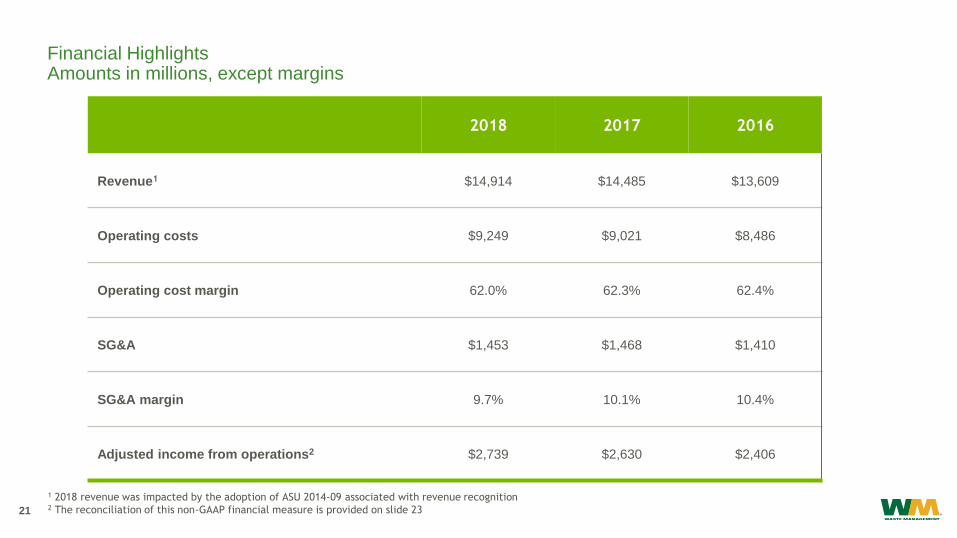
Financial HighlightsAmounts in millions, except margins
Serve over 20 million
customers across the US
and Canada
Waste Management’s largest
customer accounts for less
than 2% of revenue
Returns Driven by Earnings Quality and Disciplined Investment2018 2017 2016
Revenue1 $14,914 $14,485 $13,609
Operating costs $9,249 $9,021 $8,486
Operating cost margin 62.0% 62.3% 62.4%
SG&A $1,453 $1,468 $1,410
SG&A margin 9.7% 10.1% 10.4%
Adjusted income from operations2 $2,739 $2,630 $2,406
1 2018 revenue was impacted by the adoption of ASU 2014-09 associated with revenue recognition2 The reconciliation of this non-GAAP financial measure is provided on slide 23

22
Financial Highlights (Continued)Amounts in millions
Serve over 20 million
customers across the US
and Canada
Waste Management’s largest
customer accounts for less
than 2% of revenue
Long-standing customer
relationships with significant
contracted business
Returns Driven by Earnings Quality and Disciplined Investment
1 The reconciliation of this non-GAAP financial measure is provided on slide 24
2018 2017 2016
Net cash provided by operations $3,570 $3,180 $3,003
Capital expenditures $1,694 $1,509 $1,339
Free cash flow1 $2,084 $1,770 $1,710
Acquisitions and investments $466 $200 $611
Cash dividends $802 $750 $726
Common stock repurchases $1,004 $750 $725

23
Reconciliation of Non-GAAP MeasuresAdjusted Income from Operations | Amounts in millions
Serve over 20 million
customers across the US
and Canada
Waste Management’s largest
customer accounts for less
than 2% of revenue
Long-standing customer
relationships with significant
contracted business
Returns Driven by Earnings Quality and Disciplined Investment2018 2017 2016
Income from operations (as reported) $2,789 $2,636 $2,296
Adjustments
(Income)/expense from divestitures, asset
impairments and unusual items, net$(55) $(17) $108
Restructuring $2 - $2
Multiemployer pension withdrawal costs $3 $11 -
Adjusted income from operations1 $2,739 $2,630 $2,406
1 Refer to the tables to the press release filed with our Form 8-K filed on February 14, 2019 for additional information.

24
Reconciliation of Non-GAAP MeasuresOperating EBITDA | Amounts in millions, except margins
Serve over 20 million
customers across the US
and Canada
Waste Management’s largest
customer accounts for less
than 2% of revenue
Long-standing customer
relationships with significant
contracted business
Returns Driven by Earnings Quality and Disciplined Investment2018 2017 2016
Income from operations $2,789 $2,636 $2,296
Depreciation and amortization $1,477 $1,376 $1,301
Multiemployer pension withdrawal costs $3 $11 -
Restructuring $2 - -
(Income) expense from divestitures, asset
impairments and unusual items, net$(55) $(17) $110
Adjusted Operating EBITDA $4,216 $4,006 $3,707
Revenue $14,914 $14,485 $13,609
Adjusted Operating EBITDA Margin 28.3% 27.7% 27.2%

25
Reconciliation of Non-GAAP MeasuresAdjusted Tax Expense | Amounts in millions
Serve over 20 million
customers across the US
and Canada
Waste Management’s largest
customer accounts for less
than 2% of revenue
Long-standing customer
relationships with significant
contracted business
Returns Driven by Earnings Quality and Disciplined Investment2018 2017 2016
Provision for income taxes, as reported $453 $242 $642
Adjustments
Tax benefits related to income tax audit
settlements$33 - -
Impact of Tax Cuts and Jobs Act $27 $529 -
Tax benefits related to adjustment to deferred
taxes$17 - -
Expense from divestitures, asset impairments
and unusual items, net$(17) $(6) $37
Loss on early extinguishment of debt - $2 -
Restructuring $1 - -
Tax benefits related to equity-based
compensation- $32 -
Multiemployer pension withdrawal costs $1 $4 -
Adjusted provision for income taxes $515 $803 $679

26
Reconciliation of Non-GAAP MeasuresFree Cash Flow | Amounts in millions
Serve over 20 million
customers across the US
and Canada
Waste Management’s largest
customer accounts for less
than 2% of revenue
Long-standing customer
relationships with significant
contracted business
Returns Driven by Earnings Quality and Disciplined Investment2018 2017 2016
Net cash provided by operations $3,570 $3,180 $3,003
Capital expenditures $(1,694) $(1,509) $(1,339)
Proceeds from divestitures of
businesses (net of cash divested)
and other sale of assets
$208 $99 $43
Free cash flow $2,084 $1,770 $1,710
27
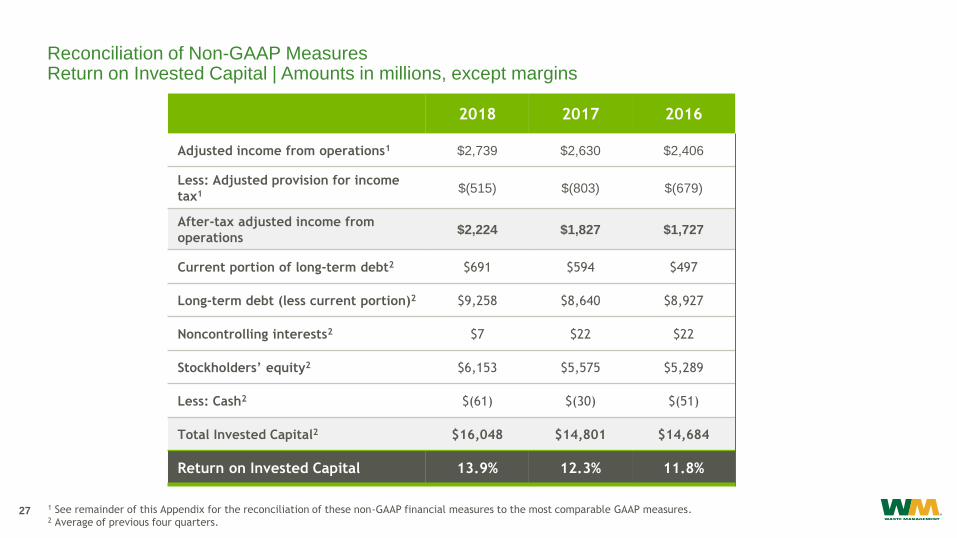
Reconciliation of Non-GAAP MeasuresReturn on Invested Capital | Amounts in millions, except margins
Serve over 20 million
customers across the US
and Canada
Long-standing customer
relationships with significant
contracted business
Returns Driven by Earnings Quality and Disciplined Investment2018 2017 2016
Adjusted income from operations1 $2,739 $2,630 $2,406
Less: Adjusted provision for income
tax1 $(515) $(803) $(679)
After-tax adjusted income from
operations$2,224 $1,827 $1,727
Current portion of long-term debt2 $691 $594 $497
Long-term debt (less current portion)2 $9,258 $8,640 $8,927
Noncontrolling interests2 $7 $22 $22
Stockholders’ equity2 $6,153 $5,575 $5,289
Less: Cash2 $(61) $(30) $(51)
Total Invested Capital2 $16,048 $14,801 $14,684
Return on Invested Capital 13.9% 12.3% 11.8%
1 See remainder of this Appendix for the reconciliation of these non-GAAP financial measures to the most comparable GAAP measures.2 Average of previous four quarters.

28
Reconciliation of Non-GAAP MeasuresNet Debt / EBITDA | Amounts in millions
Serve over 20 million
customers across the US
and Canada
Waste Management’s largest
customer accounts for less
than 2% of revenue
Long-standing customer
relationships with significant
contracted business
Returns Driven by Earnings Quality and Disciplined Investment2018 2017 2016
Balance sheet debt $10.026 $9,491 $9,310
Adjustments for accounting for fair value
hedges and discounts$52 $56 $47
Guarantees of indebtedness of others $4 $5 $6
Numerator1 $10,082 $9,552 $9,363
Operating EBITDA2 $4,216 $4,006 $3,707
Less: Restructuring cost - - $4
Less: Net income attributable to
noncontrolling interests- - $(2)
Other $92 $50 $(10)
Denominator - EBITDA1 $4,308 $4,056 $3,699
Net Debt / EBITDA1 2.3x 2.4x 2.5x
1 The Numerator and Denominator used for this calculation are based on defined terms for this covenant within the Company's revolving credit facility.2 See Slide 24 for a reconciliation of this non-GAAP financial measure.