Figure 2: EDSS Enterprise Package Work Book: A Work Book ...

RATIONALE FOR LAQUINIMOD IN PROGRESSIVE MULTIPLE SCLEROSIS
Giancarlo Comi1, Maria Pia Sormani2, Gavin Giovannoni3, David Ladkani4, Nissim Sasson, Tali Gorfine5,and Volker Knappertz6,7
1: Università Vita-Salute San Raffaele, Milan, Italy 2: Università degli Studi di Genova, Genoa, Italy 3: Barts & London School of Medicine & Dentistry, London, United Kingdom 4: Teva Pharmaceutical Industries, Petach Tiqva, Israel 5: Teva Pharmaceutical Industries, Netanya, Israel 6: Teva Pharmaceutical Industries, Frazer, PA, USA 7: Heinrich-Heine University, Düsseldorf, Germany

• G. Comi: has received personal compensation for consulting services and/or speaking activities from Teva, Novartis, Sanofi, Genzyme, Merck Serono, Biogen, Bayer, Serono Symposia International Foundation, Actelion and Almirall
• M. Sormani: has received personal compensation for consulting services and for speaking activities from Allozyne, Merck Serono, Teva, Synthon, Actelion and Biogen Idec
• G. Giovannoni: has received personal compensation from Biogen-Idec, GW Pharma, Merck-Serono, Novartis, Teva, Genzyme-Sanofi, Fiveprime, Roche, Synthon, Vertex Pharmaceuticals; former editor of Multiple Sclerosis and Related Disorders
• D. Ladkani, N. Sasson, T. Gorfine and V. Knappertz: are employees of Teva Pharmaceutical Industries Ltd.
• Writing support was provided by Sheila Truten of Medical Communication Company, Inc, funded by Teva Pharmaceutical Industries, Ltd.
Disclosures
2 2

• Both acute relapses and disability progression are hallmarks of RRMS
• The MS disease course and progression to permanent disability relates to two clinical-pathobiological processes1-4
o Acute focal inflammation from activated peripheral cells that cross the BBB; associated with relapse and active MRI lesions, which are more frequent in early RRMS.
o A progressive phase associated with diffuse inflammation trapped behind a largely intact BBB; disability accumulation increases along with patient age and disease duration.
• Natural history studies suggest that disability progression to EDSS 6 and beyond is largely independent of relapse activity past the first two years from diagnosis5-7
3 References: 1. Lassmann et al. Nat Rev Neurol 2012;8(11):647-56. 2. Confavreux et al. N Engl J Med 2000;343:1430-8. 3. Lublin F. J Neurol 2005;252:III/3–9. 4. Leray et al. Brain 2010; 133: 1900–1913. 5. Confavreux et al. Brain 2006;129 (3):606-16. 6. Tremlett et al. Neurology 2010;74:2004–15. 7. Scalfari et al. Brain 2010;133:1914-29.
3
Based on laquinimod’s effects on disability and MRI indices of tissue integrity in RRMS, the rationale for trials in progressive
multiple sclerosis (PMS) is made here
Partially Independent Inflammatory Pathways Contribute to Progressive Disability in Multiple Sclerosis

Laquinimod 0.6 mg N = 984
Placebo N = 1006
Age, years (mean ± SD) 38.0 ± 9.3 38.1 ± 9.3
Female Gender, n (%) 673 (68.4) 689 (68.5)
Time from first MS symptom, years (mean ± SD) 7.8 ± 6.6 7.9 ± 6.7
Time from diagnosis, years (mean ± SD) 4.3 ± 4.9 4.1 ± 4.9
Number of relapses in prior 2 years (mean ± SD) 1.9 ± 1.0 1.9 ± 0.9
EDSS score (mean ± SD) 2.6 ± 1.3 2.7 ± 1.2
Number of GdE T1 lesions (mean ± SD) 1.8 ±4.5 1.8 ± 5.7
T2 Lesions volume, cm3 (mean ± SD) 9.7 ± 10.4 8.9 ± 9.8
Normalized brain volume, cm3 (mean ± SD) 1580 ± 95 1585 ± 93
Pooled ALLEGRO1 and BRAVO2 Cohort: Baseline Characteristics
4 References: 1. Comi et al. N Engl J Med 2012;366:1000-9. 2. Vollmer et al. J Neurol 2014: doi:0.1007/s00415-014-7264-4. 4

5
-5.0%
0.0%
5.0%
10.0%
15.0%Placebo
Laquinimod 0.6 mg
0.0%
5.0%
10.0%
15.0%Placebo
Laquinimod 0.6 mg
0.0%
5.0%
10.0%
15.0%Placebo
Laquinimod 0.6 mg
3-month CDP HR= 0.66 (p=0.0017)
0.0%
5.0%
10.0%
15.0%Placebo
Laquinimod 0.6 mg
9-month CDP HR= 0.53 (p=0.0009)
12-month CDP HR= 0.55 (p=0.0082)
34%
47%
46%
45%
6-month CDP HR= 0.56 (p=0.0003)
5
Confirmed Disability Progression (CDP) in ALLEGRO/BRAVO Pooled Analyses
Laquinimod effect on CDP is large, consistent, and maintained for increasingly rigorous confirmation durations.

─1.6
─1.2
─0.8
0
Per
cent
bra
in v
olum
e ch
ange
fro
m b
asel
ine
to m
onth
24
(a
djus
ted
mea
n)
Laquinimod 0.6 mg (n=984)
─0.4
Placebo (n=1006)
-1.19%
-0.84%
Laquinimod Reduces Brain Tissue Loss
-30%
References: 1. Comi et al. N Engl J Med 2012;366:1000-9. 2. Vollmer et al. J Neurol 2014: doi:0.1007/s00415-014-7264-4. 3. Filippi et al. J Neurol Neurosurg Psychiatry 2013; doi:10.1136/jnnp-2013-306132.
6
p<0.0001
6
• Laquinimod significantly reduced whole brain tissue loss in pivotal trials1,2
• In an ancillary study, brain tissue preservation was evident in WM, GM, and thalamus3

Laquinimod Effect on Risk of Confirmed Disability Progression is Greater than Predicted by Relapse Effect
7 Reference: 1. Sormani et al. Neurology 2010;75:302-9.
• The predicted reduction with laquinimod vs. placebo in risk of 3-month CDP was -5%
• However, the observed risk reduction was far greater: -29% (risk ratio)
-1
-0.8
-0.6
-0.4
-0.2
0
0.2
0.4
0.6
-1 -0.8 -0.6 -0.4 -0.2 0 0.2 0.4
log(CDP-effect)=0.10 + 0.63 log(ARR-effect)
log(ARR effect) lo
g(CD
P ef
fect
)
Predicted risk reduction (95% CI) Observed risk reduction
7
• The observed treatment effect of LAQ on CDP is greater than predicted based on effect on relapse
• Different mechanisms may mediate relapse and CDP reduction by LAQ
An equation derived by Sormani et al1 predicts a treatment effect on disability (CDP) based on the actual treatment effect on annualized relapse rate (ARR)

Laquinimod Treatment Effect on CDP is only Marginally Mediated by its Effect on Relapse Reduction
8 References: 1. Freedman & Graubard. Stat Med 1992;11:167-78. 2. Sormani et al. ECTRIMS 2013:P611.
Mediation was quantified as the proportion of treatment effect (PTE)1 using the results of logistic regression after adding first-year relapses to the model
• 3-month-CDP PTE for IFNβ-1a = 31% (in BRAVO) • 6-month-CDP PTE for fingolimod = 60% (in FREEDOMS)2
8
LAQ CDP
Relapse
3-month CDP PTE for LAQ=19% 6-month CDP PTE for LAQ=11%

Laquinimod Reduced Disability Progression in Relapse-Free Patients
9
0
5%
10%
15%
25%
27%
4.8%
7.6%
Placebo Laquinimod 0.6 mg
Inci
denc
e of
CDP
(%) 20%
18.9%
22.1%
39%
9
• MS disability progression continues in the absence of relapse
• LAQ reduced CDP in patients who did not relapse during the ALLEGRO and BRAVO trials
Relapse-free (n=1220)
Relapsing (n=770)
HR=0.61 (95% CI: 0.39, 0.97; p=0.032)
HR=0.73 (95% CI: 0.53, 1.01; p=0.058)

Pooled ALLEGRO and BRAVO EDSS ≤3 (N=1335)
EDSS >3 (N=655)
Age (years), mean ± SD 36.5±9.1 41.3±8.7
Female Gender, N (%) 910 (68.2%) 452 (69.0%)
Previous MS treatment, N (%) 325 (24.3%) 163 (24.9%)
EDSS at baseline, mean ± SD 1.9±0.7 4.1±0.7
Time from MS diagnosis (years), mean ± SD 3.7±4.6 5.2±5.3
Time from first symptom (years), mean ± SD 6.9±6.1 9.7±7.2
# of GdE T1 lesions, mean ± SD 1.5±4.2 2.2±6.7
Volume of T2 lesions (cm3), mean ± SD 7.8±8.7 12.3±12.0
Baseline brain volume, mean ± SD 1601± 90.0 1547± 90.8
Laquinimod Efficacy was Evaluated in a Subgroup with Greater Baseline Disability
10
At baseline, patients in ALLEGRO and BRAVO with EDSS over 3 were older and had longer disease duration, larger T2 lesion volume, and lower brain volume.
References: 1. Pittock et al. Neurology 2004;62:51-9. 2. Pittock et al. Neurology 2004;62:601-6. 3. . Leray et al. Brain 2010; 133: 1900–1913.
• Natural history data show once EDSS 3 is reached, disability progression becomes both more likely and more rapid1-3
• At EDSS >3, chronic diffuse inflammation may be a more important driver of disability
10

Disability-Related Outcomes in Patients with Baseline EDSS over 3
11
Pooled ALLEGRO and BRAVO
EDSS ≤3.0 LAQ 0.6 mg, n=656 (66.7%)
PBO, n=679 (67.5%)
EDSS >3.0 LAQ 0.6 mg, n=328 (33.3%)
Placebo, n=327 (32.5%)
Time To 3-month CDP Hazard Ratio [CI] 0.69 [0.50; 0.96]; p=0.0256
0.60 [0.38; 0.93]; p=0.0229
Time To 6-month CDP Hazard Ratio [CI] 0.60 [0.41; 0.88]; p=0.0088
0.47 [0.27; 0.82]; p=0.0083
MSFC z-Score change at Month 24
Adjusted mean difference [CI]
-0.02 [-0.12; 0.09]; p=0.7614
0.25 [0.10; 0.39]; p=0.0009
Brain Atrophy as defined by PBVC
Adjusted mean difference [CI]
0.34 [0.21; 0.47]; p<.0001
0.39 [0.21; 0.58]; p<.0001
11

• At baseline, subjects in the EDSS ≤3 group completed the Timed 25-Foot Walk in a mean (SD) of 5.40±5.3 seconds, and subjects in the EDSS >3 group completed the T25FW in 8.29±6.81 seconds
Ambulation benefit in EDSS >3 Supports the CDP Effect
12 12
Effect size=59%
The T25FW data support the effect of laquinimod on CDP as an independent, relevant assessment in patients with EDSS over 3.

• Laquinimod-related reductions in CDP are large and robust, and cannot be explained by suppression of acute inflammation
• Clinical and MRI data demonstrate treatment effects in RRMS subgroups more likely to have progressive disease
Conclusions
13 13
The unique efficacy profile and mechanism of action of Laquinimod may meet the medical need for an effective
treatment in progressive MS.

Phase II MRI study (ARPEGGIO): PPMS • 48-week Dose ranging study:
– LAQ 0.6mg – LAQ 1.0 mg – LAQ 1.5 mg
– placebo • Sample size: 500 patients (125 per arm)
• Primary endpoint: Percentage brain volume change (PBVC)
• Secondary endpoints: CDP, BICAMS, number of new T2 lesions
Phase III study: Progressive MS - PPMS and SPMS • 2 arms: LAQ 1.2 mg; placebo
• Primary endpoint: CDP
Laquinimod in Progressive MS: Two Parallel Placebo-Controlled Trials
14 14
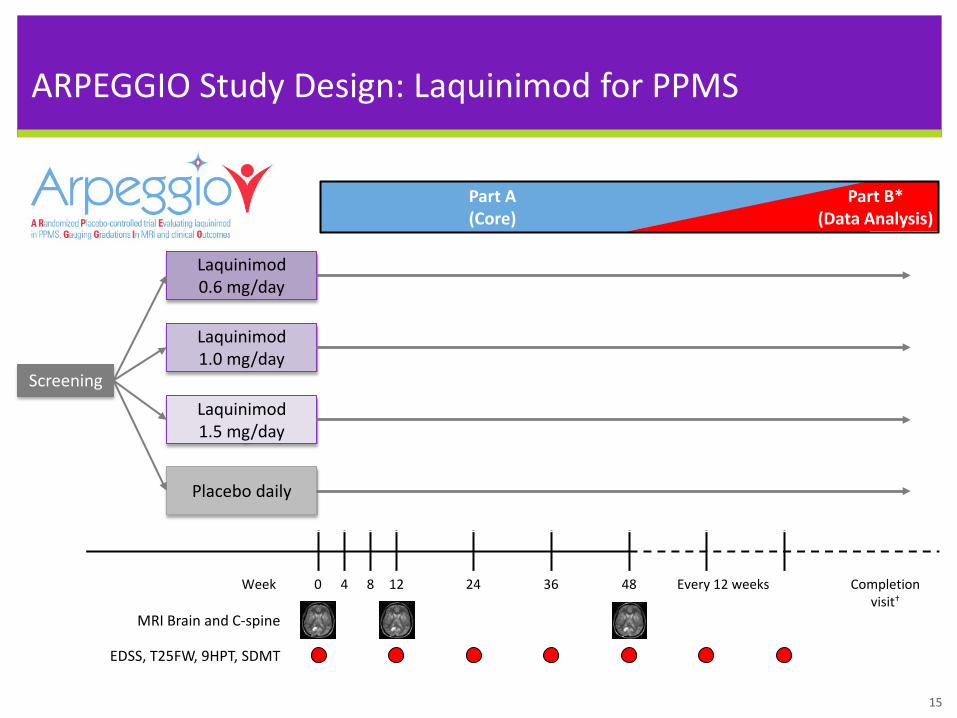
ARPEGGIO Study Design: Laquinimod for PPMS
15
EDSS, T25FW, 9HPT, SDMT
MRI Brain and C-spine
4 Week 8 0 12 24 36 48 Every 12 weeks Completion visit†
Screening
Laquinimod 0.6 mg/day
Placebo daily
Laquinimod 1.0 mg/day
Laquinimod 1.5 mg/day
Part A (Core)
Part B* (Data Analysis)
15

Questions?
16

Backup Slides
17

Efficacy in Patients with Baseline EDSS over 3
18
EDSS ≤3.0 LAQ 0.6 mg, n=656 (66.7%)
PBO, n=679 (67.5%)
EDSS >3.0 LAQ 0.6 mg, n=328 (33.3%)
Placebo, n=327 (32.5%)
Annualized Relapse Rate Rate Ratio [CI] 0.80 [0.67; 0.95]; p=0.0103
0.75 [0.60; 0.94]; p=0.0119
Time To 3-month CDP* Hazard Ratio [CI] 0.69 [0.50; 0.96]; p=0.0256
0.60 [0.38; 0.93]; p=0.0229
Time To 6-month CDP* Hazard Ratio [CI] 0.60 [0.41; 0.88]; p=0.0088
0.47 [0.27; 0.82]; p=0.0083
Disability as Assessed by MSFC z-Score at Month 24
Adjusted mean difference [CI]
-0.02 [-0.12; 0.09]; p=0.7614
0.25 [0.10; 0.39]; p=0.0009
Brain Atrophy as defined by PBVC
Adjusted mean difference [CI]
0.34 [0.21; 0.47]; p<.0001
0.39 [0.21; 0.58]; p<.0001
Cumulative GdE T1 Lesions at Months 12 and 24 Rate Ratio [CI] 0.66
[0.53; 0.82]; p=0.0002 0.83
[0.61; 1.13]; p=0.2390
Cumulative New/Enlarging T2 Lesions at Months 12 and 24 Rate Ratio [CI] 0.77
[0.65; 0.91] p=0.0024 0.75
[0.59; 0.96]; p=0.0214 18

Class I–restricted CD8+ T cell
up-regulated by interferon-γ
Class I MHC molecule
Primary oligodendrogliopathy Oligodendrocyte
Degeneration of inner glial
loop
Postsynaptic neuron
Immune mediated injury
Neuronal cell body
Normal myelin sheath
Remyelinated areas
Terminal axon ovoid
Oligodendrocyte precursor cell
Glial growth factors?
Increased sodium-channel
density
Antiinflammatory signaling Interleukin-4, 10, 13
B7G-1, B7-2 CD28 Immune response
CTLA-4 Anergy
Class II MHC molecule
Putative MS antigen
TCR
CD4+ T cell
Activated antigen-
presenting cell (astrocytes, microglia,
macrophages)
CD4+ Th1 cell
TNF-α, Interferon-γ
Interferon-γ TNF-β
Cytokine-mediated
injury
CD4+ Th2 cell
Interleukin- 4, 5, 6, 10,
13
Surface Ig
Demyelinating antibodies Anti-MOG?
Penetration (matrix metalloproteinases)
Autoreactive T cell
Endothelial cells
Blood–brain barrier
Systemic circulation
Proliferation Migration Differentiation Remyelination
Activated B cell
Basement membrane
Interleukin-12 Interferon-γ
Antibodies
B7G-1, B7-2 CD28
CTLA-4 Anergy
Class II MHC molecule
Putative MS antigen
TCR
CD4+ T cell
Activated antigen-
presenting cell (astrocytes, microglia,
macrophages)
CD4+ Th1 cell
TNF-α, Interferon-γ
Interferon-γ TNF-β
Cytokine-mediated
injury
CD4+ Th2 cell
Interleukin- 4, 5, 6, 10,
13
Surface Ig Activated B cell
Interleukin-12 Interferon-γ
Antibodies
Immune response
Antiinflammatory signaling Interleukin-4, 10, 13
ICAM-1, VCAM-1 E-selectins
up-regulated
Antibody-mediated remyelination
Antibody/complement mediated injury
Astrocyte
Residential inflammation (astrocytes/microglia)
Myelin/Oligodendrocytes Axons/Neurons
Blood brain barrier Peripheral
inflammation

Class I–restricted CD8+ T cell
up-regulated by interferon-γ
Class I MHC molecule
Primary oligodendrogliopathy Oligodendrocyte
Degeneration of inner glial
loop
Postsynaptic neuron
Immune mediated injury
Neuronal cell body
Normal myelin sheath
Remyelinated areas
Terminal axon ovoid
Oligodendrocyte precursor cell
Glial growth factors?
Increased sodium-channel
density
Antiinflammatory signaling Interleukin-4, 10, 13
B7G-1, B7-2 CD28 Immune response
CTLA-4 Anergy
Class II MHC molecule
Putative MS antigen
TCR
CD4+ T cell
Activated antigen-
presenting cell (astrocytes, microglia,
macrophages)
CD4+ Th1 cell
TNF-α, Interferon-γ
Interferon-γ TNF-β
Cytokine-mediated
injury
CD4+ Th2 cell
Interleukin- 4, 5, 6, 10,
13
Surface Ig
Demyelinating antibodies Anti-MOG?
Penetration (matrix metalloproteinases)
Autoreactive T cell
Endothelial cells
Blood–brain barrier
Systemic circulation
Proliferation Migration Differentiation Remyelination
Activated B cell
Basement membrane
Interleukin-12 Interferon-γ
Antibodies
B7G-1, B7-2 CD28
CTLA-4 Anergy
Class II MHC molecule
Putative MS antigen
TCR
CD4+ T cell
Activated antigen-
presenting cell (astrocytes, microglia,
macrophages)
CD4+ Th1 cell
TNF-α, Interferon-γ
Interferon-γ TNF-β
Cytokine-mediated
injury
CD4+ Th2 cell
Interleukin- 4, 5, 6, 10,
13
Surface Ig Activated B cell
Interleukin-12 Interferon-γ
Antibodies
Immune response
Antiinflammatory signaling Interleukin-4, 10, 13
ICAM-1, VCAM-1 E-selectins
up-regulated
Antibody-mediated remyelination
Antibody/complement mediated injury
Astrocyte

Control LAQ
LFB-PAS
EM
Effect of Laquinimod on Demyelination in the Cuprizone Model
21 Reference: 1. Brück et al., Acta Neuropathol. 2012.
LAQ
Control LAQ
Control

• Laquinimod has direct effects on peripheral immune cells and within the CNS
• Laquinimod affects the amount of tissue damage within focal lesions and the diffusely altered brain tissue
• Astrocyte and microglia activation are major factors in the pathogenesis of tissue damage in lesions and the diffusely abnormal brain tissue
• Laquinimod reduces activation of CNS-resident cells - astrocytes and microglia - via interference with the NFkB pathway
• Laquinimod MoA supports the clinical results demonstrating reduction of neurodegeneration and delay in disability progression
To Summarize
22