Rational Method for Selecting Maintenance Treatment...
8
TRANSPORTATION RESEARCH RECORD 1344 91 Rational Method for Selecting Maintenance Treatment Alternatives on the Basis of Distress Structural Capacity and Roughness GABRIEL ZoLTAN, ARIEH S10Ess, AND HAIM BoNJACK Primary concerns of a pavement maintenance management sys- tem (PMMS) include determining the kind of treatment appro- priate to periodic maintenance and classifying sections by priority order. A rational method is presented for selecting maintenance treatment solutions based on (a) pavement performance as ex- hibited by indexes of visual distress rating by the Washington survey method; (b) structural capacity evaluated by nondestruc- tive testing using a falling weight deflectometer; and (c) roughness determined by the present serviceability rating. Unlike PMMS applied in some parts of the world, this system refers individually and quantitatively to each index separately, considering its en- gineering significance and allowing calculation of the necessary structural strengthening. The method is based on the classification of road network sections by a decision tree. At each intersection, classification is performed per index suitable to the criteria under consideration. After the sections are classified, each section is assigned its appropriate treatment out of a treatment inventory available at the maintenance department. Determination of the treatments' economic feasibility and order of priority is based on the net present value and the internal rate of return of cost flows of periodic and routine maintenance and vehicle operation costs. The main objects of a pavement maintenance management system (PMMS) include determining the appropriate treat- ment and maintenance solution that will be applied at each road network section and classifying the sections by treatment priority order on the basis of economic and engineering con- siderations (1-3). Determination of the necessary treatment solution is based on the current performance rate of the sec- tion and its anticipated traffic data. Road authorities in the world are using various criteria indexes to evaluate pavement performance. In general, these indexes may be divided into four elementary groups as follows (3): visual distress, rough- ness (riding comfort), structural capacity, and pavement sur- face friction (safety). The number of indexes used and the integration between them differs from system to system. For instance, in the Paver (4), Washington (5), Texas (6), and California (6) methods, one or two indexes were used (visual distress and roughness); in the Macpon (7), Belgian (8), Kentucky (9), and Swiss Neu- chatel (JO) methods, all four indexes were used. For the pur- pose of decision making, that is, section classification and type of treatment determination, the above PMMSs base G. Zoltan and A. Sidess, Yariv Civil Engineering, 1 Remez Street, Givataim 53242 Israel. H. Bonjack, T&M Technology and Manage- ment , Moshav Shoeva 59 D.N. Harey Yehuda, Israel. themselves directly on the measured values or on empmc values obtained from normalization and weighting of the mea- sured values (11). The advantage of this method is its sim- plicity. However, there is also a striking disadvantage in the nonrational association between the rehabilitation solution and the weighted value used for its selection. In other words, the weighted value does not express the uniqueness of every index in the category that the index specializes in. Therefore, this approach will render identical solutions to two sections with an identical weighted index value, which is obtained out of different combinations of elementary index values, whereas if the diagnosis had been performed by observing every index and its engineering implications individually, the maintenance solution of the sections in question might have been different. This paper discusses development and application of an engineering-economic approach that enables the following: (a) classification of road network sections according to their performance characteristics; (b) determination of a suitable maintenance solution at the network level, at which the over- all problems pertinent to each section are analyzed; and (c) classification of sections by treatment priority order on the basis of internal rate of return. The work was performed within the framework of an economic engineering evaluation project comprising 900 km of roads in Israel's main highway network, which was divided into 170 sections. The elementary data on which work was based are (a) visual distress data, collected according to the Washington approach; (b) deflection basin data measured by a falling weight deflectometer (FWD); and (c) roughness data obtained by means of a car road meter. PROPOSED APPROACH DESCRIPTION Basic Assumptions and Principles The system, which was developed within the present frame- work, consists of three stages: (a) classifying the network sec- tions by their performance, (b) choosing the appropriate maintenance treatment, and (c) classifying sections according to treatment priority order. The classification and characterization methodology based on performance follows these guidelines: 1. Systematic approach and simplicity-Clearly defined principles, activities, and indexes will enable the computer-
Transcript of Rational Method for Selecting Maintenance Treatment...
TRANSPORTATION RESEARCH RECORD 1344 91
Rational Method for Selecting Maintenance Treatment Alternatives on the Basis of Distress Structural Capacity and Roughness
GABRIEL ZoLTAN, ARIEH S10Ess, AND HAIM BoNJACK
Primary concerns of a pavement maintenance management system (PMMS) include determining the kind of treatment appropriate to periodic maintenance and classifying sections by priority order. A rational method is presented for selecting maintenance treatment solutions based on (a) pavement performance as exhibited by indexes of visual distress rating by the Washington survey method; (b) structural capacity evaluated by nondestructive testing using a falling weight deflectometer; and (c) roughness determined by the present serviceability rating. Unlike PMMS applied in some parts of the world, this system refers individually and quantitatively to each index separately, considering its engineering significance and allowing calculation of the necessary structural strengthening. The method is based on the classification of road network sections by a decision tree. At each intersection, classification is performed per index suitable to the criteria under consideration. After the sections are classified, each section is assigned its appropriate treatment out of a treatment inventory available at the maintenance department. Determination of the treatments' economic feasibility and order of priority is based on the net present value and the internal rate of return of cost flows of periodic and routine maintenance and vehicle operation costs .
The main objects of a pavement maintenance management system (PMMS) include determining the appropriate treatment and maintenance solution that will be applied at each road network section and classifying the sections by treatment priority order on the basis of economic and engineering considerations (1-3). Determination of the necessary treatment solution is based on the current performance rate of the section and its anticipated traffic data. Road authorities in the world are using various criteria indexes to evaluate pavement performance . In general, these indexes may be divided into four elementary groups as follows (3): visual distress, roughness (riding comfort), structural capacity, and pavement surface friction (safety).
The number of indexes used and the integration between them differs from system to system. For instance, in the Paver (4), Washington (5), Texas (6), and California (6) methods, one or two indexes were used (visual distress and roughness); in the Macpon (7), Belgian (8), Kentucky (9), and Swiss Neuchatel (JO) methods , all four indexes were used. For the purpose of decision making, that is, section classification and type of treatment determination, the above PMMSs base
G. Zoltan and A. Sidess, Yariv Civil Engineering, 1 Remez Street, Givataim 53242 Israel. H. Bonjack, T&M Technology and Management, Moshav Shoeva 59 D.N. Harey Yehuda, Israel.
themselves directly on the measured values or on empmc values obtained from normalization and weighting of the measured values (11). The advantage of this method is its simplicity. However, there is also a striking disadvantage in the nonrational association between the rehabilitation solution and the weighted value used for its selection. In other words, the weighted value does not express the uniqueness of every index in the category that the index specializes in. Therefore, this approach will render identical solutions to two sections with an identical weighted index value, which is obtained out of different combinations of elementary index values, whereas if the diagnosis had been performed by observing every index and its engineering implications individually, the maintenance solution of the sections in question might have been different.
This paper discusses development and application of an engineering-economic approach that enables the following: (a) classification of road network sections according to their performance characteristics; (b) determination of a suitable maintenance solution at the network level, at which the overall problems pertinent to each section are analyzed; and (c) classification of sections by treatment priority order on the basis of internal rate of return . The work was performed within the framework of an economic engineering evaluation project comprising 900 km of roads in Israel's main highway network, which was divided into 170 sections. The elementary data on which work was based are (a) visual distress data, collected according to the Washington approach; (b) deflection basin data measured by a falling weight deflectometer (FWD); and ( c) roughness data obtained by means of a car road meter.
PROPOSED APPROACH DESCRIPTION
Basic Assumptions and Principles
The system, which was developed within the present framework, consists of three stages: (a) classifying the network sections by their performance, (b) choosing the appropriate maintenance treatment, and (c) classifying sections according to treatment priority order.
The classification and characterization methodology based on performance follows these guidelines:
1. Systematic approach and simplicity-Clearly defined principles, activities, and indexes will enable the computer-

92
ized handling of a massive data amount as well as the manual handling after receipt of basic data, even by operators not equipped with theoretical knowledge.
2. Individualistic and modular utilization of indexes-Each criterion index will be examined by stages, at each stage only one index with reference to its particular specialization.
3. Rational approach-This is the rational reference toward indexes while their engineering significance and their measured numerical value are examined .
4. Flexible structure-Modular structure of the system enables change execution at different stages without disrupting the .framework and the general procedure.
5. Versatile use-It is possible to use the system in an identical procedure for an individual sample data level, accumulated data at the section level (project level) , and overall data at the network level.
The basic principles of the maintenance treatment selection procedure are
1. Treatment selection according to failure character-A comprehensive, fundamental treatment procedure is chosen to suit the section's problem scope as expressed by the various specification indexes.
2. Quantitative definition of the required structural strengthening determination of a quantitative rehabilitation solution-The section possesses a necessary structural strengthening thickness (overlay thickness).
3. Use of practical work procedures-The proposed solutions are based on work procedures , equipment, and local maintenance teams' skills .
4. Economic evaluation accommodation-This treatment solution definition enables its easy conversion into financial
>80 Structural Analysis Overlay (mm)
Structural Analysts Overlay (mm)
Without <Jo Structural Analysis Alligator Overlay (mm) Crack In
Visual Distresses Structural Analysis
DR Overlay (mm)
Structural Analysis Overlay (mm)
Structural Analysis Overlay (mm)
<45 Structural Analysis Overlay (mm)
TRANSPORTATION RESEARCH RECORD 1344
values for economic evaluation and classification according to treatment priority order.
Classification Procedure Description
Figure 1 shows in detail the classification methodology and treatment selection procedure in the form of a decision tree. Classification consists of three integrated subsystems; in each the significance and effect of visual distress , structural capacity, and roughness are examined.
Visual Distress Subsystem
The damages observed on the pavements' surface are the parameters that mainly prescribe the type and character of routine corrective maintenance of the section. For major (periodic) maintenance and rehabilitation, these damages determine the surface preparatory treatment type that precedes the overlay strengthening. The data of a distress survey and DR parameters based on them are used in three stages:
1. Differentiation between visually satisfactory and other sections-This differentiation is made by the criterion value of DR = 80. This and higher values of DR ensure that there is no fatigue distress in the section. In this case there is at the most a limited amount of other distresses, such as transversal and longitudinal cracks and patching at a low to medium severity level. The satisfactory classified sections do not demand any surface preparation treatment, and the requirement for overlay is dictated by the other two indexes. Such a differentiation is also needed because of puhlic or institutional
Roughness Analysis Legend Modified Overlay
(mm) Q}Donothing
@Surface Treatment
Roughness Analysis Modified Overlay
@ Local Repairs + mm Surface Treatment
Roughness Analysis MOdifled Overlay
mm @ overlay
Roughness Analysis @ Local Repairs + Modilied Overlay Overlay
mm
Surface Miiiing + @Local Repairs +
Surface Roughness Analysis
Modified Overlay Treatment
mm @Surface Miiiing +
Roughness Analysis Local Repairs +
Modilied Overlay Overlay
mm Deep Milli n~+
Roughness Analysis @ Local Repairs +
Modified Overlay Overlay mm
FIGURE 1 Decision tree for alternative maintenance treatments.

Zoltan et al. 93
TABLE 1 CLASSIFICATION OF SECTIONS FOR SURFACE PREPARATION
Section
With Fatigue Distress Damage Level
Low: DR > 70 Medium: 35 ~ DR < 70 High: DR < 70
Without Fatigue Distress Damage Level
Low: DR > 70 Medium: 45 ~ DR < 70
High: DR < 45
pressure that might arise against maintenance activities in apparently well maintained sections even though the maintenance is technically or economically justified.
2. Differentiation between sections with fatigue cracking and other sections-This differentiation is required because a massive presence of fatigue cracks might suggest failure or structural capacity problems related to the asphaltic layer. In such instances the surface preparation treatment must be more intense and on a greater scale. This classification is directly based on quantity and severity level of fatigue cracking. The criterion value is determined by a weighted percentage (sum of individual samples' deduct values divided by number of samples) of fatigue cracking of 20 percent at the section, equal to the deduct value of 13 points by the Washington method (5) (100 percent fatigue cracking at a high level rate is equivalent to 65 deduct ·points).
3. Differentiation between sections according to damage level-Two section groups, one defined "with fatigue cracking" and the other "without fatigue cracking," are classified into three subgroups, each according to the damage rate . Such classification is necessary to define the surface preparation type and level. The criterion values for this classification are given in Table 1. The surface preparation treatment and DR classification criterion values are higher for the sections with fatigue distress because of the special structural meaning assigned to fatigue distress .
Structural Capacity Subsystem
One of the principle subsystems of the overall scheme is the structural capacity system, designated to produce a rehabilitation solution for the whole road network. The development of such a subsystem must be able to be incorporated within the general overall PMMS, to present fast and reliable rehabilitation solutions at the network level, and to use input data that are relatively easy to obtain.
As presented by Yariv-Civil Engineering Ltd ., (12) such a subsystem-which is based on nondestructive testing (NDT) of deflection basins measurements and on the rational approach-was developed and applied. The rational approach characterizes the pavement response to the major distress criteria such as fatigue and rutting. A detailed description of the subsystem can be found in works by Yariv-Civil Engineering and Sidess et al. (12 ,13). To complete the representa-
Treatment
Not required Local repairs Surface milling and local
repairs
Not required surface milling and local
r epairs Deep mi lli ng and local
tion of the decision tree, a brief description of the subsystem principles is given:
• According to the measured deflection basins and moduli derivation of the pavement layers and subgrade, criteria were established to classify the subgrade and pavement as weak, medium, or strong. Classification of subgrade was based on the seventh deflection - D 6 at 1.80 m from the load plate; classification of pavement was based on the surface curvature index. SCI = D0 - D1 , where D0 is central deflection and D 1 is the deflection at 0.3 m. The criteria values for the pavement and the subgrade classification are shown in Table 2. They relate to the measured values, corrected to standard conditions of load and temperature. All the deflection basins were corrected according to a standard load of 75 kN (16.5 kip) in a linear manner as follows:
(1)
where
Dc0; = corrected deflection for standard load of 75 kN for
ith sensor, D7 = measured deflection at Pm load for ith sensor, and Pm = load at measurement time.
The correction function of the central deflection (D 0 ) to standard temperature of 30°C (86°F) was carried out by the following equation:
Fr(Do) = 1.694 - 3.155 x 10⁻² Tp + 3.286
x 10-4 ~ - 1.667 x 10- 6 T~
TABLE2 SUBGRADE AND PAVEMENT CLASSIFICATION BASED ON NDT (micron)
Pavement Subgrade Clanlflcallon
ClaHlllcatlon Weak Medium Strong
Weak D6 >105 55< 0 8<105 08<55
SCI ;i.750 SCl;i.750 SCI ;io.750
Medium 06 >105 55< 0 6<105 08<55
350" SCI <750 350< SCI <750 350< SCI <750
Strong °" ;ir.105 55< 0 8<105 08<55
SCI <350 SCI <350 SCI <350
(2)
94
where TP is the asphalt layer temperature at time of measurement in degrees Celsius.
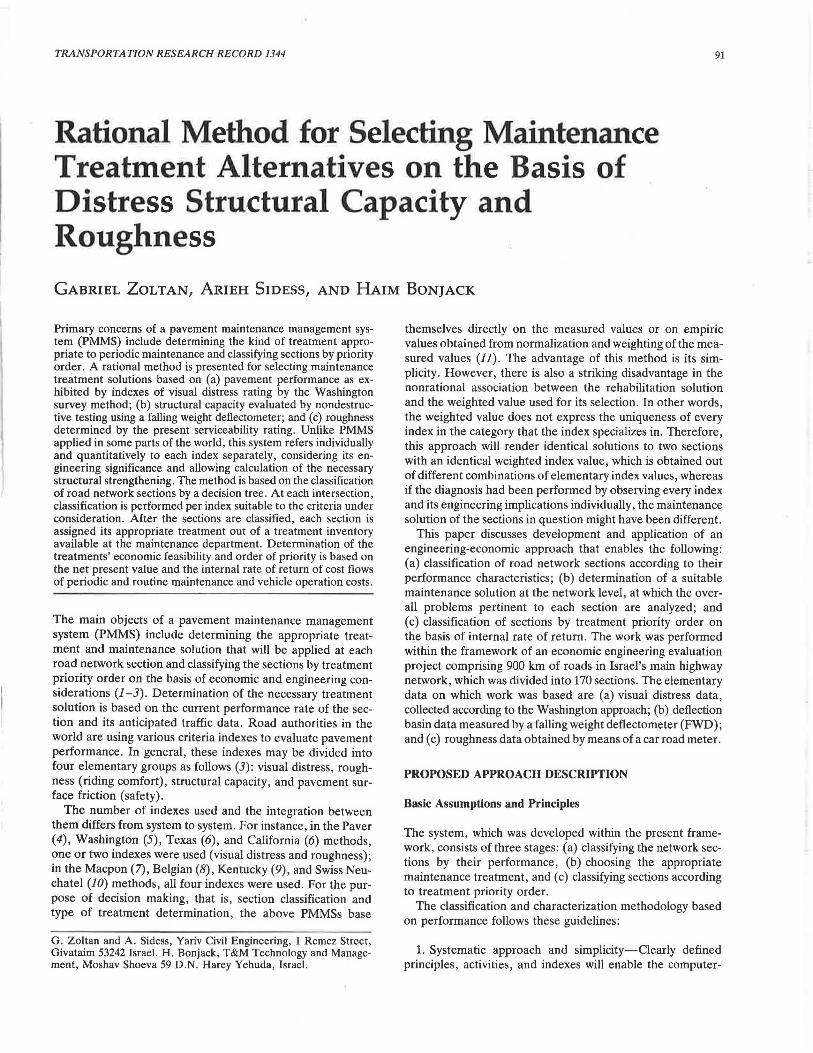
•According to these classification criteria, a parameter called structural index (SI) was defined. This index within the 0-1.0 range expresses the performance condition of the rehabilitated pavement in terms of remaining life. According to principles shown by Yariv-Civil Engineering and by Sidess et al. (12,13) the index was determined depending on pavement and subgrade categories as follows:
For a weak subgrade (D6 2:: 105 µ.m),
[
0.2 (SCI;::: 750 µ.m) Siw = 2.361 x 10⁵ SCI - 2
•112 (350 s SCI< 750 µ.m)
1.0 (SCI < 350 µ.m) (3)
For a medium subgrade (55 :S D 6 < 105 µ.m),
[
0.25 (SCI;::: 750µ.m) SIM = 4.243 x 10⁴ SCI - 1.819 (350sSCI<750µ.m)
1.0 (SCI< 350 µ.m) (4)
For a strong subgrade (D6 < 55 µ.m),
[
0.3 (SCI 2:: 750 µ.m) Sis= 1.046 x 10⁴ SC1 - 1.5o (350sSCI<750µ.m)
1.0 (SCI< 350 µ.m) (5)
It must be emphasized that there is no relationship between the numerical value of SI in the different subgrade categories. Identical SI values in different subgrade categories are not equivalent and do not express identical strength of the pavement.
• The overlay thickness design curves depending on the SI were developed on the basis of the rational approach, which relates the pavement response to major deterioration criteria such as fatigue and rutting. The adopted load distribution range is 20-180 kN (12,13) . The effect of the mixed load distribution was taken into account according to Miner hy-
e 240 E -> 200 0
:::c in 160 rn Cl)
~ 120 .2 .c
TRANSPORTATION RESEARCH RECORD 1344
pothesis (14). The fatigue criterion was adopted according to the model proposed by Finn et al. (15) with some modification recommended by Uzan (16). The model of Verstraten et al. (17) was adopted as a rutting criterion.
As an example, Figure 2 shows overlay thickness design curves depending on the SI for a medium subgrade classification. The overlay thickness is presented for various equivalent 130 kN single axle load applications, the design axle load in Israel. The other design curves for a weak and strong subgrade are shown by Yariv-Civil Engineering arid Sidess et al. (12,13).
Application of the subsystem for determinatfon overlay thickness of rehabilitated pavement consists the following stages:
1. Deflection basin measurement and asphalt temperature at the time of measurement.
2. Correction of the central deflection D 0 to the standard load level and temperature (Equations 1 and 2) and of deflections D 1 , D 6 to the standard load.
3. Calculation of the SCI parameter according to the corrected deflections D 0 and D 1 •
4. Subgrade and pavement classification according to Table 2 and SI calculation (Equations 3-5).
5. Traffic analysis for design period. 6. Overlay thickness design according to subgrade classi
fication, SI, and traffic analysis (for instance, Figure 2).
Roughness Subsystem
Roughness of the pavement surface is an expression of riding comfort (service level) and serves as an indication for user costs. Correction of roughness improves the service level and decreases operation costs, regardless if roughness treatment responds also to the problems expressed by the other indexes. The roughness correction is performed by a leveling layer, the thickness of which adds up to the required layer thickness
240
200
160
120
..... 80 >-cu
'i: Cl) 40 >
=------ 1'<106 - S>cto5 ~--
80
0
i.2 0.3 0.4 0.5 0.6 0. 7 0.8 0.9 Struc!ural Index, SIM
FIGURE 2 Overlay thickness versus SIM for medium subgrade.
0 1.0
Zoltan et al.
due to structural capacity. Calculation of the added thickness is based on the following assumptions:
• The added thickness is proportional to the present serviceability rating (PSR) value of the section, where the poor sections (PSR :=; 1.5) receive the maximum of 30 mm and satisfactory sections (PSR 2:: 3.5) are left with the original thickness.
• The required thickness addition, to improve roughness of pavement surface, is calculated only for sections whose required structural overlay thickness is less than 60 mm on the basis of the assumption that a layer of 60 mm and above can act also as leveling layer for a solution to a roughness problem.
• The total layer thickness (leveling layer + structural layer) after the roughness repair should not be less than 40 mm.
Decision Tree Description
In the detailed classification process (Figure 1), each section is being tested at up to five decision cross sections, at which the criterion indexes are examined by stages (at each intersection, only one index). When the process is completed, the sections are divided into 20 subgroups and each subgroup is assigned the appropriate treatment procedure. The first classification stages are executed with reference to the visual distress index. Initially, the sections are channeled into three main paths: (a) satisfactory sections, (b) sections with fatigue cracking, and (c) sections without fatigue cracking. Then each of the last two paths is divided into three subpaths: low-level damage, medium-level damage, and high-level damage. In the next stage, the structural capacity index is examined. At each of the seven subpaths, structural capacity evaluation is performed and the required structural strengthening (overlay) thickness is calculated. Finally, the roughness index is evaluated and, if necessary, the overlay thickness is updated. The roughness index evaluation is performed only on sections whose strengthening thickness is less than 60 mm. The subgroups with a required layer thickness of less than 60 mm are divided into two paths with reference to 30-mm criterion thickness.
Treatment Types
For each of the 20 groups obtained at the end of the classification process a suitable maintenance treatment type is assigned out of the treatment inventory available to the maintenance department. The list contains eight treatment types, based on the following activities: (a) local repairs (patching and crack sealing), (b) milling (surface or deep milling), ( c) surface treatment (slurry seal), and ( d) overlay (thickness as determined in structural evaluation process). These procedures were chosen because they are most common in a local maintenance system.
The treatment types, which are derived from an integration of the basic maintenance procedures and proposed as maintenance treatment solutions to the different decision tree paths, are as follows:
•Treatment 1: Do nothing. • Treatment 2: Surface treatment; recommended if the re
sulting layer is less than 30 mm.
95
•Treatment 3: Local repairs and surface treatment; local repairs consist of in-advance repairs at weak spots that may become sites of failure after surface treatment.
•Treatment 4: Overlay. •Treatment 5: Local repairs and overlay. • Treatment 6: Surface milling, local repairs after milling,
and surface treatment; milling is a preparation treatment at the massive cracking areas that can not be repaired by local patching.
• Treatment 7: Surface milling, local repairs after milling, and overlay.
• Treatment 8: Deep milling, local repairs after milling, and overlay.
Some remarks on treatment types follow. If milling is required, surface milling is sufficient for sections
without fatigue distress. At sections where fatigue distress was diagnosed, surface
preparation treatment in the form of local repairs or milling (or both) before the overall treatment is needed.
Deep milling of the asphaltic layer requires adding to the designed thickness a reinforcement thickness equivalent to strength losses due to the milled layer. The proportion of the milled layer thickness to the layer addition is 1:2 (to layers up to 100 mm thick). This proportion is based on translation proportions between a cracked asphalt layer (elasticity modulus of 300 MPa) and a new asphalt layer (elasticity modulus of 200 MPa). For general calculation it is assumed that the mean depth of deep milling will be 40 to 50 mm and therefore the addition will be 20 mm.
For a low distress level and the absence of fatigue distress, no surface preparation treatment is necessary.
A large-scale distress in the pavement causes unevenness to its surface and therefore requires surface preparation treatment in the form of scraping and local repairs in any case, regardless of the structural requirements.
By definition, surface treatment is applicable only in case of no or minimal distress and is not appropriate when a structural strengthening is required .
ECONOMIC EVALUATION AND PRIORITY DETERMINATION
The proposed approach enables one to carry out a detailed economic evaluation and provide indicators for setting up priorities and selecting maintenance treatment alternatives. Principle parameters taken into account are periodic maintenance treatment or rehabilitation costs, routine maintenance costs, and vehicle operation and travel time costs of road users. The difference between future costs "with project" and "without project" was calculated for the planning period; on this basis the net present value (NPV) and the internal rate of return (IRR) were determined for each road section. The priority order of sections was based on IRR.
Future vehicle operation costs flow depends on the anticipated annual PSR. The future routine maintenance flow depends upon distress development in the coming years. To refer to future vehicle operation and routine maintenance cost flows, assumptions were made concerning the character of the deterioration curves. The basic assumption is that cost savings

96
in the first year as a result of the proposed treatment will be kept the same in future years. In other words, it was postulated that the degeneration rate of a treated road, and the same road if not treated, will be such that the distress difference between the two conditions remains constant. To validate this assumption, sensitivity tests were performed to express different deterioration rates of the parameters taken into account.
Maintenance Treatment Costs
The periodical maintenance treatment costs were derived from the solution selected for each road section by the Decision Tree and based on local unit costs. The routine maintenance costs were estimated on the basis of visual distress surveys (DR), according to the Washington method. Because the experience of the authors shows that DR value is not sufficient to determine a section's routine maintenance cost, distress components derived from the DR method were used. Treatment cost was estimated separately for each distress according to its severity. The quantity of required patching was associated also with the road traffic level in a nonlinear function type AXb (b < 1).
Vehicle Operation Costs
Road users' cost (vehicles' operation costs + travelers' time cost) were calculated with the World Bank's HDM-III model (16,17) using coefficients found in studies made in Brazil. In this model the roughness input data are in terms of international roughness index (IRI), whereas in the present study the PSR index was used. So that the HDM-III model could be used, the PSR data were transformed into IRI by means of a conversion curve shown in Figure 3 (18). The economic operation costs for representative vehicles were calculated for three options: (a) variable costs only (gasoline, oil, tire, and vehicle maintenance), (b) total cost excluding travel time, and (c) total cost including travel time. The obtained operation cost functions for an average representative vehicle are as follows (see Figure 4):
Y 1 = 895 - 508(PSR) + 234(PSR)2 - 50.6(PSR)3
+ 4.l(PSR)4
10,000~~----------.
9, 000 f 8,000 §. 7,000
g; 0,000 5,000
~ 4,000· .c 3,000· g 2)000 a: 1,000
i .o 1.0 2.0 3.o 4.0 s.o Present Serviceability Rating, PSR
FIGURE 3 Conversion curve between IRR and PSR.
(6)
TRANSPORTATION RESEARCH RECORD 1344
0.8..---------'-----. E 0.7
~ 0.6
~ 0.5 ~ 0.4
~ 0.3 .,. 0.2
gi 0.1
0 ·</i.o 1.0 2.0 3.0 4.0 5.0 Present Serviceability Rating, PSR
--- TOTAL OPCOST .....- TOTAL EXC.TIME -tt- VARIABLE COST
FIGURE 4 Average vehicle operation cost by PSR level.
Y2 668 - 355(PSR) + 158(PSR)2 - 33.8(PSR)3
+ 2.7(PRS)4
Y3 398 - 267(PSR) + 118(PSR)2 - 25.l(PSR)3
+ 2.0(PSR)4
where
(7)
(8)
Y 1 = total economic vehicle operation costs (OPCOST in Figure 4) including passenger travel time per 1000 vehicle-km (in U.S. dollars).
Y2 = total economic vehicle operation costs excluding passenger travel time (EXC.TIME) per 1000 vehicle-km (in U.S. dollars).
Y3 = total variable economic vehicle operation costs (gasoline, oil, tire, and vehicle maintenance) per 1000 vehicle-km (in U.S. dollars).
It is assumed that under the local conditions a PSR target of 3.5 after road treatment completion is achievable. Yearly economy on operation costs due to periodic maintenance treatment was calculated as the difference between operation costs at the present roughness rate and that obtained at PSR = 3.5.
APPLICATION OF METHOD
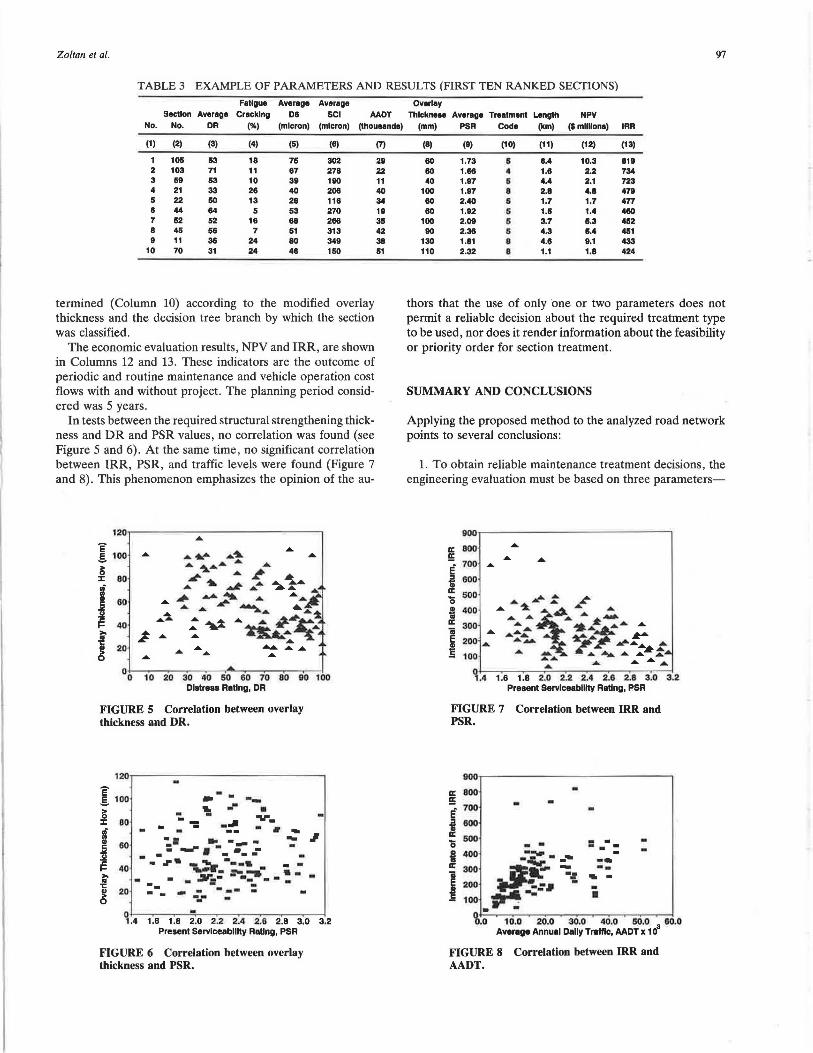
The method was applied to 170 road sections totaling 900 km (12). An example of the evaluation results for the 10 sections with the highest IRR is shown in Table 3. Through this table it is possible to understand in brief the decision-making process as related in this paper.
Columns 1 and 2 contain the identification data of the road sections. By means of DR data in Column 3, the sections were first classified according to the DR value above and below 80. The second classification cycle was performed according to fatigue distress percentage in Column 4 into sections having fatigue distress percentage above and below 20 percent. The third cycle was again performed by sorting sections into three DR subgroups. By data of the seventh deflection D 6 , SCI, and vehicle traffic level shown in Columns 5, 6, and 7, respectively, the recommended overlay thickness is calculated. The overlay thickness is modified (Column 8) according to roughness results (Column 9) and the treatment type is de-
Zoltan et al. 97
TABLE3 EXAMPLE OF PARAMETERS AND RESULTS (FIRST TEN RANKED SECTIONS)
Fatigue Average Average Section Average Cracking 08 SCI AADT
No. No. DR (%) (micron) (micron) (thouaande)
(1) (2) (3) (4) (5) (8)
1 105 53 18 75 302 2 103 71 11 87 278 3 69 53 10 39 190 4 21 33 28 40 208 5 22 60 13 28 118 8 44 84 5 53 270 7 62 52 18 88 288 8 45 56 7 51 313 9 11 38 24 80 349
10 70 31 24 48 150
termined (Column 10) according to the modified overlay thickness and the decision tree branch by which the section was classified.
The economic evaluation results, NPV and IRR, are shown in Columns 12 and 13. These indicators are the outcome of periodic and routine maintenance and vehicle operation cost flows with and without project. The planning period considered was 5 years.
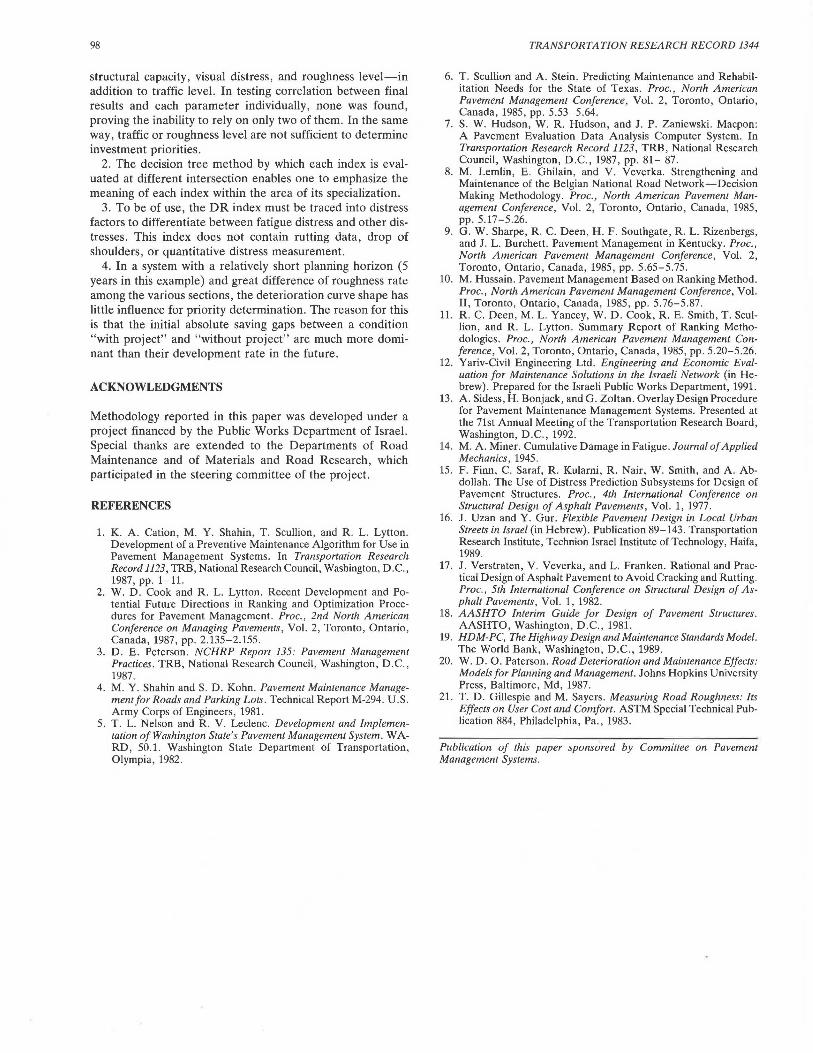
In tests between the required structural strengthening thickness and DR and PSR values, no correlation was found (see Figure 5 and 6). At the same time, no significant correlation between IRR, PSR, and traffic levels were found (Figure 7 and 8). This phenomenon emphasizes the opinion of the au-
0 o 10 20 30 40 50 60 70 80 90 100 Dla1reaa Rating, DR
FIGURE 5 Correlation between overlay thickness and DR.
e ~ --
~ 80 ":. -- ~ .r ~-- ·"" -. .. .§. 100
j:~- 60 -:.= .. _ -- - - .I ~ ----. -·- --- . ~ -
40 - " - --· • -.. -~--- ·-i: - - ..... - -- - - -'C -- - - -- - -~ 2-0 - - - -:- -
~.4 1.6 1.8 2.0 2.2 2 .4 2.6 2.8 3.0 3.2 Present Servlceablllty Rating, PSR
FIGURE 6 Correlation between overlay thickness and PSR.
(7)
29 22 11 40 34 19 35 42 38 51
Overlay Thlckneaa Average Treatment Length NPV
(mm) PSR Code (km) ($mllllone) IRR
(8) (9) (10) (11) (12) (13)
60 1.73 5 8.4 10.3 819 60 1.88 4 1.8 2.2 734 40 1.87 6 4.4 2.1 723
100 1.97 8 2.8 4.8 478 60 2.40 5 1.7 1.7 477 60 1.92 5 1.5 1.4 460
100 2.09 6 3.7 5.3 452 90 2.38 6 4.3 5.4 451
130 1.81 8 4.8 9.1 433 110 2.32 8 1.1 1.8 424
thors that the use of only ·one or two parameters does not permit a reliable decision about the required treatment type to be used , nor does it render information about the feasibility or priority order for section treatment.
SUMMARY AND CONCLUSIONS
Applying the proposed method to the analyzed road network points to several conclusions:
1. To obtain reliable maintenance treatment decisions, the engineering evaluation must be based on three parameters-
IC 800
~ 700 .........
:I 600 ~ 0500 .a.'111!'-: ~
i 400 .......... ~i ............ ~~ i ..... ............. ......... .Jt""
300 .......... ... ..... ~ ..........
-i 200.... ......... 7- ~· ........ : " 100 ..... :r-.... .... .................. ,._,. ._ ... ...... ....
~.4 1.6 1.8 2.0 2.2 2.4 2 .8 2.8 3.0 3.2 Present Servlceablllty Rating, PSR
FIGURE 7 Correlation between IRR and PSR.
IC 800 IC -: 700
i 600 IC 500 0 I 400
300
j --
FIGURE 8 Correlation between IRR and AADT.
98
structural capacity, visual distress, and roughness level-in addition to traffic level. In testing correlation between final results and each parameter individually, none was found, proving the inability to rely on only two of them. In the same way, traffic or roughness level are not sufficient to determine investment priorities.
2. The decision tree method by which each index is evaluated at different intersection enables one to emphasize the meaning of each index within the area of its specialization.
3. To be of use, the DR index must be traced into distress factors to differentiate between fatigue distress and other distresses. This index does not contain rutting data, drop of shoulders, or quantitative distress measurement.
4. In a system with a relatively short planning horizon (5 years in this example) and great difference of roughness rate among the various sections, the deterioration curve shape has little influence for priority determination. The reason for this is that the initial absolute saving gaps between a condition "with project" and "without project" are much more dominant than their development rate in the future.
ACKNOWLEDGMENTS
Methodology reported in this paper was developed under a project financed by the Public Works Department of Israel. Special thanks are extended to the Departments of Road Maintenance and of Materials and Road Research, which participated in the steering committee of the project.
REFERENCES
1. K. A . Cation, M. Y. Shahin, T . Scullion, and R. L. Lytton. Development of a Preventive Maintenance Algorithm for Use in Pavement Management Systems. In Transportation Research Record 1123, TRB, National Research Council, Washington, D.C., 1987, pp. 1-11.
2. W. D. Cook and R. L. Lytton. Recent Development and Potential Future Directions in Ranking and Optimization Procedures for Pavement Management. Proc., 2nd North American Conference on Managing Pavements , Vol. 2, Toronto , Ontario, Canada, 1987, pp . 2.135-2.155.
3. D. E. Peterson. NCHRP Report 135: Pavement Management Practices. TRB, National Research Council, Washington, D.C., 1987.
4. M. Y. Shahin and S. D . Kohn. Pavement Maintenance Management for Roads and Parking Lots. Technical Report M-294 . U.S. Army Corps of Engineers, 1981.
5. T . L. Nelson and R. V. Leclenc. Development and Implementation of Washington State's Pavement Management System. WARD, 50.1. Washington State Department of Transportation, Olympia, 1982.
TRANSPORTATION RESEARCH RECORD 1344
6. T. Scullion and A. Stein. Predicting Maintenance and Rehabilitation Needs for the State of Texas. Proc., North American Pavemen/ Management Conference, Vol. 2, Toronto, Ontario, Canada, 1985, pp. 5.53-5.64.
7. S. W. Hudson, W. R. Hudson , and J. P. Zaniewski . Macpon: A Pavement Evaluation Data Analysis Computer System. In Transportation Research Record 1123, TRB, National Research Council, Washington, D.C., 1987, pp. 81- 87.
8. M. Lemlin, E. Ghilain, and V. Veverka. Strengthening and Maintenance of the Belgian National Road Network-Decision Making Methodology. Proc., North American Pavement Managemen/ Conference, Vol. 2, Toronto, Ontario, Canada, 1985, pp. 5.17-5 .26.
9. G. W. Sharpe , R. C. Deen, H.F. Southgate, R . L. Rizenbergs, and J. L. Burchett. Pavement Management in Kentucky. Proc., Norlh American Pavement Managemen/ Conference, Vol. 2, Toronto, Ontario, Canada, 1985, pp . 5.65-5.75.
10. M. Hussain. Pavement Management Based on Ranking Method . Proc., North American Pavement Management Conference , Vol. II, Toronto, Ontario, Canada, 1985, pp. 5.76-5.87 .
11. R. C. Deen, M. L. Yancey, W. D. Cook, R. E . Smith, T. Scullion, and R. L. Lytton. Summary Report of Ranking Methodologies. Proc., Norlh American Pavement Management Conference, Vol. 2, Toronto, Ontario, Canada, 1985, pp. 5.20-5.26.
12. Yariv-Civil Engineering Ltd . Engineering and Economic Evalualion for Maintenance Solutions in the Israeli Network (in Hebrew). Prepared for the Israeli Public Works Department, 1991.
13. A. Sidess, H . Bon jack, and G. Zoltan. Overlay Design Procedure for Pavement Maintenance Management Systems. Presented at the 71st Annual Meeting of the Transportation Research Board, Washington, D.C., 1992.
14. M. A. Miner. Cumulative Damage in Fatigue. Journal of Applied Mechanics , 1945 .
15 . F. Finn, C. Saraf, R. Kularni, R. Nair, W. Smith, and A. Abdallah. The Use of Distress Prediction Subsystems for Design of Pavement Structures. Proc., 4th Inlernational Conference on Structural Design of Asphalt Pavements, Vol. 1, 1977.
16. J. Uzan and Y. Gur. Flexible Pavement Design in Local Urban Streets in Israel (in Hebrew) . Publication 89-143. Transportation Research Institute, Technion Israel Institute of Technology, Haifa, 1989.
17. J. Verstraten, V. Veverka, and L. Franken. Rational and Practical Design of Asphalt Pavement to Avoid Cracking and Rutting. Proc., 5th International Conference on Structural Design of Asphalt Pavements, Vol. 1, 1982.
18. AASHTO Interim Guide for Design of Pavement Structures . AASHTO, Washington, D.C. , 1981.
19. HDM-PC, The Highway Design and Maintenance Standards Model. The World Bank, Washington, D .C., 1989.
20. W. D. 0. Paterson. Road Deterioration and Maintenance Effects: Models for Planning and Management. Johns Hopkins University Press, Baltimore , Md, 1987.
21. T. D. Gillespie and M. Sayers. Measuring Road Roughness: Its Effects on User Cost and Comfort. ASTM Special Technical Publication 884, Philadelphia, Pa., 1983.
Publication of this paper sponsored by Committee on Pavement Management Systems.


![Impact Sarbanes Oxley Act Security 1344[1]](https://static.fdocuments.us/doc/165x107/577d33c11a28ab3a6b8ba601/impact-sarbanes-oxley-act-security-13441.jpg)

![[Doc 1344] 4-24-2015 Govt Motion to Exclude Exhibits](https://static.fdocuments.us/doc/165x107/56d6bf611a28ab3016960297/doc-1344-4-24-2015-govt-motion-to-exclude-exhibits.jpg)