
Ratings Credit quality Round-Up improvement sustains ... · Key reasons for rating actions, and...
48
Ratings Round-Up Fiscal 2018 Credit quality improvement sustains through the year
Transcript of Ratings Credit quality Round-Up improvement sustains ... · Key reasons for rating actions, and...

Ratings
Round-Up Fiscal 2018
Credit quality
improvement sustains
through the year

Analytical contacts
Pawan Agrawal
Chief Analytical Officer
Somasekhar Vemuri
Senior Director
Krishnan Sitaraman
Senior Director
Vimal Chhabria
Associate Director
Sushama Kambhampati
Associate Director
Gurninder Kaur Aurora
Senior Executive

1
Executive summary ............................................................................................ 2
About Ratings Round-Up .................................................................................... 4
CRISIL’s portfolio and median rating unchanged ............................................... 4
Both credit and debt-weighted credit ratios remain above 1 time ..................... 5
Capital structure, debt protection metrics continue to improve ........................ 9
Changes mostly of one notch ............................................................................ 13
Improvement in credit ratio broad-based, across consumption,
investment and exports-linked sectors ............................................................ 14
Exports recovery supported by synchronised global growth, but risks
remain .............................................................................................................. 15
Outlook ............................................................................................................. 16
Key reasons for rating actions, and sectoral credit quality outlook:
Corporates ........................................................................................................ 18
Sectoral credit quality outlook: Banks and financial institutions ..................... 34
Contents

2
India Inc’s credit landscape remains a tale of two distinct loan books – the
good one, which is improving, and the bad one, with sizeable stressed assets
(~Rs 11.5 lakh crore, or ~14% of bank advances1 as on March 31, 2017) where
resolution has begun.
CRISIL’s credit ratio2 (or number of upgrades vs downgrades), which printed at
1.45 times in the second half of fiscal 2018, continues to reflect the
improvement in the good loan-book, though it has moderated from the levels
seen in the first half.
There were 1,4023 upgrades to 8393 downgrades in fiscal 2018.
Upgrades outnumbered downgrades in the good loan-book on the back of
better financial indicators due to lower capital expenditure (capex) and record
equity issuances. Continued headroom in capacity utilisation across sectors
made corporates go slow on capex, even as India Inc raised a record amount of
equity – Rs 1.75 lakh crore in the ten months ended January 31, 2018.
CRISIL-rated companies have shown steady improvement in capital structure
and debt protection metrics over the past four years. The median gearing of
companies improved to 1.0 time in fiscal 2018 from 1.37 times in fiscal 2015,
whereas median interest cover improved to 2.83 times from 2.29 times.
The debt-weighted4 credit ratio2 stood at 1.53 times in the second half of fiscal
2018. Credit quality of debt-intensive sectors such as metals (especially non-
ferrous), mid-sized EPC (engineering, procurement and construction), and
select capital goods improved on account of higher commodity prices and
government’s focus on infrastructure spending.
As for the bad loan-book, CRISIL expects resolution of stressed assets to
provide much-needed respite from fiscal 2019 onwards, and the stock of gross
non-performing assets (GNPAs) to peak.
While resolution of the large-ticket corporate NPAs already referred to the
National Company Law Tribunal (NCLT) – under the Insolvency and Bankruptcy
Code (IBC) route – could result in a reduction in GNPAs, this may be offset by
recognition of new NPAs stemming from recent revisions to the resolution
framework for stressed assets by the Reserve Bank of India (RBI).
1 Most of these stressed assets were either not rated by CRISIL or would have been downgraded to a ‘Default’ or ‘CRISIL D’ rating in the
past and have not seen any significant change in their credit quality since then 2 Both credit ratio and debt-weighted credit ratio do not factor in rating actions on non-cooperative issuers 3 Including the rating actions on non-cooperative clients, there were 1,467 upgrades and 1,975 downgrades in fiscal 2018 4 Quantum of debt outstanding on the books of the companies upgraded to downgraded (excludes financial sector players)
Executive
summary

3
Effective monitoring of credit quality as well as resolution of stress requires
co-operation from the borrowers. From 2017, the Securities and Exchange
Board of India (SEBI) has mandated rating agencies to continue surveillance of
ratings assigned to non-cooperative issuers on a best-effort basis.
The assessment of such non-cooperative issuers carry a risk of information
inadequacy, which is factored into rating actions. Including rating actions on
non- cooperative borrowers, the credit ratio for fiscal 2018 stood at 0.74 time,
or considerably lower than the 1.67 times for cooperative issuers.
Going forward, barring the stressed assets, CRISIL expects corporate credit
quality to continue recovering on the back of firming up of domestic
consumption and global demand, stable operating cycles, and steady
commodity prices.
Any aversion to lending by banks as a fallout of recent events, continued
slowness in exports growth due to disruptions in global trade, prolonged
working capital stretch due to Good and Services Tax (GST), leverage levels in
corporate balance sheets, and progress in resolution of stressed assets will
remain the key monitorables.
CRISIL continues to maintain sharp focus on the quality of its ratings and
strives to minimise sudden and sharp rating actions (upgrades and
downgrades). Investors also expect ratings in the ‘A’ and above categories to
display a lot of stability. CRISIL’s portfolio of 1,187 ratings in these categories
saw 1455 rating actions in fiscal 2018, of which only 146 were multi-notch
changes.
5 This is based on the number of instances of rating actions and could include multiple ratings actions of the same company during the
year 6 Excludes ratings placed on ‘Rating Watch’, which is used to convey to investors that the rating is being monitored for certain critical
events and that additional information is awaited. This helps reduce the possibility of any surprise for the investors.
4
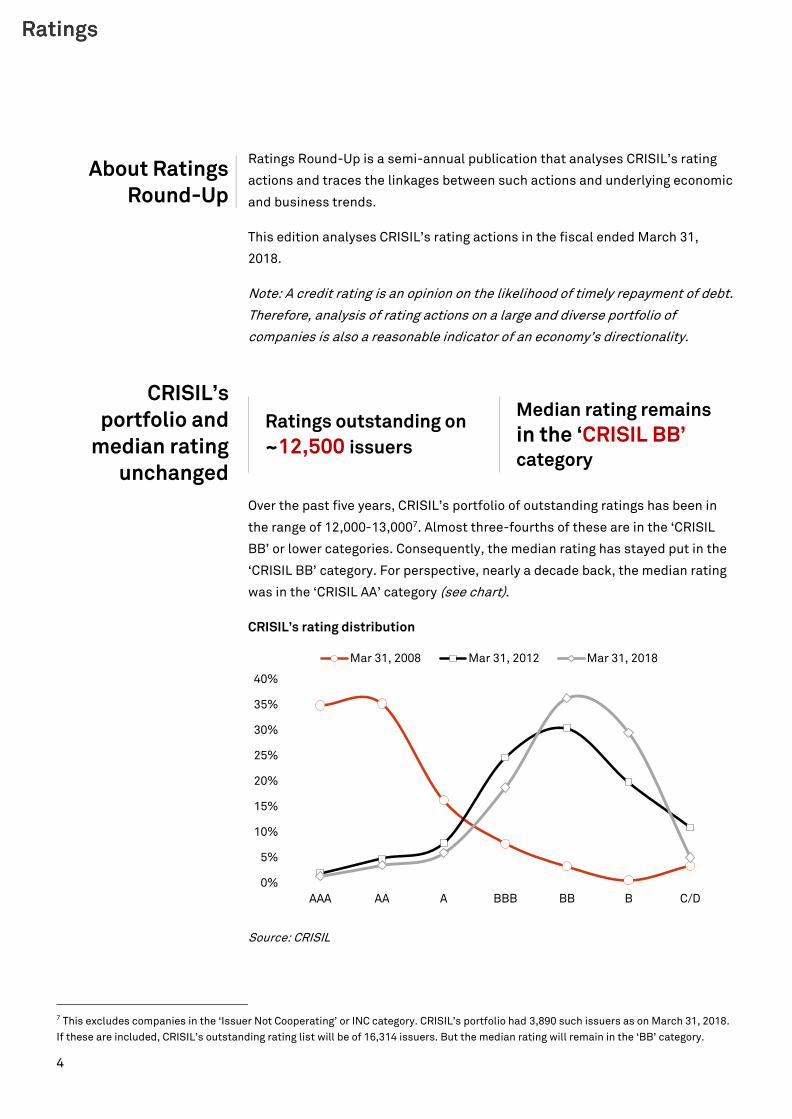
Ratings Round-Up is a semi-annual publication that analyses CRISIL’s rating
actions and traces the linkages between such actions and underlying economic
and business trends.
This edition analyses CRISIL’s rating actions in the fiscal ended March 31,
2018.
Note: A credit rating is an opinion on the likelihood of timely repayment of debt.
Therefore, analysis of rating actions on a large and diverse portfolio of
companies is also a reasonable indicator of an economy’s directionality.
Ratings outstanding on
~12,500 issuers
Median rating remains
in the ‘CRISIL BB’ category
Over the past five years, CRISIL’s portfolio of outstanding ratings has been in
the range of 12,000-13,0007. Almost three-fourths of these are in the ‘CRISIL
BB’ or lower categories. Consequently, the median rating has stayed put in the
‘CRISIL BB’ category. For perspective, nearly a decade back, the median rating
was in the ‘CRISIL AA’ category (see chart).
CRISIL’s rating distribution
Source: CRISIL
7 This excludes companies in the ‘Issuer Not Cooperating’ or INC category. CRISIL’s portfolio had 3,890 such issuers as on March 31, 2018.
If these are included, CRISIL’s outstanding rating list will be of 16,314 issuers. But the median rating will remain in the ‘BB’ category.
0%
5%
10%
15%
20%
25%
30%
35%
40%
AAA AA A BBB BB B C/D
Mar 31, 2008 Mar 31, 2012 Mar 31, 2018
About Ratings
Round-Up
CRISIL’s
portfolio and
median rating
unchanged

5
Credit ratio at 1.45 times
and debt-weighted
credit ratio at 1.53 times
for the second half of
fiscal 2018
Credit ratio at 1.67 times
and debt-weighted
credit ratio at 2.31 times
for fiscal 2018
CRISIL’s credit ratio and debt-weighted credit ratio stood at 1.67 times and
2.31 times, respectively, for fiscal 2018 (see chart). That’s better than the 1.22
times and 0.88 time, respectively, in fiscal 2017.
The moderation from the first half of fiscal 2018, when the credit ratio was 1.88
times and debt-weighted credit ratio was 3.19 times, was on expected lines.
In the previous Ratings Round-Up published in October 2017 and titled
‘Improving financial profiles sustain credit quality recovery’, CRISIL had
expected moderation due to uncertainties on account of change in tax regime
over the short-term (GST), subdued growth in India’s export, and weak
domestic investments limiting the upside of GDP growth.
Semi-annual trends in credit ratio and debt-weighted credit ratio
Source: CRISIL
To ascertain the sustainability of the credit quality improvement, we need to
assess these ratios on a longer timeframe (12 months basis) to avoid period
bias. Both these ratios remain well above 1 time on that basis (see chart).
0.00
0.50
1.00
1.50
2.00
2.50
3.00
3.50
H1
-14
H2
-14
H1
-15
H2
-15
H1
-16
H2
-16
H1
-17
H2
-17
H1
-18
H2
-18
(tim
es
)
Credit ratio Debt weighted credit ratio
Both credit and
debt-weighted
credit ratios
remain above
1 time

6
12 months rolling credit ratio and debt-weighted credit ratio
Source: CRISIL
With both domestic and global demand expected to improve, and transitory
impact of demonetisation and GST fading out, we expect credit quality
improvement to sustain in fiscal 2019. Exports-related sectors should also
benefit from strengthening global growth and ironing out of GST issues. Also,
budgetary fillip to rural consumption and implementation of the Seventh Pay
Commission recommendations at the state level will strengthen consumption
demand. Hence, consumption-related sectors are expected to benefit.
Investments, though expected to improve, will only see a gradual recovery.
Increase in consumption demand would lead to higher utilisation rates, thus
creating some demand for new investments.
The downgrade rate of 5.9% in fiscal 2018 is the lowest recorded in the past
five fiscals, indicating a sustained recovery in credit quality, which helps the
credit ratio sustain well above 1 time for the fourth consecutive fiscal.
0.00
0.50
1.00
1.50
2.00
2.50
Ma
r-1
3
Se
p-1
3
Ma
r-1
4
Se
p-1
4
Ma
r-1
5
Se
p-1
5
Ma
r-1
6
Se
p-1
6
Ma
r-1
7
Se
p-1
7
Ma
r-1
8
Credit ratio Debt-weighted credit ratio

7
Trends in rating action
Source: CRISIL
Consumption-linked sectors such as pharmaceuticals, agricultural products,
auto components and packaged foods continued to drive upgrades, whereas
downgrades continued to be dominated in investment-linked sectors such as
real estate and independent power producers, especially thermal.
Issuers not cooperating
CRISIL’s credit ratings on debt obligations represent its opinion on the
likelihood of obligations being repaid in full, and on time. The ratings indicate
CRISIL’s current opinion on the probability of default on the instruments. It
takes into account public and non-public information about the firm to
provide a forward-looking assessment of credit quality. Hence, effective
monitoring of credit quality requires cooperation from the borrowers.
SEBI’s circular, ‘Enhanced standards for credit rating agencies (CRAs)’ issued
on November 1, 2016, makes it mandatory for CRAs to continue to rate non
cooperative issuers on a best effort basis.
To highlight non-cooperation of issuers, SEBI has insisted ratings will use the
suffix ‘Issuer not cooperating’. This represents a change from earlier industry
practice of ‘Suspension of Ratings’. Assessment of such non-cooperative
issuers carry a risk of information inadequacy, which is factored into rating
actions.
In early 2017, CRISIL put together a framework (Framework for Assessing
Information Adequacy Risk published in September 2017) to assess the risk of
0.0%
3.0%
6.0%
9.0%
12.0%
15.0%
18.0%
21.0%
24.0%
FY
-09
FY
-10
FY
-11
FY
-12
FY
-13
FY
-14
FY
-15
FY
-16
FY
-17
FY
-18
Upgrade rate (annualised) Downgrade rate (annualised)
Average upgrade Rate Average downgrade rate
Downgraded
rate at the
lowest level
8
information adequacy when reviewing a rating on such non-cooperative
issuers. Based on this framework, CRISIL takes appropriate rating action to
align the rating to what is commensurate with the assessment under the
information adequacy framework.
CRISIL’s portfolio had 3,890 such issuers as on March 31, 2018. If these are
included, CRISIL’s outstanding rating list will be of 16,314 issuers.
Including the rating actions on non-cooperative borrowers, the credit ratio for
fiscal 2018 stood at 0.74 time, or considerably lower than 1.67 times for
cooperative issuers.

9
Gearing and
coverage ratio
improve
Working capital
cycle remains
largely stable
Several companies saw their credit profiles continue to improve due to
healthier financial risk profiles. Stable revenue growth and profitability, along
with a general absence of capex (especially debt-funded), and capital infusion
(through record equity issuances/unsecured loans from promoters or
market/asset sales), were the catalysts here.
Higher prices in commodity-linked sectors and ability to pass on higher cost
because of sustained demand in consumption-linked sectors helped
companies maintain or improve profitability in fiscal 2018. That, along with
largely stable working capital cycle, lower debt, and declining interest costs
improved debt protection metrics and financial risk profiles.
Strengthening economic activity and receding impact of demonetisation and
GST will bolster domestic demand and help the cause of corporate profitability.
Since January 2015, the RBI has cut its policy – or repo – rate by 175 basis
points. The transmission of this through bank lending rate cuts gathered pace
in fiscal 2017 because of excess liquidity following demonetisation. That, in
turn, reduced the interest cost for companies.
Equity issuances – public and private placements – have seen good buoyancy
with a record Rs 1.75 lakh crore already raised in the ten months ended January
31, 2018 – which is 40% more than the previous high of Rs 1.2 lakh crore in
fiscal 2011.
Capital
structure, debt
protection
metrics continue
to improve

10
Equity issuances (public and private placements)**
* For April-January 2018
**Public equity issues include IPO, FPO, and Rights issues of common equity shares. Private
placement of equity includes amount raised through preferential allotments, QIP, and IPP
mechanism.
Source: SEBI Bulletin
An analysis of a static pool8 of CRISIL-rated companies shows that capital
structure (as reflected in gearing) and debt protection metrics (as reflected in
interest cover) have been improving even as working capital cycle has remained
stable.
The median gearing of companies improved to 1 time at the end of fiscal 2018,
from 1.37 times at the end of fiscal 2015, while median interest cover
strengthened to 2.83 times from 2.29 times.
This data set is diverse in terms of rating categories, sectors, and size (in terms
of operating income), and hence reflects trends within the CRISIL-rated
portfolio well and reiterates the broad-based improvement in metrics.
8 The static pool consists of around 7,000 CRISIL-rated companies (excluding companies in the financial sector and those which are yet to
commence operations), where CRISIL has had a rating coverage of at least three years in the past five fiscals or where financials are
consistently available for the five fiscals ended March 31, 2018. The pool is reflective of CRISIL’s rated portfolio with the median rating of
the pool also being in the ‘BB’ category.
-
200
400
600
800
1,000
1,200
1,400
1,600
1,800
2,000
FY11 FY12 FY13 FY14 FY15 FY16 FY17 Jan-18*
(₹ billion)

11
Trends in median gearing
Source: CRISIL
Trends in median interest cover
Source: CRISIL
0.90
1.00
1.10
1.20
1.30
1.40
1.50
FY13 FY14 FY15 FY16 FY17 FY18(P)
(times)
2.00
2.20
2.40
2.60
2.80
3.00
FY13 FY14 FY15 FY16 FY17 FY18 (P)
(tim
es
)

12
Trends in median working capital cycle (GCA9 days)
Source: CRISIL
9 GCA: Gross current assets
120
125
130
135
140
145
150
155
160
FY13 FY14 FY15 FY16 FY17 FY18(P)
(da
ys
)
GCA days

13
90% of rating actions
were of low intensity
Only 14 actions
were multi-notch
Sharp and sudden rating actions (upgrades and downgrades) from higher rating
categories (‘A-’ and above) are not desirable. Investors also expect such ratings
to show a high degree of stability. Rapid rating changes lead to steep cliffs (in
terms of returns) for investors, and leave them with little scope to manage their
exposure.
In fiscal 2018, there were 14510 rating actions in the ‘A’ and above category out
of a portfolio of 1,187 ratings in these categories. Of these, only 1411 were
multi-notch changes (high intensity), while the rest were all single notch (low
intensity).
10 This is based on number of instances of rating actions and could include multiple rating actions on the same company. 11 Excludes ratings placed on ‘Rating Watch’, which is used to convey to investors that the rating is being monitored for certain critical
events and that additional information is awaited. This helps reduce the possibility of surprise for the investors.
Changes mostly
of one notch

14
Consumption-linked
sectors continue to
fare better
Some investment-
linked sectors show
improvement
The improvement in the credit ratio in fiscal 2018 was broad-based, spanning
consumption, investment, and exports-linked sectors compared with the
previous fiscal.
Consumption-linked sectors continued to witness more upgrades than
downgrades in the second half of fiscal 2018. They benefitted from improving
as well as pent-up demand after demonetisation and GST, benign inflation and
implementation of the Seventh Pay Commission recommendation by states.
Higher commodity prices and relatively better demand aided a rebound in
commodity-linked sectors such as steel and non-ferrous metals. That, along
with continuous improvement in mid-sized EPC players, helped improve the
credit ratio for the investment-linked sectors, too. Nevertheless, some
investment-linked sectors remained fragile. For example, credit quality
remains weak in the real estate, thermal power producers, and capital goods
sectors, where demand outlook remains subdued and capex cycle is yet to pick
up.
Exports-linked sectors benefited from a recovery in world trade growth. They
could have done even better had there been no impact of GST.
Rating actions on top industries
(Refer to the section on ‘Key reasons for rating actions, and sectoral credit quality outlook’ for
sectoral updates)
Source: CRISIL
0.00
1.00
2.00
3.00
4.00
5.00
6.00
7.00
Re
al
Es
tate
Po
we
r p
rod
uc
ers
Co
ns
tru
cti
on
Ma
teri
als
Co
ns
tru
cti
on
&
En
gin
ee
rin
g
Ste
el
Te
xti
les
Pa
ck
ag
ing
Au
to-c
om
po
ne
nts
Pa
ck
ag
ed
Fo
od
s
Ag
ric
ult
ura
l
Pro
du
cts
Ph
arm
ac
eu
tic
als
Investment-linked
sectors
Consumption and export-linked
sectors
Improvement in
credit ratio
broad-based,
across
consumption,
investment and
exports-linked
sectors

15
India’s exports grew
10.6% in the first eight
months of fiscal 2018
4.4 % IMF forecast on
global growth in 2018
In January 2018, the International Monetary Fund (IMF) forecast that world
trade volume would grow 4.6% and 4.4% in calendar years 2018 and 2019,
respectively, after the 4.7% growth seen in 2017.
The momentum is expected to sustain on account of pick-up in investments,
particularly among advanced economies, and increased manufacturing output
in Asia. Recent tax reforms and associated fiscal stimulus should raise growth
in the US. Sustained domestic demand supported by strong labour market and
wage increases, and healthy global demand, will benefit the European Union
(EU).
Accordingly, S&P Global Ratings has marked up its forecast for 2018 and 2019
for the US and the EU, considering the boost to economic growth from large
fiscal stimulus in the former, and labour market improvements in the latter.
However, increasing inward-looking policies and geopolitical tensions pose
risks to these estimates.
S&P Global’s GDP growth forecasts for major trade destinations
Countries 2015 2016 2017(e) 2018(f) 2019(f)
Eurozone (excluding the UK) 2.0% 1.8% 2.5% 2.0% 1.7%
UK 2.3% 1.9% 1.8% 1.0% 1.3%
US 2.9% 1.5% 2.3% 2.8% 2.2%
China 6.9% 6.7% 6.9% 6.5% 6.3%
During the first eight months of fiscal 2018, India’s exports grew 10.6% versus
3.1% in the comparable period of fiscal 2017.
However, the extent of growth was capped on account of the transient impact
of GST implementation. Delays in GST refunds impacted business activity,
especially of micro, small and medium enterprises (MSMEs), by way of paucity
of working capital. This is reflected in exports slowdown in sectors such as
gems and jewellery, readymade garments, and leather, which mostly comprise
MSMEs.
Exports growth is expected to recover in fiscal 2019 backed by expected
improvement in global growth. However, persistent GST issues and India’s
reduced competitiveness compared with Asian peers pose key risks.
Exports
recovery
supported by
synchronised
global growth,
but risks remain

16
In fiscal 2018, the Indian economy recovered steadily from the twin shocks of
demonetisation and transition to GST. We expect this recovery to continue in
fiscal 2019, helped by both domestic and global factors.
We expect domestic demand to improve with the transitory impact of the twin
shocks abating. That, coupled with central budgetary focus on improving rural
spending power, implementation of the Seventh Pay Commission
recommendation by states, benign inflation and expectation of another spell of
normal monsoon will lend support to consumption growth. Also, the
synchronised upturn in the global economy should provide some tailwinds to
exports.
However, rising global protectionism, faster-than-expected rate increases by
central banks, geopolitical events impacting crude oil prices, and potential
inability of corporates, especially small and mid-sized firms, to access
alternative channels for credit to counter the recent measure by the RBI to ban
banks from issuing letter of comfort/ letter of undertaking will be the key
monitorables and may derail growth, if persistent.
Real investment growth is expected to pick up in fiscal 2019 led by the public
sector. However, the recovery will be gradual as capacity overhang will
continue to discourage broad-based private investments. Increasing demand,
both in domestic and export markets, could lead to higher capacity utilisation,
which would support investments going forward. Furthermore, speeding up of
the NPA resolution via the IBC, and recapitalisation of public sector banks
could also support growth.
CRISIL expects corporate credit quality improvement to sustain, driven by
persistent buoyancy in commodity prices, rising industrial activity, expectation
of better rural demand, and improving financial metrics.
Upgrades will continue to outnumber downgrades based on our expectation of
relatively better GDP growth in fiscal 2019, recovery in global trade and a
gradual pick-up in the investment cycle.
Outlook

17
The risks to these expectations are:
● Below-normal monsoon and subsequent slowdown in consumption
demand
● Slowdown in India’s major trade destinations
● Prolonged glitches in GST weakening recovery in exports growth
● Delay in progress of resolution of stressed assets and recovery of banking
sector
● Re-leveraging due to increase in capex and acquisitions.

18
Key reasons for rating actions, and sectoral
credit quality outlook: Corporates
Note: Size of the bubble depicts book debt in the sector of CRISIL-rated portfolio
*Also the bubble chart for thermal power producers excludes book debt of NTPC
Source: CRISIL
CRISIL expects corporates to benefit from sustained consumption demand,
improving financial metrics, firm commodity prices, benign inflation and
favourable interest rates. Sectors that are turning around, such as steel and
basmati rice, are expected to witness improvement due to higher realisation
and better demand. In addition, the transport and logistics sector is expected
to benefit from improving operating efficiency due to implementation of GST
and better economic growth prospects.
Yet, some investment-linked sectors such as real estate, thermal power plants,
and capital goods continue to face headwinds given subdued demand.
Telecommunication services is facing intense competition. Sectors such as
readymade garment exports are facing the heat because of delay in tax refunds
after implementation of GST.
Metals - Non-
Ferrous
Sugar
Construction &
Engineering
Organised
Retail
Auto Parts &
Equipment
Airports
Pharmaceuticals
CementMetals - Ferrous
Basmati Rice
Transport & Logistics
Real Estate
Capital goods
Telecommunica
tion ServicesThermal Power
producers
Textiles - RMG
20
18
-1
9
Cre
dit
qu
ali
ty O
utl
oo
k
Weak
Str
on
gW
ea
k
Credit quality trends
2017-18
Turning around Steady and stable
Remain fragile Weakening
Strong

19
Upgrades Downgrades
Upgrades were driven by
business-related reasons:
healthy demand for two-
wheelers and passenger vehicles
in the domestic market, leading
to strong demand from original
equipment manufacturers
(OEMs), and consequently,
steady profitability, resulting in
higher cash accruals. Prudent
capex and working capital
management ensured adequate
liquidity which led to better
financial risk profiles.
Weak operating performance due
to reduced demand from the
commercial vehicle (CV) segment
in the first quarter of fiscal 2018
and stretched liquidity, especially
stretch in receivables, and GST-
related issues impacted
performance. Most downgrades
were at the lower end of the
rating spectrum.
Automotive components advanced towards higher growth
Demand for automotive components is on an uptick driven by broad-based
growth across vehicle segments/markets and higher realisation. CRISIL
expects the automotive components industry to grow 12-14% in fiscal 2019,
higher than the estimated growth of 11-13% for fiscal 2018.
Higher realisations are on account of passing on of increases in raw material
prices and in the cost of components due to changing regulatory norms.
Higher disposable incomes, new model launches, and benign interest rates will
continue to drive strong growth in the passenger vehicle and two-wheeler
segments. Besides, CV sales, which reported double-digit growth for the 11
months through February 2018, are likely to witness steady growth in the near
term. Thus, OEM-led demand is expected to remain healthy in fiscal 2019. Any
favourable policy change, such as implementation of voluntary vehicle fleet
modernisation programme, will provide an additional impetus to growth.
Growth in the aftermarket segment is expected to be steady at 7-9% in fiscal
2019 as uncertainties related to GST fade.
Recovery of exports will continue in fiscal 2019, largely aided by sales in North
America and Europe. Moreover, India’s growing prominence as a low-cost
manufacturing hub of automotive components will help players penetrate new
markets.
Automotive
components
20
Demand over the medium term will be driven by advancement of technologies
and more stringent regulatory norms on safety and emission standards.
Profitability of automotive component makers is expected to remain stable
despite higher input cost. Raw material prices are expected to have risen 3-5%
in fiscal 2018. This, however, was offset by higher utilisation because of
increased demand from OEMs and better product mix because of rising
exports. Profitability will also be supported by growth in realisation from
certain components due to the implementation of stricter emission norms.
Demand-led capex cycle resumed gradually in fiscal 2018. Suppliers to
passenger vehicles and two-wheelers, which were operating at high utilisation
rates, are leading the capex cycle. The strong growth in CV sales volume in
recent months may prompt investments for CV suppliers as well, especially if
the vehicle scrapping policy is initiated. Capex is expected to rise in this sector
as players upgrade technology to meet new regulatory and safety norms. In
addition, government focus on electric vehicles may lead to small but gradual
investment in related technology. Financial prudence exhibited by companies
in recent years – by way of sweating of existing assets – has led to an
improvement in financial risk profile. While there is increasing need for capital
spending, higher cash flow backed by strong demand will help companies
broadly sustain their financial risk profile. Nevertheless, the quantum and
funding mix of expansion will be key monitorables.

21
Upgrades Downgrades
Most of the upgrades were in
the non-investment grade rating
category. Higher capacity
utilisation, high commodity
prices, and better demand led
to an improvement in business
risk profile of companies.
Downgrades were mainly on
account of stretch in working
capital cycle, primarily because
of increase in inventory.
Three-fourths of the downgrades
were to the default category
because of delays in debt
servicing, driven by stretched
working capital cycle.
Siginificantly better exports sales realisations alleviate
pressure after 3 consecutive years of revenue decline
India exported 4 million tonne (MT) of basmati rice valued at Rs 21,604 crore in
fiscal 2017. That was a decrease of 1% volume and 4.9% by value on-year (4.04
MT and Rs 22,718 crore, respectively, in fiscal 2016). Lower sales realisations
had hit exporters hard in each of the three consecutive fiscals through 2017.
These challenges eased in April-December 2017 as average exports sales
realisations improved by 23% to Rs 6,457 per quintal over the corresponding
period in the previous year. The exports volumes in the same period remained
unaffected at about 2.9 million metric tonnes (MMT).
Paddy prices increased in the current rice procurement season, these are
expected to be passed on by exporters to their overseas buyers during 2018-19.
Therefore, CRISIL expects credit risk profiles of basmati rice exporters to
improve over the medium term owing to better operating profitability levels and
stable demand in the overseas market.
Basmati rice

22
Upgrades Downgrades
Majority of the upgrades were
supported by healthy orders as a
result of customer additions or
steady order inflow. Improvement in
financial risk profile was driven by
better-than-expected capital
structure and debt protection
metrics due to higher accrual and
moderate debt.
Delayed allocation of work contracts
and intense competition in the
roads and bridges segment led to a
decline in sales for some players.
Stretched working capital cycle,
primarily on account of increasing
inventory due to slow execution of
large orders, also led to
downgrades.
Note: Credit profile of many large, diversified EPC players remains constrained by the
after-effects of aggressive bidding in the past, leveraged balance sheet, and policy
bottlenecks. Many of these companies are in the process of debt resolution. These are
rated ‘D’ and have seen no change in their ratings. Hence, the analysis excludes
stressed assets in the banking sector and is more representative of the non-stressed
portion of the corporate loan book.
Impetus to the construction sector provided by government
policies and reforms
Construction spend in key infrastructure sectors is expected to marginally rise
in fiscal 2019 with a 3% increase in capital outlay across infrastructure
segments. The roads sector is expected to account for the majority of
construction spend, that is, around 40%. Faster execution of national-highway
projects and steady funding to the Pradhan Mantri Gram Sadak Yojana will
drive investment in rural road construction. Furthermore, four key new policies,
Smart Cities Mission, AMRUT, Swachh Bharat, and Ganga clean-up project, will
drive investments in urban infrastructure.
The construction industry had been bogged down by slow project execution and
poor financial health of infrastructure companies over the past few years.
Hence, the government has introduced policy reforms such as immediate
payment of 75% arbitral awards to contractors by government agencies,
premium rescheduling of projects to improve developers' cash flows, 100% exit
in build-operate-transfer projects to release developers' tied-up equity and
reduce their debt, the National Highways Authority of India’s one-time fund
infusion into stalled projects, increase in projects awarded under the EPC
mode, and introduction of the hybrid annuity model, wherein most of the
project risk is taken up by the awarding authority to boost private participation
and boost execution pace, thus contributing to better performance of the
companies.
Construction &
engineering

23
Credit profile of some infrastructure players still remains weak, and hence,
they are unable to capitalise on the emerging opportunities in the sector.
Financial flexibility remains constrained on account of high gearing, an
offshoot of time and cost overruns in previous projects leading to stretched
working capital. Asset monetisation by floating of infrastructure investment
trusts (InvITs) and equity infusion would help improve the credit profile of the
companies over the medium term. This, along with better order inflow and
prudent working capital cycle, will pave way the way for improving the debt
servicing ability of these players.

24
Upgrades Downgrades
Upgrades were majorly for
renewable generation and were
driven by track record of
healthy plant load factor (PLF)
leading to adequate cash
accrual. The upgrades were
also driven by commencement
of operations, thus mitigating
project risk; timely payments
by counterparties; and
reduction in borrowing cost.
Weak operating performance,
lower realised tariff, and delays
in commencement of operations
led to downgrades.
Lack of long-term PPAs remains the pain point; fuel supply
woes to gradually ease; safeguard duty a monitorable for
the solar sector
The outlook for India’s thermal power sector remains largely negative due to
continued absence of long-term power purchase agreements (PPAs) for private
sector capacity. Of the 75,000 megawatt (MW) of total installed private sector,
coal-based capacity, nearly 20,000 MW is estimated to be without any long-
term PPA.
While demand for power saw healthy growth of 6% in fiscal 2018, it has not
translated into new PPAs by state distribution companies (discoms) for thermal
generators.
This is because the incremental power demand has been met through a mix of
higher capacity addition in renewables (12,000 MW) and central thermal
stations (3,000 MW), and by increasing generation (and thus utilisation) of
existing state-level thermal capacity with PPAs. The PLF of state generating
stations during the first 9 months of fiscal 2018 increased to 55% from 53% for
the corresponding period of the previous fiscal. Furthermore, discoms continue
to prefer to meet a portion of the demand from short-term markets where
tariffs remain benign.
Government’s continued focus on meeting its 24 X 7 Power for All objective and
low per-capita power consumption is likely drive power demand. This, coupled
with a general slowdown in thermal capacity addition over the next 4-5 years
(around 40,000 MW of thermal capacity is expected to be added till fiscal 2022,
Independent
power
producers

25
compared with 98,000 MW added between fiscals 2013 and 2017), should
benefit existing capacities.
Thermal capacities with PPAs containing cost reflective tariffs will continue to
see improvement in capacity utilisation as fuel availability improves. Recent
policies allowing commercial coal mining and introduction of the Scheme for
Harnessing and Allocating Koyla Transparently in India (SHAKTI) scheme will
aid coal supply to power plants. Capacities without PPA are likely to remain
exposed to vagaries of the short-term market. Of these, the capacities under
financial stress may require higher portion of haircuts by investors, to make
them economically viable, under RBI’s revised framework for resolution of
stressed assets.
Credit quality of renewable assets has been largely stable for operational
projects with stable PLF and payment cycles. The ongoing uncertainty
regarding safeguard duty on imported solar modules has led to slowdown in
tendering activity for solar capacities as the quantum may have an impact on
project cost. If the duty is applied on retrospective basis, it may impact viability
of projects under implementation. Thus, the final safeguard duty will be a
monitorable for solar assets.
Capacity addition in solar power continued in fiscal 2018 with more than 6000
MW solar power getting commissioned in the first 10 months of the fiscal.
However, due to change in regime in wind power to auction mechanism, only
600 MW wind power was commissioned in the period. With auctions of more
than 5000 MW completed in 2017, capacity addition in wind power is expected
to pick up.
Distribution remains the weakest link in India’s power sector value chain. With
implementation of the Ujwal Discom Assurance Yojana (UDAY) scheme,
likelihood that discoms will re-initiate signing of new PPAs will depend on their
ability to adhere to targets set out under the scheme and thereby reduce
losses.

26
Upgrades Downgrades
Improving business risk profiles
backed by expansion in new
geographies and higher capacity
utilisation, stemming from steady
demand in domestic and
international markets, led to most
of the upgrades.
Downgrades were mainly due to
subdued operating performance
because of lower sales and
realisation for key products, which
led to lower profitability and cash
accrual.
One-third of these downgrades in
the sector were to default category.
Launches in new product segments pave the way for stable
health of the pharmaceutical sector
The pharmaceutical sector is going through a transition. After witnessing
robust growth historically in conventional generics segment, the growth has
moderated, but remains adequate to maintain strong credit profile. The
industry has been facing regulatory woes, rising competition, and pricing
pressure both in overseas and domestic markets. We expect the trend to
continue. Nevertheless, the industry will grow in mid-to-high-single digit over
the medium term.
The domestic market, which accounts for 55% of industry revenue, remains the
mainstay as rising healthcare spending and awareness, and strong volume
growth, especially in the chronic segment, will continue to drive 10-11%
growth.
Formulation exports are expected to recover to about mid-single-digit growth,
led by faster product approvals from the US Food and Drug Administration
ensuring new product launches, improving demand, and renewed focus on the
European market. We expect the pricing pressure in the US to continue, but not
get worse as some players rationalise their portfolios in the overcrowded
segments. Diversification into specialty and bio-similar segments through joint
ventures and acquisitions and expansion in newer semi-regulated markets will
also drive exports growth over the medium term.
Profitability of formulators is estimated to have declined in fiscal 2018 due to
pricing pressure and weak product launches. We expect profitability to
stabilise in fiscal 2019 because of better product launches and steady prices.
Pharmaceuticals

27
Some of the larger companies have increased their research and development
spend to enter the bio-similar segments or for research on novel molecules.
This, along with their strategy to grow inorganically, will be a key monitorable.
The bulk drugs segment growth is expected to sustain on the back of increasing
focus on niche molecules and specialty products, where competition is less
than in the traditional segment. The domestic bulk drug segment will continue
to benefit from strong sales. Profitability will remain range-bound as increase
in demand/ expansion into specialty products will be offset by pricing pressure
from the traditional segment and continued competition from Chinese players.
The pollution control initiatives by Chinese authorities leading to supply
disruptions and implications for both bulk drug and formulations players in
India will also be monitorables.

28
Upgrades Downgrades
Higher sales, advanced stage of
existing projects, and collection
efficiency leading to sizeable cash
inflow led to upgrades. Upgrades
were also driven by higher-than-
expected funding support from
promoters and refinancing of debt
resulting in improved liquidity and
debt service coverage ratio (DSCR).
Already subdued demand was
exacerbated by demonetisation,
Real Estate (Regulation and
Development Act) and GST.
Almost half of total downgrades
were in the residential real estate
segment on account of slower-than-
expected sales. Around 50% of
these downgrades were to the
default category.
Affordable housing and commercial real estate to offer
respite
The residential real estate sector has been facing headwinds for the past few
years, primarily due to weak demand. This is reflected in declining sales
velocity and subdued cash collection (both in fiscal 2017 and in the first half of
fiscal 2018), fewer new project launches, and large unsold inventory. While
demonetisation impacted sales in fiscal 2017, especially in secondary market
transactions and in micro markets with high investor concentration,
implementation of RERA and GST kept sales subdued in fiscal 2018. Demand
remains muted as buyers adopt a ‘wait and watch’ mode. Developers are likely
to face funding challenges in the short-to-medium term, with limited flexibility
to access funds from other projects and requirement of timely completion of
projects under RERA. In addition to high reliance on non-bank funding,
developers with a diversified portfolio are further leveraging commercial assets
and resorting to sale of assets to tide over fund crunch. On the positive note,
implementation of RERA will improve transparency and support the industry’s
growth and customer confidence.
Demand is expected to remain muted in the near term and recover gradually
over the medium term, with sustained improvement in macroeconomic
conditions. In the affordable housing segment, demand is expected to stay
strong given the relatively low ticket size and impetus from the government’s
‘Housing for All’ programme. The government has budgeted capital outlay of Rs
31,500 crore under the Pradhan Mantri Awas Yojana for fiscal 2019, which is
expected to sustain traction in new project launches in the affordable housing
segment.
Real estate

29
In commercial real estate, vacancies have reduced steadily on the back of
increasing absorption in the past few years and limited additional supply.
Rentals have remained steady and occupancy is expected to stay healthy
driven by improving business conditions.
The retail sector continues to witness strong traction given the healthy
performance of large and established retail malls across the country. Large
foreign institutional investors have been scouting for good properties across
metros, and large and small cities, given the strong growth potential over the
medium term.
Real estate investment trusts (REITs) are emerging as an attractive avenue for
large developers and investors with income-generating commercial and retail
assets, especially after recent clarifications and amendments. This will enable
them to monetise assets, while lowering cost of capital, and help diversify their
funding source.

30
Upgrades Downgrades
Most of the upgrades were due to
improvement in business risk
profiles – healthy demand leading
to better capacity utilisation and
higher realisations due to increase
in domestic steel prices resulting in
higher cash accrual.
Downgrades were mainly due to
lower-than-expected revenue and
profitability, leading to pressure on
debt protection metrics. Working
capital cycle remained stretched,
thus impacting liquidity.
Around 40% of the total
downgrades were to the default
category.
Note: The credit profiles of many companies continue to be constrained by leveraged
balance sheet stemming from aggressive capacity expansion undertaken in the past.
Many have been referred to the insolvency court for debt resolution. These companies
are rated ‘D’ and have seen no change in their ratings. The analysis below excludes
stressed assets with banks and is more representative of the non-stressed portion of
the corporate loan book.
Government initiatives to boost domestic steel demand in
fiscal 2019
Domestic steel demand picked up in April-December 2017, driven by growth in
flat steel demand. In fiscal 2019, we expect demand to accelerate, largely
because of rise in long steel demand from affordable housing and
infrastructure projects. Capacity utilisation should improve over the medium
term with cautious capacity addition amid healthy demand prospects.
In fiscal 2018, global steel demand is estimated to have slowed driven by
decline in demand in China on account of withdrawal of incentives by the
Chinese government which had largely propelled demand in fiscal 2017.
Demand from the rest of the world is estimated to have remained flat.
Steel

31
Domestic prices of flat and long steel products, which rose in fiscal 2017,
continued momentum in fiscal 2018, following global price trend and on
account of high iron ore and coking coal prices. We expect long steel prices to
continue to rise in fiscal 2019 driven by domestic demand pick-up. However,
flat steel prices may come under pressure due to expected decline in global
prices.
Profitability of players was impacted slightly in fiscal 2018 by rise in input
costs, but is expected to be healthy in fiscal 2019 driven by expected decline in
raw material cost. However, pricing pressures will keep profitability range
bound.
The interest servicing ability of players improved in fiscal 2018, but remains
weak as the industry continues to be plagued by large debt.

32
Upgrades Downgrades
Better capacity utilisation, backed
by healthy demand and addition of
clients led to more-than-expected
cash accrual.
Upgrades were mainly among cotton
spinning and ginning players.
Most of the downgrades were on
account of stretch in working
capital requirement primarily
because of higher inventory,
thereby impacting liquidity.
Almost 50% of the downgrades
were in the readymade garments
segment, of which, half were to the
default category.
Textiles remain a mixed bag; interplay of domestic and
international markets to drive demand
Rising income, increased organised retail penetration, and preference for
readymade garments will augur well for domestic demand, which is expected
to grow 10-12% over the long term. Despite increased demand from the US and
the EU, pick-up in exports demand was muted in fiscal 2018 on account of
operational uncertainties/difficulties caused by the GST rollout, and reduction
in exports incentives by 2.5-3% compared with the period before GST roll-out.
Effective October 1, the government reduced duty drawback rates sharply from
7.5% to 2%. Even though the government has increased the rate under
Merchandise Exports from India Scheme (MEIS) from 2% to 4%, overall
incentives for the sector fall short of rates prior to GST. Furthermore, exports
demand over the long term is expected to grow at a reduced pace of 6-7%
owing to low competitiveness of India compared with Bangladesh and Vietnam
in the international market.
Profitability of organised players is expected to improve slightly in fiscal 2019
on account of lower input cost and higher competitiveness after GST. During
fiscal 2018, liquidity was a bit strained by delayed GST refunds. This led to
stretched working capital cycle, which is expected to improve gradually in
fiscal 2019.
Textiles

33
Cotton yarn demand is estimated to have picked up in fiscal 2018 as compared
with fiscal 2017 supported by revival in direct yarn export, moderate growth in
domestic demand, and slight improvement in derived demand on account of
improvement of consumption in the EU and the US. Yarn demand growth is
expected at 4% for fiscal 2019 and at 3-3.5% over the long term, with domestic
consumption supporting growth backed by better economic activity. Though
derived demand is expected to improve supported by increased demand from
the US and the EU markets, direct yarn exports is expected to be muted in line
with continuation of China’s cotton stock liquidation policy. Domestic cotton
prices are expected to decline in fiscal 2019 with increase in cotton production,
leading to improvement in profitability of spinners and supporting their credit
quality.

34
Sectoral credit quality outlook: Banks and
financial institutions
#Size of bubble indicates networth of rated portfolio
Source: CRISIL
CRISIL expects microfinance companies to turn around in fiscal 2019. Asset
quality headwinds faced by the microfinance sector as an off shoot of
demonetisation seem to have passed away and a turnaround is visible with a
distinct improvement and stability witnessed in asset quality since June 2017.
Non-banking finance companies (NBFCs), housing finance companies (HFCs)
and broking companies are expected to deliver a stable performance. NBFCs
have grown steadily over the past few years. They should continue to
strengthen their market position supported by product and process innovation,
and improved funding ecosystem. Growth in the HFC industry remains healthy
and with affordable housing emerging as a new growth driver, the growth
momentum is expected to be maintained. Broking companies benefitted from
the buoyancy in equity markets by recording healthy revenues and profitability.
GNPAs in public sector banks (PSBs) are expected to peak in fiscal 2019, before
starting to decline as NPA recognition by banks gathers pace. Also, in absolute
terms, slippages will remain high, mainly because of the slippage to NPAs in
stressed accounts that were referred to various restructuring tools of the RBI in
the past. Though, the government recapitalisation programme, expected
resolution of large ticket NPAs and continued improvement in the credit
outlook of the corporate sector lend respite for the future, outlook for the near
term however, remains fragile.
Microfinance
Non-banking
finance
companies
Housing
finance
companies
Private Banks
Public- sector
banks
Broking
20
18
-1
9
Cre
dit
qu
ali
ty O
utl
oo
k
Weak
Str
on
gW
ea
k
Credit quality trends
2017-18
Turning around Steady and stable
Remain fragile Weakening
Strong

35
A defining year, especially for public sector banks
Government recapitalisation a key rating support factor for PSBs; private
sector banks to increase market share
Following the government announcement of capital infusion under its Rs 2.11
lakh crore recapitalisation programme, CRISIL revised its outlook on the long-
term debt instruments (excluding Basel III Tier I) of 18 PSBs to ‘Stable’ from
‘Negative’, while reaffirming their ratings. CRISIL believes recapitalisation of
PSBs will improve the financial risk profile of these banks and help them meet
Basel III regulatory capital norms, and provide a cushion against expected rise
in provisioning for NPAs.
On October 24, 2017, the government announced its Rs 2.11 lakh crore
recapitalisation plan for PSBs, and later on January 24, 2018, gave details of
bank-wise infusion of around Rs 88,000 crore for fiscal 2018. Simultaneously,
the government has outlined its banking reforms agenda. The strengthening of
prudent lending practices through responsible banking – that is, banking based
on core strengths, sharper pre- and post-disbursal monitoring for large
exposures, and improving NPA resolution mechanisms (including separate
asset management verticals) – is expected to structurally improve credit
culture at PSBs over time.
Credit growth on revival mode
Gross advances are expected to have increased around 10% in fiscal 2018 and
are likely to rise 11-12% in fiscal 2019, against 5% in fiscal 2017, driven by
sustained growth in retail and agricultural lending. Expected improvement in
consumer demand, projected increase in public sector investments, and rising
industrial activity will support higher growth over the medium term. Also, some
reversion of loan demand from bond markets to banks as yield differential
narrows, and waning effects of structural changes such as GST; Real Estate
(Regulation and Development) Act (RERA), 2016; and demonetisation, will
result in improved credit offtake. Private banks should continue to lead credit
growth and gain market share in fiscal 2019.
GNPAs to cross Rs 10 lakh crore in fiscal 2019; slippages to progressively
reduce
GNPAs are expected to continue to increase in fiscal 2019, before starting to
decline as NPA recognition by banks gathers pace. GNPAs as a proportion of
total advances are expected at around 10.5% by March 31, 2018 (9.4% in as on
March 31, 2017) and 10.3% (Rs 10 lakh crore) as on March 31, 2019, after
touching a high of 11% during fiscal 2019.
Banks

36
Stressed assets are estimated at around 14% of total advances, and are not
expected to increase significantly. More than 70% of the stressed loans have
already been recognised as NPAs by banks. The pace of fresh additions to
NPAs declined marginally in the first nine months of fiscal 2018, compared with
the corresponding period of the previous fiscal. The slippages should moderate
in fiscal 2019, supported by continued improvement in the credit outlook of the
corporate sector, driven by rising commodity prices, stabilisation of operating
cycles, and improved debt protection metrics. The slippages ratio could reduce
to 4.3% of opening advances in fiscal 2019 from around 5% in the first nine
months of fiscal 2018.
However, in absolute terms, slippages will remain high, mainly because of the
slippage to NPAs in stressed accounts that were referred to various
restructuring tools of RBI in the past. Any material additional impact due to
recent revisions in the resolution framework by RBI will remain a monitorable.
With nearly half of the large-ticket corporate NPAs now referred to the NCLT
under the IBC route, the ability of banks to resolve the stressed assets, mainly
NPAs referred to NCLT, will enable them to reduce their bad loans over the
medium term. Sectors such as steel, which constitute a significant portion of
the banking sector NPAs, are seeing an uptick because of firming up of
commodity prices. This will help in the resolution process. Backed by the
expected resolution in accounts under the IBC, recoveries and upgrades as a
percentage of opening GNPAs will pick up in fiscal 2019 after having declined in
the past few fiscals.
Operating profits to stabilise as net interest income rises
Operating profits are likely to stabilise supported by an increase in net interest
income, which would be largely driven by higher credit growth and lower
interest reversal because of lesser slippages. In the past couple of years, the
net interest margin of banks dipped by about 15 basis points (bps) to 2.51%,
mainly due to sluggish credit offtake, high level of interest reversals on NPAs,
and implementation of marginal cost-based lending rates.
Provisioning costs are expected to remain high, mainly due to the stiff haircuts
banks will need to take on large corporate NPAs (referred to NCLT under IBC)
and ageing of NPAs. Banks would need to set aside around Rs 2.6 lakh crore in
fiscal 2018 and around Rs 2.4 lakh crore in fiscal 2019, mainly towards NPA
provisioning. Resolution through the IBC route will necessitate an increase in
provisioning cover ratio (excluding write-offs) to 55-60% by the end of fiscal
2019. However, the roll-out of the revised framework for resolution of large
stressed assets could lead to more progress in resolution compared with

37
previous fiscals, which could also result in acceleration in NPA provisioning.
Net profit is likely to remain muted, with return on assets (RoA) at a low of 0.2%
and absolute profits at around Rs 32,000 crore in fiscal 2019.
Private banks, however, will benefit from strong capitalisation, revenue
diversity, lower exposure to vulnerable sectors, and higher proportion of fee
income to total income as compared with PSBs.
Government support means more than adequate capitalisation
The banking system’s Tier 1 and overall capital adequacy ratios were 10.9%
and 13.4%, respectively, as on December 31, 2017. Amid declining profitability,
the current capitalisation of PSBs is supported by capital infusion by the
central government and capital investment by quasi government institutions
such as Life Insurance Corporation of India. However, the cushion over
regulatory minimum capital has sharply depleted for PSBs, given large
losses/low profits between fiscals 2016 and 2018. The government’s
recapitalisation plan (Rs 2.11 lakh crore spread over fiscals 2018 and 2019) will
help PSBs meet Basel III regulatory capital norms and provide a cushion
against expected rise in provisioning for NPAs.
Banks have raised around Rs 0.6 lakh crore through Tier 1 bonds so far under
Basel III. The government’s decision on early recall of high-cost AT1 (Additional
Tier 1) bonds in the case of prompt corrective action (PCA) by banks will not
have any material impact on the capital ratio of these banks. Ability of PSBs to
raise capital from government and through the capital markets, including by
sale of stake in subsidiaries and of other investments, will remain a key
monitorable.
Private sector banks are, however, comfortably placed to meet the regulatory
capital requirement up to fiscal 2019, supported by healthy accretion to
networth and demonstrated ability to raise capital.
Private sector banks to continue to perform better and gain market share
Private sector banks are expected to continue outperforming PSBs over the
medium term and will gain market share both in advances and current and
savings deposits. They have lower exposure to vulnerable corporate sectors
(infrastructure, construction, real estate, thermal power, and textiles) and
higher exposure to the granular and safer retail sector. Furthermore, their
profitability is supported by higher share of fee income, better liability profile
(higher share of low-cost deposits), and lower credit cost. As a result, there is
significant divergence in credit growth, asset quality, and profitability
parameters between public and private banks. Advances of private sector

38
banks are expected to grow 21% in fiscal 2019 over the previous fiscal, against
6% for PSBs, and will constitute 33% of total advances of the banking sector
(20% five fiscals earlier).
Regulatory changes to result in structural improvements over time
The RBI has taken many critical measures in the past couple of years to
structurally strengthen the credit risk profiles of banks in India over the long
run, including recommending referring large NPA accounts to IBC for resolution
and the announcement of the revised stressed assets framework. These would
help banks tide over asset quality challenges, and increase transparency and
accountability in the system. Mandatory public disclosure of deviation between
reported NPAs and provisions compared with RBI’s assessment, increase in
standard asset provisioning on exposures to vulnerable sectors, and revision in
the PCA framework for banks are aimed at enhancing transparency and
ensuring adequate recognition of stress in the loan books.
Furthermore, the RBI’s revised framework for the resolution of large stressed
assets will result in structural streamlining, standardising, and harmonising of
the resolution process (by doing away with the plethora of previous
frameworks), leading to greater transparency, credibility, and efficiency. By
mandating weekly information on large delinquent accounts, directing that a
resolution plan be worked on immediately on default, and setting stringent
timelines (180 days from default) for referring an account to the IBC process,
the RBI is establishing an ecosystem where stressed assets would get
recognised on time and their resolutions would be quicker than before.
Differentiated licensing of banks is an effort to step-up financial inclusion in
India and will enhance the competitive landscape in the sector over the long
term. However, the effectiveness of differentiated models of specialised
banking and their impact on the existing banking scenario will depend on their
ability to scale up and build up a strong liability franchise and on how
regulations and business models evolve.

39
Market share to keep growing, wholesale credit to drive
growth
NBFCs have grown steadily over the past few years and increased their share of
the Indian financial services market pie. They should continue to strengthen
their market position supported by product and process innovation, and
improved funding ecosystem.
The market share of NBFCs and HFCs increased to 16% of the total system
credit pie from 13% over the past 5 fiscals. We expect this trend to continue,
and their share to reach nearly 19% by fiscal 2020, amid intensifying
competition from private banks and with PSBs expected to claw back into the
segment after recapitalisation.
In terms of segments, the vehicle finance portfolio of NBFCs is expected to
grow 15% till fiscal 2020, driven by improving macroeconomic environment,
and higher government focus on infrastructure and rural areas. The market
opportunity for NBFCs will stem from continued government investment in the
roads sector, expected finalisation of the scrappage policy (or the Voluntary
Vehicle Modernisation Programme), and higher Budgetary spends for the rural
sector.
The loans against property (LAP) segment, which has been a key growth driver
for NBFCs in recent years, is witnessing stronger-than-expected headwinds
amid intensified competition from banks, and rising delinquencies. Yield
compression has been sharper and has happened sooner than expected.
Consequently, growth in LAP is expected to be slower than before.
However, wholesale finance, especially structured credit and real estate
lending, will drive growth over the medium term. The opportunity in realty and
the structured credit space has increased materially after the implementation
of RERA and rising demand for mid-corporate promoter financing.
NBFCs

40
In terms of asset quality, while reported gross NPAs have moved up on account
of transition to more stringent asset classification norms, underlying asset
quality performance in terms of 90+ days’ past due (dpd) has been improving
since fiscal 2015 and the trend continued in fiscal 2018. With the regulatory
transition period ending, reported asset quality metrics are now expected to
stabilise. This is also expected to support profitability, as credit costs
normalise. Current credit costs are 60-80 basis points higher than the 10-year
average.
Comfortable capital position and increased investor interest in NBFCs will
continue to support growth. NBFCs have raised over Rs 30,000 crore of equity
capital over the past five years. Furthermore, diversifying resource mix, with
increasing share of capital market borrowings (in the form of non-convertible
debentures and commercial papers) and securitisation, allows them to manage
cost of funds better, and thereby enhance earnings.
41
The momentum continues
Growth in the HFC industry remains healthy at 20%, with an estimated loan
book of Rs 9.7 lakh crore as on March 31, 2018. Affordable housing has
emerged as a new growth driver for HFCs, which have also been able to ramp
up their non-housing portfolios, including LAP and wholesale finance
(developer funding and lease rental discounting).
Given the growing demand for housing, long-term growth potential remains
high with the overall portfolio expected to touch Rs 14 lakh crore by fiscal 2020.
Growth in individual home loans will be driven primarily by Tier 2 and 3 cities,
with affordability in the metros likely to be lower.
Competition from banks will, nevertheless, remain intense, especially given the
low growth rate in the corporate segment’s demand for loans, and the lower
risk weights and strong asset quality in home loans. Also, with seasoning in the
portfolios of rapidly-growing HFCs, many of which are focused on diverse
customers, there could be a gradual increase in delinquencies in the home loan
segment. The affordable housing finance portfolios are expected to bear the
brunt of the delinquency increase given the relatively weaker credit profile of
borrowers.
Asset quality in the non-individual segment will see some weakening with
delinquencies inching up in both developer financing and LAP portfolios. Large
HFCs have managed their LAP portfolio better, backed by strong underwriting
practices. However, despite strong collateral cover, systemic delinquencies in
the segment should rise as portfolios season and growth moderates.
Profitability is expected to remain stable over the medium term, with RoA
expected at 1.8-1.9%. RoA may remain range-bound on account of the
competitive dynamics in the home loan market.
HFCs

42
Asset quality improves as demonetisation blues fade
Microfinance portfolio of small finance banks (SFBs) and non-bank
microfinance institutions (together referred to as MFIs) have shown a distinct
improvement and stability in asset quality since June 2017, shrugging off the
impact of demonetisation, which had cranked up delinquencies, affected
borrower behaviour, and worsened asset quality. The following data points
underscore the improvement:
● Portfolio delinquencies for a representative set of MFIs12, measured in
terms of 30+ and 60+ dpd, improved to 5.6% and 5.3%, respectively, as of
December 2017, from 7.6% and 6.8%, respectively, as of June 2017
● Cumulative collection efficiency rose to over 99% for disbursements since
April 2017
A big takeaway is the improvement in asset quality performance in Uttar
Pradesh, Maharashtra, and Karnataka, which were severely impacted in the
aftermath of demonetisation. For instance, 30 dpd in Uttar Pradesh improved
to 14% as of December 2017 from 23% as of June 2017.
Moreover, weakness in asset quality was not pervasive. Tamil Nadu, Kerala,
Odisha, West Bengal, and Bihar remained largely resilient despite
demonetisation and its aftermath. These states continue to exhibit strong
collection performance with 30 dpd staying below 2%.
Asset quality performance, though, remains weak in Vidarbha, some districts in
central and southern Madhya Pradesh, and select districts in Karnataka and
Uttar Pradesh.
Ultimate credit losses due to the impact of demonetisation will be in the 5-7%
range. This will adversely affect the near-term profitability of MFIs.
Profitability, though, will improve gradually with improvement in asset quality.
Credit costs are likely to stabilise at 1.5-2.5% on a steady state basis. MFIs
with larger rural presence, weekly collections, and lower equated instalments
are expected to have lower credit cost. Post-tax return on assets is likely to
stabilise at 2-2.5% on a steady state basis.
Business prospects for MFIs remain healthy, as total demand remains large at
Rs 3.0 lakh crore. MFIs and banks have a microfinance portfolio of Rs 1.25 lakh
crore. NABARD-run self-help group linkage programmes have a portfolio of Rs
12 Representative set of MFIs and SFBs covering 50% of the loan assets (excludes one large player)
Microfinance

43
0.25 lakh crore (excluding Andhra Pradesh and Telangana). Hence, unmet
demand potential is large at 50%.
Stakeholders’ confidence remains strong despite the asset quality headwind
faced by the sector. Since demonetisation, CRISIL estimates MFIs have raised
around Rs 4,000 crore of equity and Rs 7,000 crore of debt. Additionally, banks
and refinance institutions continue to extend funding to MFIs. Dependence on
bank finding though remains high. Hence, priority sector eligibility for banks on
direct lending to MFIs remains critical.
Several large MFIs, which have transformed into SFBs, will diversify into
inclusion adjacencies such as MSME loans and affordable housing loans.
Demand prospects in these segments remain buoyant over the medium term
given the under penetration in most geographies. Conversion to banks also
provides access to stable and granular public deposits over the long run, and
reduces the risk of political and regulatory uncertainty. However, SFBs need to
overcome two key challenges:
● Build a retail liability oriented funding profile
● Overcome near-term fall in profitability
SFBs will have an edge over NBFC-MFIs, notwithstanding near term funding
and profitability challenges.
Capitalisation will continue to be the key rating differentiator for MFIs, given
the inherently weak borrower segment, susceptibility to socio-political issues,
and the consequent volatility in asset quality and profitability.

44
Benefits from buoyancy in equity markets to continue;
ability to control cost critical to profitability
Indian brokerages continue to benefit from the buoyancy in equity markets. The
revenues of CRISIL-rated players are estimated to increase by over 20% in
fiscal 2018 over the corresponding period in the previous fiscal, on the
backdrop of significant increase in average daily turnover in equity markets.
Derivative segment continues to outpace the cash segment. Average daily
turnover in the derivative segment for the first nine months went up by 73% as
against 36% increase observed in the cash segment on a year-on-year basis.
Pressure on yields remains due to intense competition. However, large players
have been able to control their costs. As a result, cost to income ratio improved
to ~65% from ~70%, resulting in an upsurge in profitability by nearly 25%.
Large Indian capital market entities have also undergone a transformation in
their business profile over the last few years. While these entities initially
diversified into related fee-based activities and capital markets lending, they
have also grown their non-capital market credit books significantly over the
last few years. In the past five years, the credit book in segments as diverse as
housing, LAP, loans to MSMEs and other corporates and real estate lending,
has more than trebled. CRISIL believes that this share will continue to increase
over the medium term and dependence on capital markets business will reduce
further.
Smaller capital market entities have limited diversification and hence, are
more vulnerable to market volatility. Profitability of these companies is
estimated to have improved as well in fiscal 2018 due to the improved market
sentiments led by an uptick in volumes in the cash segment, which has been
their key focus area. However, while such entities benefit from strong customer
relationships, they will need to continuously evolve and control their cost
structure to be able to manage profitability.
Broking
companies


Argentina | China | Hong Kong | India | Poland | Singapore | UK | USA
CRISIL Limited: CRISIL House, Central Avenue, Hiranandani Business Park, Powai, Mumbai – 400076. India
Phone: + 91 22 3342 3000 | Fax: + 91 22 3342 3001 | www.crisil.com
About CRISIL Limited
CRISIL is a leading agile and innovative, global analytics company driven by its mission of making markets function
better. We are India’s foremost provider of ratings, data, research, analytics and solutions. A strong track record of
growth, culture of innovation and global footprint sets us apart. We have delivered independent opinions, actionable
insights, and efficient solutions to over 100,000 customers.
We are majority owned by S&P Global Inc., a leading provider of transparent and independent ratings, benchmarks,
analytics and data to the capital and commodity markets worldwide.
About CRISIL Ratings
CRISIL Ratings is part of CRISIL Limited (“CRISIL”). We pioneered the concept of credit rating in India in 1987. CRISIL
is registered in India as a credit rating agency with the Securities and Exchange Board of India (“SEBI”). With a tradition
of independence, analytical rigour and innovation, CRISIL sets the standards in the credit rating business. We rate the
entire range of debt instruments, such as, bank loans, certificates of deposit, commercial paper, non-convertible /
convertible / partially convertible bonds and debentures, perpetual bonds, bank hybrid capital instruments, asset-
backed and mortgage-backed securities, partial guarantees and other structured debt instruments. We have rated
over 24,500 large and mid-scale corporates and financial institutions. CRISIL has also instituted several innovations
in India in the rating business, including rating municipal bonds, partially guaranteed instruments and microfinance
institutions. We also pioneered a globally unique rating service for Micro, Small and Medium Enterprises (MSMEs) and
significantly extended the accessibility to rating services to a wider market. Over 110,000 MSMEs have been rated by
us.
CRISIL Privacy
CRISIL respects your privacy. We use your contact information, such as your name, address, and email id, to fulfil your request and
service your account and to provide you with additional information from CRISIL and other parts of S&P Global Inc. and its
subsidiaries (collectively, the “Company”) you may find of interest.
For further information, or to let us know your preferences with respect to receiving marketing materials, please visit
www.crisil.com/privacy. You can view the Company’s Customer Privacy at https://www.spglobal.com/privacy
Last updated: April 2016
Disclaimer
CRISIL has taken due care and caution in preparing this report. Information has been obtained by CRISIL from sources which it
considers reliable. However, CRISIL does not guarantee the accuracy, adequacy or completeness of any information and is not
responsible for any errors in transmission and especially states that it has no financial liability whatsoever to the subscribers/
users/ transmitters/ distributors of this report. No part of this report may be reproduced in any form or any means without
permission of the publisher. Contents may be used by news media with due credit to CRISIL.
© CRISIL. All Rights Reserved.