
Rating targeting and the confidence levels implicit in bank
27
Esa Jokivuolle – Samu Peura Rating targeting and the confidence levels implicit in bank capital Bank of Finland Research Discussion Papers 27 • 2006
Transcript of Rating targeting and the confidence levels implicit in bank

Esa Jokivuolle – Samu Peura
Rating targeting and the confidence levels implicitin bank capital
Bank of Finland ResearchDiscussion Papers27 • 2006

Suomen Pankki Bank of Finland
P.O.Box 160 FI-00101 HELSINKI
Finland + 358 10 8311
http://www.bof.fi

Bank of Finland Research Discussion Papers 27 • 2006
Esa Jokivuolle* – Samu Peura**
Rating targeting and the confidence levels implicit in bank capital***
The views expressed are those of the authors and do not necessarily reflect the views of the Bank of Finland. * Corresponding author: Esa Jokivuolle, Bank of Finland,
P.O. Box 160, FI-00101 Helsinki, Finland. Tel. +358 10 831 2309, e-mail: [email protected].
** Samu Peura, Sampo Bank, PO Box 1024, FI-00075 Sampo, Finland. Tel. +358 10 513 4325, e-mail: [email protected].
We thank Alistair Milne and Matti Virén for valuable comments as well as the participants of the Summer School on Risk Measurement and Control 2006 in Rome. All errors are ours.

http://www.bof.fi
ISBN 978-952-462-332-2 ISSN 0785-3572
(print)
ISBN 978-952-462-333-9 ISSN 1456-6184
(online)
Helsinki 2006
3
Rating targeting and the confidence levels implicit in bank capital
Bank of Finland Research Discussion Papers 27/2006
Esa Jokivuolle – Samu Peura Monetary Policy and Research Department Abstract
The solvency standards implicit in bank capital levels, as reported eg in Jackson et al (2002), are much higher than those required for top ratings, if standard single period economic capital models are taken seriously. We explain this excess capital puzzle by forward looking rating targeting behaviour by banks, which aims at maintaining rating above a minimum target in future periods. We calibrate to data on actual bank capital the confidence level used by the median US AA rated bank to maintain at least a single A rating. The calibrated confidence level is in line with the historical probability of an AA rated bank to be downgraded below A. Key words: bank capital, credit rating, value-at-risk, economic capital, capital structure JEL classification numbers: G21, G32

4
Pankin luokitustavoite ja pääomitus
Suomen Pankin tutkimus Keskustelualoitteita 27/2006
Esa Jokivuolle – Samu Peura Rahapolitiikka- ja tutkimusosasto Tiivistelmä
Pankit ylläpitävät paljon suurempaa vakavaraisuutta kuin parhaat luottokelpoi-suusluokitukset edellyttäisivät. Tähän johtopäätökseen tulevat Jackson et al (2002), kun he vertaavat yhden periodin taloudellisen pääoman mallin tuloksia pankkien todelliseen pääomitukseen. Tässä tutkimuksessa näytämme, että pank-kien ylimääräiset pääomapuskurit voidaan kuitenkin selittää eteenpäin katsovalla mallilla, jossa pankki pyrkii säilyttämään luottokelpoisuusluokituksensa tietyllä vähimmäistasolla myös tulevaisuudessa. Kalibroimme mallin avulla tyypillisen yhdysvaltalaisen AA-luokitellun pankin käyttämän luottamustason, jolla pankki pyrkii säilyttämään vähintään yhden A:n luokituksen. Kalibroitu luottamustaso on lähellä tilastollista frekvenssiä, jolla pankin AA-luokitus putoaa A:n alapuolelle. Avainsanat: pankkien pääomitus, luottokelpoisuusluokitus, riskienhallinta, talou-dellinen pääoma JEL-luokittelu: G21, G32

5
Contents
Abstract....................................................................................................................3 Tiivistelmä (abstract in Finnish) ..............................................................................4 1 Introduction ......................................................................................................7 2 A model of rating targeting .............................................................................9 3 The rating targeting confidence level implicit in bank capital ..................12 4 Discussion........................................................................................................17 5 Conclusions .....................................................................................................19 References..............................................................................................................20

6

7
1 Introduction
Recent literature has argued that benefits associated with a sufficiently high credit rating have been overlooked by traditional capital structure studies (Kisgen, 2005a, b). Such benefits include lower cost of debt capital, which could rise in a discrete manner as a result of a rating downgrade.1 Kisgen (2005b) argues that since financial leverage is an important determinant of agency ratings companies may target a certain rating by managing their equity-debt ratio. Using US data on both non-financial and financial corporations he provides evidence that firms respond asymmetrically to rating changes by reducing leverage in response to rating downgrades, in order to regain previous rating, while doing nothing after rating upgrades. This effect is most pronounced around the investment grade/speculative grade threshold. Kisgen’s (2005b) results suggest that maintaining a certain minimum rating is the primary objective of rating targeting. Targeting a minimum credit rating may be particularly important for financial institutions such as banks. In addition to the cost of debt capital, a bank’s access to unsecured markets such as swaps appears to be tied to maintaining a sufficiently high rating which according to Jackson et al (2002) would at a minimum be ‘single A’. Overall, Jackson et al (2002) report that the great majority of G10 banks, around 97% at the end of 1998, have an investment grade rating (BBB – or higher) which clearly indicates the preference for high ratings in the banking industry. Suggestive evidence that many banks target at least the A rating can also be drawn from Nickell et al (2000) who provide separate rating transition probability matrices for banks and industrials based on Moody’s data. A bank with a BBB rating has a significantly, both statistically and economically, higher probability than an industrial company of being upgraded to an A rating within a year (Nickell et al, 2000, table 2). This suggests that banks may take extra measures to restore their capital base and hence their rating after falling below the A grade. In the banking industry, the amount of equity which is needed for a given rating is often called economic capital.2 Economic capital is defined as the amount of book equity a bank needs to cover with a chosen confidence level unexpected losses, or unexpected changes in the market value of its assets, in its portfolio over a given time horizon. Because the chosen confidence level implies the bank’s solvency standard, it effectively links economic capital with the rating category which historically exhibits the same solvency standard. For instance, Jackson et al
1 Boot et al (2005) provide a theory in which ratings have a role as a coordination mechanism in situations where multiple equilibria may obtain. This has implications consistent with discrete value changes in connection with rating changes. 2 See especially Jackson et al, 2002, and also Elizalde and Repullo, 2004, for a more general discussion on economic capital.

8
(2002) argue that a bank A rating would imply a 99.96% solvency standard so, conversely, a bank aiming at an A rating should reserve economic capital using the 99.96% confidence level.3 Jackson et al (2002) provide evidence that Tier 1 capital holdings of the largest US banks imply extremely high confidence levels for economic capital (median 99.9977%). These clearly exceed the confidence levels needed for the top ratings; A – AAA. Jackson et al (2002) point to two possible explanations for this discrepancy. Either the economic capital model they use biases the results, or their calculations (using information on banks’ corporate credit portfolios only) do not properly account for other risk categories, such as market and operational risks, that rating agencies consider. An alternative explanation would be that banks hold a capital buffer in excess of the minimum amount of economic capital needed for their minimum rating target. As Gordy and Howells (2004) describe, ‘an institution that seeks to have capital sufficient for an AA rating today (say, a one-year target solvency probability of 99.95%) might also want to have a 95% probability of remaining investment grade at the (given) horizon. This (extra) constraint creates a buffer for economic capital.’ The economic capital plus the buffer on top of it would then imply the very high confidence level in the traditional economic capital calculation, which Jackson et al (2002) obtained. To put it another way, banks’ economic capital planning that considers both current and future ratings may be a more dynamic problem than the standard static economic capital models suggest. We argue in this paper that rating targeting behaviour could explain the high quality banks’ excess capital puzzle reported by Jackson et al (2002). We formulate the problem of a bank which wants to maintain its rating over a chosen horizon, when unexpected losses can occur, asset quality may deteriorate and when risk transfer or timely access to external capital market without excessive costs may not be possible. We show how to incorporate this minimum rating targeting problem into a value-at-risk framework routinely used by banks, and illustrate the approach with a hypothetical bank holding only a corporate credit portfolio. Our approach is analogous to a bank reserving a capital buffer on top of its regulatory minimum capital requirement, studied by Peura and Jokivuolle (2004).4 They develop a simulation methodology to determine the capital buffer a bank would hold on top of the regulatory minimum capital requirement in order to meet
3 One could argue that rating targeting by the means of reserving sufficient capital against measured asset risks would be relatively straightforward in the case of banks. This is because banks’ asset risks mainly consist of financial risks, such as market and credit risks, for which advanced risk measurement techniques and software is available. On the other hand, Morgan (2002) provides evidence that rating agencies more often disagree about bank ratings than other corporate ratings, which arguably is a result of banks’ greater balance sheet opacity. 4 The analogy was first discussed in Gordy and Howells (2004) which is an extended working paper version of Gordy and Howells (2006).

9
future minimum requirements with a chosen probability. In the rating targeting problem, minimum capital requirement is replaced by an economic capital target. Because economic capital is itself obtained from a value-at-risk calculation, the approach in effect involves two nested value-at-risk problems. To address the puzzle of Jackson et al (2002) of excessively high capital levels, we calibrate the confidence level parameter with which a highly rated bank would prefer to maintain at least a single A rating over its planning horizon. To this end we use data on a representative US high quality bank’s credit portfolio, reported in Gordy (2000), and on large US double A banks’ Tier 1 capital ratios. The result of such a calibration can then be compared with evidence from banks’ rating transition probabilities, reported in Nickell et al (2000), which provide a direct indication of how often an AA rated bank would tolerate a rating downgrade below single A. We find these two alternative measures of the confidence level to be in line, which supports the view that rating targeting behavior may explain the high-quality banks’ excessive capital levels. The paper is organised as follows. In section 2 the two-stage value-at-risk simulation framework is described, and section 3 presents evidence of the confidence level used by high-quality banks in rating targeting. Section 4 discusses the results and possible future research opportunities. Section 5 briefly concludes. 2 A model of rating targeting
We consider a hypothetical bank with assets consisting of corporate credits only. We assume that the bank wants to maintain its rating at or above a given target, say A, with confidence level α over its planning horizon T. The confidence level can be interpreted as the outcome of the bank trading off the benefits of a given rating against the cost of the capital required to support the rating. The horizon T is related to the capital market imperfections that the bank faces in adjusting its portfolio and capital in economic downturns. We assume that rating is determined by external agencies through a comparison of the bank’s actual capital and its economic capital. In particular, to obtain its minimum rating target, the bank’s actual capital must exceed the economic capital associated with the confidence level implied by the minimum rating target (such as 99.96% over one year horizon for an A rating). Economic capital increases with the applied confidence level, hence better ratings necessitate increasing amounts of capital. Bank capital dynamics is driven by bank income I and credit losses L. Given initial capital C0, bank capital at the planning horizon T satisfies CT = C0 + IT − LT. We exclude new equity issues over the planning horizon with
10
reference to capital market imperfections. We also ignore dividends since these would not be paid in adverse economic conditions. Denoting the economic capital associated with the bank’s rating target by E, we can express the bank’s rating targeting objective as
[ ] α≥≥−+ TTT0 ELICP (2.1) The minimum initial capital satisfying condition (2.1) may then be written as
[ ]{ }( ) ( )[ ]{ }α≥−+−≥−=
α≥≥−+=
TT0T000
TTT000
ILEEECP:CminELICP:CminC (2.2)
The latter expression shows that the rating targeting problem reduces to the choice of the capital buffer to be held in excess of the current economic capital, C0 − E0. Moreover, this capital buffer reserves for two sources of uncertainty: 1) changes in economic capital over the planning horizon, and 2) bank’s net losses over the planning horizon. In effect, we simulate bank’s actual capital and the minimum capital required for a given rating, ie economic capital, simultaneously. Their joint dynamics determines the required capital buffer, the excess of actual over economic capital, which the bank needs to hold to achieve a given confidence in maintaining its target rating. The minimization (2.2) is a value-at-risk problem which would reduce to a standard value-at-risk problem if we ignored the economic capital constraint. Including economic capital makes the problem a nested value-at-risk problem because ET is itself a result of a value-at-risk calculation; hence our model could be termed ‘VaR on VaR’. The uncertainty in our model stems from rating migration in the bank’s credit portfolio. Rating transitions and defaults over the planning horizon determine portfolio rating distribution and credit losses at T. Portfolio rating distribution in turn determines economic capital at T. We apply the standard one-factor version of the CreditMetrics methodology (J. P. Morgan, 1997), used in numerous studies (see eg Gordy, 2000, Jackson et al, 2002, and Peura and Jokivuolle, 2004), for generating correlated rating transitions and defaults over the horizon T. This is implemented through a single period Monte Carlo simulation. To avoid simulation on simulation, we use an analytic approximation for calculating economic capital at T. Our approximation is the Basel II IRBA function (Basel Committee, 2004) which is based on the same fundamentals as the CreditMetrics methodology (see Gordy, 2003). We adjust the confidence level in the IRBA function away from the Basel II value (99.9%) and remove the ad hoc smoothing added by the Basel Committee and implemented through the correlation function. We keep the maturity adjustment in

11
the formula to account for maturity sensitivity of economic capital.5 Based on the IRBA formula, our economic capital formula reads
∑=
−−
×⎪⎭
⎪⎬⎫
⎪⎩
⎪⎨⎧
×−⎥⎥⎦
⎤
⎢⎢⎣
⎡
ρ−ρβ+
×−=K
1iiii
i
i1
i1
iii MLGDPD1
)(N)PD(NNLGDEAD)D1(E
(2.3) to be applied both at time 0 and at time T, where the maturity adjustment, Mi, is given by
b5.11b)5.2m(1M i
i −−+=
mi is maturity in years, b = [0.11852 − 0.05478 ln(PD)]1/2 (see Basel Committee, 2004),6 K is the number of credit assets in the bank’s portfolio and Di is an indicator function of default for obligor i. EADi and LGDi are the exposure and the percentage loss given default, N is the standard normal distribution function, N−1 is its inverse function, PDi is the probability of default and ρi is the correlation of the obligor’s asset value with the systematic factor. The confidence level β depends on the rating target. Bank income accrues from loan portfolio entirely, the income from each loan being a fixed multiple θ of the expected loss rate on that loan. The credit loss from a defaulted asset, on the other hand, is deterministic LGD percent times the exposure at default. We hence obtain the following expression for net loss over the planning horizon T
∑∑==
θ−−=−K
1iiiiT,iii
K
1iT,iTT EADLGDPD)D1(EADLGDDIL (2.4)
where PDs are time zero unconditional PDs.
5 The IRBA model in effect provides a measure of economic capital which is based only on losses incurred by defaults. It is not a mark-to-market based economic capital model used eg in Jackson et al (2002). Nonetheless, we do not know exactly how much credit rating agencies weight potential losses from defaults on the one hand and losses in market value of bank credits on the other hand in their assessments of banks’ solvency. Therefore, it may well be that our IRBA based economic capital model in default mode was well in line with agency rating criteria, especially around year 2000 which we use in our calibration of α; see the next section. 6 Note that for mi = 1 the maturity adjustment equals one.

12
3 The rating targeting confidence level implicit in bank capital
Here we calibrate the confidence level α associated with rating targeting by matching model capital with equity capital actually held by highly rated US banks. We use data on a representative US high quality corporate credit portfolio allegedly held by such banks. We then contrast the calibrated value with a more direct measure of the confidence level. The confidence level α with which a bank wants to maintain its minimum rating target can be interpreted as a result of the bank’s capital structure optimization problem in which the bank’s credit rating is a factor. The higher the confidence level, the more the bank values the benefits associated with a sufficiently high rating vis-à-vis the cost of additional equity, given the risk level of its assets. The value of α is likely to vary across banks and perhaps also across time, and it may depend on the specific rating target a bank has as well as on the relative easiness and cost-effectiveness with which a bank can adjust its economic capital over time. Nonetheless, we find it interesting to estimate the value of α that, say, AA rated banks typically use. We calibrate α by equating capital generated by our model with the median capital held by a sample of banks. An alternative way to assess the average value of α is to look at the historical rating transition probabilities for banks. For instance, if a bank initially has an AA rating, the historical probability that its rating is in a year’s time downgraded to less than a single A rating gives an indication of the confidence level with which an AA bank wants to stay at least single A. As our approach in this paper suggests, if a bank knows and can measure its asset risks, it should be able to build capital buffers in advance so that a rating downgrade below a certain threshold rating occurs only with its chosen probability. By comparing the average value of α calibrated to banks’ actual capital buffers with banks’ rating transition probabilities reported in the previous literature (in particular Nickell et al, 2000) we may also be in a stronger position to suggest that banks’ minimum rating targeting behaviour is a potential explanation to the excess capital puzzle reported in Jackson et al (2002). In calibrating α to banks’ actual capital we focus on the highest rated banks which are likely to be the most sensitive ones about maintaining a sufficiently high minimum rating. Jackson et al (2002) argue that banks that are active in various unsecured credit markets, such as serving as major counterparties in swaps trading, target at the minimum a single A rating. Moreover, anecdotal evidence suggests that a major swap dealer bank in normal times is required to have an AA rating. We therefore assume that the model bank initially has an AA rating and wants to maintain at least a single A rating over a year’s horizon. The planning horizon T in our model is therefore set at one year, which appears a

13
fairly standard assumption of bank practice, and the confidence level β in the economic capital model (2.3) is set at 99.96%, following Jackson et al (2002). Detailed information on banks’ credit portfolios is scarce. To our knowledge, the primary source of information used in similar studies are the representative US bank corporate credit portfolio rating distributions reported in Gordy (2000). Based on a survey conducted by the Federal Reserve Board he presents rating distributions for an average quality and a high quality US bank. We follow Jackson et al (2002) who argue that the largest US banks are most likely to hold the high quality credit portfolio. Therefore we focus especially on the AA rated banks among the 20 largest US banks, chosen on the basis of the S&P long term bond rating, and assume that a median bank among them holds the US high quality portfolio. Like Jackson et al (2002), we further assume that the portfolio consists of 500 bullet loans, each loan of equal size and with a three-year maturity. The loans are distributed over rating categories according to the shares of the US high quality portfolio. We apply a uniform 20% asset correlation ρ and assume a constant 45% LGD for all loans.7 The S&P’s rating transition probability matrix is used in simulating rating transitions and defaults over the planning horizon as well as in obtaining one-year default probabilities to be used in the IRBA function. By so doing we assume that there is a one-to-one correspondence between the S&P’s ratings and the bank’s internal rating system. Following Jokivuolle and Peura (2004) the margin income multiplier θ (equation 4) is set at 3. Figure 1 provides an illustration of the simulation procedure.
7 Jackson et al (2002) model recovery (1-LGD) stochastically using the beta distribution with mean 50% and standard deviation 25%. Thus our base case deviates from theirs in that our 45% LGD implies a somewhat higher mean recovery of 55%. Our choice of 45% LGD is the same as the Basel Committee’s choice for senior unsecured loans’ LGD under the Internal Ratings Based approach. Moreover, we perform sensitivity analysis of the calibrated α by varying the parameter assumptions of our base case; including the LGD assumption.

14
Figure 1. Illustration of the simulation framework 1
T1T
1T
1T ILEP −+⇒
2T
2T
2T
2T ILEP −+⇒
P0 –
–
–
ST
ST
ST
ST ILEP −+⇒
time 0 time T where s
tst
st
st ILandE,P − are portfolio rating distribution (ie credit portfolio
quality), economic capital corresponding to the bank’s minimum rating target and net credit portfolio loss, respectively, with t = 0, T denoting time and s = 1, …, S denoting simulated portfolio rating distribution scenario. Starting with a given initial portfolio rating distribution P0 in period 0, we simulate S = 10000 rating transition scenarios for the 500 bullet loans over period [0,T] (one year). In each simulated scenario s, the rating distribution s
TP yields economic capital sTE
according to (2.3) and net credit loss ( sT
sT IL − ) due to defaults and accrued margin
income according to (2.4). Required initial capital is determined from (2.2) based on the sum of the economic capital and the net credit loss. As Gordy’s (2000) portfolio rating distribution dates from the late 1990’s,8 we consider twenty largest US banks having A or AA rating in year 2000. Due to some missing observations in the Bankscope database we are left with eleven A rated banks and five AA rated banks. Not knowing the exact year of the portfolio data, and also to smooth for potential transitory variation in bank capital ratios, we take the average Tier 1 ratio of each sample bank over 1997–1999 (see figure 2).9 In the sub sample of the five AA banks, the median Tier 1 ratio is 9.2%. In the calibration, the value of α is found by matching the amount of capital implied by the 9.2% ratio with capital produced by our model for the US high quality portfolio.
8 The dates of the Fed survey on bank portfolios are not reported in Gordy (2000). 9 Using data on capital ratios from the last boom years of the end of 1990’s fits well with the premise of the rating targeting framework that it is in the good times that banks have an opportunity to build precautionary capital buffers for the purpose of minimum rating maintenance.

15
Figure 2. Average Tier 1 ratio over 1997–1999 of sixteen large US banks with A or AA rating in 2000
0,0
2,0
4,0
6,0
8,0
10,0
12,0
14,0
16,0
1 2 3 4 5 6 7 8 9 10 11 12 13 14 15 16
%
A banks AA banks Banks are numbered in ascending order according to
their average Tier 1 ratios. The median of the A and AA sub samples are taken, respectively, of the three-year average Tier 1 ratios.
median A (7.8%)
median AA (9.2%)
16
Figure 3. Calibration of α
0
2
4
6
8
10
12
14
16
94,5 95,0 95,5 96,0 96,5 97,0 97,5 98,0 98,5 99,0 99,5 100,0%
Base case Maturity 2 Maturity 4Asset correlation 15% Asset correlation 25% LGD 35%LGD 55%
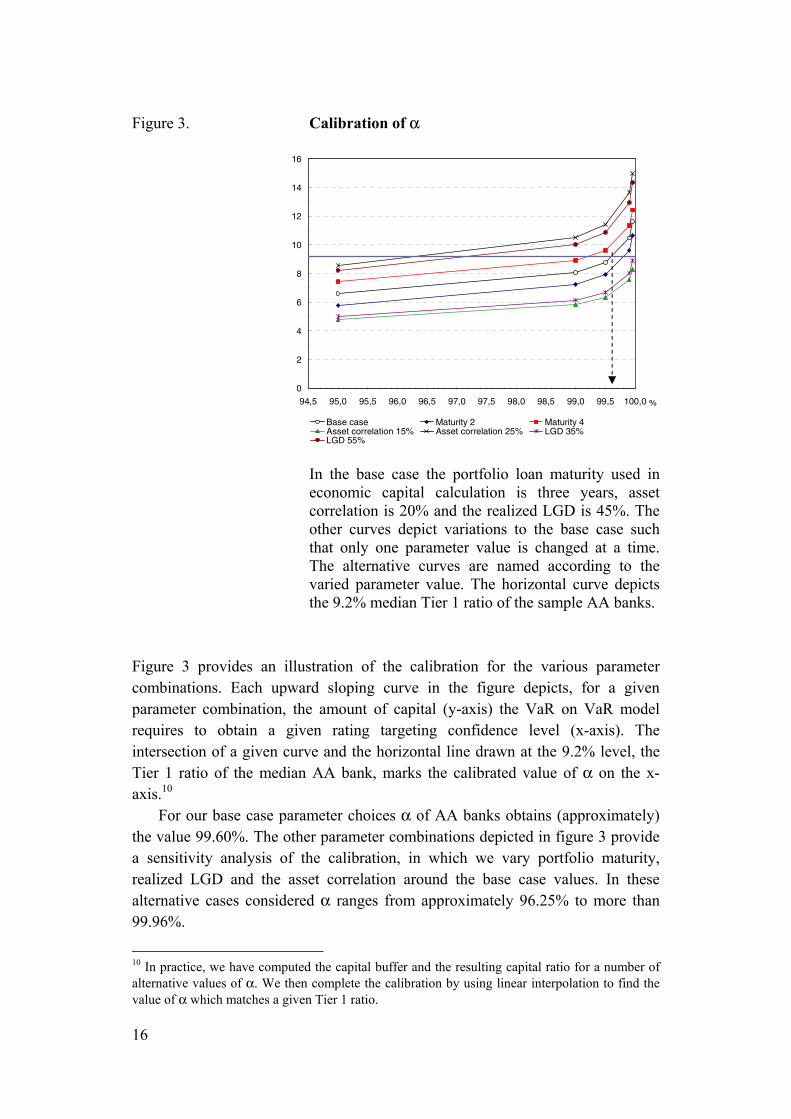
In the base case the portfolio loan maturity used in
economic capital calculation is three years, asset correlation is 20% and the realized LGD is 45%. The other curves depict variations to the base case such that only one parameter value is changed at a time. The alternative curves are named according to the varied parameter value. The horizontal curve depicts the 9.2% median Tier 1 ratio of the sample AA banks.
Figure 3 provides an illustration of the calibration for the various parameter combinations. Each upward sloping curve in the figure depicts, for a given parameter combination, the amount of capital (y-axis) the VaR on VaR model requires to obtain a given rating targeting confidence level (x-axis). The intersection of a given curve and the horizontal line drawn at the 9.2% level, the Tier 1 ratio of the median AA bank, marks the calibrated value of α on the x-axis.10
For our base case parameter choices α of AA banks obtains (approximately) the value 99.60%. The other parameter combinations depicted in figure 3 provide a sensitivity analysis of the calibration, in which we vary portfolio maturity, realized LGD and the asset correlation around the base case values. In these alternative cases considered α ranges from approximately 96.25% to more than 99.96%.
10 In practice, we have computed the capital buffer and the resulting capital ratio for a number of alternative values of α. We then complete the calibration by using linear interpolation to find the value of α which matches a given Tier 1 ratio.
17
As our AA bank sample only consists of five banks we also look at the A rated banks. Their sample median Tier 1 ratio is 7.8% which is, as expected, somewhat lower than that of the AA banks’. It implies with our base case parameters an α value of (approximately) 98.23%. Given the assumption that the A rated banks typically hold a similar high quality portfolio as the AA rated banks, the lower α implies that these banks are willing to tolerate a somewhat higher probability of being downgraded below their current rating. Moody’s rating transition data for banks, as reported in Nickell et al (2000), shows how often banks in actuality are downgraded below a certain threshold from a given initial rating. Acknowledging that there should be a high correspondence between S&P and Moody’s rating categories, the Moody’s data over 1970–1997 shows that an AA bank has a 0.3% probability in a year’s time to be downgraded below single A rating (Nickell et al, 2000, table 2). This implies an α equal to 99.7%.11 Nickell et al (2000) also report model based estimates of bank rating transition probabilities, conditional on the state of the business cycle or the country of bank domicile, which imply values for α between 98.9% and 99.6%.12 By and large, these estimates of α are well in line with our base case calibrated α, 99.60%. 4 Discussion
Our work relates to the recent literature on whether regulatory capital requirements are the binding capital constraint on banks or whether banks’ own economic capital choice exceeds regulatory requirements. Peura and Jokivuolle (2004) study banks’ precautionary capital buffers on top of regulatory minimum capital requirements and argue that when the precautionary buffers are taken into account the resulting bank capital levels may well exceed banks’ economic capital. This is an alternative explanation to the one advocated in this paper that precautionary capital buffers are reserved on top of some minimum economic capital level, associated with a minimum rating target. One cannot directly discriminate which of the two constraints is the binding one because the two confidence levels for not breaching the respective constraints are unobservable. However, evidence in Jackson et al (2002) that bank rating downgrades do have a significant negative effect on banks’ trading volumes in the swap markets lends support to the rating targeting based explanation. This latter explanation is also 11 What should probably be taken into account in inferring α directly from the rating transition probabilities is the alleged autocorrelation of rating changes. That is, the probability that an A rated bank will be further downgraded, conditional on a downgrade from AA to A in the previous period, may be higher than the corresponding unconditional probability. 12 These are based on cumulative transition probabilties over one year horizon for a downgrade from Moody’s Aa to Baa or below (Nickell et al, 2000, tables 6 and 8).

18
supported by the findings in this paper. US AA banks’ actual capital buffers imply a confidence level for maintaining at least an A rating, which is in line with an AA bank’s historical transition probability to a rating below A. Further direct empirical evidence on banks’ rating targeting behaviour would also be helpful. Such evidence until now includes Kisgen (2005b) who shows that firms increase their capital market activity after rating downgrades. His analysis could be extended to a sample that only contains banks. Using his approach, it could be tested whether the A/BBB threshold is more important for banks in particular than the threshold between investment grade and speculative grade that he finds for firms in general. This could complement the evidence for the A rating as a minimum target, which is argued for by Jackson et al (2002) and which also gets support from the bank rating transition probabilities reported in Nickell et al (2000). The ideas on modelling bank capital buffers, developed further in this paper, could also be used in the empirical measurement of actual buffer capital. Until now the evidence on banks’ capital buffers is somewhat mixed. For instance, Ayuso et al (2004), Lindquist (2004), Bikker and Metzemakers (2004) and Jokipii and Milne (2006) all report evidence that banks’ capital buffers move, if anything, counter-cyclically, ie they decrease in booms and increase in downturns. This seems to run counter to the precautionary buffer view which suggests that buffers should be built in good times to be then consumed in bad times when risks are materialised and external capital is hard to come by. However, in these papers the buffer is defined with respect to the Basel 1988 Accord minimum requirements which are not a good proxy for minimum economic capital. Therefore, the results of these studies may not really enable conclusions regarding banks’ capital management with a view on rating targeting. By contrast, Flannery and Rangan (2002) who use market values of equity, show that since the 1990’s US banks’ higher capital levels have clearly become accompanied with the level of their risk-taking. Further empirical analysis which would explicitly consider the interaction between bank ratings, economic capital, and capital buffers, and would control for the time-varying through-the-cycle agency rating criteria (as studied by Altman and Rijken, 2004), would clearly be welcome. The simulation procedure we have used in this paper could also be developed in a number of ways. The bank’s re-lending policy could be added to give a more realistic picture of the bank’s credit portfolio asset management (see Gordy and Howells, 2006, for an example). Secondly, taking account of rating agencies’ ‘through-the-cycle’ rating methodology could be considered (see the discussions in eg Altman and Rijken, 2004, and Gordy and Howells, 2006). Essentially this rating methodology implies that a rating stays constant over an economic cycle if there is no change in the company’s financial position relative to other companies. An implication of through-the-cycle ratings is that a given rating implies a lower

19
probability of default in a cyclical peak than in a trough. Bangia et al (2002), and especially Nickell et al (2000) concerning banks, provide evidence of such state dependent default probabilities. By the same token it could be argued that in our model of rating targeting the minimum economic capital needed for the minimum rating should depend on the state of the business cycle. If the economy were in a boom (recession), more (less) economic capital would be required for a given rating. This could be incorporated in our simulation model by adopting eg the two-state Markov model for the evolution of the business cycle used by Peura and Jokivuolle (2004), which would be used with state dependent rating transition probabilities (see Bangia et al, 2002). 5 Conclusions
In this paper we have suggested a methodology for putting in practice a bank’s pursuance to maintain a minimum credit agency rating. A number of authors have argued that maintaining a sufficiently high rating, in practice single A, is crucial to a high-quality bank’s business operations such as functioning as active derivatives counterparty. We started with the simplifying assumption that a bank’s rating follows from the level of its capitalization relative to its risks, the latter measured by economic capital. In order to maintain a minimum rating a bank then has to maintain over its planning horizon enough equity to meet the economic capital needed for that minimum rating. We cast the rating targeting problem in an extended value-at-risk framework in which one value-at-risk calculation is nested in another. This structure can capture the dynamic economic capital constraint. The model can generate bank capital levels which are much higher than those obtained from standard single period economic capital models, and may hence explain the excess capital results reported in Jackson et al (2002). When calibrated to actual Tier 1 capital held by AA rated US banks, the model implied confidence level related to maintaining at least an A rating over time is broadly in line with the historical transition probability of an AA bank to be downgraded below A.
20
References
Altman, E I – Rijken, H A (2004) How rating agencies achieve rating stability. J. Banking Finance 28, 2679–2714.
Ayuso, J – Pérez, D – Saurina, J (2004) Are capital buffers pro-cyclical?
Evidence from Spanish panel data. J. Financial Intermediation 13, 249–264. Bangia, A – Diebold, F – Kronimus, A – Schagen, C – Schuermann, T (2002)
Ratings migration and the business cycle, with application to credit portfolio stress testing. J. Banking Finance 26, 445–474.
Basel Committee on Banking Supervision (2004) International convergence of
capital measurement and capital standards: A revised framework. Bank for International Settlements, June.
Bikker, J – Metzemakers, P (2004) Is bank capital procyclical? A cross-country
analysis. De Nederlandsche Bank Working Paper 009/2004. Boot, A W A – Milbourn, T T – Schmeits, A (2006) Credit ratings as
coordination mechanisms. R. Financial Studies 19, 81–118. Elizalde, A – Repullo, R (2004) Economic and regulatory capital: What is the
difference? CEPR Discussion Paper No. 4770. Flannery, M J – Rangan, K P (2004) What caused the bank capital build-up of
the 1990s? FDIC Center For Financial Research Working Paper No. 2004-03. Available at SSRN: http://ssrn.com/abstract=681245.
Gordy, M (2000) A comparative anatomy of credit risk models. J. Banking
Finance 24, 119–149. Gordy, M (2003) A risk-factor model foundation for ratings-based bank
capital rules. J. Financial Intermediation 12, 199–232. Gordy, M – Howells, B (2004) Procyclicality in Basel II: Can we treat the
disease without killing the patient? Board of Governors of the Federal Reserve System.

21
Gordy, M – Howells, B (2006) Procyclicality in Basel II: Can we treat the disease without killing the patient? Journal of Financial Intermediation 15, 395–417.
Jackson, P – Perraudin, W – Sapporta, V (2002) Regulatory and ‘economic’
solvency standards for internationally active banks. J. Banking Finance 26, 953–976.
Jokipii, T – Milne, A (2006) Cyclical Behaviour of European Bank Capital
Buffers. Forthcoming in the Journal of Banking and Finance. Jokivuolle, E – Peura, S (2001) Regulatory capital volatility. Risk. May. Jokivuolle, E – Peura, S (2004) Stress tests of banks’ regulatory capital
adequacy: Application to tier 1 capital. In: Ong, M (Ed.), The Basel handbook: A guide for financial practitioners. Riskbooks, 137–154.
Morgan, J P (1997) CreditMetricsTM – Technical Document. Morgan, J P,
New York. Kisgen, D J (2005a) Credit ratings and capital structure. J. Finance,
forthcoming. Kisgen, D J (2005b) Do firms target credit ratings or leverage levels?
Unpublished manuscript. Finance department at Boston College. Lindquist, K (2004) Banks’ buffer capital: How important is risk?
J. International Money Finance 23, 493–513. Nickell, P – Perraudin, W – Varotto, S (2000) Stability of ratings transitions.
J. Banking Finance 24, 203–227. Peura, S – Jokivuolle, E (2004) Simulation based stress tests of banks’
regulatory capital adequacy. J. Banking Finance 28, 1801–1824. Wilde, T (2001) IRB approach explained. Risk. May.

BANK OF FINLAND RESEARCH DISCUSSION PAPERS ISSN 0785-3572, print; ISSN 1456-6184, online 1/2006 Juha-Pekka Niinimäki – Tuomas Takalo – Klaus Kultti The role of comparing
in financial markets with hidden information. 2006. 37 p. ISBN 952-462-256-4, print; ISBN 952-462-257-2, online.
2/2006 Pierre Siklos – Martin Bohl Policy words and policy deeds: the ECB and the
euro. 2006. 44 p. ISBN 952-462-258-0, print; ISBN 952-462-259-9, online. 3/2006 Iftekhar Hasan – Cristiano Zazzara Pricing risky bank loans in the new
Basel II environment. 2006. 46 p. ISBN 952-462-260-2, print; ISBN 952-462-261-0, online.
4/2006 Juha Kilponen – Kai Leitemo Robustness in monetary policymaking: a case
for the Friedman rule. 2006. 19 p. ISBN 952-462-262-9, print; ISBN 952-462-263-7, online.
5/2006 Juha Kilponen – Antti Ripatti Labour and product market competition in a
small open economy – Simulation results using the DGE model of the Finnish economy. 2006. 51 p. ISBN 952-462-264-5, print; ISBN 952-462-265-3, online.
6/2006 Mikael Bask Announcement effects on exchange rate movements:
continuity as a selection criterion among the REE. 2006. 43 p. ISBN 952-462-270-X, print; ISBN 952-462-271-8, online.
7/2006 Mikael Bask Adaptive learning in an expectational difference equation
with several lags: selecting among learnable REE. 2006. 33 p. ISBN 952-462-272-6, print; ISBN 952-462-273-4, online.
8/2006 Mikael Bask Exchange rate volatility without the contrivance of
fundamentals and the failure of PPP. 2006. 17 p. ISBN 952-462-274-2, print; ISBN 952-462-275-0, online.
9/2006 Mikael Bask – Tung Liu – Anna Widerberg The stability of electricity prices:
estimation and inference of the Lyapunov exponents. 2006. 19 p. ISBN 952-462 276-9, print; ISBN 952-462- 277-7, online.
10/2006 Mikael Bask – Jarko Fidrmuc Fundamentals and technical trading:
behavior of exchange rates in the CEECs. 2006. 20 p. ISBN 952-462278-5, print; ISBN 952-462-279-3, online.

11/2006 Markku Lanne – Timo Vesala The effect of a transaction tax on exchange rate volatility. 2006. 20 p. ISBN 952-462-280-7, print; ISBN 952-462-281-5, online.
12/2006 Juuso Vanhala Labour taxation and shock propagation in a New Keynesian
model with search frictions. 2006. 38 p. ISBN 952-462-282-3, print; ISBN 952-462-283-1, online.
13/2006 Michal Kempa Money market volatility – A simulation study. 2006. 36 p.
ISBN 952-462-284-X, print; ISBN 952-462-285-8, online. 14/2006 Jan Toporowski Open market operations: beyond the new consensus. 2006.
33 p. ISBN 952-462-286-6, print; ISBN 952-462-287-4, online. 15/2006 Terhi Jokipii – Brian Lucey Contagion and interdependence: measuring
CEE banking sector co-movements. 2006. 42 p. ISBN 952-462-288-2, print; ISBN 952-462-289-0, online.
16/2006 Elina Rainio Osakeyhtiölain vaikutukset sijoittajan suojaan ja
rahoitusmarkkinoiden kehitykseen. 2006. 52 p. ISBN 952-462-296-3, print; ISBN 952-462-297-1, online.
17/2006 Terhi Jokipii – Alistair Milne The cyclical behaviour of European bank
capital buffers. 2006. 42 p. ISBN 952-462-298-X, print; ISBN 952-462-299-8, online.
18/2006 Patrick M. Crowley – Douglas Maraun – David Mayes How hard is the euro
area core? An evaluation of growth cycles using wavelet analysis. 2006. 42 p. ISBN 952-462-300-5, print; ISBN 952-462-301-3, online.
19/2006 Yehning Chen – Iftekhar Hasan Why do bank runs look like panic? A new
explanation. 2006. 21 p. ISBN 952-462-302-1, print; ISBN 952-462-303-X, online.
20/2006 Tuomas Välimäki Why the marginal MRO rate exceeds the ECB policy
rate? 2006. 36 p. ISBN 952-462-304-8, print; ISBN 952-462-305-6, online. 21/2006 Heli Snellman – Matti Virén ATM networks and cash usage. 2006. 28 p.
ISBN 952-462-308-0, print; ISBN 952-462-309-9, online. 22/2006 Terhi Jokipii Forecasting market crashes: further international evidence.
2006. 39 p. ISBN 952-462-320-X, print; ISBN 952-462-321-8, online.

23/2006 Asokan Anandarajan – Iftekhar Hasan – Cornelia McCarthy The use of loan loss provisions for capital management, earnings management and signalling by Australian banks. 2006. 49 p. ISBN 952-462-322-6, print; ISBN 952-462-323-4, online.
24/2006 Bill B Francis – Iftekhar Hasan – Xian Sun Financial market integration and
the value of global diversification: evidence for US acquirers in cross-border mergers and acquisitions. 2006. 35 p. ISBN 952-462-324-2, print; ISBN 952-462-325-0, online.
25/2006 Federico Ravenna – Juha Seppälä Monetary policy and rejections of the
expectations hypothesis. 2006. 41 p. ISBN 952-462-326-9, print; ISBN 952-462-327-7, online.
26/2006 Ville Mälkönen – Timo Vesala The adverse selection problem in imperfectly
competitive credit markets. 2006. 24 p. ISBN 952-462-328-5, print; ISBN 952-462-329-3, online.
27/2006 Esa Jokivuolle – Samu Peura Rating targeting and the confidence levels
implicit in bank capital. 2006. 21 p. ISBN 978-952-462-332-2, print; ISBN 978-952-462-333-9, online.

Suomen PankkiBank of FinlandP.O.Box 160FI-00101 HELSINKIFinland