Rating mat Lupin (LUPIN) |...
14
May 25, 2017 ICICI Securities Ltd | Retail Equity Research Result Update One-offs, US price erosion hurt Q4… Revenues grew mere 2% YoY to | 4253 crore (I-direct estimate: | 4402 crore) mainly weighed down by 13% de-growth in US to | 1901 crore (I-direct estimate: | 2055 crore). India formulations grew 15% to | 879 crore (I-direct estimate: | 876 crore) while Japan grew 36% Japan to | 469 crore (I-direct estimate: | 505 crore) EBITDA margins declined 1292 bps YoY to 18.4% (I-direct estimate: 31.3%) owing to one-off provision of | 156 crore, forex loss of | 168 crore besides higher R&D and employee expenditure. EBITDA declined 40.1% YoY to | 781 crore (I-direct estimate: | 1093 crore) Net profit declined 49% YoY to | 380 crore (I-direct estimate: | 609 crore) owing to lower EBITDA and higher taxation US business main growth engine despite pricing headwinds Lupin’s US business (~43% of total turnover) is witnessing a shift from branded to generics with a slowdown in the branded space and emergence of generics. Post the acquisition of US based Gavis, the company now owns one of the strongest ANDA pipelines comprising 368 filed ANDAs and 154 pending approvals including 45 FTFs. This acquisition will strengthen its position in dermatology, controlled substance products and other high value niche generics segments besides its maiden foray into US institutional business. We expect US base business to grow at a CAGR of 7% in FY17-19E to | 7125 crore. Indian formulations growth steady Lupin ranks seventh in domestic formulations with a market share of 3.3%. The acute: chronic: sub-chronic ratio for the company is at 32:48:20. In terms of MR productivity, at | 57 lakh per MR it has one of the best MR productivity among large cap peers. Also, tie-ups with Eli Lilly, Boehringer for anti-diabetics and with MSD for pneumonia vaccines are some steps to bolster the domestic franchise. We expect sales from India to grow at a CAGR of 13% in FY16-19E to | 4951 crore. Core strength in geographical diversification, strong financials Lupin has established a significant presence in the US by 1) focusing on limited competition/FTF opportunities, 2) concentration on niche therapies such as oral contraceptives, dermatology, ophthalmology, respiratory, etc, and 3) acquiring small but profitable brands at the right price. It is slowly but surely establishing itself in other geographies such as Japan and Australia. Higher growth on a fairly consistent basis and a strong balance sheet (despite Gavis acquisition) are some of the differentiators for Lupin besides management pedigree. Strong US pipeline but engulfing pricing pressure weighs heavily Q4 was impacted by price erosion in the US, one-offs and higher R&D spending. US sales will remain under pressure in near term due to steep price erosion on the back of client consolidation and increase competition. Although the company owns one of the strongest pending pipelines in the US (154 pending approvals) most of the exiting launches are likely to be loaded and 30+ product launches planned for FY18 are unlikely to fill the void created by gGlumetza and gFortamet. However, surprisingly the management is still guiding for 26-28% EBITDA margins for FY18. It expects double digit growth in FY19 owing to exclusive and limited competition launches like gWelchol, gRenagel and gRanexa. India and Japan are likely to remain strong. However, due to persisting US pricing pressure we have reduced our FY18, FY19 EPS estimates by 17% and 20%, respectively. Our new target price is | 1335 based on 20x (21x earlier) FY19E EPS of | 66.8. The stock has corrected ~35% from its 52 week high level, which we believe is overdone. Rating matrix Rating : Buy Target : | 1335 Target Period : 12-15 months Potential Upside : 17% What’s Changed? Target Changed from | 1760 to | 1335 EPS FY18E Changed from | 67.5 to | 56.2 EPS FY19E Changed from | 83.8 to | 66.8 Rating Unchanged Quarterly Performance Q4FY17 Q4FY16 YoY (%) Q3FY17 QoQ (%) Revenue 4,253.3 4,170.7 2.0 4,482.9 -5.1 EBITDA 781.4 1,305.0 -40.1 1,215.8 -35.7 EBITDA (%) 18.4 31.3 -1292 bps 27.1 -875 bps Net Profit 380.2 747.9 -49.2 630.7 -39.7 Key Financials (| Crore) FY16 FY17E FY18E FY19E Revenues 14208.5 17466.1 17834.2 19597.0 EBITDA 3733.4 4333.3 4450.7 5086.6 Net Profit 2270.7 2550.9 2532.3 3007.2 EPS (|) 50.4 56.6 56.2 66.8 Valuation summary FY16 FY17E FY18E FY19E PE (x) 22.6 20.1 20.3 17.1 Target PE (x) 26.5 23.6 23.7 20.0 EV to EBITDA (x) 15.4 13.0 12.2 10.2 Price to book (x) 4.7 3.9 3.3 2.9 RoNW (%) 20.7 19.1 16.4 16.8 RoCE (%) 18.6 17.2 16.7 19.0 Stock data Particular Market Capitalisation Debt (FY16) Cash (FY16) EV 52 week H/L (|) 1750/1134 Equity capital Face value (|) | 2 | 90.3 crore Amount | 51802 crore | 59055 crore | 7952 crore | 700 crore Price performance (%) 1M 3M 6M 1Y Lupin -9.8 -15.3 -15.8 -16.2 Dr Reddy's -3.7 -12.8 -19.1 -16.8 Sun Pharma -6.1 -10.5 -11.6 -21.9 Research Analyst Siddhant Khandekar [email protected] Mitesh Shah [email protected] Harshal Mehta [email protected] Lupin (LUPIN) | 1140
Transcript of Rating mat Lupin (LUPIN) |...

May 25, 2017
ICICI Securities Ltd | Retail Equity Research
Result Update
One-offs, US price erosion hurt Q4…
Revenues grew mere 2% YoY to | 4253 crore (I-direct estimate:
| 4402 crore) mainly weighed down by 13% de-growth in US to
| 1901 crore (I-direct estimate: | 2055 crore). India formulations grew
15% to | 879 crore (I-direct estimate: | 876 crore) while Japan grew
36% Japan to | 469 crore (I-direct estimate: | 505 crore)
EBITDA margins declined 1292 bps YoY to 18.4% (I-direct estimate:
31.3%) owing to one-off provision of | 156 crore, forex loss of | 168
crore besides higher R&D and employee expenditure. EBITDA
declined 40.1% YoY to | 781 crore (I-direct estimate: | 1093 crore)
Net profit declined 49% YoY to | 380 crore (I-direct estimate: | 609
crore) owing to lower EBITDA and higher taxation
US business main growth engine despite pricing headwinds
Lupin’s US business (~43% of total turnover) is witnessing a shift from
branded to generics with a slowdown in the branded space and
emergence of generics. Post the acquisition of US based Gavis, the
company now owns one of the strongest ANDA pipelines comprising 368
filed ANDAs and 154 pending approvals including 45 FTFs. This
acquisition will strengthen its position in dermatology, controlled
substance products and other high value niche generics segments
besides its maiden foray into US institutional business. We expect US
base business to grow at a CAGR of 7% in FY17-19E to | 7125 crore.
Indian formulations growth steady
Lupin ranks seventh in domestic formulations with a market share of
3.3%. The acute: chronic: sub-chronic ratio for the company is at
32:48:20. In terms of MR productivity, at | 57 lakh per MR it has one of
the best MR productivity among large cap peers. Also, tie-ups with Eli
Lilly, Boehringer for anti-diabetics and with MSD for pneumonia vaccines
are some steps to bolster the domestic franchise. We expect sales from
India to grow at a CAGR of 13% in FY16-19E to | 4951 crore.
Core strength in geographical diversification, strong financials
Lupin has established a significant presence in the US by 1) focusing on
limited competition/FTF opportunities, 2) concentration on niche
therapies such as oral contraceptives, dermatology, ophthalmology,
respiratory, etc, and 3) acquiring small but profitable brands at the right
price. It is slowly but surely establishing itself in other geographies such
as Japan and Australia. Higher growth on a fairly consistent basis and a
strong balance sheet (despite Gavis acquisition) are some of the
differentiators for Lupin besides management pedigree.
Strong US pipeline but engulfing pricing pressure weighs heavily
Q4 was impacted by price erosion in the US, one-offs and higher R&D
spending. US sales will remain under pressure in near term due to steep
price erosion on the back of client consolidation and increase
competition. Although the company owns one of the strongest pending
pipelines in the US (154 pending approvals) most of the exiting launches
are likely to be loaded and 30+ product launches planned for FY18 are
unlikely to fill the void created by gGlumetza and gFortamet. However,
surprisingly the management is still guiding for 26-28% EBITDA margins
for FY18. It expects double digit growth in FY19 owing to exclusive and
limited competition launches like gWelchol, gRenagel and gRanexa. India
and Japan are likely to remain strong. However, due to persisting US
pricing pressure we have reduced our FY18, FY19 EPS estimates by 17%
and 20%, respectively. Our new target price is | 1335 based on 20x (21x
earlier) FY19E EPS of | 66.8. The stock has corrected ~35% from its 52
week high level, which we believe is overdone.
Rating matrix
Rating : Buy
Target : | 1335
Target Period : 12-15 months
Potential Upside : 17%
What’s Changed?
Target Changed from | 1760 to | 1335
EPS FY18E Changed from | 67.5 to | 56.2
EPS FY19E Changed from | 83.8 to | 66.8
Rating Unchanged
Quarterly Performance
Q4FY17 Q4FY16 YoY (%) Q3FY17 QoQ (%)
Revenue 4,253.3 4,170.7 2.0 4,482.9 -5.1
EBITDA 781.4 1,305.0 -40.1 1,215.8 -35.7
EBITDA (%) 18.4 31.3 -1292 bps 27.1 -875 bps
Net Profit 380.2 747.9 -49.2 630.7 -39.7
Key Financials
(| Crore) FY16 FY17E FY18E FY19E
Revenues 14208.5 17466.1 17834.2 19597.0
EBITDA 3733.4 4333.3 4450.7 5086.6
Net Profit 2270.7 2550.9 2532.3 3007.2
EPS (|) 50.4 56.6 56.2 66.8
Valuation summary
FY16 FY17E FY18E FY19E
PE (x) 22.6 20.1 20.3 17.1
Target PE (x) 26.5 23.6 23.7 20.0
EV to EBITDA (x) 15.4 13.0 12.2 10.2
Price to book (x) 4.7 3.9 3.3 2.9
RoNW (%) 20.7 19.1 16.4 16.8
RoCE (%) 18.6 17.2 16.7 19.0
Stock data
Particular
Market Capitalisation
Debt (FY16)
Cash (FY16)
EV
52 week H/L (|) 1750/1134
Equity capital
Face value (|) | 2
| 90.3 crore
Amount
| 51802 crore
| 59055 crore
| 7952 crore
| 700 crore
Price performance (%)
1M 3M 6M 1Y
Lupin -9.8 -15.3 -15.8 -16.2
Dr Reddy's -3.7 -12.8 -19.1 -16.8
Sun Pharma -6.1 -10.5 -11.6 -21.9
Research Analyst
Siddhant Khandekar
Mitesh Shah
Harshal Mehta
Lupin (LUPIN) | 1140

ICICI Securities Ltd | Retail Equity Research Page 2
Variance analysis
(| crore) Q4FY17 Q4FY17E Q4FY16 Q3FY17 YoY (%) QoQ (%) Comments
Revenue 4,253.3 4,401.6 4,170.7 4,482.9 2.0 -5.1 YoY growth in India and Japan largely offset by decline in US
Raw Material Expenses 1,185.1 1,320.5 1,101.0 1,301.6 7.6 -8.9 147 bps YoY contraction in gross margins to 72.1% mainly on the back of
adverse product mix
Employee Expenses 707.8 682.3 577.9 731.2 22.5 -3.2 Increased mainly due to new recruitments at expanded Somerset (Gavis)
facility in the US
Other Expenditure 1,579.1 1,306.2 1,186.8 1,234.3 33.0 27.9 Increased mainly due to higher R&D expenses and | 156 crore of product
related provision. R&D expenses increased 31% YoY to | 671 crore
EBITDA 781.4 1,092.7 1,305.0 1,215.8 -40.1 -35.7
EBITDA (%) 18.4 24.8 31.3 27.1 -1292 bps -875 bps YoY decline in margin mainly due to one-off provision, forex loss of | 168
crore against forx gain of | 26.7 crore in Q4FY16, higher R&D and employee
expenditure. Miss vis-à-vis I-direct estimates mainly due to higher R&D
expenses, one-off provision and forex loss
Interest 40.6 40.1 21.3 45.9 90.9 -11.6
Depreciation 267.4 230.9 148.7 230.9 79.8 15.8 YoY increase in depreciation mainly due to Gavis amortisation
Other Income 45.3 27.8 34.9 103.6 30.0 -56.2
PBT 518.7 849.5 1,169.9 1,042.6 -55.7 -50.3
Tax 136.7 237.9 418.8 409.5 -67.4 -66.6 YoY, QoQ decline mainly due to higher deferred tax. Normalised tax rate was
24%
PAT before MI 382.0 611.7 751.1 633.1 -49.1 -39.7
Minority Interest 1.8 2.3 3.3 2.4 -45.4 -24.6
Net Profit 380.2 609.4 747.9 630.7 -49.2 -39.7 YoY decline mainly due to weak operational performance and higher taxation
Key Metrics
India 878.8 875.7 761.5 991.2 15.4 -11.3
Japan 468.7 505.3 344.2 449.2 36.2 4.3 Strong sales mainly due to sales from 21 acquired products from Shionogi
US 1,900.7 2,055.3 2,187.1 2,175.5 -13.1 -12.6 YoY decline mainly due to price erosion in base business and gGlumetza. Miss
vis-à-vis I-direct expectations was mainly due to higher-than-expected price
erosion in base business
Europe 135.5 137.9 125.4 142.8 8.0 -5.1 Constant currency sales in Germany decline 9.6% YoY to €6.5 million
South Africa 165.8 135.7 113.5 112.7 46.0 47.1 Beat vis-à-vis estimates mainly due to higher-than-expected constant
currency growth. Constant currency growth was 26%
ROW markets 331.0 317.2 275.8 265.1 20.0 24.9 YoY growth mainly due to 37% YoY growth in LATAM to | 127 crore
API 281.5 298.0 283.8 268.4 -0.8 4.9
Change in estimates
(| Crore) Old New % Change Old New % Change
Revenue 19,526.2 17,834.2 -8.7 22,065.0 19,597.0 -11.2 Changed mainly due to higher-than-expected price erosion in the US
EBITDA 5,020.5 4,450.7 -11.3 6,004.2 5,086.6 -15.3
EBITDA Margin (%) 25.7 25.0 -76 bps 27.2 26.0 -126 bps Changed mainly due to adverse product mix
PAT 3,029.2 2,532.3 -16.4 3,768.3 3,007.2 -20.2
EPS (|) 67.2 56.2 -16.4 83.6 66.8 -20.2 Changed mainly due to reduced revenue and EBITDA margins assumptions
FY18E FY19E
Assumptions
Current Comments
(| crore) FY16 FY17E FY18E FY19E FY18E FY19E
India 3,406.4 3,797.1 4,308.9 4,890.4 4,305.3 4,951.1
Japan 1,364.2 1,777.3 2,408.6 2,697.6 2,408.6 3,134.7
US 5,913.2 8,262.6 7,168.8 7,667.1 8,876.6 9,642.1 Change mainly due to higher-than-expected price erosion in base business
Europe 455.4 529.4 582.3 640.5 585.0 643.5
South Africa 399.7 482.2 550.4 633.0 518.4 596.2 Change mainly due to better-than-expected sales in Q4FY17
ROW markets 947.0 1,114.3 1,281.5 1,473.7 1,265.6 1,455.4
API 1,214.9 1,128.7 1,151.3 1,174.3 1,168.1 1,191.5
Earlier
Source: Company, ICICIdirect.com Research

ICICI Securities Ltd | Retail Equity Research Page 3
Company Analysis
From a global leader in anti-tuberculosis (TB) and other infectious
diseases to one of the fastest growing prescription companies in the US,
Lupin has come a long way to emerge as a leading Indian generic
exporter. Established in 1968, the company adapted well as per the
changed industry dynamics like other peers such as Sun, Dr Reddy’s,
Ranbaxy and Cipla. During this journey, it changed focus in therapies -
from acute to chronic and also geographies, from domestic driven to
export oriented. It received USFDA approvals for two facilities-
Ankaleshwar and Mandideep way back in 1989. Besides this, the
company has been fairly active on the global M&A front. It has acquired
companies in Japan (significant acquisitions), Australia, Philippines and
South Africa. Similarly, the company also acquired small ticket but
lucrative brands in the US (Suprax, Antara, Locoid lotion, Inspira Chamber
and Alinia). Its latest acquisition, however, has been a complex injectable
technology based company (Nanomi) in the Netherlands. Infrastructure -
11 manufacturing facilities including two in Japan – seven formulations
(three USFDA approved) and four APIs (two USFDA approved).
Exhibit 1: Return ratios to improve further
25.4 25.4
19.1
21.9 21.6
18.6
26.5
29.8
22.5
27.1
20.7
26.3
26.6
35.7 35.1
17.2
0
5
10
15
20
25
30
35
40
FY12 FY13 FY14 FY15 FY16 FY17E FY18E FY19E
(%
)
RoNW RoCE
Source: Company, ICICIdirect.com Research
Exhibit 2: R&D spend likely to remain at elevated level
465.95 500.64
681.8
929.4
1099
1604
6.0
7.37.7
9.2
13.5 13.5
6.6
5.2
0
300
600
900
1200
1500
1800
2100
FY12 FY13 FY14 FY15 FY16 FY17E FY18E FY19E
3
5
7
9
11
13
15
R & D cost (| crore) R & D cost % revenues
Source: Company, ICICIdirect.com Research
The current financial health of the company is the culmination of prudent
business decisions in the past. Over the last 10 years, revenues, EBITDA
and PAT have grown at a CAGR of 20%, 26% and 21%, respectively.
Considering more recent numbers, in FY12-17, the revenue, EBITDA and
PAT have grown at a CAGR of 20%, 17% and 13% to | 14466 crore,
| 4333 crore and | 2551 crore, respectively. Similarly, during the same
period, the R&D spend as a percentage of sales, has gone up from 6.6%
in FY12 to 9.2% in FY17.
Going ahead, in the near term, we expect revenues, EBITDA and PAT to
grow at a CAGR of 6%, 8% and 9%, respectively, in FY17-19E. However,
from a long term perspective, we believe the company is well poised to
grow at a healthy rate given the strong US pipeline, vast experience and
good understanding of the US market, continued traction in Indian
branded formulations with higher chronic focus and improvement in the
Japanese market, which is perhaps the only geography where there is a
scope for improvement. On the R&D front, we see the composition spend
tilting towards NDDS, NCEs, biosimilars from the current ANDA/NDA
albeit gradually to prepare for the scenario beyond 2020.

ICICI Securities Ltd | Retail Equity Research Page 4
Exhibit 3: Revenues to grow at CAGR of 6% in FY17-19E
7082.9
9641.3
11286.6
12770.0
14208.5
17466.1 17834.2
19597.0
0
3000
6000
9000
12000
15000
18000
21000
FY12 FY13 FY14 FY15 FY16 FY17E FY18E FY19E
(|
crore)
Source: Company, ICICIdirect.com Research
Exhibit 4: US base business pricing pressure, higher base to percolate into negative CAGR
2079.8
3769.5
4887.1
5659.35913.2
8262.6
7168.87667.1
0.0
2000.0
4000.0
6000.0
8000.0
10000.0
FY12 FY13 FY14 FY15 FY16 FY17E FY18E FY19E
US (| crore)
Source: Company, ICICIdirect.com Research
Exhibit 5: Indian formulation sales to grow at CAGR of 14% in FY17-19E
1350.01573.5
2479.6
2968.0
3406.4
3797.1
4308.9
4890.4
0.0
1100.0
2200.0
3300.0
4400.0
5500.0
FY12 FY13 FY14 FY15 FY16 FY17E FY18E FY19E
India (| crore)
Source: Company, ICICIdirect.com Research
Revenues to grow at a CAGR of 6% in FY17-19E to
| 19597 crore driven by 14% growth in the India business,
23% in Japan, 15% in RoW markets, 15% in South Africa,
10% in European markets and 4% de-growth in US
formulations business
Lupin is the fifth largest generics player in the US in terms
of prescriptions. It owns a healthy product pipeline
(including Gavis) in the US (368 ANDAs filed, 154
pending approvals and 214 approvals), which includes
some limited competition products and 45 FTFs
opportunities. It is planning to launch more than 150 (100
owns and 50 from GAVIS) products in the US market in
the next four or five years. Acquisition of Gavis will also
strengthen its position in dermatology, controlled
substance products and other high value niche generics
segments besides its maiden foray into US institutional
business. Lupin is one of the few generic companies that
has a presence in the branded business. Currently, it is
marketing four branded products in the US market,
including two that were in-licensed in the last 12 months.
However, with continued pricing pressure in the US base
business due to buyers consolidation, we expect sales
from the US market to decline at a CAGR of 3.7% in FY17-
19E to | 7667 crore
Lupin is ranked seventh in domestic formulations with a
market share of 3.3%. The company is adding more drugs
in chronic therapies, which would drive growth in the
domestic market. We expect sales from India to grow at a
CAGR of 14% in FY17-19E to | 4890 crore
19.8% CAGR
5.9% CAGR
31.8% CAGR
-3.7% CAGR
23% CAGR
13.5% CAGR

ICICI Securities Ltd | Retail Equity Research Page 5
Exhibit 6: Japanese revenue to grow at CAGR of 23% in FY17-19E
860.8
1304.0 1295.4 1323.9 1364.2
1777.3
2408.6
2697.6
0.0
500.0
1000.0
1500.0
2000.0
2500.0
3000.0
FY12 FY13 FY14 FY15 FY16 FY17E FY18E FY19E
Japan (| crore)
Source: Company, ICICIdirect.com Research
Exhibit 7: EBITDA to grow at CAGR of 8% in FY17-19E
1959
2270
2899
3620 3733
4333 4451
5087
27.7
23.5
25.7
28.3
26.3
24.8 25.0
26.0
0
1000
2000
3000
4000
5000
6000
7000
FY12 FY13 FY14 FY15 FY16 FY17E FY18E FY19E
(|
crore)
15
17
19
21
23
25
27
29
(%
)
EBITDA EBITDA Margins (%)
Source: Company, ICICIdirect.com Research
Exhibit 8: Net profit to grow at CAGR of 9% in FY17-19E
1382.11314.1
1836.4
2403.22270.7
2550.9
3007.2
2532.3
19.5
13.6
16.3
18.8
14.614.2
15.3
16.0
0
500
1000
1500
2000
2500
3000
3500
FY12 FY13 FY14 FY15 FY16 FY17E FY18E FY19E
5
7
9
11
13
15
17
19
Net Profit Net Profit Margins (%)
Source: Company, ICICIdirect.com Research
The Japanese acquisitions i.e. Kyowa and I’rom are yet to
achieve expected critical mass both in terms of
scalability and profitability. While Kyowa profitability is
expected to improve on the back of back-ended
integration by sourcing of APIs from Goa, the I’rom
business remains challenging due to the lumpy nature of
the CRAMS business. Kyowa has acquired 21 branded
products from Shionogi. Recently acquired 21 products
from Shionogi will add to the company’s overall growth.
We expect sales from Japan to grow at a CAGR 23% in
FY17-19E to | 2698 crore mainly due to increase growth
in existing business and consolidation of Shionogi’s
portfolio
15.6% CAGR
23.2% CAGR
ICICI Securities Ltd | Retail Equity Research Page 6
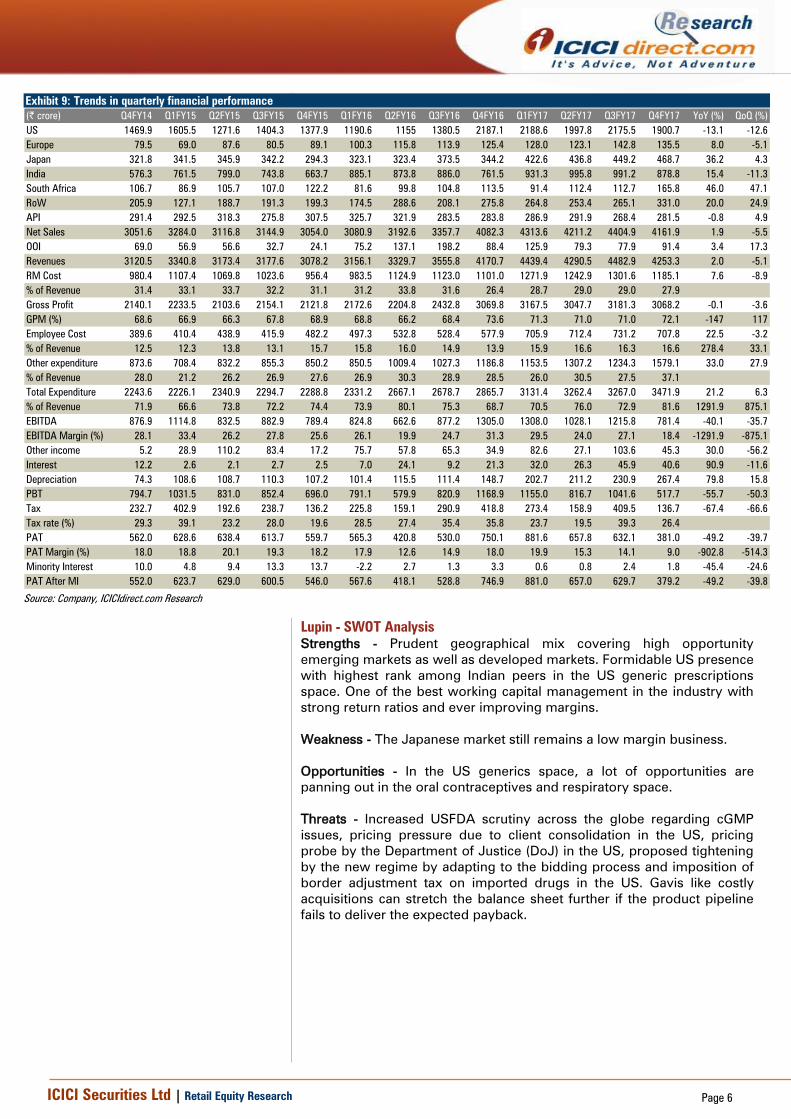
Exhibit 9: Trends in quarterly financial performance
(| crore) Q4FY14 Q1FY15 Q2FY15 Q3FY15 Q4FY15 Q1FY16 Q2FY16 Q3FY16 Q4FY16 Q1FY17 Q2FY17 Q3FY17 Q4FY17 YoY (%) QoQ (%)
US 1469.9 1605.5 1271.6 1404.3 1377.9 1190.6 1155 1380.5 2187.1 2188.6 1997.8 2175.5 1900.7 -13.1 -12.6
Europe 79.5 69.0 87.6 80.5 89.1 100.3 115.8 113.9 125.4 128.0 123.1 142.8 135.5 8.0 -5.1
Japan 321.8 341.5 345.9 342.2 294.3 323.1 323.4 373.5 344.2 422.6 436.8 449.2 468.7 36.2 4.3
India 576.3 761.5 799.0 743.8 663.7 885.1 873.8 886.0 761.5 931.3 995.8 991.2 878.8 15.4 -11.3
South Africa 106.7 86.9 105.7 107.0 122.2 81.6 99.8 104.8 113.5 91.4 112.4 112.7 165.8 46.0 47.1
RoW 205.9 127.1 188.7 191.3 199.3 174.5 288.6 208.1 275.8 264.8 253.4 265.1 331.0 20.0 24.9
API 291.4 292.5 318.3 275.8 307.5 325.7 321.9 283.5 283.8 286.9 291.9 268.4 281.5 -0.8 4.9
Net Sales 3051.6 3284.0 3116.8 3144.9 3054.0 3080.9 3192.6 3357.7 4082.3 4313.6 4211.2 4404.9 4161.9 1.9 -5.5
OOI 69.0 56.9 56.6 32.7 24.1 75.2 137.1 198.2 88.4 125.9 79.3 77.9 91.4 3.4 17.3
Revenues 3120.5 3340.8 3173.4 3177.6 3078.2 3156.1 3329.7 3555.8 4170.7 4439.4 4290.5 4482.9 4253.3 2.0 -5.1
RM Cost 980.4 1107.4 1069.8 1023.6 956.4 983.5 1124.9 1123.0 1101.0 1271.9 1242.9 1301.6 1185.1 7.6 -8.9
% of Revenue 31.4 33.1 33.7 32.2 31.1 31.2 33.8 31.6 26.4 28.7 29.0 29.0 27.9
Gross Profit 2140.1 2233.5 2103.6 2154.1 2121.8 2172.6 2204.8 2432.8 3069.8 3167.5 3047.7 3181.3 3068.2 -0.1 -3.6
GPM (%) 68.6 66.9 66.3 67.8 68.9 68.8 66.2 68.4 73.6 71.3 71.0 71.0 72.1 -147 117
Employee Cost 389.6 410.4 438.9 415.9 482.2 497.3 532.8 528.4 577.9 705.9 712.4 731.2 707.8 22.5 -3.2
% of Revenue 12.5 12.3 13.8 13.1 15.7 15.8 16.0 14.9 13.9 15.9 16.6 16.3 16.6 278.4 33.1
Other expenditure 873.6 708.4 832.2 855.3 850.2 850.5 1009.4 1027.3 1186.8 1153.5 1307.2 1234.3 1579.1 33.0 27.9
% of Revenue 28.0 21.2 26.2 26.9 27.6 26.9 30.3 28.9 28.5 26.0 30.5 27.5 37.1
Total Expenditure 2243.6 2226.1 2340.9 2294.7 2288.8 2331.2 2667.1 2678.7 2865.7 3131.4 3262.4 3267.0 3471.9 21.2 6.3
% of Revenue 71.9 66.6 73.8 72.2 74.4 73.9 80.1 75.3 68.7 70.5 76.0 72.9 81.6 1291.9 875.1
EBITDA 876.9 1114.8 832.5 882.9 789.4 824.8 662.6 877.2 1305.0 1308.0 1028.1 1215.8 781.4 -40.1 -35.7
EBITDA Margin (%) 28.1 33.4 26.2 27.8 25.6 26.1 19.9 24.7 31.3 29.5 24.0 27.1 18.4 -1291.9 -875.1
Other income 5.2 28.9 110.2 83.4 17.2 75.7 57.8 65.3 34.9 82.6 27.1 103.6 45.3 30.0 -56.2
Interest 12.2 2.6 2.1 2.7 2.5 7.0 24.1 9.2 21.3 32.0 26.3 45.9 40.6 90.9 -11.6
Depreciation 74.3 108.6 108.7 110.3 107.2 101.4 115.5 111.4 148.7 202.7 211.2 230.9 267.4 79.8 15.8
PBT 794.7 1031.5 831.0 852.4 696.0 791.1 579.9 820.9 1168.9 1155.0 816.7 1041.6 517.7 -55.7 -50.3
Tax 232.7 402.9 192.6 238.7 136.2 225.8 159.1 290.9 418.8 273.4 158.9 409.5 136.7 -67.4 -66.6
Tax rate (%) 29.3 39.1 23.2 28.0 19.6 28.5 27.4 35.4 35.8 23.7 19.5 39.3 26.4
PAT 562.0 628.6 638.4 613.7 559.7 565.3 420.8 530.0 750.1 881.6 657.8 632.1 381.0 -49.2 -39.7
PAT Margin (%) 18.0 18.8 20.1 19.3 18.2 17.9 12.6 14.9 18.0 19.9 15.3 14.1 9.0 -902.8 -514.3
Minority Interest 10.0 4.8 9.4 13.3 13.7 -2.2 2.7 1.3 3.3 0.6 0.8 2.4 1.8 -45.4 -24.6
PAT After MI 552.0 623.7 629.0 600.5 546.0 567.6 418.1 528.8 746.9 881.0 657.0 629.7 379.2 -49.2 -39.8
Source: Company, ICICIdirect.com Research
Lupin - SWOT Analysis
Strengths - Prudent geographical mix covering high opportunity
emerging markets as well as developed markets. Formidable US presence
with highest rank among Indian peers in the US generic prescriptions
space. One of the best working capital management in the industry with
strong return ratios and ever improving margins.
Weakness - The Japanese market still remains a low margin business.
Opportunities - In the US generics space, a lot of opportunities are
panning out in the oral contraceptives and respiratory space.
Threats - Increased USFDA scrutiny across the globe regarding cGMP
issues, pricing pressure due to client consolidation in the US, pricing
probe by the Department of Justice (DoJ) in the US, proposed tightening
by the new regime by adapting to the bidding process and imposition of
border adjustment tax on imported drugs in the US. Gavis like costly
acquisitions can stretch the balance sheet further if the product pipeline
fails to deliver the expected payback.

ICICI Securities Ltd | Retail Equity Research Page 7
Conference call highlights
The management has guided muted growth in FY18 with 26-28%
EBITDA margins (including other Income). It expects double digit
revenue growth in FY19
Addressable branded market size for 154 pending approvals is ~
$76 billion as per management
In FY18 and FY19, the company expects to launch 30+ products
in the US market
Lupin’s Indore facility has received six Form 483 observations
from the USFDA with respect to May inspection. As per the
management, couple of observations were repeat observations of
Goa plant
In Q4FY17 and FY17, the company has seen single digit price
erosion in US base business. The management anticipates higher
pricing pressure in the US in the near term, due to anticipated
buyers consolidation
The company also saw higher than anticipated competition for
Glumetza and Fortamet in Q4FY17
Gavis facility in the US has cleared two FDA inspections. The
facility received 14 new approvals in FY17 and launched 8
products
The management has reiterated its focus on high value generics
and then building more of a hybrid and a specialty strategy, in
Japan, US and Western Europe
Therapeutic areas the company is focussing are women's health,
paediatrics and CNS, of which the company plans to acquire
products in the paediatrics and CNS.
Guided for 13.5% R&D spending for the next couple of years
The company expects to launch gRanexa (Ranolazine; CVS),
gRenagel (Sevelamer; CVS) and gWelchol (Colesevelam
hydrochloride; CVS) in FY19
For FY19, Ranexa, Minocycline ER (Dermatology) and Moviprep
(gastro kit) are some of the select first to file FTF opportunities for
the company
The company plans to launch gAdvair in FY19 subject to
successful trials
The management has now guided for US$3.5 billion revenues by
FY20
On the biosimilar front, the company expects to file Etanercept
(oncology) in Europe by H2FY18 and in the US by FY19. Apart
from Etanercept, the company also looking for file Pegfilgrastim
and Ranibizumab
Target action date for ProAir (albuterol sulphate, inhalation) is
September 2017

ICICI Securities Ltd | Retail Equity Research Page 8
Exhibit 10: Major Facilities
Location Segment Regulatory Approvals Type
Inspection
Date Outcome
` Formulations USFDA, TGA Australia, WHO GMP, MCC SA Tablets, Capsules, Liquids Jan-16 483 with 3 observations
Ankaleshwar (India) APIs UKMHRA, WHO GMP, ANVISA Brazil, EDQM, KFDA Intermediates and APIs
Mandideep (India) Formulations / APIs USFDA, UKMHRA,WHO GMP, TGA Auatralia APIs- CVS and Ciphalosporins Feb-16 483 with 4 observations
Tarapur (India) APIs USFDA, UKMHRA, WHO GMP APIs Aug-16 No observations
Goa (India) Formulations USFDA, UKMHRA, WHO GMP Solid orals Mar-16 Received EIR
Jammu (India) Formulations WHO GMP, ANVISA Brazil Formulations
Vadodara (India) APIs WHO GMP Intermediates and APIs
Indore (India) Formulations / APIs USFDA, UKMHRA,TGA Auatralia APIs and Formulations Jan-16 483 with 6 observations
Nagpur (India) Formulations WHO and USFDA Formulations
Kyowa (Japan) Formulations PMDA Orals
I' rom (Japan) Formulations PMDA Injectables
Vishakapatnam, AP APIs Under Initiation
Pune (India) R&D Aug-16 No observations
Oldenzaal, Netherlands R&D
Coral Springs, FL R&D
Somerset, NJ Formulations & R&D
Mexico City, Mexico Formulations & R&D
Minas Gerias, Brazil Formulations & R&D
Source: Company, ICICIdirect.com Research
Exhibit 11: Complex generics/speciality updates
Focus Areas FY16 R&D Update Filed Development
NDDDs Continue development (10 NCEs) NA NA
Biosimilars 10 under development; Etanercept started PhIII in Japan; NA 19.1
Respiratory 2 filings; Clinical trials started for 1 MDI; DPI clinical trials to commence in FY17 0.3 17.2
Injectables Nanomi-complex depot injectable development ongoing; LRP injectables development Ongoing NA 12.8
Controlled Subst. Gavis 9 products in market; 12 filings; Further Development ongoing 4.1 7.8
Dermatology Gavis 1 product in market; 24 filings; Development ongoing 3 2.7
Ophthalmology 2 in market; 7 filings; Continue development 3.1 1.8
OC’s 21 products in market; 10 pending approval 1.2 NA
Total 11.7 61.4
Targeted market Size (US$ billion)
Source: Company, ICICIdirect.com Research

ICICI Securities Ltd | Retail Equity Research Page 9
Valuation
Q4 was impacted by price erosion in the US, one-offs and higher R&D
spending. US sales will remain under pressure in the near term due to
steep price erosion on the back of client consolidation and increase
competition. Although the company owns one of the strongest pending
pipelines in the US (154 pending approvals) most existing launches are
likely to be loaded and 30+ product launches planned for FY18 are
unlikely to fill the void created by gGlumetza and gFortamet. However,
surprisingly the management is still guiding for 26-28% EBITDA margins
for FY18. It expects double digit growth in FY19 owing to exclusive and
limited competition launches like gWelchol, gRenagel and gRanexa. India
and Japan are likely to remain strong. However due to persisting US
pricing pressure, we have reduced our FY18, FY19 EPS estimates by 17%
and 20%, respectively. Our new target price is | 1335 based on 20x (21x
earlier) FY19E EPS of | 66.8. The stock has corrected ~35% from its 52
week high level, which we believe is overdone.
Exhibit 12: One year forward PE
0
500
1000
1500
2000
2500
Feb-0
7
Aug-0
7
Feb-0
8
Aug-0
8
Feb-0
9
Aug-0
9
Feb-1
0
Aug-1
0
Feb-1
1
Aug-1
1
Feb-1
2
Aug-1
2
Feb-1
3
Aug-1
3
Feb-1
4
Aug-1
4
Feb-1
5
Aug-1
5
Feb-1
6
Aug-1
6
Feb-1
7
Price 29.4x 21.8x 19.3x 9.2x 4.1x
[
Source: Company, ICICIdirect.com Research
Exhibit 13: One year forward PE of company vs. CNX Pharma
0
5
10
15
20
25
30
35
40
45
Feb-07
Aug-07
Feb-08
Aug-08
Feb-09
Aug-09
Feb-10
Aug-10
Feb-11
Aug-11
Feb-12
Aug-12
Feb-13
Aug-13
Feb-14
Aug-14
Feb-15
Aug-15
Feb-16
Aug-16
Feb-17
(x)
Lupin CNX Pharma
3.9% Premium
Source: Company, ICICIdirect.com Research
Exhibit 14: Valuation
Revenues Growth EPS Growth P/E EV/EBITDA RoNW RoCE
(| crore) (%) (|) (%) (x) (X) (%) (%)
FY16 14209 11.3 50.4 -5.5 22.6 15.4 20.7 18.6
FY17E 17466 22.9 56.6 12.3 20.1 13.0 19.1 17.2
FY18E 17834 2.1 56.2 -0.7 20.3 12.2 16.4 16.7
FY19E 19597 9.9 66.8 18.8 17.1 10.2 16.8 19.0
Source: Company, ICICIdirect.com Research

ICICI Securities Ltd | Retail Equity Research Page 10
Recommendation history vs. Consensus
0
500
1,000
1,500
2,000
2,500
Jan-17Nov-16Aug-16Jun-16Mar-16Jan-16Oct-15Aug-15Jun-15Mar-15Jan-15
(|
)
0.0
10.0
20.0
30.0
40.0
50.0
60.0
70.0
80.0
90.0
(%
)
Price Idirect target Consensus Target Mean % Consensus with BUY
Source: Reuters, Company, ICICIdirect.com Research
Key events
Date Event
Sep-11 Receives USFDA approval for its first oral contraceptive drug norethindrone tablets
Nov-11 Japanese subsidiary Kyowa acquires specialty injectables company I’rom Pharmaceutical
Aug-13 Signs an agreement with Romark Laboratories, which provides exclusive rights to Lupin to promote, distribute and market Alinia (nitazoxanide) oral suspension
brand in the US market
Feb-14 Acquires Dutch firm Nanomi B.V. for an undisclosed amount, foraying into the technology intensive complex injectables space.
Mar-14 Acquires Mexico-based ophthalmic drugs maker Laboratories Grin
Apr-15 Consolidated Pharma Dynamics business in South Africa
May-15 Lupin acquires Brazil's Medquimica Industria Farmaceutica SA
Jul-15 Lupin's Goa facility recieves nine Form 483 observations
Jul-15 Lupin acquires Gavis Pharmaceuticals for US$ 880 million to strengthen its US portfolio
Jul-15 Closes Temmler acquisition in Germany
Mar-16 Completes Gavis acquisition
Jul-16 Goa facility receives establishment inspection report (EIR) from USFDA for July 2015 inspectation
Aug-16 Acquires 21 generic brands from Japan’s Shionogi for $150 million
Nov-16 Goa facility receives establishment inspection report (EIR) from USFDA for March 2016 inspectation
Apr-17 Lupin's Goa facility receives three Form 483 observations from USFDA
May-17 Lupin's Aurangabad facility receives nine Form 483 observations from USFDA
May-17 Opens 100,000 square foot expansion of its manufacturing facilities in Somerset, New Jersey
May-17 Indore facility receives six Form 483 observations from USFDA
Source: Company, ICICIdirect.com Research
Top 10 Shareholders Shareholding Pattern
Rank Investor Name Latest Filing Date % O/S Position Position Change
1 Zyma Laboratories, Ltd. 31-Mar-17 12.32 55.7m 0.0m
2 Rahas Investments Pvt. Ltd. 31-Mar-17 10.20 46.1m 0.0m
3 Visiomed Investments Pvt. Ltd. 31-Mar-17 9.77 44.1m 0.0m
4 Lupin Marketing Pvt. Ltd. 31-Mar-17 9.04 40.8m 0.0m
5 Lupin Investments Pvt. Ltd. 31-Mar-17 3.41 15.4m 0.0m
6 Stewart Investors 31-Mar-17 2.60 11.8m 0.2m
7 First State Investments (HK) Ltd. 31-Mar-17 2.43 11.0m 9.7m
8 National Westminster Bank Plc 31-Dec-16 2.43 11.0m 0.0m
9 Capital World Investors 31-Dec-16 1.75 7.9m 0.0m
10 Jhunjhunwala (Rakesh Radheshyam) 31-Mar-17 1.73 7.8m -0.5m
(in %) Mar-16 Jun-16 Sep-16 Dec-16 Mar-16
Promoter 46.5 46.8 46.8 46.7 46.7
Others 53.5 53.2 53.2 53.3 53.3
Source: Reuters, ICICIdirect.com Research
Recent Activity
Investor name Value ($) Shares Investor name Value ($) Shares
First State Investments (HK) Ltd. 216.5m 9.7m Capital International Investors -134.2m -6.0m
Capital International, Inc. 10.2m 0.5m Lupin International Pvt. Ltd. -40.8m -1.9m
ICICI Prudential Asset Management Co. Ltd. 7.6m 0.3m Abu Dhabi Investment Authority -21.6m -1.0m
DSP BlackRock Investment Managers Pvt. Ltd. 5.5m 0.2m Lyxor Asset Management -18.7m -0.8m
UTI Asset Management Co. Ltd. 4.4m 0.2m Jhunjhunwala (Rakesh Radheshyam) -11.1m -0.5m
Buys Sells
Source: Reuters, ICICIdirect.com Research
ICICI Securities Ltd | Retail Equity Research Page 11
.
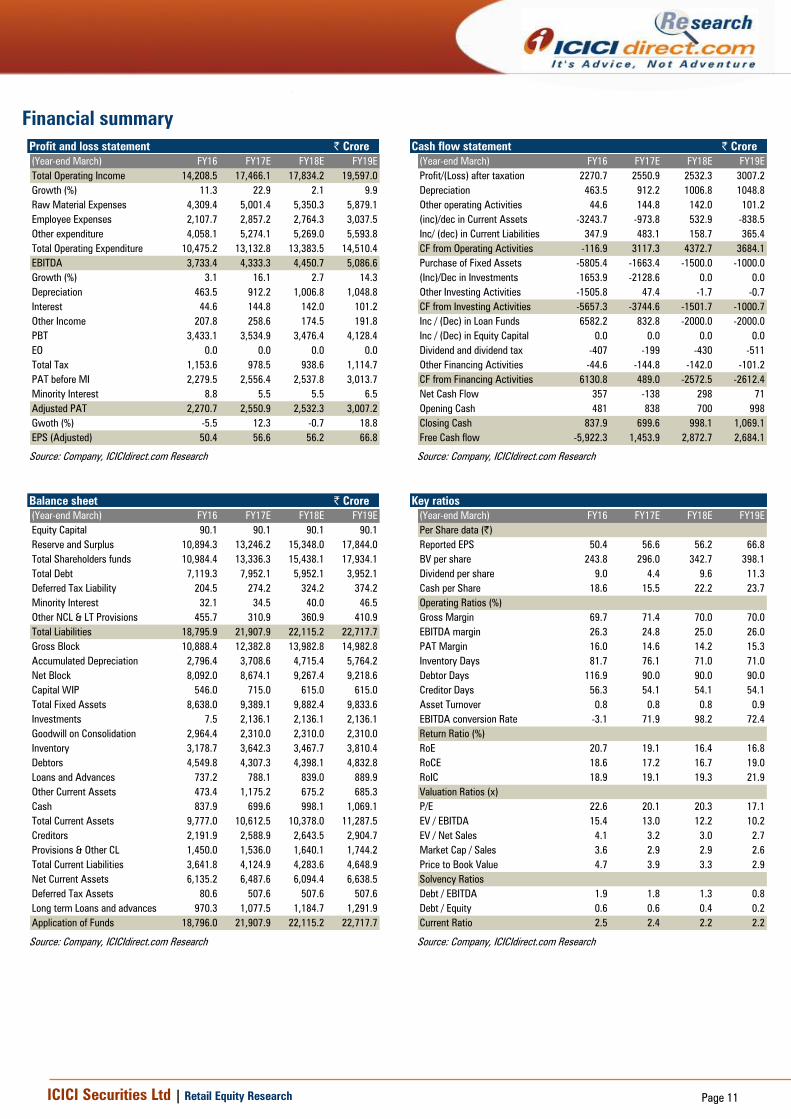
Financial summary
Profit and loss statement | Crore
(Year-end March) FY16 FY17E FY18E FY19E
Total Operating Income 14,208.5 17,466.1 17,834.2 19,597.0
Growth (%) 11.3 22.9 2.1 9.9
Raw Material Expenses 4,309.4 5,001.4 5,350.3 5,879.1
Employee Expenses 2,107.7 2,857.2 2,764.3 3,037.5
Other expenditure 4,058.1 5,274.1 5,269.0 5,593.8
Total Operating Expenditure 10,475.2 13,132.8 13,383.5 14,510.4
EBITDA 3,733.4 4,333.3 4,450.7 5,086.6
Growth (%) 3.1 16.1 2.7 14.3
Depreciation 463.5 912.2 1,006.8 1,048.8
Interest 44.6 144.8 142.0 101.2
Other Income 207.8 258.6 174.5 191.8
PBT 3,433.1 3,534.9 3,476.4 4,128.4
EO 0.0 0.0 0.0 0.0
Total Tax 1,153.6 978.5 938.6 1,114.7
PAT before MI 2,279.5 2,556.4 2,537.8 3,013.7
Minority Interest 8.8 5.5 5.5 6.5
Adjusted PAT 2,270.7 2,550.9 2,532.3 3,007.2
Gwoth (%) -5.5 12.3 -0.7 18.8
EPS (Adjusted) 50.4 56.6 56.2 66.8
Source: Company, ICICIdirect.com Research
Cash flow statement | Crore
(Year-end March) FY16 FY17E FY18E FY19E
Profit/(Loss) after taxation 2270.7 2550.9 2532.3 3007.2
Depreciation 463.5 912.2 1006.8 1048.8
Other operating Activities 44.6 144.8 142.0 101.2
(inc)/dec in Current Assets -3243.7 -973.8 532.9 -838.5
Inc/ (dec) in Current Liabilities 347.9 483.1 158.7 365.4
CF from Operating Activities -116.9 3117.3 4372.7 3684.1
Purchase of Fixed Assets -5805.4 -1663.4 -1500.0 -1000.0
(Inc)/Dec in Investments 1653.9 -2128.6 0.0 0.0
Other Investing Activities -1505.8 47.4 -1.7 -0.7
CF from Investing Activities -5657.3 -3744.6 -1501.7 -1000.7
Inc / (Dec) in Loan Funds 6582.2 832.8 -2000.0 -2000.0
Inc / (Dec) in Equity Capital 0.0 0.0 0.0 0.0
Dividend and dividend tax -407 -199 -430 -511
Other Financing Activities -44.6 -144.8 -142.0 -101.2
CF from Financing Activities 6130.8 489.0 -2572.5 -2612.4
Net Cash Flow 357 -138 298 71
Opening Cash 481 838 700 998
Closing Cash 837.9 699.6 998.1 1,069.1
Free Cash flow -5,922.3 1,453.9 2,872.7 2,684.1
Source: Company, ICICIdirect.com Research
Balance sheet | Crore
(Year-end March) FY16 FY17E FY18E FY19E
Equity Capital 90.1 90.1 90.1 90.1
Reserve and Surplus 10,894.3 13,246.2 15,348.0 17,844.0
Total Shareholders funds 10,984.4 13,336.3 15,438.1 17,934.1
Total Debt 7,119.3 7,952.1 5,952.1 3,952.1
Deferred Tax Liability 204.5 274.2 324.2 374.2
Minority Interest 32.1 34.5 40.0 46.5
Other NCL & LT Provisions 455.7 310.9 360.9 410.9
Total Liabilities 18,795.9 21,907.9 22,115.2 22,717.7
Gross Block 10,888.4 12,382.8 13,982.8 14,982.8
Accumulated Depreciation 2,796.4 3,708.6 4,715.4 5,764.2
Net Block 8,092.0 8,674.1 9,267.4 9,218.6
Capital WIP 546.0 715.0 615.0 615.0
Total Fixed Assets 8,638.0 9,389.1 9,882.4 9,833.6
Investments 7.5 2,136.1 2,136.1 2,136.1
Goodwill on Consolidation 2,964.4 2,310.0 2,310.0 2,310.0
Inventory 3,178.7 3,642.3 3,467.7 3,810.4
Debtors 4,549.8 4,307.3 4,398.1 4,832.8
Loans and Advances 737.2 788.1 839.0 889.9
Other Current Assets 473.4 1,175.2 675.2 685.3
Cash 837.9 699.6 998.1 1,069.1
Total Current Assets 9,777.0 10,612.5 10,378.0 11,287.5
Creditors 2,191.9 2,588.9 2,643.5 2,904.7
Provisions & Other CL 1,450.0 1,536.0 1,640.1 1,744.2
Total Current Liabilities 3,641.8 4,124.9 4,283.6 4,648.9
Net Current Assets 6,135.2 6,487.6 6,094.4 6,638.5
Deferred Tax Assets 80.6 507.6 507.6 507.6
Long term Loans and advances 970.3 1,077.5 1,184.7 1,291.9
Application of Funds 18,796.0 21,907.9 22,115.2 22,717.7
Source: Company, ICICIdirect.com Research
Key ratios
(Year-end March) FY16 FY17E FY18E FY19E
Per Share data (|)
Reported EPS 50.4 56.6 56.2 66.8
BV per share 243.8 296.0 342.7 398.1
Dividend per share 9.0 4.4 9.6 11.3
Cash per Share 18.6 15.5 22.2 23.7
Operating Ratios (%)
Gross Margin 69.7 71.4 70.0 70.0
EBITDA margin 26.3 24.8 25.0 26.0
PAT Margin 16.0 14.6 14.2 15.3
Inventory Days 81.7 76.1 71.0 71.0
Debtor Days 116.9 90.0 90.0 90.0
Creditor Days 56.3 54.1 54.1 54.1
Asset Turnover 0.8 0.8 0.8 0.9
EBITDA conversion Rate -3.1 71.9 98.2 72.4
Return Ratio (%)
RoE 20.7 19.1 16.4 16.8
RoCE 18.6 17.2 16.7 19.0
RoIC 18.9 19.1 19.3 21.9
Valuation Ratios (x)
P/E 22.6 20.1 20.3 17.1
EV / EBITDA 15.4 13.0 12.2 10.2
EV / Net Sales 4.1 3.2 3.0 2.7
Market Cap / Sales 3.6 2.9 2.9 2.6
Price to Book Value 4.7 3.9 3.3 2.9
Solvency Ratios
Debt / EBITDA 1.9 1.8 1.3 0.8
Debt / Equity 0.6 0.6 0.4 0.2
Current Ratio 2.5 2.4 2.2 2.2
Source: Company, ICICIdirect.com Research

ICICI Securities Ltd | Retail Equity Research Page 12
ICICIdirect.com coverage universe (Healthcare)
Company I-Direct CMP TP Rating M Cap
Code (|) (|) (| Cr) FY16 FY17E FY18E FY19E FY16 FY17E FY18E FY19E FY16 FY17E FY18E FY19E FY16 FY17E FY18E FY19E
Ajanta Pharma AJAPHA 1616 1,880 Buy 14222.9 45.4 58.5 61.7 72.4 35.6 27.6 26.2 22.3 42.9 40.6 33.8 31.7 34.2 32.6 27.0 25.2
Alembic Pharma ALEMPHA 570 615 Hold 10752.9 38.2 21.4 23.4 30.2 14.9 26.7 24.4 18.9 51.5 26.1 22.3 24.7 44.9 21.4 20.0 21.8
Apollo Hospitals APOHOS 1205 1,440 Buy 16768.1 26.7 20.9 24.2 35.6 45.1 57.7 49.9 33.8 9.2 7.5 8.4 11.4 10.8 7.9 8.4 11.2
Aurobindo Pharma AURPHA 526 965 Buy 30791.1 33.9 38.7 39.5 49.1 15.5 13.6 13.3 10.7 23.3 23.6 20.9 22.6 28.1 24.6 20.3 20.5
Biocon BIOCON 934 1,020 Hold 18680.0 23.1 31.0 25.5 40.8 40.4 30.1 36.6 22.9 9.1 11.4 10.4 15.3 11.4 13.5 10.2 14.5
Cadila Healthcare CADHEA 427 425 Hold 43683.1 15.0 12.2 16.9 21.5 28.5 34.9 25.2 19.9 26.7 15.2 20.1 23.0 28.6 19.9 22.9 23.8
Cipla CIPLA 504.1 575 Hold 40557.3 18.5 17.2 24.3 31.4 27.3 29.3 20.7 16.0 12.0 10.5 13.9 16.4 12.5 10.6 13.2 14.9
Divi's Lab DIVLAB 550 700 Hold 14594.1 41.8 41.1 42.8 47.8 13.2 13.4 12.8 11.5 30.7 26.8 24.4 23.7 25.9 21.6 19.3 18.6
Dr Reddy's Labs DRREDD 2428 2,610 Hold 40221.1 141.4 68.6 106.1 137.3 17.2 35.4 22.9 17.7 17.3 6.3 10.8 13.7 20.6 9.4 13.0 14.7
Glenmark Pharma GLEPHA 612 910 Buy 17265.9 32.2 46.9 47.0 49.4 19.0 13.0 13.0 12.4 16.2 20.6 19.5 18.9 21.2 25.9 20.8 18.1
Indoco Remedies INDREM 192.4 235 Hold 1772.5 9.4 8.7 12.7 15.6 20.5 22.0 15.1 12.3 12.9 9.5 13.9 16.1 14.8 12.4 15.8 16.8
Ipca Laboratories IPCLAB 489 560 Hold 6172.3 10.0 15.0 24.1 31.1 48.8 32.5 20.3 15.7 5.7 9.8 12.7 14.8 5.5 7.8 11.3 13.0
Jubilant Life JUBLIF 709.9 810 Buy 11307.4 26.0 36.1 48.8 66.0 27.3 19.7 14.6 10.8 12.0 13.3 15.1 18.4 14.2 16.8 18.7 20.4
Lupin LUPIN 1140 1,760 Buy 51499.5 50.4 61.7 67.2 83.6 22.6 18.5 17.0 13.6 18.6 20.2 20.8 23.9 20.7 20.9 19.2 19.9
Natco Pharma NATPHA 889.9 870 Buy 15510.8 8.5 25.3 14.8 18.2 104.9 35.2 60.3 48.9 16.0 33.0 17.6 19.2 11.9 27.2 14.0 15.0
Sun Pharma SUNPHA 592 765 Buy 141986.5 23.4 30.4 30.1 35.5 25.2 19.4 19.7 16.7 18.6 19.3 17.2 17.9 18.0 19.5 16.6 16.9
Syngene Int. SYNINT 458 515 Hold 9152.0 11.1 14.3 14.4 18.4 40.5 31.2 31.0 24.3 13.2 16.8 16.0 18.1 21.0 21.9 18.4 19.1
Torrent Pharma TORPHA 1220 1,475 Buy 20645.3 107.8 57.0 62.1 77.4 11.3 21.4 19.7 15.8 46.7 21.5 23.7 26.4 53.8 23.5 21.4 22.2
Unichem Lab UNILAB 251.5 285 Hold 2286.2 12.3 12.9 17.4 23.5 20.4 19.5 14.5 10.7 13.8 14.3 16.1 18.8 11.7 11.1 13.3 15.6
RoE (%)EPS (|) PE(x) RoCE (%)
Source: Company, ICICIdirect.com Research

ICICI Securities Ltd | Retail Equity Research Page 13
RATING RATIONALE
ICICIdirect.com endeavours to provide objective opinions and recommendations. ICICIdirect.com
assigns ratings to its stocks according to their notional target price vs. current market price and then
categorises them as Strong Buy, Buy, Hold and Sell. The performance horizon is two years unless
specified and the notional target price is defined as the analysts' valuation for a stock.
Strong Buy: >15%/20% for large caps/midcaps, respectively, with high conviction;
Buy: >10%/15% for large caps/midcaps, respectively;
Hold: Up to +/-10%;
Sell: -10% or more;
Pankaj Pandey Head – Research [email protected]
m
ICICIdirect.com Research
Desk,
ICICI Securities Limited,
1st Floor, Akruti Trade Centre,
Road No 7, MIDC,
Andheri (East)
Mumbai – 400 093
RATING RATIONALE
ICICIdirect.com endeavours to provide objective opinions and recommendations. ICICIdirect.com assigns
ratings to its stocks according to their notional target price vs. current market price and then categorises them
as Strong Buy, Buy, Hold and Sell. The performance horizon is two years unless specified and the notional
target price is defined as the analysts' valuation for a stock.
Strong Buy: >15%/20% for large caps/midcaps, respectively, with high conviction;
Buy: >10%/15% for large caps/midcaps, respectively;
Hold: Up to +/-10%;
Sell: -10% or more;
Pankaj Pandey Head – Research [email protected]
ICICIdirect.com Research Desk,
ICICI Securities Limited,
1st Floor, Akruti Trade Centre,
Road No 7, MIDC,
Andheri (East)
Mumbai – 400 093

ICICI Securities Ltd | Retail Equity Research Page 14
ANALYST CERTIFICATION
We /I, Siddhant Khandekar CA-INTER, Mitesh Shah MS (Finance) Harshal Mehta MTech (Biotechnology) Research Analysts, authors and the names subscribed to this report, hereby certify that all of the views
expressed in this research report accurately reflect our views about the subject issuer(s) or securities. We also certify that no part of our compensation was, is, or will be directly or indirectly related to the
specific recommendation(s) or view(s) in this report.
Terms & conditions and other disclosures:
ICICI Securities Limited (ICICI Securities) is a full-service, integrated investment banking and is, inter alia, engaged in the business of stock brokering and distribution of financial products. ICICI Securities
Limited is a Sebi registered Research Analyst with Sebi Registration Number – INH000000990. ICICI Securities is a wholly-owned subsidiary of ICICI Bank which is India’s largest private sector bank and has its
various subsidiaries engaged in businesses of housing finance, asset management, life insurance, general insurance, venture capital fund management, etc. (“associates”), the details in respect of which are
available on www.icicibank.com.
ICICI Securities is one of the leading merchant bankers/ underwriters of securities and participate in virtually all securities trading markets in India. We and our associates might have investment banking and
other business relationship with a significant percentage of companies covered by our Investment Research Department. ICICI Securities generally prohibits its analysts, persons reporting to analysts and their
relatives from maintaining a financial interest in the securities or derivatives of any companies that the analysts cover.
The information and opinions in this report have been prepared by ICICI Securities and are subject to change without any notice. The report and information contained herein is strictly confidential and meant
solely for the selected recipient and may not be altered in any way, transmitted to, copied or distributed, in part or in whole, to any other person or to the media or reproduced in any form, without prior
written consent of ICICI Securities. While we would endeavour to update the information herein on a reasonable basis, ICICI Securities is under no obligation to update or keep the information current. Also,
there may be regulatory, compliance or other reasons that may prevent ICICI Securities from doing so. Non-rated securities indicate that rating on a particular security has been suspended temporarily and
such suspension is in compliance with applicable regulations and/or ICICI Securities policies, in circumstances where ICICI Securities might be acting in an advisory capacity to this company, or in certain other
circumstances.
This report is based on information obtained from public sources and sources believed to be reliable, but no independent verification has been made nor is its accuracy or completeness guaranteed. This
report and information herein is solely for informational purpose and shall not be used or considered as an offer document or solicitation of offer to buy or sell or subscribe for securities or other financial
instruments. Though disseminated to all the customers simultaneously, not all customers may receive this report at the same time. ICICI Securities will not treat recipients as customers by virtue of their
receiving this report. Nothing in this report constitutes investment, legal, accounting and tax advice or a representation that any investment or strategy is suitable or appropriate to your specific circumstances.
The securities discussed and opinions expressed in this report may not be suitable for all investors, who must make their own investment decisions, based on their own investment objectives, financial
positions and needs of specific recipient. This may not be taken in substitution for the exercise of independent judgment by any recipient. The recipient should independently evaluate the investment risks. The
value and return on investment may vary because of changes in interest rates, foreign exchange rates or any other reason. ICICI Securities accepts no liabilities whatsoever for any loss or damage of any kind
arising out of the use of this report. Past performance is not necessarily a guide to future performance. Investors are advised to see Risk Disclosure Document to understand the risks associated before
investing in the securities markets. Actual results may differ materially from those set forth in projections. Forward-looking statements are not predictions and may be subject to change without notice.
ICICI Securities or its associates might have managed or co-managed public offering of securities for the subject company or might have been mandated by the subject company for any other assignment in
the past twelve months.
ICICI Securities or its associates might have received any compensation from the companies mentioned in the report during the period preceding twelve months from the date of this report for services in
respect of managing or co-managing public offerings, corporate finance, investment banking or merchant banking, brokerage services or other advisory service in a merger or specific transaction.
ICICI Securities or its associates might have received any compensation for products or services other than investment banking or merchant banking or brokerage services from the companies mentioned in
the report in the past twelve months.
ICICI Securities encourages independence in research report preparation and strives to minimize conflict in preparation of research report. ICICI Securities or its associates or its analysts did not receive any
compensation or other benefits from the companies mentioned in the report or third party in connection with preparation of the research report. Accordingly, neither ICICI Securities nor Research Analysts
and their relatives have any material conflict of interest at the time of publication of this report.
It is confirmed that Siddhant Khandekar CA-INTER, Mitesh Shah MS (Finance) Harshal Mehta MTech (Biotechnology) Research Analysts of this report have not received any compensation from the companies
mentioned in the report in the preceding twelve months.
Compensation of our Research Analysts is not based on any specific merchant banking, investment banking or brokerage service transactions.
ICICI Securities or its subsidiaries collectively or Research Analysts or their relatives do not own 1% or more of the equity securities of the Company mentioned in the report as of the last day of the month
preceding the publication of the research report.
Since associates of ICICI Securities are engaged in various financial service businesses, they might have financial interests or beneficial ownership in various companies including the subject
company/companies mentioned in this report.
It is confirmed that Siddhant Khandekar CA-INTER, Mitesh Shah MS (Finance) Harshal Mehta MTech (Biotechnology) Research Analysts do not serve as an officer, director or employee of the companies
mentioned in the report.
ICICI Securities may have issued other reports that are inconsistent with and reach different conclusion from the information presented in this report.
Neither the Research Analysts nor ICICI Securities have been engaged in market making activity for the companies mentioned in the report.
We submit that no material disciplinary action has been taken on ICICI Securities by any Regulatory Authority impacting Equity Research Analysis activities.
This report is not directed or intended for distribution to, or use by, any person or entity who is a citizen or resident of or located in any locality, state, country or other jurisdiction, where such distribution,
publication, availability or use would be contrary to law, regulation or which would subject ICICI Securities and affiliates to any registration or licensing requirement within such jurisdiction. The securities
described herein may or may not be eligible for sale in all jurisdictions or to certain category of investors. Persons in whose possession this document may come are required to inform themselves of and to
observe such restriction.
report and information herein is solely for informational purpose and shall not be used or considered as an offer document or solicitation of offer to buy or sell or subscribe for securities or other financial
instruments. Though disseminated to all the customers simultaneously, not all customers may receive this report at the same time. ICICI Securities will not treat recipients as customers by virtue of their
receiving this report. Nothing in this report constitutes investment, legal, accounting and tax advice or a representation that any investment or strategy is suitable or appropriate to your specific circumstances.
The securities discussed and opinions expressed in this report may not be suitable for all investors, who must make their own investment decisions, based on their own investment objectives, financial
positions and needs of specific recipient. This may not be taken in substitution for the exercise of independent judgment by any recipient. The recipient should independently evaluate the investment risks. The
value and return on investment may vary because of changes in interest rates, foreign exchange rates or any other reason. ICICI Securities accepts no liabilities whatsoever for any loss or damage of any kind
arising out of the use of this report. Past performance is not necessarily a guide to future performance. Investors are advised to see Risk Disclosure Document to understand the risks associated before
investing in the securities markets. Actual results may differ materially from those set forth in projections. Forward-looking statements are not predictions and may be subject to
change without notice.
ICICI Securities or its associates might have managed or co-managed public offering of securities for the subject company or might have been mandated by the subject company for any other assignment in
the past twelve months.
ICICI Securities or its associates might have received any compensation from the companies mentioned in the report during the period preceding twelve months from the date of this report for services in
respect of managing or co-managing public offerings, corporate finance, investment banking or merchant banking, brokerage services or other advisory service in a merger or specific transaction.
ICICI Securities or its associates might have received any compensation for products or services other than investment banking or merchant banking or brokerage services from the companies mentioned in
the report in the past twelve months.
ICICI Securities encourages independence in research report preparation and strives to minimize conflict in preparation of research report. ICICI Securities or its analysts did not receive any compensation or
other benefits from the companies mentioned in the report or third party in connection with preparation of the research report. Accordingly, neither ICICI Securities nor Research Analysts have any material
conflict of interest at the time of publication of this report.
It is confirmed that Siddhant Khandekar CA-INTER Mitesh Shah MS (Finance), Harshal Mehta MTech (Biotechnology) Research Analysts of this report have not received any compensation from the companies
mentioned in the report in the preceding twelve months.
Compensation of our Research Analysts is not based on any specific merchant banking, investment banking or brokerage service transactions.