Rating Marine Container Securitizationss3.amazonaws.com/cdn.orrick.com/files/322626.pdf · report...
19
FEBRUARY 2018 Rating Marine Container Securitizations METHODOLOGY
Transcript of Rating Marine Container Securitizationss3.amazonaws.com/cdn.orrick.com/files/322626.pdf · report...

F E B R U A R Y 2 0 1 8
Rating Marine Container Securitizations
M E T H O D O L O G Y

Structured Finance: Marine Container ABS February 2018
Rating Marine Container Securitizations DBRS.COM 2
DBRS is a full-service credit rating agency established in 1976. Spanning North America, Europe and Asia, DBRS is respected for its independent, third-party evaluations of corporate and government issues. DBRS’s extensive coverage of securitizations and structured finance transactions solidifies our standing as a leading provider of comprehensive, in-depth credit analysis.
All DBRS ratings and research are available in hard-copy format and electronically on Bloomberg and at DBRS.com, our lead delivery tool for organized, web-based, up-to-the-minute information. We remain committed to continuously refining our expertise in the analysis of credit quality and are dedicated to maintaining objective and credible opinions within the global financial marketplace.
Contact Information
Sergey Moiseenko Senior Vice PresidentU.S. ABSGlobal Structured FinanceTel. +1 212 806 [email protected]
Chuck Weilamann Managing DirectorHead of U.S. ABSGlobal Structured FinanceTel. +1 212 806 [email protected]
Kathleen Tillwitz Managing DirectorHead of U.S. and European Operational RiskGlobal Structured FinanceTel. +1 212 806 [email protected]
Claire J. MezzanotteGroup Managing DirectorHead of Global Structured FinanceTel. +1 212 806 [email protected]
Related Research
For a list of the Structured Finance relatedmethodologies for our principal Structured Financeasset class methodologies that may be usedduring the rating process, please see the DBRSGlobal Structured Finance Related Methodologiesdocument on www.dbrs.com. Please note that notevery related methodology listed under a principalStructured Finance asset class methodology maybe used to rate or monitor an individual structuredfinance or debt obligation.
Table of ContentsKey Updates in this Methodology 3
Scope and Limitations 3
Executive Summary 3
Industry Overview 4
Key Collateral Performance Drivers 8
Operational Risk Review 9
ABS Financial Structure 10
Legal Structure 12
Data Review and Developing Cash Flow Expectations 12
Cash Flow Analysis 13
Surveillance 18

Structured Finance: Marine Container ABS February 2018
Rating Marine Container Securitizations DBRS.COM 3
Key Updates in this Methodology
For key updates in this methodology, please refer to the press release titled “DBRS Publishes Updated Methodology for Rating Marine Container Securitizations,” dated February 5, 2018.
Scope and Limitations
DBRS evaluates both qualitative and quantitative factors when assigning ratings to a U.S. structured finance transaction. This methodology represents the current DBRS approach for rating securitizations backed by marine containers, related lease contracts as well as other related assets and proceeds thereof. It describes the DBRS approach to analysis, which includes (1) review of the quality of the sponsor/manager, (2) assessment of the collateral pool and (3) utilization of collateral performance evaluation techniques. This report discusses the methods DBRS typically employs when assessing a transaction and assigning a rating. It is important to note that the methods described herein may not be applicable in all cases. Further, this methodology is meant to provide guidance regarding the DBRS methods used in the sector and should not be interpreted with formulaic inflexibility, but understood in the context of the dynamic environment in which it is intended to be applied.
Executive Summary
This methodology summarizes the DBRS approach typically used for rating marine container securitizations. The key analytical considerations which are reviewed by DBRS typically include the following:• Quality of management, operational capabilities and financial condition of the sponsoring container leasing company;
• Composition of the collateral assets by asset type, lease term and lessee;
• Historical performance of a sponsor’s managed container fleet with respect to utilization and per diem rates, residual value realizations, direct operating expenses as well as lessee defaults and recoveries;
• Competitive landscape including projected rate of growth for containerized trade and estimated container supply and demand by key asset types in the near to medium term;
• Transaction capital structure and priority of payments; and
• Legal structure and opinions.
DBRS typically evaluates a securitization transaction based on a combined review of container assets and associated lease contracts and the risks related to a sponsoring leasing company’s need to manage assets over the life of a transaction. Given the relatively servicing-intensive nature of a typical marine container asset-backed security (ABS) transaction, DBRS usually considers the strength of the manager to be one of the qualitative inputs in its analysis. DBRS’s rating methodology does not, however, contemplate explicit linkage of a manager’s rating to the final rating of a marine container securitization.
In its cash flow analysis, DBRS typically develops individual expected collateral performance assumptions for each major container type (e.g., 40-foot high-cube (HC) dry container) pledged as collateral to an ABS transaction in order to (1) reflect diverging volatility of key performance variables for different container types and (2) factor in the differences in business strategy, historical performance and fleet mix between the managers. In certain circumstances, DBRS may also make public the more generalized collateral performance assumptions, which, in its view, would reflect the prevailing state of a broader industry without taking into account any specific track record and/or asset type expertise of a particular container leasing company.
The performance variables then usually become subject to stresses of differing severity, with a stressful environment assumed to exist intermittently for more than half of the life of a typical marine container securitization. DBRS’s stress levels, which increase with each higher rating category, are generally a reflection of presumed risk based on the historical frequency, magnitude and duration of deterioration in the performance of the collateral performance variables.
Structured Finance: Marine Container ABS February 2018
Rating Marine Container Securitizations DBRS.COM 4
DBRS typically performs an operational risk review and assessment of the parties involved in procurement of containers, lease origination and management of the container fleet. The operational risk review provides insight into the process that may impact the collateral pool’s performance. In addition, DBRS typically reviews the manager’s financial condition. For each rating category in a transaction, DBRS typically reviews the contemplated transaction structure under stress scenarios to determine the ability to pay interest and to repay the principal in accordance with the terms of the transaction documents. In the transactions, where scheduled principal amortization envisions the balloon principal repayment, DBRS may consider the value of remaining collateral (typically, estimated on a “going-concern” basis) in the event the issuer is unable to make such balloon payment or refinance the transaction.
DBRS typically reviews the transaction’s legal structure and opinions to assess whether all customary steps have been taken and no subsequent actions are warranted to protect the securitization issuer’s ownership of the assets and the perfected security interest of the securitization investors in the issuer’s assets.
Industry Overview
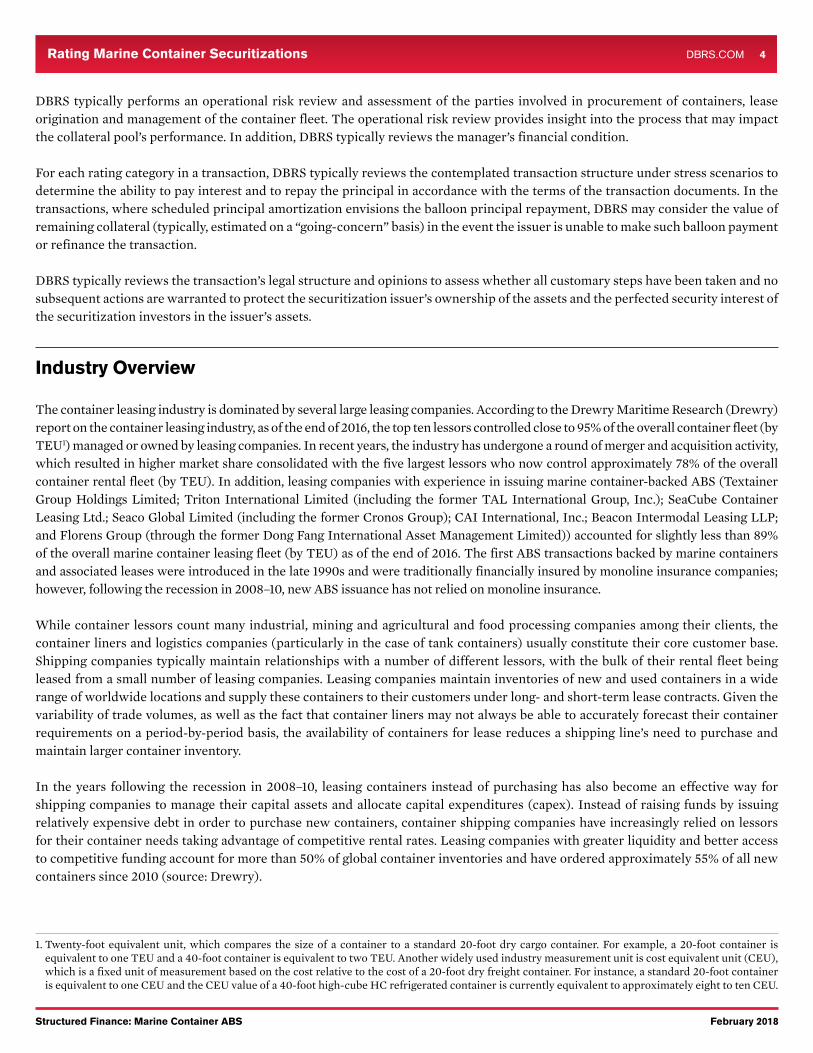
The container leasing industry is dominated by several large leasing companies. According to the Drewry Maritime Research (Drewry) report on the container leasing industry, as of the end of 2016, the top ten lessors controlled close to 95% of the overall container fleet (by TEU1) managed or owned by leasing companies. In recent years, the industry has undergone a round of merger and acquisition activity, which resulted in higher market share consolidated with the five largest lessors who now control approximately 78% of the overall container rental fleet (by TEU). In addition, leasing companies with experience in issuing marine container-backed ABS (Textainer Group Holdings Limited; Triton International Limited (including the former TAL International Group, Inc.); SeaCube Container Leasing Ltd.; Seaco Global Limited (including the former Cronos Group); CAI International, Inc.; Beacon Intermodal Leasing LLP; and Florens Group (through the former Dong Fang International Asset Management Limited)) accounted for slightly less than 89% of the overall marine container leasing fleet (by TEU) as of the end of 2016. The first ABS transactions backed by marine containers and associated leases were introduced in the late 1990s and were traditionally financially insured by monoline insurance companies; however, following the recession in 2008–10, new ABS issuance has not relied on monoline insurance.
While container lessors count many industrial, mining and agricultural and food processing companies among their clients, the container liners and logistics companies (particularly in the case of tank containers) usually constitute their core customer base. Shipping companies typically maintain relationships with a number of different lessors, with the bulk of their rental fleet being leased from a small number of leasing companies. Leasing companies maintain inventories of new and used containers in a wide range of worldwide locations and supply these containers to their customers under long- and short-term lease contracts. Given the variability of trade volumes, as well as the fact that container liners may not always be able to accurately forecast their container requirements on a period-by-period basis, the availability of containers for lease reduces a shipping line’s need to purchase and maintain larger container inventory.
In the years following the recession in 2008–10, leasing containers instead of purchasing has also become an effective way for shipping companies to manage their capital assets and allocate capital expenditures (capex). Instead of raising funds by issuing relatively expensive debt in order to purchase new containers, container shipping companies have increasingly relied on lessors for their container needs taking advantage of competitive rental rates. Leasing companies with greater liquidity and better access to competitive funding account for more than 50% of global container inventories and have ordered approximately 55% of all new containers since 2010 (source: Drewry).
1. Twenty-foot equivalent unit, which compares the size of a container to a standard 20-foot dry cargo container. For example, a 20-foot container is equivalent to one TEU and a 40-foot container is equivalent to two TEU. Another widely used industry measurement unit is cost equivalent unit (CEU), which is a fixed unit of measurement based on the cost relative to the cost of a 20-foot dry freight container. For instance, a standard 20-foot container is equivalent to one CEU and the CEU value of a 40-foot high-cube HC refrigerated container is currently equivalent to approximately eight to ten CEU.
Structured Finance: Marine Container ABS February 2018
Rating Marine Container Securitizations DBRS.COM 5
Marine ContainersContainers are generally constructed of steel with each container size and type built according to the same International Organization for Standardization (ISO) specifications, regardless of where the container is manufactured. Every container has its own unique unit number, often called a box number that can be used to identify a container owner and user as well as to track a container’s whereabouts. Marine containers are available in a variety of types, including refrigerated (reefer), liquid tank (tank) and specialized dry cargo (dry freight special), in addition to the standard dry freight containers. These principal types of containers are described below:• Dry freight containers. A dry freight container, by far the most widely used type, is typically constructed of steel sides, roof,
an end panel on one end and a set of doors on the other end, a wooden floor and a steel undercarriage. Dry freight containers are used to carry general cargo, such as manufactured component parts, consumer staples, electronics and apparel. According to Drewry, dry freight containers comprised approximately 89% of the worldwide maritime container fleet as of the end of 2016, as measured in TEU.
• Reefer and tank containers. A reefer usually has an integral refrigeration unit on one end which generally plugs into an outside power source and is used to transport perishable goods, primarily frozen food but also fresh produce, flowers, chemicals and pharmaceuticals. Tank containers are used to transport liquid bulk products such as chemicals, oils, wine and other liquids. According to Drewry, reefers and tanks comprised approximately 7% and 1%, respectively, of the worldwide maritime container fleet as of the end of 2016, as measured in TEU.
• Dry freight special containers. Dry freight special containers normally consist of multiple varieties but open-top, flat-rack and cellular pallet-wide containers are the most widely leased types. An open-top container is similar in construction to a dry freight standard container except that the roof is replaced with a tarpaulin supported by removable roof bows. A flat-rack container is a heavily reinforced steel platform with a wood deck and steel end panels. Open-top and flat-rack containers are generally used to transport heavy or oversized cargo, such as marble slabs, building products, boats or machinery. Pallet-wide containers are a type of dry container externally similar to ISO standard containers, but internally about two inches wider so as to accommodate two European-sized pallets side by side. According to Drewry, as of the end of 2016, dry freight special containers comprised approximately 3% of the worldwide maritime container fleet, as measured in TEU.
Prices for new containers are driven by supply and demand, manufacturing capacity constraints (both natural and imposed by manufacturers), labour costs in China (where the majority of containers are currently produced) and the material cost. In particular, the price of a high-grade steel with weather-resistant anti-corrosive properties, is usually the key production input into the dry box price, which accounts for over 50% of its total manufacturing costs.
Container prices are also affected by shifts in supply and demand. For instance, lack of normal container production in 2009 and 2010 because of a drastic curtailment of new orders (as a result of the stressed environment) meant that the global container fleet had approximately three million fewer TEU containers compared with what would have existed if production had been maintained at pre-existing levels. This temporary phenomenon, combined with a quick increase in the volume of global trade in 2010, resulted in all-time high or at near all-time high newbuild dry freight marine container prices in 2011.
Industry convention for the useful life of a standard dry or reefer container is 12 to 15 years (typically, measured from the first lease out date after manufacturing); however, the useful life of a tank and some varieties of dry freight special containers may be extended to 20 years (or more). Most lessors depreciate containers over their useful life using a straight-line schedule to either a fixed-dollar residual value or a percentage of the original equipment cost. In practical terms, however, dry freight containers in particular may still be leased out at the age of up to 18 to 20 years while retaining measurable residual realization value.
Based on a review of the data on resale prices for the 12-year-old dry standard marine containers during the period from 1995 to 2016 (according to Drewry), resale prices for a 20-foot dry standard container and 40-foot HC dry container have been, on average, 47% and 40%, respectively, of the ex-factory price for a newbuild container of the same type. Such relatively high retention of value is explained by continuing growth in the worldwide containerized traffic, robust build and little technological obsolescence of the standard dry box types as well as by active secondary market for these most widely used marine container types.

Structured Finance: Marine Container ABS February 2018
Rating Marine Container Securitizations DBRS.COM 6
The useful life, depreciation policy and residual value as defined in marine container securitization transaction documents may be different from the corresponding assumptions used by a particular lessor for financial reporting purposes. In each case, DBRS typically reviews relevant definitions in the transaction documents to evaluate their consistency with the industry practice and the manager’s historical experience. In some cases, DBRS may apply different stresses to residual values in its cash flow modeling analysis if such stresses are warranted based on the definitions of depreciation policy and residual value in a securitization transaction’s documentation or other available additional information.
Container LeasesMost of the leasing companies’ revenues are derived from renting their equipment to customers. Additional revenue sources include fee-based third-party container management business, auxiliary fees (such as warranty coverage of repairs and maintenance expenses, fees related to drop-offs in non-specified locations, etc.), gains on secondary-market container trading and gains from sale of containers at the end of their useful life. Typically, leasing companies rent their containers under three main contractual arrangements:• Long-Term Operating Leases. Long-term leases typically have initial contractual terms ranging from three to seven years, with
an average term of approximately five years at lease inception. Usually, long-term leases require the lessees to maintain specific units on hire for the duration of the lease term, thus providing the lessors with predictable cash flow. As with all container operating leases, lease contracts specify a per diem rate for equipment on hire, where and when such equipment can be returned, how the customer will be charged for damage and the charge for lost or destroyed equipment, among other things. Because of the concerted effort over the years by the container leasing industry to shift the majority of its business into long-term leases, the share of such contract type in the overall leased fleet has increased to over 82% as of the end of 2016 from slightly over 48% in 2000.2
Containers often remain on hire at the contractual per diem rate for an additional six to 18 months beyond the end of the contractual lease term, subject to specific fleet requirements of a lessee and location of the containers at the end of the lease term. Additionally, in recent years lessees frequently opted to re-lease the containers for another term lease upon the expiration of their original lease term. To entice such behaviour, lessors may offer a substantial reduction in the per diem rate vis-à-vis the original lease. Understanding these dynamics and the benefits of certainty that can be provided, the leasing industry has today become more focused on renting containers to its customers under long-term lease contracts.
• Short-Term Leases (also known as service leases). Short-term leases allow lessees to pick up and drop off equipment during the term of the lease, subject to some contractual limitations. Such leases provide the customer with a higher level of flexibility than the long-term leases and, as a result, typically carry a higher per diem rate. The terms of the short-term leases range from 12 months to three years, though because equipment can be returned during the term of a lease, lease term does not dictate expected on-hire time. A variant of a short-term lease is a spot lease. Such leases are used when the customer needs containers for a very short-term period (e.g., a one-way trip between particular destinations). Because of the fundamental shift in the lessors’ strategy toward long-term leases, the share of containers rented out subject to short-term lease contracts in the overall operating lease fleet has been reduced to approximately 11% (not including off-hire containers) in 2016 from approximately 35% in 2000.3
• Finance Leases. Finance leases provide lessees with an alternative method to finance their equipment acquisitions. Finance leases have lease terms ranging from three to ten years. They are generally structured for specific quantities of equipment, require a lessee to keep the equipment on hire for the duration of the lease and typically provide a lessee with the purchase option at the end of the lease term. Under the finance lease, a lessee is the owner of the box and, as such, the risk may exist that a finance lease can be classified as a loan in the event of a lessee’s bankruptcy.
In general, marine container lease agreements consist of two basic elements: a master agreement and a lease addendum. Lease addenda typically contain business terms (including per diem rate, term duration and drop-off schedule, among other things) for specific leasing transactions, while master agreements typically outline general rights and obligations of a lessor (with the obligations generally limited to the lessee’s quiet enjoyment rights) and a lessee under all of the lease addenda covered by the master agreement (lease addenda typically specify the master agreement that governs such lease addenda). Lessors typically have a small number of master agreements (often one) and multiple lease addenda for most of their customers. Master agreements generally require the lessees to (1) pay rentals, depot charges, taxes and other charges when due; (2) maintain equipment in good condition and return equipment in accordance with conditions set forth in the master lease agreement; (3) use equipment in compliance with
2. Source: Containerization International, Drewry. 3. Source: Containerization International, Drewry.

Structured Finance: Marine Container ABS February 2018
Rating Marine Container Securitizations DBRS.COM 7
all applicable laws; and (4) pay the lessor for the value of equipment as stated in the lease if a container is lost or destroyed. Master agreements also usually contain an exclusion of warranties clause and require lessees to defend and indemnify a lessor, in most instances from third-party claims arising out of the lessee’s use or possession of the containers. Lessees are typically required to maintain physical damage insurance and comprehensive general liability insurance.
Container Shipping CompaniesEvery container leasing company has to deal with the issue of customer concentrations, since all lessors have traditionally been focusing on the same customer base: a relatively limited number of top-tier container liners with an established business track record. Furthermore, the ten largest container shipping companies account for more than 74% of the overall container ship capacity (by TEU); therefore, it is not unusual for the top three customers to account for between 20% to 40% of the aggregate collateral in a typical marine container securitization or for the top ten customers to account for between 40% to 80% of the aggregate collateral.
Despite relatively high customer concentrations, actual obligor defaults in the sector have been relatively rare and limited to smaller lessees. One relatively recent exception was the bankruptcy, in August 2016, of Hanjin Shipping Co., South Korea’s largest container line and, at the time, one of the world’s top ten container carriers in terms of capacity. Even though it had a material negative effect on the container lessors’ profitability in that year, the bankruptcy did not result in any lasting impact on the demand and supply equilibrium. Moreover, the largest lessors have been able to achieve box recoveries in high-80% to low-90% range (by value).
The recovery rates of the major lessors have historically been high. Because of low default and high recovery rates, leading lessors’ historical write-offs as percentage of lease revenues have not exceeded 2.0% on average. Lessors typically receive support from the port/depot managers in their recovery efforts because the depots are often owed unpaid storage and, sometimes, maintenance fees, which are usually paid by the lessors when they pick up the containers. If necessary, a lessor also has other courses of action available. Should a shipping company refuse to return the containers, the lessor can seize the fuel of a shipping company or, in the most extreme case, seize its own containers from the ship (along with the goods contained therein), although this typically also involves seizing the vessel and its entire cargo. In addition, according to industry observers, container box rents constitute less than 5% of a shipping line’s total expenses, which is significantly less than the cost of fuel or the value of a vessel’s cargo; however, having access to the containers can be as important as fuel to a container liner because it represents an essential component of its operations. Consequently, a container shipping company may view rental expense as small compared with the potential revenue loss that would result from a repossession of containers by a lessor, thus providing it with strong incentive to continue making rental payments even as it experiences financial stress.

Structured Finance: Marine Container ABS February 2018
Rating Marine Container Securitizations DBRS.COM 8
Key Collateral Performance Drivers
The principal drivers typically affecting the cash flow generation capacity of the collateral pool in marine container securitizations include the following:• Utilization rate;
• Long-term and short-term per diem rates;
• Direct operating expenses (including storage); and
• Residual realization values.
Utilization RatesGenerally, utilization rates are affected by multiple factors, including seasonality, competition and supply and demand balance, which are driven by the growth rate of the worldwide container fleet and, more broadly, the growth in global containerized trade. The factors affecting the overall container fleet utilization rate of every lessor are (1) the share of containers subject to the long-term lease agreements (which may include containers subject to finance leases or expired long-term lease agreements where a lessee continues to use the containers and pay the per diem) in the overall fleet, (2) the amount of new units waiting to be picked up from factories to be rented subject to long-term leases and (3) the utilization rate for containers in the short-term lease pool. For most leasing companies, the percentage of equipment subject to long-term lease agreements has grown steadily over the last ten years and currently often exceeds 80%. The focus on long-term lease arrangements by the lessors results in higher predictability and stability of revenues and balances out the competitive pressure between utilization and per diem rates.4
Overall utilization rates for lessors’ reefer fleets tend to be more stable since reefers are usually leased subject to the long-term operating or finance lease contracts. The more specialized nature of reefers and considerably higher price (versus dry freight containers) have traditionally contributed to lessors utilizing such containers for long-term leasing opportunities. Furthermore, utilization rates for reefers have been supported to a certain degree by the shipping industry’s substitution of bulk refrigerated capacity with reefer containers. In recent years, however, aggressive investment by lessors in new reefers has pushed this asset type to become more commoditized, which may portend to a higher utilization rate volatility (and/or pressure on per diem rates) going forward similar to dry freight containers.
Per Diem RatesFactors affecting per diem rates include (1) market demand and competition, which influence the lessors’ targeted yield; (2) prices of manufacturing inputs, notably steel and labour costs; (3) share of the long-term leases relative to short-term leases;5 and (4) market rates of interest. In general, annualized per diem rates have been trending downward, which is to a large degree explained by increased commoditization of the product.6 Reefer per diems have experienced even steeper declines than dry containers over same period of time, driven, to a significant degree, by increasing competition and transformation into a more mainstream product.
Direct Operating Expenses Direct operating expenses are incurred in connection with the activities concomitant with lease revenue generation and include storage, maintenance, repositioning and handling expenses. Normally, direct operating expenses decrease when a fleet’s utilization rate increases, largely because of reduction in storage expenses (estimated at approximately $0.50 per CEU per day). The industry’s average direct operating expenses (including storage) have usually accounted for approximately 10% of lease revenues in the period from 2007 to 2016. In the recessionary environment, however, operating expenses as percentage of lease revenue reached the mid-teens in some instances, while dropping to mid-single-digits during periods of high utilization.
4. It should be noted that, because there often is a certain amount of unutilized new units waiting for pick-up at the factory, the long-term lease pool utilization rate is typically less than 100%. According to the data compiled by Containerization International/Drewry, the average annualized utilization rate for the long-term lease dry freight container fleet from 1990 to 2016 has been close to 97%, with a minimum of 94% recorded in 2009.
5. Long-term lease per diem rates tend to be lower. From 2000 to 2016, industry dry container short-term lease per diem rates per utilized CEU have been 31% higher on average than the long-term lease per diems per utilized CEU in the same year. The difference will likely persist in the future, given lessors’ reduced short-term lease fleets, which are expected to be further driven by the higher priced opportunistic rentals.
6. For instance, compound annual growth rate of the annualized newbuild long-term lease per diem rate for 20-foot standard dry containers from 1990 to 2015 has been a negative 5.4%.

Structured Finance: Marine Container ABS February 2018
Rating Marine Container Securitizations DBRS.COM 9
Residual Realization ValuesThe general level of economic activity as well as the degree of discipline by the lessors in managing their new box orders and by the container manufacturers in controlling their production volumes both affect new container prices and appear to be the major factors affecting residual realization values. Historical moves in newbuild dry container prices have been relatively closely correlated to the changes in their short-term utilization rates. Therefore, it may be the case that the factors driving the changes in utilization rates may also play a similarly important role in the residual value realization dynamics for dry freight containers. In addition, according to some estimates, historical realization proceeds (calculated as a percentage of the newbuild container price in the same year) at 12 years of age for reefers appear to be substantially lower compared with dry freight containers.
Operational Risk Review
The originator review process evaluates the quality of the parties that originate the loans or leases that are about to be securitized in a transaction rated by DBRS. While DBRS does not assign formal ratings to these processes, it typically conducts operational risk reviews to assess if an originator is acceptable and incorporates the results of the review into the rating process.
DBRS typically begins the initial originator review process by sending a questionnaire to the company that outlines the topics to be covered during the discussion with management and includes a list of documents to be provided, such as organizational charts, financial statements and underwriting guidelines. In instances where DBRS determines that the originator is below average, issuers may incorporate certain structural enhancements into a proposed transaction, such as additional credit support or a third-party firm to provide the requisite representations and warranties in order for DBRS to be able to rate the transaction. In the event that DBRS determines that an originator is unacceptable, it may refuse to rate the deal.
The originator review process typically involves a review and analysis of the following:• Company and management
• Financial condition
• Controls and compliance
• Market position
• Target markets
• Markets
• Origination and underwriting
• Tracking of containers
• Legal
• Technology
For details on the originator review process, please refer to the DBRS methodology Operational Risk Assessment for U.S. ABS Originators.
Servicer ReviewThe servicer review process evaluates the quality of the parties that service or may conduct backup servicing on the loans or leases that are about to be securitized in a transaction rated by DBRS. While DBRS does not assign formal ratings to these processes, it typically conducts operational risk reviews to assess if a servicer is acceptable and incorporates the results of the review into the rating process.
DBRS typically begins the initial servicer review process by sending a questionnaire to the company that outlines the topics to be covered during the discussion with management and includes a list of documents to be provided such as organizational charts, financial statements and performance statistics. In instances where DBRS determines that the servicer is below average, issuers may

Structured Finance: Marine Container ABS February 2018
Rating Marine Container Securitizations DBRS.COM 10
incorporate certain structural enhancements into a proposed transaction such as additional credit support, dynamic triggers or the presence of a warm or hot backup servicer in order for DBRS to be able to rate the transaction.
The servicer review process typically involves an analysis of the following:• Company and management
• Financial condition
• Controls and compliance
• Lease administration
• Collections
• Remarketing/loss mitigation
• Investor reporting
• Technology
For details on the servicing review process, please refer to the DBRS methodology Operational Risk Assessment for U.S. ABS Servicers.
Given the relatively servicing-intensive nature of a typical marine container ABS transaction, DBRS considers operational strength and financial condition of the manager to be an important qualitative input in its analysis; however, DBRS does not explicitly link the manager’s rating to the rating of a securitization transaction. DBRS generally anticipates that, in transactions with ratings of AA or higher, issuers may incorporate certain structural enhancements into a proposed transaction, such as the presence of a backup manager (with a comparable level of expertise in the industry to that of the initial manager) engaged from the onset of a securitization in addition to sufficient manager transition and replacement provisions in the transaction’s documents. Examples of such provisions include a manager transition account funded at inception or upon breach of certain financial covenants of the manager, which could be used to fund various expenses related to the transition of management duties, as well as a data mapping to be completed by a backup manager or a transition manager prior to the commencement of a securitization transaction.
ABS Financial Structure
Credit EnhancementThe rating process typically focuses on the analysis of credit enhancement supporting debt obligations issued in connection with a securitization. Credit enhancement can typically be classified as hard, which are enhancements directly available to support the transaction obligations, or soft, which are enhancements that support the transaction obligations if and when they are available. Typical forms of credit enhancement in marine container securitizations have been in the form of overcollateralization (OC). Furthermore, liquidity support has traditionally been provided in the form of a funded cash reserve. In securitizations with multi-tranche structures, subordinated tranches provide hard credit enhancement for the higher rated tranches; however, given the relatively small size of subordinated tranches, the majority of the hard credit enhancement in marine container securitization transactions remains in the form of overcollateralization.
OvercollateralizationOC is a form of hard credit enhancement which is designed to absorb losses before any shortfalls are allocated to ABS investors. The borrowing base in marine container securitizations is usually determined under the transaction documents as a percentage of the original acquisition cost net of accumulated depreciation or net book value (NBV). OC is achieved by issuing rated obligations in a lesser amount than the NBV of the collateral securing a transaction. Sufficiency of the available OC is evaluated by DBRS after its review of the key parties to the transaction and application of its rating criteria to the expected collateral pool.

Structured Finance: Marine Container ABS February 2018
Rating Marine Container Securitizations DBRS.COM 11
Liquidity Reserve AccountA liquidity reserve account is usually included in most marine container ABS transactions and is typically sized by the issuer to cover several months of projected interest payments. This account is usually funded at the outset of a transaction and is replenished as necessary, subject to availability of funds, through a transaction’s priority of payments. While the amounts on deposit in the reserve account typically receive 100% credit toward the asset base determination, they provide additional liquidity support to a transaction and are taken into consideration in the cash flow analysis.
Structural Provisions DBRS also typically assesses a securitization transaction with respect to availability of structural provisions offering protection to the noteholders in addition to the credit enhancement. Some key structural provisions that may influence the evaluation of a marine container securitization include:• Cash Control. Remittance by a manager of all collections received by it to a controlled collection account within four to seven business
days provides additional protection to investors, which can be particularly effective given the low velocity of the collateral assets.
• Events of Default and Manager Default Events. Events of Default may include a variety of events such as payment defaults, covenant defaults, incorrect representations and warranties and lack of valid assignment. Manager Default Events may include breach of financial covenants of a manager and other provisions, such as change of control.
• Manager Replacement Triggers. Financial covenant(s) (defined more conservatively compared with the Manager Default Events) triggering the commencement of the manager transition process (including blind data mapping), thereby reducing operational risk related to the financial condition of a manager.
• Management Fee. Provisions in the management agreement setting the manager’s compensation at the market level, which is sufficient to provide for the anticipated manager expenses as well as to entice a replacement manager in the event that it becomes necessary.
• Interest Rate Hedging. Floating-rate securitization transactions typically include interest rate hedging provisions to protect against the mismatch between floating-rate debt interest payments and fixed-rate receipts on collateral assets.
• Depreciation Policy and Residual Value. Definitions of depreciation policy, useful life and residual value for each key asset type included in the collateral for a securitization transaction are reviewed for general consistency with the industry and market conditions.
• Early Amortization Events. Acceleration of the principal repayment due to (1) a breach of the collateral performance triggers (for instance, a debt service coverage ratio) or (2) the occurrence of a Manager Default Event, which accelerates the diversion of the cash flow toward paying down the outstanding debt principal.
Priority of Payments On a regular basis, collections on the assets are aggregated and then distributed to the noteholders based on the priority of payments established in a securitization transaction’s documents. Payment waterfall allocates collections in descending order of priority. Typically, there will be three payment waterfalls in a marine container securitization: normal (in many cases, including both minimum and scheduled principal amortization timetables), post-Early Amortization Event and post-Event of Default. Recurring transaction expense items like trustee fees and other senior expenses, including management fee, are commonly senior in the waterfall, after which the noteholders receive interest and principal. The principal is typically paid pro rata between the series, frequently, first, in the amount sufficient to achieve pay-off of the related debt based on a defined minimum amortization schedule (such as 15 years, for instance) and then, if funds are available, in an amount sufficient to achieve pay-off of the related debt based on an accelerated time frame (for example, within ten years). Under certain circumstances, principal payments on the series issued earlier out of the master trust-like structure may take precedence over the principal payments on the subsequently issued series. In transactions where the scheduled principal amortization envisions the balloon principal payment, DBRS may consider the value of remaining collateral in the event the issuer is unable to make such balloon payment or to refinance the transaction. The value will typically be expected to be provided by the third parties with experience in the marine container leasing space. In addition, the appraised value will typically be provided on a going-concern basis (as opposed to the outright sale of container boxes), reflecting the imbedded value over time of the cash generating leases, as well as the anticipated transferability of servicing for most collateral portfolios.

Structured Finance: Marine Container ABS February 2018
Rating Marine Container Securitizations DBRS.COM 12
Legal Structure
The collateral transfer between the sponsor/manager and the special-purpose vehicle (SPV) issuing ABS is executed via a true sale. The SPV then grants the first perfected security interest in the collateral to a securitization trustee. DBRS typically reviews a transaction’s legal structure to evaluate whether all steps have been taken to insulate the rated securities from the risk of bankruptcy of a lessor or its affiliates. DBRS also usually reviews legal opinions, which are typically delivered in connection with a securitization including enforceability, security interest, true sale and non-consolidation.
For further details on legal considerations for structured finance transactions, refer to DBRS’s Legal Criteria for U.S. Structured Finance.
Data Review and Developing Cash Flow Expectations
Data Review For any new marine container securitization, DBRS typically reviews a collateral pool’s data as of the most recent available cut-off date. The information, which is reviewed by DBRS, is typically stratified by several measurement dimensions (which may include units, TEU/CEU, original and/or acquisition cost and NBV) and usually includes the following, among other items:• Equipment type/age/remaining life;
• Equipment status (on lease/expired on lease/off-lease/new factory unit);
• Lease type (e.g., short-term, long-term or direct finance lease);
• Current lease rate (per diem);
• Current lease remaining term; and
• Payment currency and frequency.
Static Versus Dynamic PoolsAs is the case with many frequent issuers of marine container ABS, the composition of a collateral pool normally changes over time because master trusts are used to facilitate ABS issuance, which may have multiple outstanding series secured by a common collateral pool. In such structures, eligibility criteria and concentration limits are typically reviewed by DBRS to evaluate potential collateral migration over the life of a transaction. While relatively high customer concentrations are common in marine container securitizations, DBRS usually reviews the transaction documentation to assess if obligor concentration limits are set within the general industry practices and are consistent with the manager’s historical obligor mix as well as whether the largest obligors represent leading shipping companies. DBRS also reviews container type concentrations and their respective limits to evaluate whether the collateral pool may be exposed to less popular equipment and whether the manager has a relevant track record of managing specific equipment types comprising collateral for a securitization. Industry trends and a particular manager’s fleet composition, historical areas of expertise and capital expenditure plans are also typically taken into consideration to assess potential collateral migration over time.
Historical Performance And Expected Case AssumptionsDBRS typically reviews data provided by the manager showing its historical performance track record with respect to the following: • Historical obligor delinquencies and defaults and corresponding recovery rates (by unit and NBV);
• Utilization rates;
• Lease rates (typically provided separately for long-term, short-term and direct finance leases);
• Residual realization experience; and
• Direct operating expenses.

Structured Finance: Marine Container ABS February 2018
Rating Marine Container Securitizations DBRS.COM 13
Such data sets are typically requested and analyzed by DBRS for each major container type (e.g., 40-foot HC reefers). Individual expected collateral performance and cash flow assumptions for each major container type are typically developed in order to: (1) factor in the differences in historical performance related to a specific manager and (2) appropriately reflect any recent industry trends or developments which are pertinent to a specific asset type. The data sets are typically compared with available industry and peer information to evaluate the comparative efficiency of the manager and make any necessary adjustments to the collateral performance assumptions. DBRS normally reviews historical data which would be spanning more than one business cycle. The extent of the historical performance review may be adjusted to reflect the effects of established industry trends (e.g., continuous decline in per diems over time). Taking seasonality and the current industry cycle into account, historical performance data sets are typically also compared with the actual metrics (average utilization and per diem rates by asset and lease type) derived from the collateral pool’s data tape as of the most recent cut-off date.
Based on the data analysis, DBRS normally develops its view with respect to the expected utilization and per diem rates as well as the anticipated level of direct operating expenses (specified as percentage of lease revenues). The expected collateral performance is usually formulated in light of historical averages (that capture both up and down business cycles) and may be adjusted for industry trends and collateral portfolio mix. In addition, DBRS usually analyzes the obligor default experience of a manager and the historical recovery rates to assess if they are consistent with the industry and whether any additional stresses may be needed to reflect the specific manager’s default/recovery performance history in light of obligor concentrations in the collateral pool.
Cash Flow Analysis
DBRS typically uses cash flow analysis to assess the ability of a transaction to pay interest and to repay principal in accordance with a transaction’s terms. Cash flow analysis is usually completed for each rating category based on the collateral performance assumptions.7 Cash flows in each scenario are allocated in accordance with a transaction’s priority of payments. Exhibit 1 below represents key aspects of the DBRS cash flow analysis, discussed further herein.
Exhibit 1: Key Aspects of the DBRS Cash Flow Analysis
Manager/SponsorFinancial Strength
UtilizationRates
DirectOperatingExpenses
Residual Realization
Reduction in Long-Term Lease
Cash Flows
Per DiemRates
7. DBRS typically linearly extrapolates stress assumptions for the rating categories above or below the published guidelines.

Structured Finance: Marine Container ABS February 2018
Rating Marine Container Securitizations DBRS.COM 14
Stress Periods A typical transaction is generally expected to experience a stress environment in nine years of its 15-year life.8 The first stress environment period typically starts in the first, second or third year from the date of closing, depending on the then-current economic environment and outlook. Each stress environment period is usually assumed to last two to three years. The following recovery (i.e., the period when the expected collateral performance assumptions apply) is usually assumed to last two years.
Long-Term Lease Renewals and Stresses During Recessionary EnvironmentLong-Term Lease RenewalsLong-term leases in the collateral pool at time of closing of a transaction are typically expected to continue until their expiration date, subject to stress reductions in utilization and per diem rates, which are discussed in more detail below. Expiring long-term leases are assumed to be renewed for two to four years (depending on the requested rating) on each subsequent renewal date until the related containers reach the end of their useful life. Per diem rates for renewed long-term leases are generally expected to decline at each renewal point. The magnitude of decline at each rating level may depend on the following factors: (1) age of the fleet in the collateral pool subject to long-term leases, (2) general per diem rate trends for the industry, (3) average per diem rate for the containers subject to long-term leases in the collateral pool9 and (4) container type. Exhibit 2 below indicates the typical haircut ranges for long-term lease per diem rates at renewal (applied to the original per diem rate at time of the first renewal and to the immediately prior per diem rate on each renewal date thereafter, respectively). DBRS may assume a floor for the haircut long-term lease per diem rates where an inflection point exists between when low per diem rates make renting uneconomical and outright selling them. The haircuts set forth in Exhibit 2 are a guideline and may not be applicable in all transactions.
Exhibit 2: Haircuts to the Long-Term Lease Per Diem Rates at RenewalAA A BBB
18% to 21% 15% to 18% 11% to 13%
Stresses During Recessionary EnvironmentAlthough large marine container lessors have historically experienced a relatively low rate of lessee defaults, DBRS typically assumes that a significant percentage of units subject to long-term leases during a stressed environment are leased to obligors who request material modifications of their lease terms, including skip payments, payment deferrals, return of a portion of the leased containers or renegotiation of a lease rate in order to keep containers on lease. In addition, the lessors may be slower to pick up newbuild containers from the factories to be rented long-term during the low demand environments. Stresses applied to per diem and utilization rates for the collateral subject to long-term leases are also intended to address the relatively high lessee concentrations in marine container securitizations (and, as such, lessees’ greater bargaining power during the low demand environment). In summary, the long-term lease per diem and utilization rate reductions during the stress periods reflect the overall reduction in long-term lease revenues because of the potentially strained financial condition of lessees (including, in some instances, actual defaults).
Long-term lease stresses are usually applied during each respective stressed period. As part of the stresses typically applied by DBRS, a portion of containers are assumed to be off-lease (to allow for remarketing and repositioning) and enter into a new three-year long-term lease contract at a reduced per diem rate (refer to the following paragraphs for details). Off-lease period typically varies by rating level, e.g., nine months for A (high) or higher rating categories, six months for “A” through BBB (high) rating categories and three to four months for lower ratings.
Utilization stresses are applied on a straight-line basis in equal portions (as a percentage of each repline) in each month during the stress period. The magnitude of the utilization rate stress applied to units subject to long-term leases normally depends on the rating sought for a transaction. Exhibit 3 indicates the typical utilization rate haircut expectations for marine containers subject to long-term leases. The haircuts and their indicative timing set forth in Exhibit 3 are a guideline and may not be applicable in all transactions.
8. In situations involving transactions with shorter term to maturity (e.g., secured by older containers) or when assessing lower rated tranches, DBRS may reduce the duration of stress environment periods accordingly.
9. The latter may be more significant as it may reflect a point in the pricing cycle at the time of a securitization transaction. For instance, if the collateral mix contains a substantial portion of the relatively higher priced long-term leases, which had been entered into during the high-demand environment but are expected to run off in a stressed environment. In such cases, DBRS may assume renewal per diem haircuts at the higher end of the range.

Structured Finance: Marine Container ABS February 2018
Rating Marine Container Securitizations DBRS.COM 15
Exhibit 3: Utilization Rate Haircuts for Containers Subject to Long-Term Leases
Year AA A BBB1 Base Base Base
2 9.0% 7.0% 6.0%
3 9.0% 7.0% 6.0%
4 9.0% 7.0% 6.0%
5 Base Base Base
6 Base Base Base
7 9.0% 7.0% 6.0%
8 9.0% 7.0% 6.0%
9 9.0% 7.0% 6.0%
10 Base Base Base
11 Base Base Base
12 9.0% 7.0% 6.0%
13 9.0% 7.0% 6.0%
14 9.0% 7.0% 6.0%
15 Base Base Base
In addition, DBRS typically applies the following stresses to per diem rates (haircut to the expected long-term lease per diem rate) for the units, which are assumed to be released long-term after experiencing a stressed interruption in lease revenue generation described above. This stress is usually applied to reflect the expectation that per diem rates for a significant number of units may be renegotiated or otherwise reduced (for instance, because of the partial returns of the containers by lessees) amid a stressed environment. The environment is typically expected to persist for 36 months for A (low) and higher rating categories. Exhibit 4 indicates the typical haircut expectations for the long-term lease per diem rates in the stressed environment. The haircuts set forth in Exhibit 4 are a guideline and may not be applicable in all transactions.
Exhibit 4: Haircuts to the Long-Term Lease Per Diem Rates in Stressed EnvironmentAA 19.0%
A 17.0%
BBB 14.0%
In some cases, DBRS may apply asset-specific haircuts to the pools with high concentrations of refrigerated or dry freight special container equipment.
Short-Term Lease Stresses During Recessionary EnvironmentDuring each stress period, utilization rates for short-term leases are expected to gradually reduce to the trough level, to be reached in the middle of a stress period, and will then rise back up to the expected performance assumption level at the end of a stress period. Exhibit 5 indicates the stresses typically applied by DBRS in its analysis to the expected short-term lease utilization rates. The stress level varies depending on a transaction’s rating (in each case, shown as a percentage reduction to the expected utilization rate). The haircuts and their indicative timing set forth in Exhibit 5 are a guideline and may not be applicable in all transactions.

Structured Finance: Marine Container ABS February 2018
Rating Marine Container Securitizations DBRS.COM 16
Exhibit 5: Utilization Rate Haircuts for Containers Subject to Short-Term Leases
Year AA A BBB1 Base Base Base
2 17.0% 15.0% 12.0%
3 34.0% 30.0% 24.0%
4 17.0% 15.0% 12.0%
5 Base Base Base
6 Base Base Base
7 17.0% 15.0% 12.0%
8 34.0% 30.0% 24.0%
9 17.0% 15.0% 12.0%
10 Base Base Base
11 Base Base Base
12 17.0% 15.0% 12.0%
13 34.0% 30.0% 24.0%
14 17.0% 15.0% 12.0%
15 Base Base Base
In addition, DBRS usually applies per diem rate stresses commensurate with the requested rating for a transaction to the units in the short-term lease pool. These stresses are typically applied with a six-month lag from the beginning of short-term lease rate utilization stresses. For instance, if the first reduction in short-term lease utilization rates is assumed to occur in month 13, the first short-term lease per diem stresses will be applied starting in month 19. Decreases in the short-term lease per diem rates are typically gradual and reach the trough level in the middle of each stress period. Thereafter, the rates are typically assumed to gradually increase to expected performance level by the time a stress period ends. Stresses vary depending on a transaction’s rating as follows (in each case, shown as a percentage reduction to the expected short-term per diem rate). Exhibit 6 indicates the typical short-term lease per diem haircut expectations for marine containers. The haircuts and their indicative timing set forth in Exhibit 6 are a guideline and may not be applicable in all transactions.
Exhibit 6: Haircuts to the Short-Term Lease Per Diem Rates in Stressed Environment
Months AA A BBB1 – 18 Base Base Base
19 – 30 18.5% 16.0% 13.0%
31 - 42 37.0% 32.0% 26.0%
43 – 54 18.5% 16.0% 13.0%
55 – 78 Base Base Base
79 – 90 18.5% 16.0% 13.0%
91 - 102 37.0% 32.0% 26.0%
103 – 114 18.5% 16.0% 13.0%
115 - 138 Base Base Base
139 – 150 18.5% 16.0% 13.0%
151 – 162 37.0% 32.0% 26.0%
163 - 174 18.5% 16.0% 13.0%
175 - 180 Base Base Base
In addition, DBRS may apply asset-specific haircuts to the pools with high concentrations of reefer or dry freight special container equipment.

Structured Finance: Marine Container ABS February 2018
Rating Marine Container Securitizations DBRS.COM 17
Residual RealizationDBRS typically assumes that containers will be sold at the end of their useful life as defined in the securitization transaction’s documentation. DBRS typically applies stresses (as a percentage haircut to the estimated value at the time of sale, which may be represented by the depreciated NBV, the independent third-party appraisal value or the historical average fair market sale value for a particular container type) in its cash flow modeling if the assets are assumed to be sold during a stress period. Stress haircuts commensurate with select rating categories for a securitization transaction are shown in the table below. Furthermore, DBRS may adjust its stresses if the definitions of depreciation policy and/or residual value in a securitization transaction are inconsistent with those typically observed in marine container securitizations. DBRS may also make an adjustment to its stress based on its assessment of the track record and expertise of a particular lessor in trading and selling the older containers. Exhibit 7 indicates the typical expected residual realization haircut ranges. The haircuts set forth in Exhibit 7 are a guideline and may not be applicable in all transactions.
Exhibit 7: Residual Realization HaircutsAA 59% to 65%
A 50% to 54%
BBB 32% to 42%
In addition, DBRS may revise its residual realization haircuts for portfolios with high concentrations of refrigerated or dry freight special container equipment.
Direct Operating ExpensesWhen evaluating marine container securitizations in which the contractual management fee (typically paid senior in the payment waterfall) does not cover direct operating expenses, DBRS usually assumes that such expenses (including storage) will gradually increase during each stress period concurrent with the timing of reduction in the short-term lease pool utilization rate and application of the long-term lease utilization stresses. Direct operating expenses are typically expected to achieve their peak in the middle of each stress period and will then drop back to expected performance assumption levels at the end of the stress period. Expected performance level is typically a percentage of the rental revenues. Stresses applied to the expected direct operating expenses vary, depending on rating for a transaction, as follows (in each case, shown as a percentage increase to the expected direct operating expense percentage of lease revenues10). Exhibit 8 indicates the typical direct operating expense escalation expectations. The percentages and indicative timing set forth in Exhibit 8 are a guideline and may not be applicable in all transactions.
10. For example, if the expected direct operating expenses are 10% of lease revenue and the stress increase percentage is 50%, the direct operating expenses will be increased to 15% of lease revenue during the stressed periods in the cash flow modeling.

Structured Finance: Marine Container ABS February 2018
Rating Marine Container Securitizations DBRS.COM 18
Exhibit 8: Percentage Increase in Direct Operating Expenses in Stressed Environment
Year AA A BBB1 Base Base Base
2 45% 37.5% 30%
3 90% 75% 60%
4 45% 37.5% 30%
5 Base Base Base
6 Base Base Base
7 45% 37.5% 30%
8 90% 75% 60%
9 45% 37.5% 30%
10 Base Base Base
11 Base Base Base
12 45% 37.5% 30%
13 90% 75% 60%
14 45% 37.5% 30%
15 Base Base Base
Interest Rate And Basis RiskDBRS usually assesses a securitization transaction to evaluate if there is an interest rate mismatch between the collateral and the ABS notes. If such mismatch exists, DBRS typically applies stress to the forward interest rates consistent with a securitization transaction’s rating. Such stress is normally applied in the cash flow analysis based on the DBRS’s Unified Interest Rate Model (UIRM) to a portion of the collateral not covered by the interest rate hedge instruments. For a complete description of the DBRS UIRM, see Unified Interest Rate Model for Rating U.S. Structured Finance Transactions.
Surveillance
DBRS discusses its surveillance methodology in the DBRS Master U.S. ABS Surveillance Methodology, including the related appendix for marine container leases. For additional information regarding the DBRS approach to surveillance, please see the Structured Finance Surveillance Global Policy at www.dbrs.com.

The DBRS group of companies consists of DBRS, Inc. (Delaware, U.S.)(NRSRO, DRO affiliate); DBRS Limited (Ontario, Canada)(DRO, NRSRO affiliate); DBRS Ratings Limited (England and Wales)(CRA, NRSRO affiliate, DRO affiliate); and DBRS Ratings México, Institución Calificadora de Valores S.A. de C.V. (Mexico)(CRA, NRSRO affiliate, DRO affiliate). Please note that DBRS Ratings Limited was registered as an NRSRO affiliate on July 14, 2017. For more information on regulatory registrations, recognitions and approvals, please see: http://www.dbrs.com/research/225752/highlights.pdf. © 2018, DBRS. All rights reserved. The information upon which DBRS ratings and other types of credit opinions and reports are based is obtained by DBRS from sources DBRS believes to be reliable. DBRS does not audit the information it receives in connection with the analytical process, and it does not and cannot independently verify that information in every instance. The extent of any factual investigation or independent verification depends on facts and circumstances. DBRS ratings, other types of credit opinions, reports and any other information provided by DBRS are provided “as is” and without representation or warranty of any kind. DBRS hereby disclaims any representation or warranty, express or implied, as to the accuracy, timeliness, completeness, merchantability, fitness for any particular purpose or non-infringement of any of such information. In no event shall DBRS or its directors, officers, employees, independent contractors, agents and representatives (collectively, DBRS Representatives) be liable (1) for any inaccuracy, delay, loss of data, interruption in service, error or omission or for any damages resulting therefrom, or (2) for any direct, indirect, incidental, special, compensatory or consequential damages arising from any use of ratings and rating reports or arising from any error (negligent or otherwise) or other circumstance or contingency within or outside the control of DBRS or any DBRS Representative, in connection with or related to obtaining, collecting, compiling, analyzing, interpreting, communicating, publishing or delivering any such information. Ratings and other types of credit opinions issued by DBRS are, and must be construed solely as, statements of opinion and not statements of fact as to credit worthiness or recommendations to purchase, sell or hold any securities. A report with respect to a DBRS rating or other credit opinion is neither a prospectus nor a substitute for the information assembled, verified and presented to investors by the issuer and its agents in connection with the sale of the securities. DBRS may receive compensation for its ratings and other credit opinions from, among others, issuers, insurers, guarantors and/or underwriters of debt securities. DBRS is not responsible for the content or operation of third party websites accessed through hypertext or other computer links and DBRS shall have no liability to any person or entity for the use of such third party websites. This publication may not be reproduced, retransmitted or distributed in any form without the prior written consent of DBRS. ALL DBRS RATINGS AND OTHER TYPES OF CREDIT OPINIONS ARE SUBJECT TO DISCLAIMERS AND CERTAIN LIMITATIONS. PLEASE READ THESE DISCLAIMERS AND LIMITATIONS AT http://www.dbrs.com/about/disclaimer. ADDITIONAL INFORMATION REGARDING DBRS RATINGS AND OTHER TYPES OF CREDIT OPINIONS, INCLUDING DEFINITIONS, POLICIES AND METHODOLOGIES, ARE AVAILABLE ON http://www.dbrs.com.