RATING BUY Snapshot - Moneycontrol.com
10
Q4 & FY21 RESULT UPDATE Results Ahead of Expectations 03/05/2021 Snapshot RATING CMP TARGET BUY 78.85 120.00 52% UPSIDE% Fineotex Chemical Ltd is one of the leading manufacturers of specialty chemicals for textiles, home care ,hygiene & drilling specialities. Company manufactures range of specialty chemicals which improve process performance from the pre-weaving preparatory stage to finishing chemicals. In continuation with our coverage which we initiated on FCL in Dec’20, on the back of healthy financial performance posted by company in Q4FY21 & full year FY21 , we are revising the price target of company from Rs 95 to Rs 120 . With upcoming brownfield project at Ambernath, entry into high margin home care & hygiene business ,strong balancesheet position with almost nil debt and healthy margin ratios , we expect company to perform significantly higher going forward. Presently company is trading at 19.46x on FY22E EPS of Rs 4.05 & 15.19x on FY23E EPS of Rs 5.19 basis . We feel that company is still trading at discount to its close peer which still gives room for more upside movement & thus makes a case yet to maintain BUY on stock with price target of Rs 120 (upside of 52%) from present level in medium to long term. Entry into high margin cleaning and hygiene businesses FCL received the FDA certifications in the hygiene and cleaning chemicals, which company have recently ventured into. These are perennial products with strong demand & are also corona-proof hence demand in these segments are growing. FCL have strong R&D team where it have employed people from JohnsonDiversey. In March’21 company have increased its sales team for this segment. Presently, FCL is working aggressively on the cleaning and hygiene chemicals for the institutional businesses like housekeeping, facility management, hospitals. Company have been already registered with municipal corporations as it have supplied to the KEM and Kasturba hospitals in the past. Therefore will help the company in cateri ng demand fom this segment. Company is witnessing big demand for disinfectant, sanitizers, house floor cleaners. The consumption level of these products has already gone very high. FCl is expecting margins from this business to be around 40% & have developed around 15 distributors in the March & have hired almost around 10 salespeople in the marketing in East India and West India. Going forward, FCL have been targeting almost around 50 distributors which will be supplying pan-India. FCl is expecting around Rs 50 crores of sales in the cleaning and hygiene businesses. Along with that, there is a polymer which goes to a detergent is also attracting lot of interest & have been very successful. Company have started with Vidisha, Sulzer, Patanjali & Ghadi. These are the companies where they require the polymers for anti-redeposition of the dirt. Industry Speciality Chemicals NSE CODE FCL BSE CODE 533333 Market Cap (₹ Mn) 8732.50 Shares Outstanding (in Mn) 11.07 52 wk High/Low (₹) 78.85/23.00 P/E 20.50 P/BV 4.17 Face Value (₹) 2.00 Book Value (FY22E) (₹) 23.14 EPS (FY22E) (₹) 4.05 Dividend Yield (%) 0.38 (%) Q4FY21 Q3FY21 Q4FY20 Promoter 64.74 64.72 71.42 FII 0.00 0.00 0.00 DII 6.15 5.97 0.11 Public 29.11 29.31 28.47 Year to Mar (in Mn) FY21 FY22E FY23E Net Sales 2185 2841 3551 EBIDTA 405 616 794 PAT 426 448 575 EPS 3.85 4.05 5.19 Key Risk to Call: Delay in commencement of new facility, Slower growth in new segments, Increase in cost of raw material Research Analyst Astha Jain [email protected]
Transcript of RATING BUY Snapshot - Moneycontrol.com

Q4 & FY21 RESULT UPDATE Results Ahead of Expectations 03/05/2021
Snapshot RATING
CMP
TARGET
BUY
78.85
120.00
52% UPSIDE %
Fineotex Chemical Ltd is one of the leading manufacturers of specialty chemicals for textiles, home care ,hygiene & drilling specialities. Company manufactures range of specialty chemicals which improve process performance from the pre-weaving preparatory stage to finishing chemicals. In continuation with our coverage which we initiated on FCL in Dec’20, on the back of healthy financial performance posted by company in Q4FY21 & full year FY21 , we are revising the price target of company from Rs 95 to Rs 120 . With upcoming brownfield project at Ambernath, entry into high margin home care & hygiene business ,strong balancesheet position with almost nil debt and healthy margin ratios , we expect company to perform significantly higher going forward. Presently company is trading at 19.46x on FY22E EPS of Rs 4.05 & 15.19x on FY23E EPS of Rs 5.19 basis . We feel that company is still trading at discount to its close peer which still gives room for more upside movement & thus makes a case yet to maintain BUY on stock with price target of Rs 120 (upside of 52%) from present level in medium to long term.
Entry into high margin cleaning and hygiene businesses
FCL received the FDA certifications in the hygiene and cleaning chemicals, which company have recently ventured into. These are perennial products with strong demand & are also corona-proof hence demand in these segments are growing. FCL have strong R&D team where it have employed people from JohnsonDiversey. In March’21 company have increased its sales team for this segment. Presently, FCL is working aggressively on the cleaning and hygiene chemicals for the institutional businesses like housekeeping, facility management, hospitals. Company have been already registered with municipal corporations as it have supplied to the KEM and Kasturba hospitals in the past. Therefore will help the company in cateri ng demand fom this segment. Company is witnessing big demand for disinfectant, sanitizers, house floor cleaners. The consumption level of these products has already gone very high. FCl is expecting margins from this business to be around 40% & have developed around 15 distributors in the March & have hired almost around 10 salespeople in the marketing in East India and West India. Going forward, FCL have been targeting almost around 50 distributors which will be supplying pan-India. FCl is expecting around Rs 50 crores of sales in the cleaning and hygiene businesses. Along with that, there is a polymer which goes to a detergent is also attracting lot of interest & have been very successful. Company have started with Vidisha, Sulzer, Patanjali & Ghadi. These are the companies where they require the polymers for anti-redeposition of the dirt.
Industry Speciality Chemicals
NSE CODE FCL
BSE CODE 533333
Market Cap (₹ Mn) 8732.50
Shares Outstanding (in Mn)
11.07
52 wk High/Low (₹) 78.85/23.00
P/E 20.50
P/BV 4.17
Face Value (₹) 2.00
Book Value (FY22E) (₹) 23.14
EPS (FY22E) (₹) 4.05
Dividend Yield (%) 0.38
(%) Q4FY21 Q3FY21 Q4FY20
Promoter 64.74 64.72 71.42
FII 0.00 0.00 0.00
DII 6.15 5.97 0.11
Public 29.11 29.31 28.47
Year to
Mar (in Mn)
FY21 FY22E FY23E
Net Sales
2185 2841 3551
EBIDTA 405 616 794
PAT 426 448 575
EPS 3.85 4.05 5.19
Key Risk to Call:
Delay in commencement of new facility,
Slower growth in new segments,
Increase in cost of raw material
Research Analyst
Astha Jain
Concall Takeaways
Biotex, company’s subsidiary
into niche products
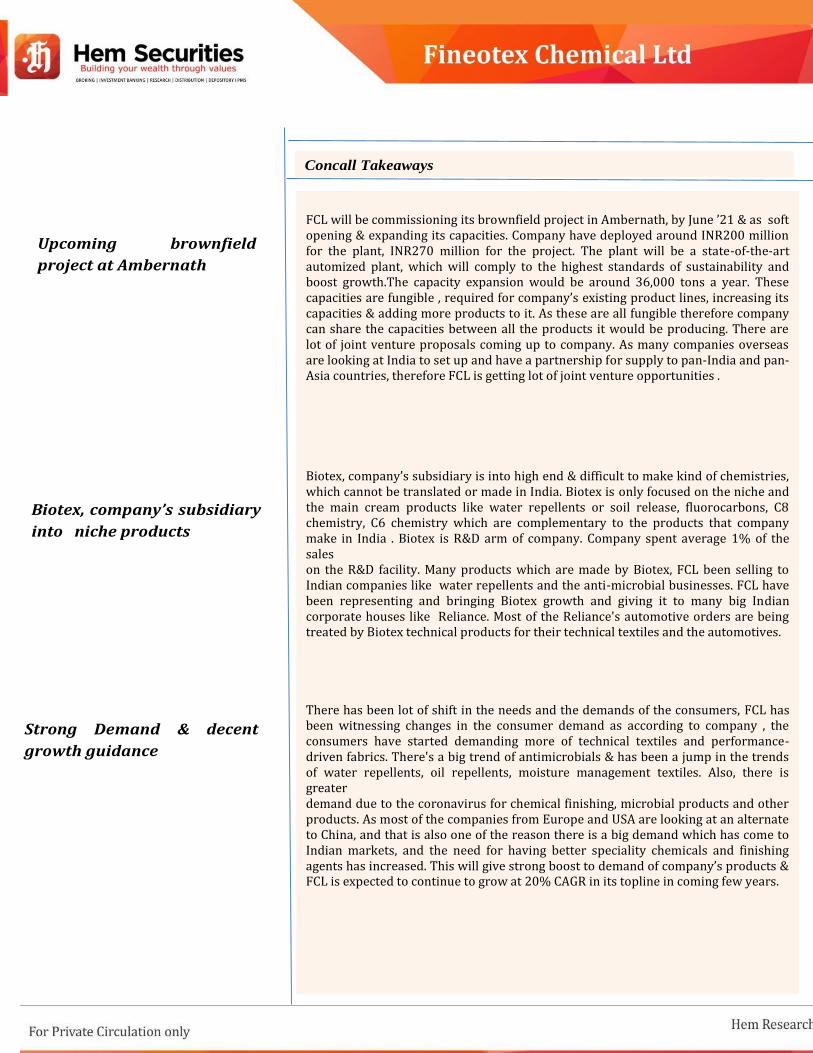
FCL will be commissioning its brownfield project in Ambernath, by June ’21 & as soft opening & expanding its capacities. Company have deployed around INR200 million for the plant, INR270 million for the project. The plant will be a state-of-the-art automized plant, which will comply to the highest standards of sustainability and boost growth.The capacity expansion would be around 36,000 tons a year. These capacities are fungible , required for company’s existing product lines, increasing its capacities & adding more products to it. As these are all fungible therefore company can share the capacities between all the products it would be producing. There are lot of joint venture proposals coming up to company. As many companies overseas are looking at India to set up and have a partnership for supply to pan-India and pan-Asia countries, therefore FCL is getting lot of joint venture opportunities .
Biotex, company’s subsidiary is into high end & difficult to make kind of chemistries, which cannot be translated or made in India. Biotex is only focused on the niche and the main cream products like water repellents or soil release, fluorocarbons, C8 chemistry, C6 chemistry which are complementary to the products that company make in India . Biotex is R&D arm of company. Company spent average 1% of the sales on the R&D facility. Many products which are made by Biotex, FCL been selling to Indian companies like water repellents and the anti-microbial businesses. FCL have been representing and bringing Biotex growth and giving it to many big Indian corporate houses like Reliance. Most of the Reliance's automotive orders are being treated by Biotex technical products for their technical textiles and the automotives. There has been lot of shift in the needs and the demands of the consumers, FCL has been witnessing changes in the consumer demand as according to company , the consumers have started demanding more of technical textiles and performance-driven fabrics. There's a big trend of antimicrobials & has been a jump in the trends of water repellents, oil repellents, moisture management textiles. Also, there is greater demand due to the coronavirus for chemical finishing, microbial products and other products. As most of the companies from Europe and USA are looking at an alternate to China, and that is also one of the reason there is a big demand which has come to Indian markets, and the need for having better speciality chemicals and finishing agents has increased. This will give strong boost to demand of company’s products & FCL is expected to continue to grow at 20% CAGR in its topline in coming few years.
Strong Demand & decent
growth guidance
Upcoming brownfield
project at Ambernath

Expanding in new
geographies
Strong Clientele
Regarding new geographies, FCL have been working with almost 60 countries and recently have started a couple of new countries, which is Venezuela & Syria in the last quarter. So, there are the two new geographies or countries which company have started in the last three months. Apart from that, company have been participating in almost all the fairs, international fairs, like in Spain, Brazil, Iran, Pakistan, Sri Lanka, Vietnam. Hence, company is rapidly increasing its presence in almost all geographies which will give an edge to company going forward. FCL is catering in India companies like Chenab, JCT, Auro Dyeing, Auro Textile, Mahavir Spinning, Nahar Group, Reliance, Sai Exports, Himmat Singka, GHCL, RaymondBanswara, Syntex, Sangam, Therefore almost all the biggest corporate houses, Welspun and Trident, are FCL’s customer. FCL’s revenue from operations stood at INR 2,185 million, which is up by 11.3% year-on-year basis. Due to pandemic, company’s first quarter was not active much due to the lockdown. Company have increased focus to scale up its high-margin in speciality chemical orders from both its core textile segment and the new businesses. FCL’s EBITDA stood at INR 405 million for the year, up by 18.5% year-on-year basis. EBITDA margin stood at 18.6%, expanding 120 basis point, one of the highest in the industry led by continuous focus on sustainability, which is supporting profitable growth. Also, FCL is focusing on expanding its product portfolio to offer more diverge range. FCL’s PAT stood at INR 445 million in financial year '21, which is up by 211% year-on year basis. The margin stood at 20.4%. Growth in the profitability was aided by sustained revenue growth and cost efficiencies. Due to pandemic ,company witnessed shortage of the containers and there has been some delays of the supply and raw materials coming out of, international markets. This lead to increase in the freight cost of the imported products for all the businesses all over world. That have created a smaller impact on the gross margins. But going forward, given the company’s strong product mix ,it will continue to show decent margins. The Board has recommended a dividend of INR 0.30 per share for the financial year '21 compared to INR 0.05 in the financial year '20.
Healthy growth in
Financials


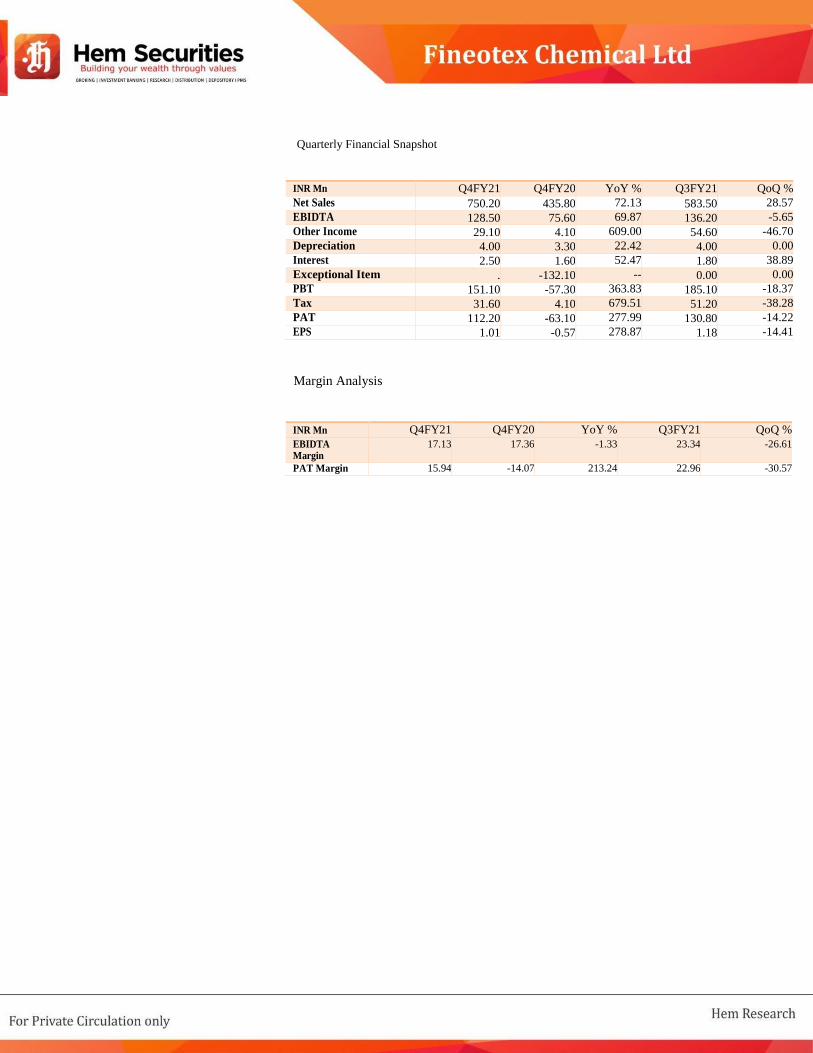
Quarterly Financial Snapshot
INR Mn Q4FY21 Q4FY20 YoY % Q3FY21 QoQ %
Net Sales 750.20 435.80 72.13 583.50 28.57
EBIDTA 128.50 75.60 69.87 136.20 -5.65
Other Income 29.10 4.10 609.00 54.60 -46.70
Depreciation 4.00 3.30 22.42 4.00 0.00
Interest 2.50 1.60 52.47 1.80 38.89
Exceptional Item . -132.10 -- 0.00 0.00
PBT 151.10 -57.30 363.83 185.10 -18.37
Tax 31.60 4.10 679.51 51.20 -38.28
PAT 112.20 -63.10 277.99 130.80 -14.22
EPS 1.01 -0.57 278.87 1.18 -14.41
Margin Analysis
INR Mn Q4FY21 Q4FY20 YoY % Q3FY21 QoQ %
EBIDTA Margin
17.13 17.36 -1.33 23.34 -26.61
PAT Margin 15.94 -14.07 213.24 22.96 -30.57

Consolidated Income Statement
Year To March
(Rs Mn)
FY17 FY18 FY19 FY20 FY21 FY22E FY23E FY24E
Net Sales 1344 1429 1823 1963 2185 2841 3551 4261
Expenditure 1049 1130 1477 1621 1780 2224 2757 3373
EBIDTA 295 300 347 342 405 616 794 1008
Depreciation 6 7 10 12 15 60 60 60
Other Income 97 52 8 22 175 80 80 80
EBIT 386 345 344 352 566 636 814 1028
Interest 4 6 10 6 7 10 15 15
PBT 382 339 335 346 559 626 799 1013
Exceptional Item 0 0 2 (126) 0 0 0 0
Tax 91 100 93 77 113 157 200 253
PAT 291 240 243 143 446 470 599 760
Minority Interest
(33) (13) (18) (12) (20) (22) (24) (26)
Consolidated Net Profit
258 227 225 131 426 448 575 734
Consolidated Balance Sheet
Year To March (Rs Mn)
FY17 FY18 FY19 FY20 FY21 FY22E FY23E FY24E
Equity Share Capital 223 223 223 223 221 221 221 221 Reserves & Surplus 902 1,135 1,372 1,474 1,872 2,342 2,941 3,700 Net Worth 1,125 1,357 1,595 1,697 2,093 2,563 3,162 3,922 Minority Interest 72 62 57 63 67 76 87 95
Other Non Current
Liabilities 3 6 6 6 13 13 13 13
Current liabilities &
Provisions 201 186 295 323 580 691 838 984
Total Liabilities 1,401 1,611 1,953 2,088 2,753 3,343 4,099 5013 Net Block 173 192 261 307 495 545 557 777 Capital WIP
0 1 1 6 46 20 40 50
Goodwill 61 61 61 61 61 61 61 61 Investment
38 38 38 38 38 38 38 38
Other Non Current Assets
542 597 508 511 389 617 640 692
Current Assets 587 722 1,083 1,165 1,724 2,061 2,763 3,395
Cash & Bank Balance
131 80 147 179 339 235 325 493
Debtors 292 279 491 538 827 1,151 1,343 1,710 Inventories 131 211 251 211 288 374 517 621 Other Current assets 32 152 193 236 270 302 578 571 Total Assets 1,400 1,611 1,953 2,088 2,753 3,342 4,099 5,013
3

Key ratios
Profitability (%) FY17 FY18 FY19 FY20 FY21 FY22E FY23E FY24E
Gross Margin
44.53 40.30 35.50 37.28 35.67 38.00 38.00 38.00 EBIDTA Margin 21.94 20.97 19.01 17.42 18.55 21.70 22.35 23.66 EBIT Margin 21.47 20.51 18.46 16.82 17.88 19.59 20.66 22.25 Effective Tax
Rate 23.84 29.35 27.65 34.84 20.22 25.00 25.00 25.00 Net Margin 19.22 15.88 12.35 6.66 19.49 15.78 16.20 17.22 ROE 22.97 16.72 14.12 7.71 20.35 17.48 18.19 18.70 ROCE 33.99 24.57 21.31 20.41 26.58 24.54 25.49 26.01 Debt/EBIDTA
0.04 2.31 1.17 0.08 0.08 0.05 0.04 0.03 Debt/EQ 0.01 0.03 0.01 0.02 0.02 0.01 0.01 0.01
Turnover Ratios
Turnover (x) FY17 FY18 FY19 FY20 FY21 FY22E FY23E FY24E
Fixed Assets
Turnover 7.79 7.44 7.00 6.40 4.42 5.21 6.38 5.48 Inventory
Turnover 10.23 6.78 7.27 9.31 7.60 7.60 6.86 6.86 Receivable
Turnover 4.60 5.12 3.71 3.65 2.64 2.47 2.64 2.49 Payable Turnover 8.68 13.16 8.74 8.92 4.85 4.85 4.85 4.85 Inventory Days 35.68 53.87 50.22 39.20 48.03 48.03 53.17 53.17 Receivable Days 79.43 71.30 98.36 100.10 138.10 147.84 138.04 146.52 Payable Days 42.03 27.74 41.77 40.90 75.29 75.29 75.29 75.29
Per Share Data
FY17 FY18 FY19 FY20 FY21 FY22E FY23E FY24E
EPS
2.32 2.04 2.02 1.17 3.85 4.05 5.19 6.62 CEPS
2.38 10.49 2.11 1.28 3.98 4.59 5.74 7.17 BV
10.11 12.19 14.33 15.25 18.90 23.14 28.55 35.41 DPS
0.10 0.20 0.10 0.05 0.30 0.30 0.30 0.30

Disclosure: I, Astha Jain , author and the name subscribed to this report, hereby certify that all of the views expressed in this research report accurately reflect my
views about the subject issuer(s) or securities. I also certify that no part of my compensation was, is, or will be directly or indirectly related to the specific recommendation(s) or view(s) in this report. Research Analyst or Hem Securities Ltd. does not have any financial interest in the subject company. Also Research
Analyst or his relative or Hem Securities Ltd or its Associate may have beneficial ownership of 1% or more in the subject company at the end of the month
immediately preceding the date of publication of the Research Report. Further Research Analyst or his relative or Hem Securities Ltd.. or its associate does not have any material conflict of interest.
Any holding in stock –No
Hem Securities Ltd. (HSL) is a SEBI Registered Research Analyst having registration no. INH100002250.
Disclaimer: This report has been prepared by Hem Securities Ltd. and is solely for information of the recipient only. The report must not be used as a singular basis of
any investment decision. The views herein are of a general nature and do not consider the risk appetite or the particular circumstances of an individual investor; readers are requested to take professional advice before investing. Nothing in this document should be construed as investment advice. Each recipient of this document should
make such investigations as they deem necessary to arrive at an independent evaluation of an investment in securities of the companies referred to in this document
(including merits and risks) and should consult their own advisors to determine merits and risks of such investment. The information and opinions contained herein have been compiled or arrived at, based upon information obtained in good faith from sources believed to be reliable. Such information has not been independently
verified and no guaranty, representation of warranty, express or implied, is made as to its accuracy, completeness or correctness. All such information and opinions are
subject to change without notice. Descriptions of any company or companies or their securities mentioned herein are not intended to be complete. HSL is not obliged to update this report for such changes. HSL has the right to make changes and modifications at any time. This report is not directed to, or intended for display,
downloading, printing, reproducing or for distribution to or use by, any person or entity who is a citizen or resident or located in any locality, state, country or other
jurisdiction where such distribution, publication, reproduction, availability or use would be contrary to law or regulation or what would subject HSL or its affiliates to any registration or licensing requirement within such jurisdiction. If this report is inadvertently sent or has reached any person in such country, especially, United
States of America, the same should be ignored and brought to the attention of the sender. This document may not be reproduced, distributed or published in whole or in
part, directly or indirectly, for any purposes or in any manner. Foreign currencies denominated securities, wherever mentioned, are subject to exchange rate fluctuations, which could have an adverse effect on their value or price, or the income derived from them. In addition, investors in securities such as ADRs, the values
of which are influenced by foreign currencies effectively assume currency risk. It should not be considered to be taken as an offer to sell or a solicitation to buy any
security. This document is not, and should not, be construed as an offer or solicitation of an offer, to buy or sell any securities or other financial instruments. This report should not be construed as an invitation or solicitation to do business with HSL. HSL may from time to time solicit from, or perform broking, or other services
for, any company mentioned in this mail and/or its attachments. HSL and its affiliated company(ies), their directors and employees may; (a) from time to time, have a
long or short position in, and buy or sell the securities of the company(ies) mentioned herein or (b) be engaged in any other transaction involving such securities and earn brokerage or other compensation or act as a market maker in the financial instruments of the company(ies) discussed herein or act as an advisor or
lender/borrower to such company(ies) or may have any other potential conflict of interests with respect to any recommendation and other related information and
opinions. HSL, its directors, analysts or employees do not take any responsibility, financial or otherwise, of the losses or the damages sustained due to the investments made or any action taken on basis of this report, including but not restricted to, fluctuation in the prices of shares and bonds, changes in the currency rates, diminution
in the NAVs, reduction in the dividend or income, etc. HSL and other group companies, its directors, associates, employees may have various positions in any of the
stocks, securities and financial instruments dealt in the report, or may make sell or purchase or other deals in these securities from time to time or may deal in other securities of the companies / organizations described in this report. HSL or its associates might have managed or co-managed public offering of securities for the
subject company or might have been mandated by the subject company for any other assignment in the past twelve months. HSL or its associates might have received
any compensation from the companies mentioned in the report during the period preceding twelve months from the date of this report for services in respect of managing or co-managing public offerings, corporate finance, investment banking or merchant banking, brokerage services or other advisory service in a merger or
specific transaction in the normal course of business. HSL or its analysts did not receive any compensation or other benefits from the companies mentioned in the
report or third party in connection with preparation of the research report. Accordingly, neither HSL nor Research Analysts have any material conflict of interest at the time of publication of this report. Compensation of our Research Analysts is not based on any specific merchant banking, investment banking or brokerage service
transactions. HSL may have issued other reports that are inconsistent with and reach different conclusion from the information presented in this report. Research entity
has not been engaged in market making activity for the subject company. Research analyst has not served as an officer, director or employee of the subject company. We have not received any compensation/benefits from the subject company or third party in connection with the Research Report.
SEBI REGISTRATION NO.: INZ000168034 ( BSE) INM000010981( MERCHANT BANKER) INH100002250 (RESEARCH ANALYST) IN-DP-CDSL-83-2000 ( DEPOSITORY PARTICIPANT) INP000006794 ( PORTFOLIO MANAGER)