· PDF fileinterest rate swap derivative liabilities which have fixed the ... appreciated in...
38
Contents Group Trading Structure 1 Directorate & Administration 2 Historical Financial Review 3 Chairman’s Review 4 Property Analysis 5 Accounting Policies 6 Directors’ Report 8 Consolidated Balance Sheet 12 Consolidated Income Statement 13 Consolidated Statement of Changes in Equity 14 Balance Sheet 15 Income Statement 16 Statement of Changes in Equity 16 Notes to the Financial Statements 17 Consolidated Cash Flow Statement 32 Notes to the Consolidated Cash Flow Statement 33 Cash Flow Statement 34 Report of the Independent Auditors 35 Notice of Meeting 36 Form of Proxy inserted T3IB00019 Marshalls AR – 17 May 2006 – Sharrell – Page 1 – PROOF 4 Marshalls Limited
-
Upload
nguyendieu -
Category
Documents
-
view
218 -
download
4
Transcript of · PDF fileinterest rate swap derivative liabilities which have fixed the ... appreciated in...

Contents
Group Trading Structure 1
Directorate & Administration 2
Historical Financial Review 3
Chairman’s Review 4
Property Analysis 5
Accounting Policies 6
Directors’ Report 8
Consolidated Balance Sheet 12
Consolidated Income Statement 13
Consolidated Statement of Changes in Equity 14
Balance Sheet 15
Income Statement 16
Statement of Changes in Equity 16
Notes to the Financial Statements 17
Consolidated Cash Flow Statement 32
Notes to the Consolidated Cash Flow Statement 33
Cash Flow Statement 34
Report of the Independent Auditors 35
Notice of Meeting 36
Form of Proxy inserted
T3IB00019 Marshalls AR – 17 May 2006 – Sharrell – Page 1 – PROOF 4
Marshalls Limited

MARSHALLS LIMITED ANNUAL REPORT 20051
Group Trading Structure
T3IB00019 Marshalls AR – 17 May 2006 – Sharrell – Page 1 – PROOF 4
MARSHALLS LIMITED
Listed on the JSE Limited
MARSHALLS INTERNAL LIMITED
Investment Holding Company
MARSHALLS GROUP LIMITED
Main Operating SubsidiaryOwner of commercial and lightindustrial properties in Durbanand Cape Town. It also operatesas a confirming house
MARSHALLS PARKING (PTY) LIMITED
Trades as Nicol Square Parking Garage
MARSHALL METALLIC HOLDINGSLIMITED
Holds investments in a permanentportfolio of foreign listed shares
MARSHALLS CONFIRMING(JERSEY) LIMITED
Trades as a Confirming House

Directorate and Administration
POSTAL ADDRESSPO Box 4112, The Square, 4021
TRANSFER SECRETARIESComputershare Investor Services 2004 (Pty) Limited
70 Marshall Street
Johannesburg
2001
AUDITORSPKF David Strachan & Tayler
Chartered Accountants (SA)
19th Floor, 320 West Street
Durban, 4001
SPONSORImara Corporate Finance South Africa (Pty) Limited
Ground Floor, West Wing
25 Wellington Road
Parktown, 2193
GROUP BANKERSFirst National Bank
8 Rydall Vale Park
Douglas Saunders Drive
La Lucia, 4320
ATTORNEYSShepstone and Wylie
35 Aliwal Street
Durban, 4001
2 MARSHALLS LIMITED
T3IB00019 Marshalls AR – 17 May 2006 – Sharrell – Page 2 – PROOF 4
MARSHALLS LIMITED(Registration No. 1987/002656/06)
DIRECTORATEDavid C Marshall (Chairman) (61 years)
Peter N Lonsdale, FCIS* # (73 years)
Mark E Stewart, BCompt (Hons) CA(SA)* # (43 years)
Brian A Hose, FRICS, FIV(SA)* (68 years)
OPERATING SUBSIDIARY
MARSHALLS GROUP LIMITED(Registration No. 1955/003199/06)
DIRECTORATEDavid C Marshall (Chairman)
Peter N Lonsdale, FCIS*
Lloyd H Marshall* (34 years)
Oliver H Marshall* (31 years)
Warwick H Marshall (36 years)
Mark E Stewart, BCompt (Hons) CA(SA)*
Brian A Hose, FRICS, FIV(SA) *
Eric Prange, CA(SA) # (Managing) (30 years)
* Non-executive# Group Audit and Risk Committee
SECRETARYAbdool M Ahmed, MIAC
BUSINESS AND REGISTERED ADDRESS11 Sunbury Park, La Lucia Ridge Office Estate
La Lucia, 4319
David C Marshall Peter N Lonsdale Mark E Stewart Brian A Hose

MARSHALLS LIMITED ANNUAL REPORT 20053
Historical Financial Review
Restated* Restated#
2000 2001 2002 2003 2004 2005
R000’s R000’s R000’s R000’s R000’s R000’s
Results
Revenue 18 235 18 177 18 769 18 105 18 686 17 874
Profit before taxation and interest paid 4 068 45 9 600 5 191 12 579 16 115
Interest paid 1 872 3 347 3 824 3 113 2 534 3 111
Earnings attributable to ordinary
shareholders 1 143 (3 042) 4 303 818 8 361 10 521
Headline earnings attributable to
ordinary shareholders 4 385 4 065 1 144 925 2 217 1 571
Ordinary shareholders’ interest 69 896 72 004 63 059 65 846 71 095 82 684
Investment property 73 015 64 101 60 177 60 138 65 727 71 667
Restated Restated
2000 2001 2002 2003 2004 2005
cents cents cents cents cents cents
Per share data
Earnings per share 6,6 (17,5) 24,8 4,7 48,1 60,6
Headline earnings per share 25,2 23,4 6,6 5,3 12,8 9,0
Dividends per share 19,0 17,0 12,0 10,0 10,0 12,0
Dividend cover (times) 0,3 (1,0) 2,1 0,5 4,8 5,1
Net asset value per share 402 414 363 379 409 476
Restated Restated
2000 2001 2002 2003 2004 2005
Other data
Investment properties to total assets (%) 70.5 59.2 64.5 67.4 72.4 65.5
Interest bearing debt to ordinary
shareholders’ interest (%) 31.3 29.7 27.3 26.0 22.8 23.5
Interest cover (times) 2.2 – 2.5 1.7 5.0 5.2
Profit before taxation and interest paid
to revenue (%) 22.3 0.2 51.1 28.7 67.3 90.2
DEFINITIONSInterest coverThis is the ratio which operating profit, before interest paid and taxation, bears to interest paid.
Earnings per shareEarnings per share are calculated on the weighted average number of ordinary shares in issue during the year and are based
on earnings attributable to ordinary shareholders.
Headline earnings per shareHeadline earnings per share are calculated on the weighted average number of ordinary shares in issue during the year and
are based on earnings attributable to ordinary shareholders, after excluding all items of a non-trading nature, net of taxation.
Details of the adjustments to earnings attributable to ordinary shareholders, for items of a non-trading nature, are provided
in note 20 of the notes to the financial statements.
# Refer to note 17.
* Refer to note 18.
T3IB00019 Marshalls AR – 17 May 2006 – Sharrell – Page 3 – PROOF 4

Chairman’s Review for the year ended 31 December 2005
Review of operating resultsOperating profit before interest
amounted to R5 512 406 (2004:
R5 738 357 restated). The fall
is attributable to the group
operating from a lower asset
base due to the disposal of
two investment properties and
the difficulty experienced in
re-investing in the short term.
Interest paid increased to R3 110 693 (2004: R2 533 803)
due to an increase in borrowings and the recognition of
interest rate swap derivative liabilities which have fixed the
rate of interest for the years ahead.
Headline earnings per share decreased by 29.7% to
9,0 cents per share (2004: 12,8 cents per share restated).
Despite this, the group has been able to show an increase
in dividends declared to 12 cents per share (2004:
10 cents per share) and with the most recently declared
dividend (15 March 2006) being 6,5 cents per share.
Total assets under management at the reporting date
totalled R109 443 506 (2004: R90 786 694 restated) with
82% of this figure represented by investment properties
and the group’s share portfolio.
Property divisionMarket sentiment for the future remains positive due to the
buoyant economy and continued demand for leased light
industrial premises. At present the vacancy level, based on
fully let value, is less than 2%.
At year end the group’s portfolio of investment properties
was valued at R69 215 000 (2004: R67 120 000). Property
held at both year ends was valued at R63 315 000 (2004:
R54 810 000).
During the year two investment properties were disposed
of at a cumulative surplus of R1 617 019. Cash available
from these disposals after disposal costs amounted to
R13 858 436.
Efforts to reinvest in the group’s operational areas of
Durban and Cape Town have been frustrated by the lack
of suitable stock and falling yields. Two additional
investment properties have been acquired, one during
2005 and another in the first quarter of 2006.
The group has geared up in order to purchase additional
investment properties and has approximately R17 500 000
to invest.
Confirming divisionThe contribution from this division fell by 51% and was
both anticipated and planned for. The outlook for the future
is expected to mirror that of 2005.
Investment divisionThe market value of the foreign listed shares was
R18 196 983 (2004: R15 170 814). Overall performance of
the portfolio has been extremely pleasing and it has
appreciated in sterling currency by approximately 20%
during the year under review.
Investment income received from the underlying
investments was R448 904 (2004: R378 802). Cost savings
have added to this division’s performance, resulting in a
62% increase in its contribution before tax to R236 520
(2004: R146 330).
International financial reporting standards (IFRS)
The accepted treatment of operating leases in terms of IAS
17 (leases) has caused significant consternation within the
property industry. Once again the group has had to restate
its comparative figures in order to comply with IFRS.
The effect of complying with IAS 17 (leases) has not been
material to the group’s results with the costs of complying
exceeding the benefit.
Capital restructuringPreviously the share capital of the group consisted of par
value ordinary shares and par value “N” Ordinary shares.
During the year the members passed special resolutions
consolidating these shares on a one for one basis to
ordinary shares having no par value.
AppreciationOn behalf of the board of directors and the shareholders,
I wish to extend my sincere appreciation to my executive
and all staff for their commitment and support.
DC MARSHALLChairman
4 MARSHALLS LIMITED
T3IB00019 Marshalls AR – 17 May 2006 – Sharrell – Page 4 – PROOF 4

MARSHALLS LIMITED ANNUAL REPORT 20055
Property Analysis
Dear Sirs,
As instructed, we carried out an Open Market Valuation of the properties owned by Marshalls Limited as at
31 December 2005, details of which are available at the offices of the Group.
We define “Open Market Value” as the price at which the property might reasonably be expected to sell, assuming an arm’s
length transaction between a willing, able and informed seller and a willing, able and informed buyer(s), and further, that
reasonable time is allowed for the disposal of the property.
Generally all these properties are well situated, the tenants are sound and the rentals achieved are market related.
Yours faithfully
CB RICHARD ELLISMA Carrim MIV (SA)
Registered Valuer
T3IB00019 Marshalls AR – 17 May 2006 – Sharrell – Page 5 – PROOF 4
2005 2004 2005 2004
% m2 % m2 % R % R
Commercial and Commercial and
Light Industrial 80.8 48 449 43.9 42 378 Light Industrial 76.0 12 736 803 74.4 12 823 131
Offices 2.0 1 221 6.2 6 019 Offices 11.4 1 916 922 12.0 2 075 859
Parking 17.2 10 296 49.9 48 209 Parking 12.6 2 113 060 13.6 2 337 678
100.0 59 966 100.0 96 606 100.0 16 766 785 100.0 17 236 668
2.0%
17.2%
80.8%
11.4%
12.6%
76.0%
LETTABLE AREAS RENTAL AND PARKING FEES
2005 2005
6.2%
49.9%43.9%
12.0%
13.6%
74.4%
2004 2004
COMMERCIAL ANDLIGHT INDUSTRIAL
OFFICES
PARKING

Accounting Policies for the year ended 31 December 2005
The financial statements set out on pages 6 to 34
incorporate the following principal accounting policies
which are consistent with those applied in the previous
year except for the effects of applying the accepted
interpretation of IAS 17 (leases), as more fully detailed in
note 17 to these financial statements. These policies
comply with International Financial Reporting Standards
and in the manner required by the Companies Act in
South Africa.
RevenueRevenue comprises:
Net rentals charged to tenants and parking income
Net confirming fees and interest charged to confirming
clients
Investment income from investments.
Rental income is recognised on a straight line basis in
accordance with the accepted interpretation of IAS 17
(leases).
Basis of consolidationThe consolidated financial statements incorporate the
assets, liabilities and results of all the company’s
subsidiaries. The results of the subsidiaries are included
from the effective dates of acquisition and up to the
effective dates of disposal. All inter-company transactions
and balances have been eliminated.
Foreign currenciesTransactions in foreign currencies are accounted for at the
rates of exchange ruling on the date of transactions. Gains
and losses arising from the settlement of such transactions
are recognised in the income statement.
Monetary assets and liabilities denominated in foreign
currencies are translated at the rates of exchange ruling at
the balance sheet date. Unrealised differences on
monetary assets and liabilities are recognised in the
income statement.
Deferred taxationDeferred taxation is calculated at current rates using the
liability method. Full provision is made for all temporary
differences between the tax base of an asset or liability
and its carrying amount.
A deferred tax asset is not raised on assessed losses or
deductible temporary differences unless it is probable that
future taxable profits will be available against which the
deferred tax asset can be raised in the foreseeable future.
Investment propertyInvestment property is land and buildings held by the
group to earn rentals and/or for capital appreciation.
Investment property is initially recorded at cost including
transaction costs. Subsequent measurement is at open
market value with the adjustment for the period being
included in the determination of the profit/loss for that
period. The properties are valued annually by a suitably
qualified, independent valuator and this value is taken as
the open market value at year end.
Any surpluses or losses on disposal of the properties are
recognised in the income statement.
Depreciation of property, plant and equipmentProperty, plant and equipment are depreciated to their
residual values on a straight line basis over the useful lives
of the assets.
6 MARSHALLS LIMITED
T3IB00019 Marshalls AR – 17 May 2006 – Sharrell – Page 6 – PROOF 4

MARSHALLS LIMITED ANNUAL REPORT 20057
Accounting Policies for the year ended 31 December 2005
Investments in subsidiariesShares in subsidiaries are stated at cost or valuation at
time of acquisition. The company has an investment in a
foreign subsidiary company which is classified as a foreign
entity. The financial statements of this subsidiary are
translated for incorporation into the group financial
statements as follows:
Assets and liabilities at the closing rate.
Income statement items at the average rate for the
period.
Exchange differences are taken directly to non-
distributable reserves.
Investments in listed sharesListed investments are stated at fair value at year end.
Adjustments to the fair value of listed investments are
charged directly to equity.
Retirement benefitsThe defined benefit obligations, the related current service
cost, and where applicable, past service cost, are
determined by using the projected unit credit method.
A portion of actuarial gains and losses is recognised as
income or expense if the net cumulative unrecognised
actuarial gains and losses at the end of the previous
reporting period exceeded the greater of:
* 10% of the present value of the defined benefit obligation
at that date before deducting plan assets; and
* 10% of the fair value of any plan assets at that date.
The portion of actuarial gains and losses to be recognised
is the excess referred to above, divided by the expected
average remaining working lives of the employees
participating in the plan.
Segment reportingSegment assets and liabilities are directly attributable to
the segments.Segment assets include all operating assets
used by a segment, and consist principally of investment
property, property, plant and equipment, as well as current
assets. Segment liabilities include operating liabilities and
consist principally of trade payables.
Segment revenue and expenses are directly attributable to
the segments. Segment revenue, expenses and results
include transfers between business segments. Such
transfers are accounted for at competitive market prices
charged to unaffiliated customers for similar goods. These
transfers are eliminated on consolidation.
Financial instrumentsFinancial instruments carried on the balance sheet include
cash and bank balances, investments, receivables, trade
creditors and borrowings. These instruments are carried at
fair value. The particular recognition methods adopted are
disclosed in the individual policy statements associated
with each item.
LeasesLeases are classified as finance leases whenever the terms
of the lease transfer substantially all the risks and rewards
of ownership to the lessee. All other leases are classified
as operating leases.
ProvisionsProvisions are recognised when the company has a
present legal or constructive obligation as a result of a past
event, and it is probable that an outflow of resources
embodying economic benefits will be required to settle
the obligation, and a reliable estimate of the amount can
be made.
T3IB00019 Marshalls AR – 17 May 2006 – Sharrell – Page 7 – PROOF 4

Directors’ Report for the year ended 31 December 2005
Your directors have pleasure in submitting their report for
the financial year ended 31 December 2005.
Nature of businessThe company, as a holding company, receives income in
the form of dividends from its wholly owned subsidiary
Marshalls Internal Limited.
Marshalls Internal Limited, in turn, has a wholly owned
subsidiary, being Marshalls Group Limited. Marshalls
Group Limited is the owner of commercial and light
industrial properties, situated in Durban and Cape Town. It
also operates a confirming and indent financing division
trading in South Africa. Marshalls Group Limited holds a
100% interest in the following companies:
Marshalls Confirming (Jersey) Limited is incorporated in
Jersey, Channel Islands, and operates as a confirming
house.
Marshalls Parking (Pty) Limited owns a parking garage in
Durban.
Marshall Metallic Holdings Limited holds, as a permanent
investment, a portfolio of listed shares in the United
Kingdom, the United States of America and Western
Europe.
Borrowing powersAt 31 December 2005 the Group’s borrowings were
R19 398 482 (2004: R16 179 567). In terms of the Articles
of Association the borrowing powers of the company are
unlimited.
Subsidiary companiesThe interest of the company in its subsidiaries is set out in
note 3 to these financial statements.
Restated
2005 2004
R R
The aggregate net operating
income after tax of the
subsidiaries attributable to the
company was 10 524 957 8 365 204
DividendsPaid 12 cents per share
(2004: 10 cents) 2 084 676 1 737 230
A final dividend of 6,5 cents per share in respect of the
year ended 31 December 2005 has been declared.
CORPORATE GOVERNANCE
Code of Corporate Practices and ConductThe directors endorse and, during the period under review,
have applied the Code of Corporate Practices and
Conduct as set out in the King Report. By supporting the
Code, the directors have recognised the need to conduct
the enterprise with integrity and in accordance with
generally accepted corporate practices.
Directors’ responsibilities in relation to financial statementsThe Board supports the principles of openness, integrity
and accountability. Fundamental to the fulfilment of
corporate responsibilities and the achievement of financial
objectives is an effective system of corporate governance.
Following the publication of the King Report on Corporate
Governance, the Board continually reviews the group’s
policies to determine that they meet current requirements.
These policies relate, inter alia, to the duties of the Board
and to the delegation of powers to the various committees,
and specify responsibilities and levels of authority.
Accountability and controlThe directors are required by the Companies Act to
prepare financial statements which fairly present, in all
material respects, the financial position of the company
and group as at the end of the financial year and the
results of their operations and cash flows for that period,
in accordance with International Financial Reporting
Standards and in the manner required by the Companies
Act in South Africa. It is the auditors’ responsibility to
report on them.
Your directors report that the group’s internal controls and
systems are designed to provide reasonable assurance as
to the integrity and reliability of financial statements and to
adequately safeguard, verify and maintain accountability
of its assets. Such controls are based on established
trained and skilled personnel with an appropriate
segregation of duties.
These are monitored through the group and all employees
are required to maintain the highest ethical standards in
ensuring the group’s business practices are to be
conducted in a manner which in all reasonable
circumstances is above reproach. Nothing has come to
the attention of your directors to indicate that any material
breakdown in the functioning of these controls,
procedures and systems has occurred during the year
under review.
8 MARSHALLS LIMITED
T3IB00019 Marshalls AR – 17 May 2006 – Sharrell – Page 8 – PROOF 4

MARSHALLS LIMITED ANNUAL REPORT 20059
Directors’ Report for the year ended 31 December 2005
In preparing the financial statements, the group has used appropriate accounting policies consistently, supported by
reasonable prudent judgements and estimates, and has complied with all applicable accounting standards. The directors
are of the opinion that the financial statements fairly present, in all material respects, the financial position of the company
and the group at 31 December 2005, and the results of their operations and cash flow information for the year then ended.
After making enquiries the directors have reasonable expectation that the company has adequate resources to continue in
operational existence for the year ahead. For this reason, they continue to adopt the going concern basis in preparing the
annual financial statements.
The external auditors concur with the above statements by the directors.
Board of directors and committee structuresDetails of the directors are given on page 2 of this report. The Board comprises both executive and non-executive directors.
Your directors consider that it is in the group’s best interest that Mr DC Marshall, an executive director, be Chairman of the
Board. The Group Audit and Risk Committee comprises non-executive directors with executive directors attending by
invitation. It is responsible for monitoring the adequacy of the group’s financial controls, accounting policies and financial
reporting.
The Board of Directors met nine times during the 2005 financial year and attendance was as follows:
DC Marshall 7 times
PN Lonsdale 8 times
ME Stewart 8 times
BA Hose 9 times
The Group Audit and Risk Committee met twice during the 2005 financial year and attendance was as follows:
PN Lonsdale 2 times
ME Stewart 2 times
E Prange 2 times
External auditors 2 times (by invitation)
Directors’ shareholdingsInterests of the directors of the company as at 31 December 2005 were as follows:
2005 2004*
Shares held Shares held
DC Marshall
Indirect beneficial holding 2 912 529 2 910 863
Indirect non-beneficial holding 6 877 000 6 878 666
9 789 529 9 789 529
PN Lonsdale
Indirect beneficial holding 266 100 266 100
* = The “N” Ordinary shareholdings of directors in respect of 2004 are reflected as ordinary shares for comparison purposes.
No directors hold either a direct beneficial or direct non-beneficial interest in the shares of the company.
There have been no changes in the above holdings since the reporting date.
T3IB00019 Marshalls AR – 17 May 2006 – Sharrell – Page 9 – PROOF 4

Directors’ Report for the year ended 31 December 2005
2005 %
Shares held Shares held
Analysis of shareholding
Major shareholders holding more than 5%
Marshall Holdings (Pty) Limited 7 928 489 45.6
Monteagle Merchant Group Limited 1 051 940 6.1
8 980 429 51.7
Shareholders holding less than 5% each 8 391 871 48.3
Total 17 372 300 100.0
Number of Shares
shareholders held %
Analysis of public and non-public shareholders
Public 340 7 316 671 42.1
Non-public – directors and associates 4 10 055 629 57.9
Total 344 17 372 300 100.0
Number of Total
members % holding %
Shareholder analysis
1 – 999 56 16.3 19 163 0.1
1 000 – 9 999 132 38.2 540 131 3.1
10 000 – 49 999 112 32.6 2 272 275 13.1
50 000 – 99 999 24 7.0 1 552 156 8.9
100 000 – 499 999 16 4.7 2 550 046 14.7
500 000 – 999 999 2 0.6 1 458 100 8.4
1 000 000 and above 2 0.6 8 980 429 51.7
344 100.0 17 372 300 100.0
Share capitalOn 9 May 2005, special resolutions were passed consolidating the company’s two classes of ordinary shares of par value
into one class of ordinary share with no par value.
Stated Share Share
capital capital premium Total
R R R R
Balance at beginning of year – 11 504 501 15 304 525 26 809 026
Consolidation of issued ordinary and
“N” ordinary shares 11 504 501 (11 504 501) – –
Consolidation of share premium 15 304 575 – (15 304 525) –
Balance at end of year 26 809 026 – – 26 809 026
10 MARSHALLS LIMITED
T3IB00019 Marshalls AR – 17 May 2006 – Sharrell – Page 10 – PROOF 4

MARSHALLS LIMITED ANNUAL REPORT 200511
Directors’ Report for the year ended 31 December 2005
Special resolutionsThe following special resolutions were passed by the shareholders:
1. The entire share capital consisting of ordinary par value shares and “N” ordinary par value shares be converted to no
par value shares.
2. The Articles of Association were amended to abolish the distinction between “N” ordinary shareholders and ordinary
shareholders in respect of each such shareholder’s voting rights.
3. The Articles of Association were amended to convey equal voting rights on each shareholder whether such voting rights
are exercised by way of a show of hands or on a poll.
4. The Articles of Association were amended to delete all references to shares of differing par value for the purposes of
payments and dividends to shareholders.
Annual Financial StatementsThe annual financial statements set out from page 6 to 34 were approved by the Board of Directors and are signed on its
behalf.
DC MARSHALL PN LONSDALEChairman
Durban,
6 April 2006
Declaration by Company SecretaryIn my capacity as Company Secretary, to the best of my knowledge, I hereby confirm, in terms of the Companies Act, 1973,
that for the year ended 31 December 2005, the company has lodged with the Registrar of Companies all such returns as
are required of a public company in terms of this Act and that all such returns are true, correct and up to date.
AM AHMEDCompany Secretary
T3IB00019 Marshalls AR – 17 May 2006 – Sharrell – Page 11 – PROOF 4

Restated
Notes 2005 2004
R R
ASSETS
Non-current assets 93 564 745 82 239 361
Investment property 1 71 667 305 65 726 707
Property, plant and equipment 2 3 241 782 930 671
Listed investments 4 18 202 599 15 173 622
Amortised lease receivables 453 059 408 361
Current assets 15 878 761 8 547 333
Trade receivables and loans 2 267 108 1 052 995
Bills receivable 3 634 760 3 992 328
Available for sale assets 5 6 729 000 –
Bank and cash balances 3 247 893 3 502 010
TOTAL ASSETS 109 443 506 90 786 694
EQUITY AND LIABILITIES
Equity and reserves 82 684 343 71 095 349
Stated capital 6 26 809 026 –
Share capital 6 – 11 504 501
Share premium 7 – 15 304 525
Non-distributable reserves 8 36 783 058 28 872 391
Distributable reserves 19 092 259 15 413 932
Non-current liabilities 20 003 600 15 750 241
Interest bearing borrowings 9 18 588 737 15 588 597
Deferred taxation 10 1 414 863 161 644
Current liabilities 6 755 563 3 941 104
Trade payables 1 486 551 1 655 705
Current portion – interest bearing borrowings 9 809 745 590 970
Bank overdrafts 3 744 487 1 069 105
Taxation payable 339 895 56 523
Provisions 11 374 885 568 801
TOTAL EQUITY AND LIABILITIES 109 443 506 90 786 694
Consolidated Balance Sheet as at 31 December 2005
12 MARSHALLS LIMITED
T3IB00019 Marshalls AR – 17 May 2006 – Sharrell – Page 12 – PROOF 4

Consolidated Income Statement for the year ended 31 December 2005
MARSHALLS LIMITED ANNUAL REPORT 200513
Restated
Notes 2005 2004
R R
Revenue 12 17 873 597 18 686 381
Other income 94 925 192 539
Expenses (12 456 116) (13 140 563)
Administration 2 141 289 1 966 502
Personnel 4 928 399 5 314 875
Property and operations 5 386 428 5 859 186
Operating profit before interest 13 5 512 406 5 738 357
Interest received 289 195 28 230
Interest paid (3 110 693) (2 533 803)
Operating profit after interest 2 690 908 3 232 784
Non-operating profit/(loss) items 15 10 313 713 6 812 176
Profit before taxation 13 004 621 10 044 960
Taxation 16 2 483 591 1 683 732
Profit for the year 10 521 030 8 361 228
Earnings per share 20 60,6 cents 48,1 cents
Headline earnings per share 20 9,0 cents 12,8 cents
Dividends per share 12,0 cents 10,0 cents
Dividend cover 5,1 times 4,8 times
T3IB00019 Marshalls AR – 17 May 2006 – Sharrell – Page 13 – PROOF 4

Restated
Notes 2005 2004
R R
Stated capital 6 26 809 026 –
Balance at beginning of year – –
Consolidation of issued ordinary shares 11 504 501 –
Consolidation of share premium 15 304 525 –
Share capital 6 – 11 504 501
Balance at beginning of year 11 504 501 11 504 501
Transfer to stated capital (11 504 501) –
Share premium 7 – 15 304 525
Balance at beginning of year 15 304 525 15 304 525
Transfer to stated capital (15 304 525) –
Non-distributable reserves 36 783 058 28 872 391
Balance at beginning of year 28 872 391 26 192 028
As previously reported 29 336 348 21 324 322
Lease smoothing effect 17 (463 957) (518 173)
Effect of prior year adjustment 18 – 5 385 879
Transfer from distributable reserves 7 333 232 3 507 925
Currency translation movement 577 435 (827 562)
Distributable reserves 19 092 259 15 413 932
Balance at beginning of year 15 413 932 12 729 892
As previously reported 15 072 731 12 206 910
Lease smoothing effect 17 341 201 403 067
Effect of prior year adjustment 18 – 119 915
Profit for the year 10 521 030 8 361 228
Dividends paid (2 084 676) (1 737 230)
Transfer of surplus on property revaluations to
non-distributable reserves (5 984 360) (3 507 925)
Unrealised surplus on revaluation of listed investments 2 575 205 (244 802)
Transfer of net surplus on disposal of investment properties to
non-distributable reserves (1 348 872) –
Net deficit on disposal of listed investments – (187 231)
Equity and reserves at end of year 82 684 343 71 095 349
Consolidated Statement of Changes in Equity for the year ended 31 December 2005
14 MARSHALLS LIMITED
T3IB00019 Marshalls AR – 17 May 2006 – Sharrell – Page 14 – PROOF 4

Balance Sheet as at 31 December 2005
MARSHALLS LIMITED ANNUAL REPORT 200515
Notes 2005 2004
R R
ASSETS
Non-current assets
Investment in subsidiary 3 22 568 647 22 568 647
Loan to subsidiary 6 325 902 6 331 345
Current assets
Cash 68 298 2 400
TOTAL ASSETS 28 962 847 28 902 392
EQUITY AND LIABILITIES
Equity and reserves 28 864 476 28 868 403
Stated capital 6 26 809 026 –
Share capital 6 – 11 504 501
Share premium 7 – 15 304 525
Distributable reserves 2 055 450 2 059 377
Current liabilities
Trade payables 98 371 33 989
TOTAL EQUITY AND LIABILITIES 28 962 847 28 902 392
T3IB00019 Marshalls AR – 17 May 2006 – Sharrell – Page 15 – PROOF 4

Notes 2005 2004
R R
Revenue
Unclaimed dividends written back 73 115
Dividends received from subsidiary 2 084 676 1 737 230
2 084 749 1 737 345
Profit for the year 13 2 080 749 1 733 345
Statement of Changes in Equity for the year ended 31 December 2005
Notes 2005 2004
R R
Stated capital 6 26 809 026 –
Balance at beginning of year – –
Consolidation of issued ordinary shares 11 504 501 –
Consolidation of share premium 15 304 525 –
Share capital 6 – 11 504 501
Balance at beginning of year 11 504 501 11 504 501
Transfer to stated capital (11 504 501) –
Share premium 7 – 15 304 525
Balance at beginning of year 15 304 525 15 304 525
Transfer to stated capital (15 304 525) –
Distributable reserves 2 055 450 2 059 377
Balance at beginning of year 2 059 377 2 063 262
Profit for the year 2 080 749 1 733 345
Dividends paid (2 084 676) (1 737 230)
Equity and reserves at end of year 28 864 476 28 868 403
Income Statement for the year ended 31 December 2005
16 MARSHALLS LIMITED
T3IB00019 Marshalls AR – 17 May 2006 – Sharrell – Page 16 – PROOF 4

Notes to the Financial Statements for the year ended 31 December 2005
MARSHALLS LIMITED ANNUAL REPORT 200517
Group Company
Restated
2005 2004 2005 2004
R R R R
1. INVESTMENT PROPERTY
Freehold property – at valuation 72 412 904 66 573 228 – –
Lease smoothing effect (745 599) (846 521) – –
71 667 305 65 726 707 – –
Reconciliation of the carrying value of investment property
Opening carrying value 65 726 707 59 344 276 – –
Disposals (12 241 417) – – –
Additions 9 310 317 – – –
Improvements 36 193 63 153 – –
Revaluation surplus 8 835 505 6 319 278 – –
Closing carrying value 71 667 305 65 726 707 – –
A register is maintained that is open for inspection by
members or their duly authorised agents at the registered
office of the company giving the information required
in terms of Schedule 4, paragraph 22(3) of the
Companies Act.
On 31 December 2005 the group’s freehold properties
were valued by MA Carrim, MIV (SA) registered valuer, at
open market value of R69 215 000 (2004: R67 120 000).
Open market value is defined as the price at which the
property might reasonably be expected to sell, assuming
an arm’s length transaction between a willing, able and
informed seller and buyer and further, that reasonable time
is allowed for the disposal of the property. The valuation
includes certain items of plant and equipment which have
been deducted from the carrying value of the properties
stated above. Also deducted from this carrying value is the
amortised lease receivables recognised on the balance
sheet in terms of IAS 17 (leases).
Certain freehold properties owned by subsidiary
companies valued at R46 700 000 (2004: R31 880 000) are
held as security for interest bearing borrowings totalling
R24 157 207 (2004: R16 179 567) as detailed in Note 9.
Subsequent to year end, the group took legal title of an
investment property situated in Westmead, Durban.
T3IB00019 Marshalls AR – 17 May 2006 – Sharrell – Page 17 – PROOF 4
Group Company
Restated
2005 2004 2005 2004
R R R R
2. PROPERTY, PLANT AND EQUIPMENT
Property – at cost November 2005 2 253 719 – – –
Air conditioners 229 768 337 899 – –
At cost 729 415 1 190 045 – –
Accumulated depreciation (499 647) (852 146) – –
Motor vehicles 172 799 137 370 – –
At cost 909 456 795 007 – –
Accumulated depreciation (736 657) (657 637) – –
Office equipment and plant 585 496 455 402 – –
At cost 1 991 229 1 550 921 – –
Accumulated depreciation (1 405 733) (1 095 519) – –
3 241 782 930 671 – –
Property is described as Sections No. 3 and 5, Marshalls
House, situated at 11 Sunbury Park, La Lucia Ridge Office
Estate in extent 244 square metres.
No depreciation has been provided for on the property as
the residual value of the property exceeds its cost at the
balance sheet date.
Reconciliation of the carrying value of property,
plant and equipment.
Property – addition 2 253 719 – – –
Air conditioners 229 768 337 899 – –
Opening carrying value 337 899 357 045 – –
Additions 108 674 52 127 – –
Disposals (150 648) – – –
Depreciation – current (66 157) (71 273) – –
Motor vehicles 172 799 137 370 – –
Opening carrying value 137 370 214 789 – –
Addition 131 762 – – –
Disposals (3 046) – – –
Depreciation – current (93 287) (77 419) – –
Office equipment and plant 585 496 455 402 – –
Opening carrying value 455 402 494 115 – –
Additions 275 297 53 706 – –
Disposals (23 300) – – –
Depreciation – current (121 903) (92 419) – –
Carrying value at end of year 3 241 782 930 671 – –
Notes to the Financial Statements for the year ended 31 December 2005
18 MARSHALLS LIMITED
T3IB00019 Marshalls AR – 17 May 2006 – Sharrell – Page 18 – PROOF 4

Notes to the Financial Statements for the year ended 31 December 2005
MARSHALLS LIMITED ANNUAL REPORT 200519
Group Company
Restated
2005 2004 2005 2004
R R R R
3. INVESTMENTS IN SUBSIDIARIES
3.1 100% held by Marshalls Limited
Marshalls Internal Limited
8 500 000 shares of no par value – at cost 22 568 647 22 568 647
3.2 Trading subsidiaries
100% held by Marshalls Internal Limited
Marshalls Group Limited
100 ordinary shares of R2 each at cost 200 200
Loan 23 421 525 23 425 525
The loan is unsecured, interest free, with
no fixed date of repayment.
3.3 100% held by Marshalls Group Limited
Marshalls Confirming (Jersey) Limited
(incorporated in Jersey, Channel Islands)
9 shares of R2,78 each – at cost 25 25
Marshall Metallic Holdings Limited
550 000 shares of 1,0 cent each 5 500 5 500
Loan 16 853 000 15 652 300
The loan is unsecured, interest free and with
no fixed date of repayment.
Marshalls Parking (Pty) Limited
100 shares of R1 each 100 100
Loan 3 722 628 4 089 181
The loan is unsecured, interest free and with
no fixed date of repayment.
44 002 978 43 172 831 22 568 647 22 568 647
T3IB00019 Marshalls AR – 17 May 2006 – Sharrell – Page 19 – PROOF 4

GroupRestated Restated
2005 2005 2004 2004Number of Fair Number of Fair
Shares value Shares valueR R
4. LISTED INVESTMENTSUnited Kingdom 9 029 469 7 633 425
Associated British Foods plc 5 300 485 572 5 300 451 918Aviva plc (formerly CGNU plc) 4 500 346 431 4 500 308 729BAA plc 9 000 616 205 9 000 574 196BP Amoco plc 8 000 540 749 8 000 443 975British American Tobacco plc 4 750 674 299 4 750 465 726Cadbury Schweppes plc 11 000 660 049 11 000 582 827Diageo plc 8 000 735 996 8 000 649 358GlaxoSmithKline 3 750 601 551 3 750 500 619HSBC Holdings plc 5 000 509 410 5 000 480 136Imperial Tobacco plc 3 000 569 032 3 000 467 682Informa plc 7 500 497 332 7 500 309 308Pearson plc 4 400 330 325 4 400 302 109Prudential plc 5 833 350 330 5 833 288 660Reckitt Benckiser plc 2 750 576 566 2 750 472 870Reuters Group plc 4 000 188 039 4 000 164 961Royal Dutch Shell (formerly Shell Transport & Trading Co plc) 2 298 466 244 8 000 388 041Unilever plc 14 000 881 339 14 000 782 310
United States of America 2 561 408 2 354 948
American Express Co. 1 200 392 775 1 200 384 906Citigroup Inc 1 300 401 282 1 300 356 404Johnson & Johnson 1 600 611 630 1 600 577 397Merck & Co Inc 900 182 099 900 164 590Pfizer Inc 1 600 237 320 1 600 244 820Proctor & Gamble & Co 2 000 736 302 2 000 626 831
Western Europe 6 606 106 5 182 441
Baloise Holdings AG 590 218 538 590 154 998Bayer AG 1 600 427 609 1 600 308 128Credit Suisse Group AG 1 400 452 703 1 400 334 861Deutsche Bank AG 800 491 774 800 404 035Fortis ‘B’ 2 400 489 252 2 400 378 111ING Groep NV 2 000 445 682 2 000 344 332L’Oreal 1 050 499 079 1 050 453 556Nestle SA 360 682 816 360 535 917Novartis AG 2 000 666 502 2 000 573 454Roche Holdings AG 700 666 546 700 458 516Schweiz-Ruckversicherungs-G AG 720 334 288 720 292 189UBS AG 1 500 905 645 1 500 715 692Zurich Financial Services AG 241 325 672 241 228 652
South AfricaMercantile Bank Holdings Limited(formerly Mercantile Lisbon Bank Holdings Limited) 15 600 5 616 15 600 2 808
18 202 599 15 173 622
These investments, with the exception of the South African holding, are held as security in favour of Investec BankLimited as detailed in note 9.
Notes to the Financial Statements for the year ended 31 December 2005
20 MARSHALLS LIMITED
T3IB00019 Marshalls AR – 17 May 2006 – Sharrell – Page 20 – PROOF 4

Notes to the Financial Statements for the year ended 31 December 2005
MARSHALLS LIMITED ANNUAL REPORT 200521
Group Company
Restated
2005 2004 2005 2004
R R R R
5. AVAILABLE FOR SALE ASSETS
Property 6 729 000 – – –
The group acquired a commercial office building and
simultaneously initiated the creation of a sectional title
register. Agreements of sale have been signed to dispose
of sections 1, 2 and 4. Transfer of ownership took place in
March 2006.
6. STATED CAPITAL AND SHARE CAPITAL
Authorised
34 000 000 ordinary shares of no par value – – – –
14 000 000 ordinary shares of R1,00 each – 14 000 000 – 14 000 000
20 000 000 “N” ordinary shares of 1,0 cent each – 200 000 – 200 000
– 14 200 000 – 14 200 000
Issued
17 372 300 ordinary shares of no par value 26 809 026 – 26 809 026 –
11 445 230 ordinary shares of R1,00 each – 11 445 230 – 11 445 230
5 927 070 “N” ordinary shares of 1,0 cent each – 59 271 – 59 271
26 809 026 11 504 501 26 809 026 11 504 501
Unissued ordinary shares are under the control of the
directors in terms of a resolution passed at the annual
general meeting held on 28 June 2005. This authority
expires at the forthcoming annual general meeting.
Effective from 9 May 2005, the company’s two classes of
ordinary par value shares were consolidated into one class
of ordinary shares of no par value.
7. SHARE PREMIUM
Arising on the issue of ordinary and “N” ordinary shares in
exchange for shares in Marshalls Internal Limited. – 15 304 525 – 15 304 525
Effective from 9 May 2005, the share premium account
was transferred to the stated capital account.
8. NON-DISTRIBUTABLE RESERVES
Surplus on revaluation, sale of investment properties and
investments and on acquisition of shares in subsidiary 35 278 354 27 945 122 – –
Foreign currency translation reserve 1 504 704 927 269 – –
36 783 058 28 872 391 – –
T3IB00019 Marshalls AR – 17 May 2006 – Sharrell – Page 21 – PROOF 4

Group Company
Restated
2005 2004 2005 2004
R R R R
9. INTEREST BEARING BORROWINGS
Secured loans
9.1 Nedbank Limited 4 679 139 5 067 708 – –
The loan bears interest, payable monthly at a fixed
rate per annum, the year end rate being 11.45%
(2004: 10%). The loan is repayable in monthly
instalments of R76 421 (2004: R72 865) and is
repayable in full by 31 March 2013. This loan is
secured over freehold property valued at R9 100 000
(2004: R12 250 000), as detailed in note 1.
This loan is repayable in full or part thereof at any
time at the option of the borrower.
9.2 FirstRand Bank Limited 1 091 155 1 314 882 – –
This loan bears interest at variable rates per annum,
the year end rate being 9.5% (2004: 10%). The loan
is repayable in monthly instalments of R28 834
(2004: R28 683) and is repayable in full by 1 October
2009. This loan is secured over freehold property
valued at R5 300 000 (2004: R4 230 000), as detailed
in note 1.
This loan is repayable in full, or part thereof, subject
to three months written notice, at the option of the
borrower.
9.3 FirstRand Bank Limited 3 021 254 – – –
This loan bears interest, payable monthly at variable
rates per annum, the year end rate being 9.7%
(2004: nil). The loan is repayable in monthly
instalments of R39 817 (2004: nil) and repayable in
full by 30 October 2015. This loan is secured over
freehold property valued at R5 900 000 (2004: nil), as
detailed in note 1.
This loan is repayable in full, or part thereof, at any
time after the first thirty-six months of the term of the
loan having elapsed.
Notes to the Financial Statements for the year ended 31 December 2005
22 MARSHALLS LIMITED
T3IB00019 Marshalls AR – 17 May 2006 – Sharrell – Page 22 – PROOF 4
Notes to the Financial Statements for the year ended 31 December 2005
MARSHALLS LIMITED ANNUAL REPORT 200523
Group Company
Restated
2005 2004 2005 2004
R R R R
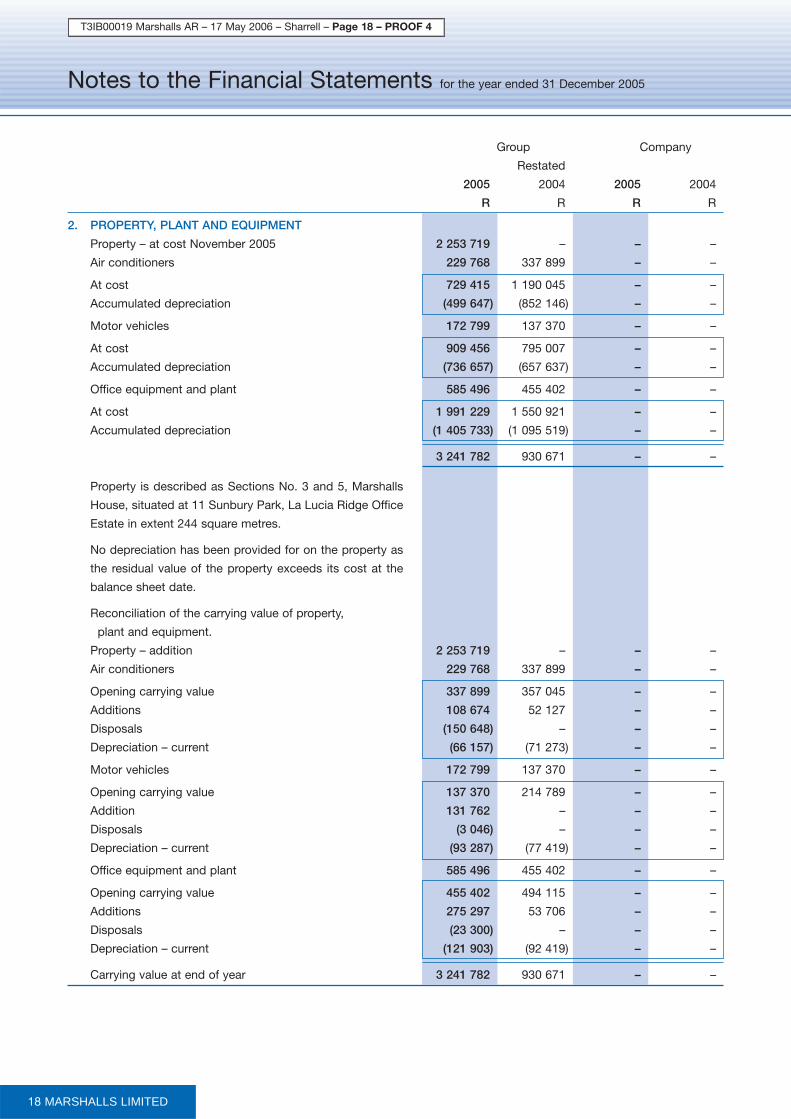
9. INTEREST BEARING BORROWINGS (continued)
9.4 FirstRand Bank Limited 68 635 – – –
This loan bears interest, payable monthly at
variable rates per annum, the year end rate being
9.7% (2004: nil). The registered loan amount is
R5 500 000, which has not been drawn down. The
loan is currently repayable in monthly instalments of
R895 (2004: nil) and is repayable in full by
1 December 2015. This loan is secured over freehold
property valued at R8 800 000 (2004: nil), as detailed
in note 1.
This loan is repayable in full, or part thereof, at any
time after the first thirty-six months of the term of the
loan having elapsed.
9.5 FirstRand Bank Limited 741 275 – – –
Interest rate swap derivative agreements entered
into are at fixed rates of 11.45%, 11.45% and
11.40% per annum until 30 October 2015,
1 February 2016 and 4 December 2020 respectively.
These agreements have been fair valued and
marked to market at the reporting date.
9.6 Investec Bank Limited 9 797 024 9 796 977 – –
The loan bears interest at a fixed rate of 16.35%
(2004: 16.35%) per annum and interest is repayable
in bi-annual instalments of R828 688 (2004:
R828 688). The capital is repayable in full on
1 November 2010. This loan is secured over freehold
property valued at R17 600 000 (2004: R15 400 000),
as detailed in note 1.
The company has ceded all rentals under lease
agreements concluded in respect of the mortgaged
property to Investec Bank Limited. As detailed in
note 4, the group’s listed investments have been
pledged in favour of Investec Bank Limited.
19 398 482 16 179 567 – –
Amounts repayable within the next twelve months
included in current liabilities (809 745) (590 970) – –
18 588 737 15 588 597 – –
T3IB00019 Marshalls AR – 17 May 2006 – Sharrell – Page 23 – PROOF 4

Group Company
Restated
2005 2004 2005 2004
R R R R
10. DEFERRED TAXATION
Unrealised surplus on revaluation of investment properties 1 276 193 205 689 – –
Amortised lease receivables 216 221 245 491 – –
Provisions (121 889) (207 160) – –
Unrealised net capital losses on revaluation of listed
investments (45 070) (420 127) – –
Interest rate swap derivative agreements (214 970) – – –
Other sundry temporary differences 304 378 337 751 – –
1 414 863 161 644 – –
Balance at beginning of year 161 644 (648 142) – –
– As previously reported 38 906 4 742 555 – –
– Lease smoothing effect 122 738 115 097 – –
– Effect of change in accounting policy – (5 505 794) – –
Movement relating to unrealised surplus on revaluation
of investment property 1 070 504 559 020 – –
Movement relating to provisions 85 271 90 518 – –
Movement relating to other sundry temporary differences (33 373) 52 151 – –
Movement relating to amortised lease receivables (29 270) 15 300 – –
Movement relating to interest rate swap derivative
agreements (214 970) – – –
Assessed loss utilised – 29 859 – –
Movement relating to unrealised net capital losses on
revaluation of listed investments 375 057 62 938 – –
Balance at end of year 1 414 863 161 644 – –
11. PROVISIONS
Leave pay provision 374 885 568 801 – –
Reconciliation
Opening carrying value 568 801 992 260 – –
Additional provisions provided for 123 264 66 601 – –
Amounts utilised and transferred (317 180) (490 060) – –
Closing carrying value 374 885 568 801 – –
12. REVENUE
Rental and parking fees 16 766 785 17 236 668 – –
Confirming fees and interest 657 908 1 070 911 – –
Investment income 448 904 378 802 – –
17 873 597 18 686 381 – –
Projected future rental income in terms of non-cancellable
operating leases in place
Within 1 year 10 197 803 14 632 310 – –
In 1 to 5 years 10 609 403 18 517 394 – –
Notes to the Financial Statements for the year ended 31 December 2005
24 MARSHALLS LIMITED
T3IB00019 Marshalls AR – 17 May 2006 – Sharrell – Page 24 – PROOF 4

Notes to the Financial Statements for the year ended 31 December 2005
MARSHALLS LIMITED ANNUAL REPORT 200525
T3IB00019 Marshalls AR – 17 May 2006 – Sharrell – Page 25 – PROOF 4
Group Company
Restated
2005 2004 2005 2004
R R R R
13. OPERATING PROFIT BEFORE INTEREST
is stated after:
Income
Income from subsidiary – – 2 084 676 1 737 230
Dividends received 448 471 378 299 – –
Surplus on disposal of property, plant and equipment 37 454 – – –
Expenses
Auditors’ remuneration 260 380 224 556 – –
Audit fee – current year 260 380 178 056 – –
Fees for other services – 46 500 – –
Depreciation of property, plant and equipment 281 347 241 111 – –
Air conditioners 66 157 71 273 – –
Motor vehicles 93 287 77 419 – –
Office equipment and plant 121 903 92 419 – –
Loss on foreign exchange 26 840 36 458 – –
Loss on disposal of property, plant and equipment 174 027 – – –
Fees relating to valuation of properties 51 068 42 242 – –
Operating leases – offices and warehousing 351 529 380 844 – –
14. DIRECTORS’ EMOLUMENTS
Paid or credited by the holding company and its
subsidiaries during the year under review for:
Services as directors 123 000 114 000 – –
Managerial and other services 353 019 849 332 – –
476 019 963 332 – –
Directors’ emoluments were earned as follows:
Consulting Services as
Total Salaries Bonuses Benefits services directors
R R R R R R
DC Marshall – Executive 311 770 245 856 20 488 21 426 – 24 000
PN Lonsdale – Non-executive 35 400 2 400 – – – 33 000
BA Hose – Non-executive 95 849 – – – 62 849 33 000
ME Stewart – Non-executive 33 000 – – – – 33 000
476 019 248 256 20 488 21 426 62 849 123 000
Mr BA Hose performed certain advisory services relating to property acquisitions at an agreed market related
fee structure.
Group Company
Restated
2005 2004 2005 2004
R R R R
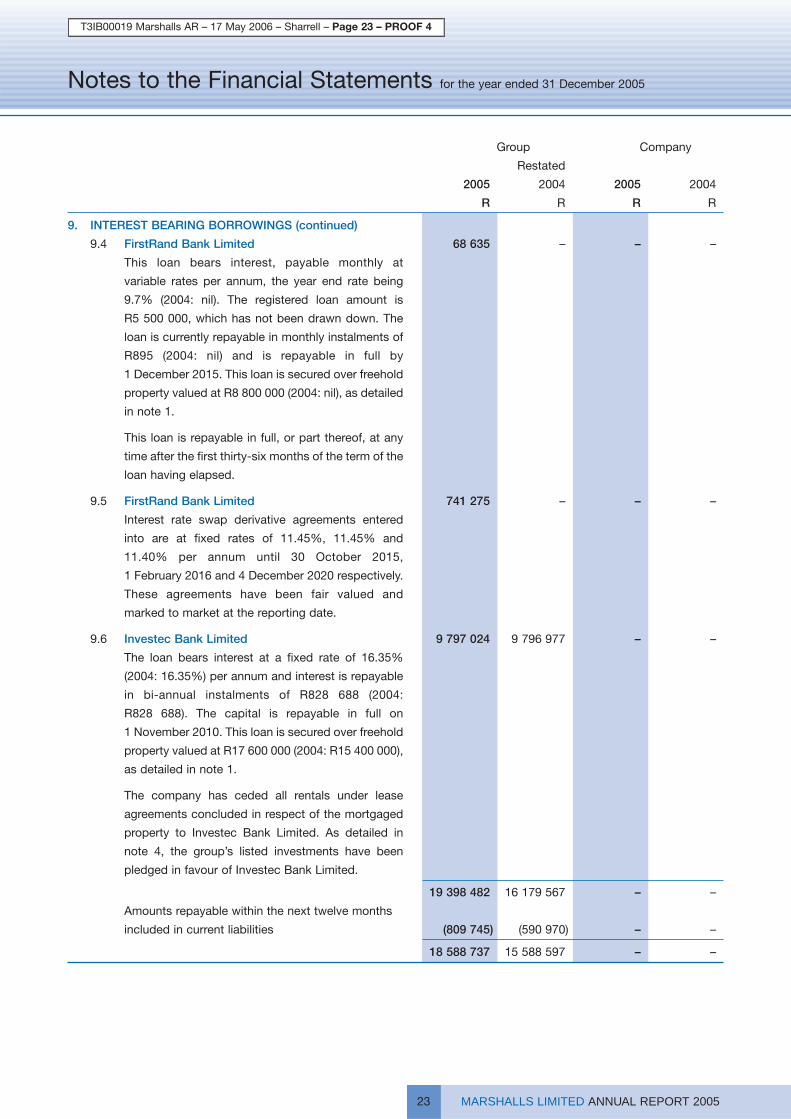
15. NON-OPERATING PROFIT/(LOSS) ITEMS
Unrealised surplus on revaluation of investment properties 8 835 505 6 319 278 – –
Realised net surplus on disposal of investment properties 1 617 019 – – –
Cost of capital restructure (234 408) – – –
Realised net surplus on disposal of listed investments 95 597 180 498 – –
Realised surplus on disposal of unlisted investments – 312 400 – –
10 313 713 6 812 176 – –
16. TAXATION
SA Normal tax 1 330 851 844 906 – –
– current 1 048 650 798 170 – –
– tax on capital gains 282 642 46 736 – –
– overprovision – prior year (441) – – –
Deferred tax 892 156 711 920 – –
– other temporary differences (187 993) 157 970 – –
– tax loss utilised – 29 859 – –
– listed investments – (34 934) – –
– revaluation of properties 1 081 446 559 025 – –
– effect of rate change (1 297) – – –
Secondary tax on companies 260 584 126 906 – –
– current 260 584 217 154 – –
– prior year overprovision – (90 248) – –
2 483 591 1 683 732 – –
Reconciliation of tax charge % % % %
Effective rate 19.1 16.8 – –
Standard rate 29.0 30.0 29.0 30.0
Adjusted for tax effects of:
Revaluation of investment property (19.7) (18.8) – –
Dividends received – – (29.0) (30.0)
Deferred tax on revaluation of properties above cost 8.3 5.4 – –
Secondary tax on companies 2.0 2.2 – –
Sundry reconciling items increasing the effective rate 3.6 0.7 – –
Sundry reconciling items decreasing the effective rate (4.1) (2.7) – –
19.1 16.8 – –
During the year the taxation rate applicable to the group/company decreased by 1% to 29%.
Notes to the Financial Statements for the year ended 31 December 2005
26 MARSHALLS LIMITED
T3IB00019 Marshalls AR – 17 May 2006 – Sharrell – Page 26 – PROOF 4

Notes to the Financial Statements for the year ended 31 December 2005
MARSHALLS LIMITED ANNUAL REPORT 200527
Group Company
Restated
2005 2004 2005 2004
R R R R
17. LEASE SMOOTHING EFFECT
This arose due to the application of the accepted
interpretation of IAS 17 (leases). This resulted in the
recognition of rental income on a straight line basis,
whereas it was previously recognised in terms of the cash
flows inherent in lease agreements. A corresponding lease
receivable has been recognised on the balance sheet
appropriately disclosed between non-current and current
assets.
Increase in revenue – 52 761 – –
Increase in taxation – (7 650) – –
Decrease in unrealised surplus on revaluation of investment
properties – (52 761) – –
Decrease in profit for the year – (7 650) – –
Decrease in equity at the beginning of 2004 – (115 106) – –
Total decrease in equity for 2004 – (122 756) – –
18. CHANGE IN ACCOUNTING POLICY
The company changed its policy for the deferred taxation
rate applicable to the revaluation of investment properties
during 2004. The effect of this change is that deferred
taxation that arises from the revaluation of investment
properties is measured based on the taxation
consequences that would follow from the disposal of the
investment property.
Effect on deferred taxation for the year resulting in decrease
in profit for the year – (582 751)
Effect on deferred taxation:
Increase in non-distributable reserves at beginning of year – 5 385 879
Increase in distributable reserves at beginning of year – 119 915
– 5 505 794
19. ORDINARY DIVIDENDS
Paid 2 084 676 1 737 230 2 084 676 1 737 230
T3IB00019 Marshalls AR – 17 May 2006 – Sharrell – Page 27 – PROOF 4

Group Company
Restated
2005 2004 2005 2004
R R R R
20. EARNINGS PER SHARE
The calculation of earnings per share is based on profit for
the year of R10 521 030 (2004: R8 361 228 restated) and
on the weighted average number of ordinary shares in
issue during the year of 17 372 300 (2004: 17 372 300). The
headline earnings per share are based on headline
earnings of R1 571 406 (2004: R2 217 223 restated) and on
the weighted average number of ordinary shares in issue
during the year of 17 372 300 (2004: 17 372 300).
Reconciliation between basic and headline earnings:
Basic earnings per income statement 10 521 030 8 361 228
Adjusted for:
Unrealised surplus on revaluation of investment property
after taxation (7 754 058) (5 697 842)
Realised surplus on disposal of unlisted investment after
taxation – (303 945)
Realised net surplus on disposal of listed investments
after taxation (81 102) (142 218)
Realised net surplus on disposal of investment properties
after taxation (1 348 872) –
Cost of capital restructure after taxation 234 408 –
Headline earnings for the year 1 571 406 2 217 223
21. COMMITMENTS AND CONTINGENCIES
A creditor of a former confirming client of the group, which
has been liquidated, has made an application to the High
Court to set aside the liquidation and distribution account
of the client. The effect of this will be to reflect the group as
a concurrent creditor and not as a secured creditor. The
directors are confident that this application will not
succeed. The matter was heard in the High Court during
February 2006. The Court’s decision is still pending.
Letters of credit and guarantees have been issued by the
group’s bankers to the extent of nil (2004: R1 932 971). The
company has stood surety for a subsidiary’s indebtedness
to Nedbank Limited to the extent of R4 679 139 (2004:
R5 067 708) and to Investec Bank Ltd. to the extent of
R10 000 000 (2004: R10 000 000)
Commitments in terms of non-cancellable operating leases
in place:
Payable within 1 year 304 210 992 303
Payable in 1 to 5 years 346 524 5 731 781
Notes to the Financial Statements for the year ended 31 December 2005
28 MARSHALLS LIMITED
T3IB00019 Marshalls AR – 17 May 2006 – Sharrell – Page 28 – PROOF 4

Notes to the Financial Statements for the year ended 31 December 2005
MARSHALLS LIMITED ANNUAL REPORT 200529
22. RETIREMENT BENEFIT INFORMATION
Certain subsidiary companies contribute to The Marshalls Group Pension Fund, a defined benefit plan. This fund is
registered under and governed by the Pensions Fund Act of 1956. Membership of the fund is compulsory and at
31 December 2005, 18 (2004: 24) employees with pensionable salaries totalling R1 737 096 (2004: R2 244 532) for the
year were members of the fund. Six members with pensionable salaries totalling R183 240 ceased being members
effective 1 October 2005. An amount of R604 153 was paid in respect of contributions to the defined benefit plan during
the period. The fund’s assets are held in investment portfolios of financial institutions. Full actuarial valuations are
performed every three years. A valuation was conducted on 1 January 2006. In arriving at its findings the actuary took
into account the attained age method of valuation, which allows for salary increases until retirement. The actuary’s
report indicated that the fund’s assets exceeded its liabilities. The trustees of the fund approved in principle during the
financial year the decision to convert the fund to a defined contribution fund. Any surplus will be distributed to the
members upon conversion. Application to the Financial Services Board for conversion of the fund will be made.
23. SEGMENT REPORT
Primary segment information: Business segments
Properties Division Confirming Division Investment Division Consolidated
Restated Restated Restated Restated
2005 2004 2005 2004 2005 2004 2005 2004
R R R R R R R R
Segment revenue 16 766 785 17 236 668 657 908 1 070 911 448 904 378 802 17 873 597 18 686 381
Segment result 8 967 418 8 869 329 439 003 902 613 236 520 146 330 9 642 941 9 918 272
Non-segment
expenses (4 130 535) (4 179 915)
Interest paid (3 110 693) (2 533 803)
Interest received 289 195 28 230
Non-operating
items 10 313 713 6 812 176
Profit before
taxation 13 004 621 10 044 960
Taxation 2 483 591 1 683 732
Profit for the year 10 521 030 8 361 228
Other
information
Segment assets 73 337 091 67 342 040 6 705 855 7 776 183 18 795 161 15 253 523 98 838 107 90 371 746
Non-segment
assets 10 605 399 414 948
Total assets 109 443 506 90 786 694
Segment liabilities (26 028 232) (27 165 674) (44 349) (15 842) (72 783) 8 007 007 (26 145 364) (19 174 509)
Non-segment
liabilities (273 904) (460 313)
Income tax
liabilities (339 895) (56 523)
Total liabilities (26 759 163) (19 691 345)
Capital expenditure 9 859 839 161 883 – – – – 9 859 839 161 883
Depreciation 183 005 140 064 2 938 3 162 – – 185 943 143 226
T3IB00019 Marshalls AR – 17 May 2006 – Sharrell – Page 29 – PROOF 4

23. SEGMENT REPORT (continued)
Secondary segment information: Geographic segments by location of assets
South Africa Europe
Restated Restated
2005 2004 2005 2004
R R R R
Segment revenue 16 869 160 17 886 085 1 004 437 800 296
Segment assets 74 010 565 70 234 294 24 827 542 20 137 452
Capital expenditure 9 859 839 161 883 – –
For management purposes, the group is organised into three major operating divisions – property, confirming and
investment. The divisions are the basis on which the group reports its primary segment information. The property
segment owns substantial rental income producing commercial and light industrial properties and a parking garage in
Durban and Cape Town. The confirming segment operates a confirming and indent financing operation, trading as
Marshalls Confirming. The investment segment owns shares in listed companies from which it receives investment
income.
Segment assets and liabilities: segment assets include all operating assets used by a segment and consist principally
of operating cash, trade receivables and property, plant and equipment. Segment liabilities include all operating
liabilities.
24. ACCOUNTING POLICIES
The accounting policies of the group are set out on page 6 of this report.
25. FINANCIAL RISK MANAGEMENT
Financial instruments carried on the balance sheet include cash and bank balances, investments, trade receivables and
payables and borrowings. These instruments are generally carried at their estimated fair value.
Credit risk
Financial assets, which potentially subject the group to concentrations of credit risk, consist principally of cash, short-
term deposits and receivables.
The group’s cash and short-term deposits are placed with high credit quality financial institutions. Receivables are
presented net of the allowance for doubtful receivables. Credit risk with respect to receivables is concentrated due to
the small number of customers comprising the group’s confirming division customer base.
The carrying amounts of financial assets included in the balance sheet represent the group’s exposure to credit risk in
relation to these assets.
Certain of the listed investments, see note 4, are encumbered by a pledge in favour of Investec Bank Limited.
All other financial assets are unencumbered. The group does not have any significant exposure to any individual
customer.
Interest rate risk
Interest-bearing borrowings of the group bear interest at rates detailed in Note 9. Interest rate risks are not hedged,
other than as disclosed in note 9.
Foreign currency risk
The effect of fluctuations in foreign exchange rates on the valuation of the share portfolio have not been hedged.
Notes to the Financial Statements for the year ended 31 December 2005
30 MARSHALLS LIMITED
T3IB00019 Marshalls AR – 17 May 2006 – Sharrell – Page 30 – PROOF 4

Notes to the Financial Statements for the year ended 31 December 2005
MARSHALLS LIMITED ANNUAL REPORT 200531
26. RELATED PARTIES
Marshalls Limited is a related party to the following companies:
Marshalls Internal Limited subsidiary
Marshalls Group Limited subsidiary
Marshall Metallic Holdings Limited subsidiary
Marshalls Confirming (Jersey) Limited subsidiary
Marshalls Parking (Proprietary) Limited subsidiary
Monteagle Property Holdings Limited
Monteagle Consumer Group Limited
Monteagle Africa Limited
Certain of the directors of Marshalls Limited are also directors of some of the abovementioned related parties.
The group rents a storage facility from Monteagle Property Holdings Limited. Total rent billed for the year amounted to
R36 334 (2004: R32 577).
Certain sectional title units (namely 1 and 4) were disposed of to related parties (refer to note 5):
– Monteagle Consumer Group Limited R2 464 000
– Monteagle Africa Limited R2 085 000
T3IB00019 Marshalls AR – 17 May 2006 – Sharrell – Page 31 – PROOF 4
Restated
Notes 2005 2004
R R
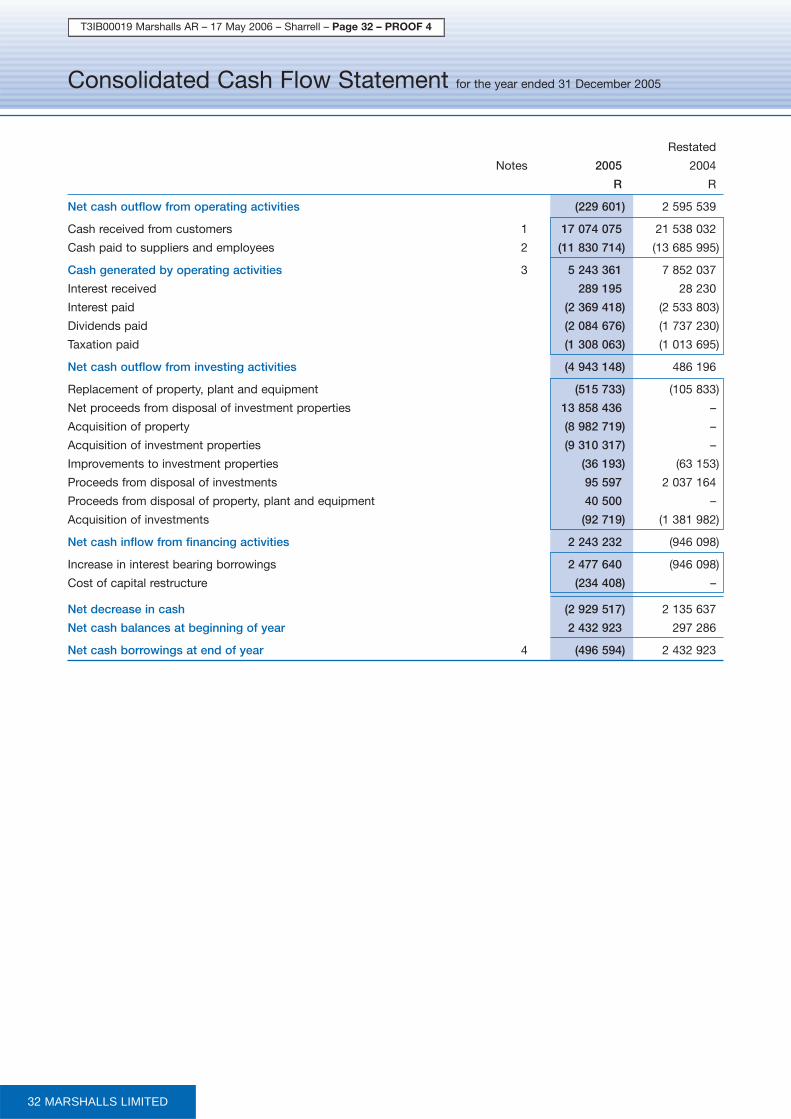
Net cash outflow from operating activities (229 601) 2 595 539
Cash received from customers 1 17 074 075 21 538 032
Cash paid to suppliers and employees 2 (11 830 714) (13 685 995)
Cash generated by operating activities 3 5 243 361 7 852 037
Interest received 289 195 28 230
Interest paid (2 369 418) (2 533 803)
Dividends paid (2 084 676) (1 737 230)
Taxation paid (1 308 063) (1 013 695)
Net cash outflow from investing activities (4 943 148) 486 196
Replacement of property, plant and equipment (515 733) (105 833)
Net proceeds from disposal of investment properties 13 858 436 –
Acquisition of property (8 982 719) –
Acquisition of investment properties (9 310 317) –
Improvements to investment properties (36 193) (63 153)
Proceeds from disposal of investments 95 597 2 037 164
Proceeds from disposal of property, plant and equipment 40 500 –
Acquisition of investments (92 719) (1 381 982)
Net cash inflow from financing activities 2 243 232 (946 098)
Increase in interest bearing borrowings 2 477 640 (946 098)
Cost of capital restructure (234 408) –
Net decrease in cash (2 929 517) 2 135 637
Net cash balances at beginning of year 2 432 923 297 286
Net cash borrowings at end of year 4 (496 594) 2 432 923
Consolidated Cash Flow Statement for the year ended 31 December 2005
32 MARSHALLS LIMITED
T3IB00019 Marshalls AR – 17 May 2006 – Sharrell – Page 32 – PROOF 4

Notes to the Consolidated Cash Flow Statement for the year ended 31 December 2005
MARSHALLS LIMITED ANNUAL REPORT 200533
Restated
2005 2004
R R
1. Cash received from customers
Revenue 17 873 597 18 686 381
Lease smoothing effect 100 923 (52 761)
Movement in trade receivables (900 445) 2 904 412
17 074 075 21 538 032
2. Cash paid to suppliers and employees
Revenue 17 873 597 18 686 381
Operating profit before interest (5 512 406) (5 738 357)
12 361 191 12 948 024
Provision for doubtful debts 101 752 (162 310)
Loss on disposal of property, plant and equipment (174 027) –
Surplus on disposal of property, plant and equipment 37 454 –
Depreciation (281 347) (241 111)
Movement in foreign currency translation reserve (577 435) 827 562
Movement in trade payables 363 126 313 830
11 830 714 13 685 995
3. Cash generated by operating activities
Operating profit before interest 5 512 406 5 738 357
Adjusted for:
Provision for doubtful debts (101 752) 162 310
Loss on disposal of property, plant and equipment 174 027 –
Surplus on disposal of property, plant and equipment (37 454) –
Lease smoothing effect 100 923 (52 761)
Depreciation 281 347 241 111
Movement in foreign currency translation reserve 577 435 (827 562)
Working capital changes (1 263 571) 2 590 582
Increase in trade receivables (900 445) 2 904 412
Decrease in trade payables (363 126) (313 830)
5 243 361 7 852 037
4. Net cash borrowings
Bank and cash balances 3 247 893 3 502 010
Bank overdrafts (3 744 487) (1 069 087)
(496 594) 2 432 923
T3IB00019 Marshalls AR – 17 May 2006 – Sharrell – Page 33 – PROOF 4

2005 2004
R R
Net cash inflow from operating activities 60 455 (1 605)
Cash generated by operating activities 60 382 (1 720)
Dividends received 2 084 749 1 737 345
Dividends paid (2 084 676) (1 737 230)
Net cash Inflow from investing activities
Decrease in loan receivable from subsidiary 5 443 4 005
Net increase in cash 65 898 2 400
Cash at beginning of year 2 400 –
Cash at end of year 68 298 2 400
Cash Flow Statement for the year ended 31 December 2005
34 MARSHALLS LIMITED
T3IB00019 Marshalls AR – 17 May 2006 – Sharrell – Page 34 – PROOF 4
Report of the Independent Auditors to the Members of Marshalls Limited
MARSHALLS LIMITED ANNUAL REPORT 200535
We have audited the annual financial statements and group annual financial statements of Marshalls Limited, set out on
pages 6 to 34, for the year ended 31 December 2005. These financial statements are the responsibility of the company’s
directors. Our responsibility is to express an opinion on these financial statements based on our audit.
ScopeWe conducted our audit in accordance with International Standards of Auditing. Those standards require that we plan and
perform the audit to obtain reasonable assurance that the financial statements are free of material misstatement. An audit
includes:
* examining, on a test basis, evidence supporting the amounts and disclosures in the financial statements;
* assessing the accounting principles used and significant estimates made by management, and
* evaluating the overall financial statement presentation.
We believe that our audit provides a reasonable basis for our opinion.
Audit opinionIn our opinion, the financial statements fairly present, in all material respects, the financial position of the company and the
group at 31 December 2005 and the results of their operations and cash flows for the year then ended in accordance with
International Financial Reporting Standards, and in the manner required by the Companies Act.
Registered Accountants and Auditors
19th Floor, 320 West Street, Durban 4001
South Africa
Durban
7 April 2006
T3IB00019 Marshalls AR – 17 May 2006 – Sharrell – Page 35 – PROOF 4

Marshalls Limited(Reg No. 1987/002656/06)
NOTICE IS HEREBY GIVEN that the Nineteenth Annual General Meeting will be held in the Boardroom, 11 Sunbury Park,
La Lucia Ridge Office Estate, La Lucia, Durban, 4319 at 09:00 on 20 June 2006 for the transaction of the following business:
1. To receive and adopt the annual financial statements at 31 December 2005.
2. To appoint the following directors who retire by rotation in terms of the company’s articles of association and who, being
eligible, offer themselves for re-election:
2.1 PN Lonsdale (73)
Non-executive director
Date of appointment: 17 June 1987
Professional qualifications: FCIS
2.2 BA Hose (68)
Non-executive director
Date of appointment: 1 December 2001
Professional qualifications: FRICS, FIV (SA)
3. To fix the remuneration of the auditors for the past audit.
4. To place the unissued ordinary shares of the company under the control of the directors.
A member entitled to attend and vote at a meeting of the company is entitled to appoint a proxy to attend and speak and,
on a poll, to vote thereat in his stead. A proxy need not also be a member of the company.
In order to be effective, the form of proxy must be deposited at 11 Sunbury Park, La Lucia Ridge Office Estate, La Lucia,
Durban, 4319 not less than FORTY-EIGHT (48) HOURS before the time appointed for the holding of the meeting.
By order of the board
AM AHMEDSecretary
La Lucia, Durban
6 April 2006
Notice of Meeting
36 MARSHALLS LIMITED
T3IB00019 Marshalls AR – 17 May 2006 – Sharrell – Page 36 – PROOF 4
Designed by
PRINTED BY INCE (PTY) LTD

Form of Proxy
MARSHALLS LIMITED ANNUAL REPORT 2005
Marshalls Limited(Reg No. 1987/002656/06)
I/We
of
being a member/members of Marshalls Limited hereby appoint
of
or, failing him, the chairman of the meeting as my/our proxy to vote for me/us and on my/our behalf at the annual general
meeting of the company to be held on 20 June 2006 and at every adjournment thereof.
Signed this day of 2006
Signature
Please indicate by an “X” in the appropriate spaces below how you wish your votes to be cast in respect of the resolutions
to be proposed at the meeting. Unless otherwise instructed, my/our proxy is authorised to vote as he thinks fit.
Resolution (1) For Against Abstain
Resolution (2) For Against Abstain
Resolution (3) For Against Abstain
Resolution (4) For Against Abstain
Notes:
(1) Any member entitled to attend and vote at the meeting is entitled to appoint a proxy to attend, speak and, on a poll,
vote in his stead, and a person so appointed need not be a member of the company.
(2) If this proxy is signed under power of attorney or on behalf of a company, such power of attorney, unless previously
registered with the company, must accompany it, failing which, the proxy cannot be used at the meeting.
(3) In order to be effective, the form of proxy must be deposited at 11 Sunbury Park, La Lucia Ridge Office Estate, La Lucia,
4319 not less than 48 hours before the time appointed for the holding of the meeting.
T3IB00019 Marshalls AR – 17 May 2006 – Sharrell – Page 37 – PROOF 4