Rapporto Germanwatch
13
The Climate Change Performance Index Results 2013 CLIMATE CHANGE PERFORMANCE index 2013 index
-
Upload
legambiente-onlus -
Category
Documents
-
view
224 -
download
0
description
La performance climatica dei principali paesi del Pianeta.
Transcript of Rapporto Germanwatch
T h e C l i m a t e C h a n g e P e r f o r m a n c e I n d e x
Results 2013
CLIMATE CHANGE
PERFORMANCE
index2013
index
jan
Textfeld
Embargoed until December 3rd, 2012, 10:30 AM (Local Doha Time)
32
Authors: Jan Burck, Lukas Hermwille, Laura Krings
Editing: Daniela Baum, Alex Eden, Gerold Kier
Design: Dietmar Putscher, Colognewww.dietmar-putscher.de
Printed on 100% recycled paper
November 2012
Purchase Order Number: 13-2-02e
ISBN 978-3-943704-06-8
This publication can be downloaded at:www.germanwatch.org/en/ccpi
With financial support from the European Union and the Barthel Foundation
Germanwatch
Germanwatch - Bonn Office Kaiserstraße 20153113 Bonn, GermanyPh.: +49 (0) 228 - 60492-0Fax: +49 (0) 228 - 60492-19
Germanwatch - Berlin Office Schiffbauerdamm 1510117 Berlin, GermanyPh.: +49 (0) 30 - 28 88 356-0Fax: +49 (0) 30 - 28 88 356-1
E-Mail: [email protected]
CAN
Climate Action Network Europe Rue d‘Edimbourg 261050 BrusselsBelgium
Ph.: +32 (0) 28 94 46 70 E-Mail: [email protected]
Foreword
Dear Reader,
Our world is characterized by fast moving geopoliti-cal and natural changes and the scenarios drawn by climate change specialists are alarming: If we want to avoid dangerous climate change, and its ample consequences for creatures all over the world, it is necessary to take action right now. The awareness of the danger is growing and the Climate Change Performance Index (CCPI) keeps on working to bring it forward. Since 2005, the CCPI has been contribut-ing to a clearer understanding of national and inter-national climate policy. The various initial positions, interests and strategies of the numerous countries make it hard to distinguish their strengths and weak-nesses. The CCPI is an important tool for that.
To demonstrate existing measures more accurately and to encourage steps towards effective climate policy, the CCPI methodology has this year been evaluated and improvements have been made. The integration of data on emissions from deforestation was one of the major steps in this process, made pos-
Contents
Foreword 3
1. Key Results 4
2. About the CCPI 5
3. Overall Results 3.1 Climate Change Performance Index 2013 6 3.2 CCPI World Map 8
4. Partial Results 4.1 Emissions Level 10 4.2 Development of Emissions 12 4.3 Renewable Energies 14 4.4 Efficiency 16 4.5 Climate Policy 18
5. Country Example 20
6. Climate Change Performance Index by Country Group 22
7. Sources and Further Reading Recommendations 23
Klaus Milke(Chairman of the Board, Germanwatch)
Wendel Trio(Director of CAN-Europe)
sible due to the arrival of the new FAO Global Forest Resource Assessment 2010. Alongside energy-based emissions, deforestation is another important source of anthropogenic CO2. By including emissions from deforestation, we can now present a more complete view of man-made impacts on the world‘s climate.
The following publication is issued by Germanwatch and Climate Action Network Europe. However, only with the help of over 230 energy and climate ex-perts from all over the world, we are able to include a review of each country‘s national and international policies, with respect to their efforts to avoid climate change. We greatly appreciate these experts, for taking the time and effort to contribute with their knowledge. Experts are representatives of NGOs working within their respective countries, fighting for the implementation of the climate policy that we desperately need.
Best regards,
CLIMATE CHANGE PERFORMANCE
index2013
54
1. Key Results
1 Data used in the CCPI includes only CO2 emissions from living biomass. Emissions from soils and deadwood are not accounted for. Furthermore, the data from the FAO Global Forest Resources Assessment is only updated every 5 years.
2 Regarding the emissions trends, the CCPI 2013 compares the time period between 2005 and 2010. For the emissions level, data from the last three years with available data (2008 to 2010) is taken into account.
3 www.germanwatch.org/en/ccpi4 PWC: Counting the cost of carbon: Low carbon economy index 2011, www.pwc.com/gx/en/low-carbon-economy-index
2. About the CCPI
The Climate Change Performance Index is an instrument designed to enhance transparency in international cli-mate politics. Its aim is to put political and social pres-sure on those countries which have, up until now, failed to take ambitious action on climate protection. It also aims to highlight those countries with best-practice cli-mate policies.
On the basis of standardised criteria, the index evalu-ates and compares the climate protection performance of 58 countries that are, together, responsible for more than 90 percent of global energy-related CO2 emis-sions. After 7 years of publication, the CCPI has, this year, been thoroughly evaluated. This evaluation has had two major outcomes. Now, for the first time, it has been possible to include emissions from deforestation, albeit not at the same quality of data as energy-related emissions.1 The second achievement is a new structure and weighting of the individual indicators with a much stronger focus on renewable energy and efficiency as the most prominent mitigation strategies.
The revised methodology is still primarily centred around objective indicators. Thereby, 80% of the evaluation is based on indicators of emissions (30% for emissions levels and 30% for recent development of emissions), efficiency (5% level of efficiency and 5% recent development in efficiency) and renewable en-ergy (8% recent development and 2% share of total primary energy supply).2 The remaining 20% of the CCPI evaluation is based on national and international climate policy assessments by more than 230 experts
from the respective countries. An example of the meth-odology of the CCPI can be found under section 5 “Country Comparison” and extensive explanations are available in “The Climate Change Performance Index: Background and Methodology”.3
The average scores for national and international pol-icies are weak. Most experts are not satisfied by far with the efforts of their governments with regard to the 2 °C limit.
The CCPI ranking is qualified in relative terms (bet-ter – worse) rather than absolute terms (good – bad). Therefore, even those countries with high rankings have no reason to sit back and relax. On the contrary, the re-sults illustrate that even if all countries were as involved as the current front runners, efforts would still be insuf-ficient to prevent dangerous climate change.
Hence, again this year, no country was awarded the rank of 1st, 2nd or 3rd. The poor performance of the majority of the ten largest CO2 emitters (Table 2) is particularly alarming. These countries account for more than 60 per-cent of global CO2 emissions. Therefore, their willing-ness and ability to pursue sustainable climate policy is prerequisite in avoiding highly dangerous levels of climate change. However, the latest emissions trend data shows that not one of these countries has started sufficiently decoupling growth in CO2 emissions from GDP growth.4
This year‘s Climate Change Performance Index (CCPI) shows some interesting and worrying results:
■In 2010, the most recent data period for this year‘s CCPI, the world saw another record breaking in-crease in global CO2 emissions. Not only have global emissions risen to another all time high, but this in-crease has also been the steepest emissions surge in history.
■Not only are emissions rising at the global level. As well at the national level is little good news to tell. Not one of the examined countries has managed to change to a development path that is compatible with limiting global warming substantially below 2 °C. No country‘s effort is deemed sufficient to prevent dangerous climate change. Therefore, as in the years before, we still cannot award any country with 1st, 2nd or 3rd place.
■The new inclusion of data on emissions from defor-estation has a substantial effect on the rankings. Countries like Brazil and Indonesia, which make up a large share of global emissions from deforestation, rank somewhat lower than in the earlier versions of the CCPI. However, the recent global development remains dominated by the increase in fossil fuel con-sumption.
■Brazil used to be among the highest scoring countries in earlier editions of the CCPI. The reason for Brazil’s dramatic drop is not only the inclusion of emissions from deforestation. Alongside a drop in the ’emis-sions indicator’, Brazil scores substantially lower in the national policy evaluation.
■Denmark is this year’s best performer and ranks 4th behind the top three empty positions. Their success is based on a positive development in recent emis-sions and an exceptionally good policy evaluation. A spot of bother remains. In the recent development of energy efficiency Denmark has lost ground on its competitors.
■Sweden, the leader in last year‘s index, ranks 5th in this year‘s CCPI edition. Still being the most efficient of the investigated countries, the recent develop-ment of emissions has not been as promising as in earlier years.
■Quite a surprise is the promotion of Portugal to the 6th rank. As a result of the global economic crisis, countries like Portugal, Spain, Italy, Ireland and Greece have substantially lowered their emissions in recent years. In contrast to its competitors, Portugal has managed to keep up with its climate policy and therefore deserves its place among the leading coun-tries.
■Italy substantially improves its performance. Not only a decrease in emissions, but also a substan-tially better policy review in comparison with the old Berlusconi government, are the main reasons for Italy‘s improved position.
■Germany has lost some ground in this year’s edi-tion. German policy experts fear that the German ‘Energiewende’, the transition of the German en-ergy supply to renewable energies, is starting to lag. However, the development of renewable ener-gies is still promising, even more so than expected a few years ago. In the field of efficiency, however, Germany performs only around average and certainly far below its potential.
■One of the biggest winners of this year‘s CCPI is the USA. Starting from a poor emissions level, USA has shown a substantial decrease in emissions, both in relative and absolute terms. Two main drivers are accountable. Firstly, the economic crisis of 2008 and the following years made an important im-pact. Secondly, the United States has seen a major fuel shift from coal to unconventional gas sources. However, the climate effect of so-called ‘shale gas’ is not sufficiently reflected in the underlying data set of the IEA. Only direct CO2 emissions from the combustion of shale gas are accounted for. Emissions from the process of conveyance at the borehole are ignored. The scoring of the United States should, therefore, be interpreted with caution.
■China ranks 54th, achieving a small improvement compared to last year. Although their emissions level continues to worsen, some hints of positive devel-opment can be observed. In the last year of its 11th 5-year plan, the People‘s Republic of China has man-aged to improve its efficiency scoring. Both CO2 per Primary Energy and Primary Energy per GDP unit de-creased slightly. The heavy investment in renewable energies in recent years is, however, not yet reflect-ed in the data.
■India drops six places compared to last year. This is mainly due to increased emissions. The emissions lev-el of India is still relatively low and the policy rating shows relatively good results.
■For the second year in a row the Netherlands drop dra-matically in the ranking. However, the Netherlands recently had a change of government. Dutch experts reviewed the climate policy of the old government only and express their hopes that the new govern-ment can change this disappointing trend next year.
■Norway has, after Iceland, the 2nd highest share of renewable energies of total primary energy supply. Almost all of its electricity is produced from renew-able energy sources. Despite that, Norway has dra-matically increased its electricity and heat produc-tion from natural gas. The consequence is the 54th rank in the emissions development sub-category. Due to this, and a worsened policy rating, Norway has dropped 11 places and is now ranked 28th.
■In the policy category Australia has gradually im-proved and now ranks in the top ten. The decision to implement an emissions trading scheme and a posi-tive attitude towards accepting a second commit-ment period of the Kyoto Protocol are highlighted by Australian policy experts.
■Canada still shows no intentions to move forward on climate policy and thereby leave its place as the worst performer of all western countries.
■The bottom three countries are Saudi Arabia, Iran and Kazakhstan. All of them are highly dependent on their oil and gas exports. The distance in terms of scores to the better performing countries remains large and was constant over the previous years. The only gleam of hope is Saudi Arabia’s announcement to present a strategy to invest in renewable ener-gies. This positive development is recognized by the CCPI, so that Saudi Arabia for the first time leaves last place in the policy category.
■An inclusion of Qatar, this year’s host of the COP, into the CCPI was not possible due to methodologi-cal problems. Qatar features the world‘s highest per-capita emissions. Qatar’s performance in the emis-sions category is even worse than Saudi Arabia’s. An inclusion would have distorted the ranking of all other countries.
■The European Union presents a mixed picture. While the top ten of the CCPI ranking is dominated by European countries, other countries such as the Netherlands and Poland perform considerably below average. Considering that the current EU emission target for 2020 is extremely unambitious, the top-ranking position of EU countries will be at risk during the next few years. Some countries have also ’ben-efited’ from economic crises – which is not the kind of climate policy we want to see.
■All in all, the development of renewable energies is promising. Not only Germany but also China and the United States have invested heavily in wind and solar energy over the last few years. As the latest available data on renewable energy production is from 2010, most of these investments are not yet reflected in the CCPI. On the other hand, uncertainty about the future development of renewable energy is even higher than last year.
76
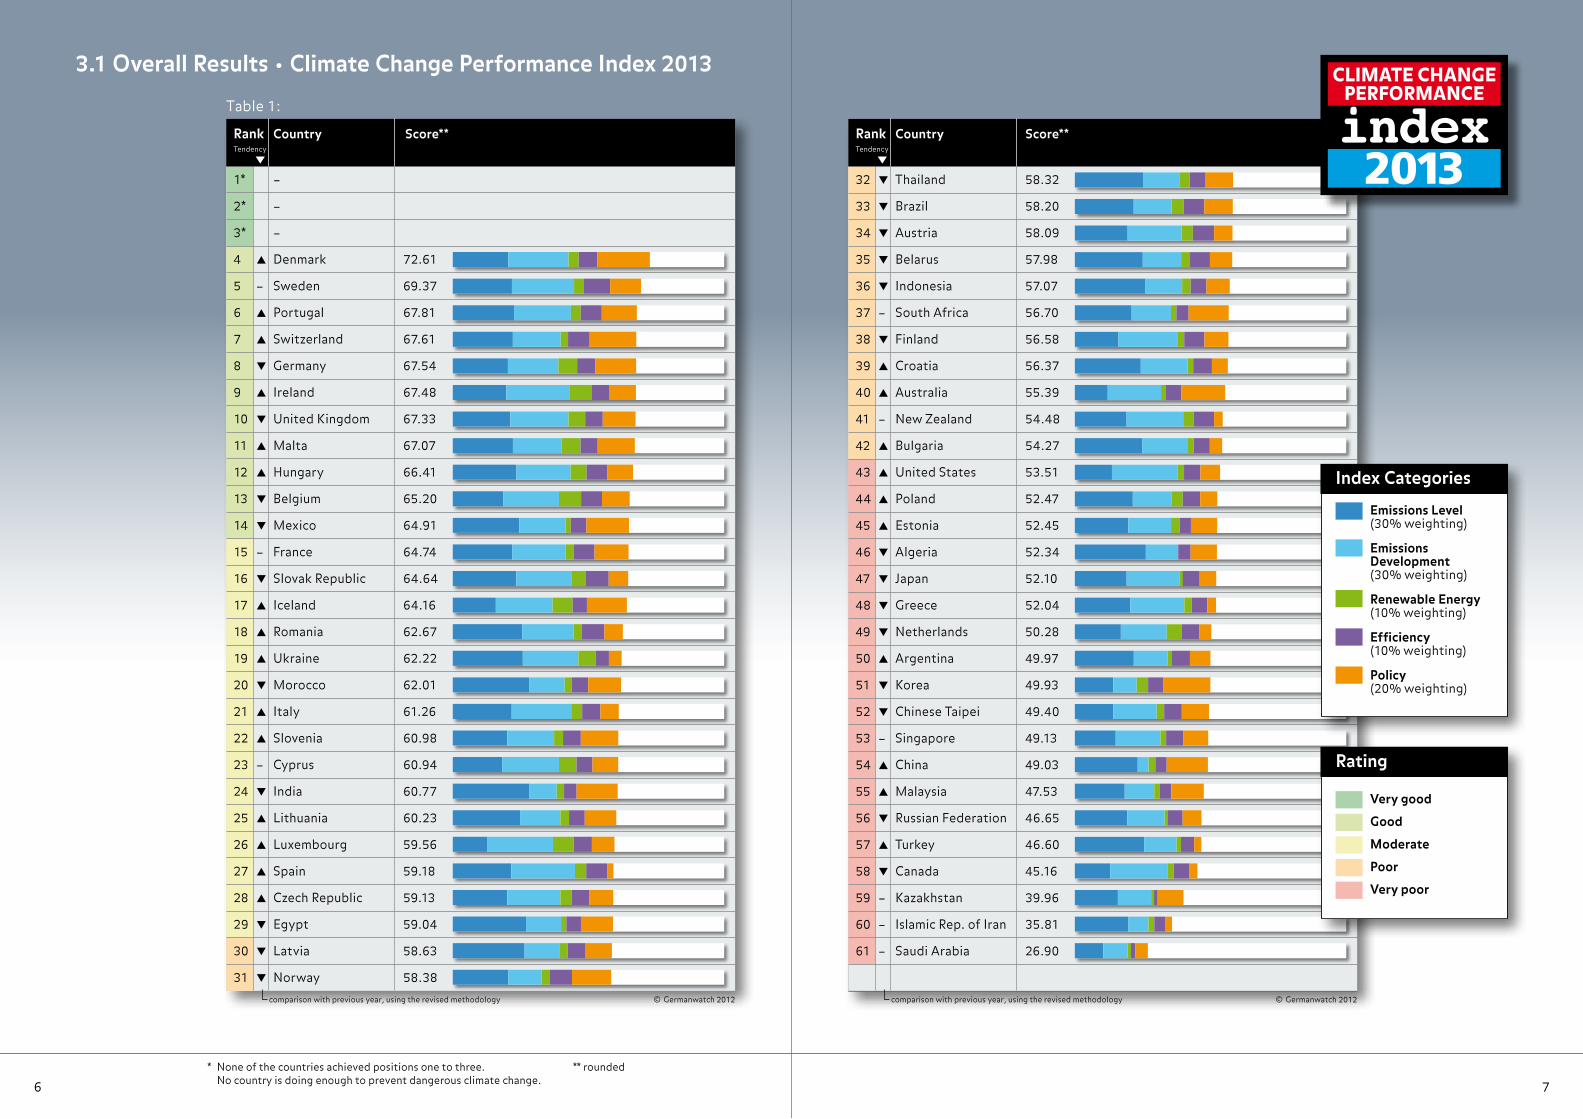
3.1 Overall Results • Climate Change Performance Index 2013
Table 1:
* None of the countries achieved positions one to three. No country is doing enough to prevent dangerous climate change.
** rounded
1* –
2* –
3* –
4 ▲ Denmark 72.61
5 – Sweden 69.37
6Portugal 67.81
7 ▲ Switzerland 67.61
8 Germany 67.54
9 ▲ Ireland 67.48
10 United Kingdom 67.33
11 ▲ Malta 67.07
12 ▲ Hungary 66.41
13 Belgium 65.20
14 Mexico 64.91
15 – France 64.74
16 Slovak Republic 64.64
17 Iceland 64.16
18 Romania 62.67
19 Ukraine 62.22
20 Morocco 62.01
21 Italy 61.26
22 Slovenia 60.98
23 – Cyprus 60.94
24 India 60.77
25 Lithuania 60.23
26 Luxembourg 59.56
27 Spain 59.18
28 Czech Republic 59.13
29 Egypt 59.04
30 Latvia 58.63
31 Norway 58.38
© Germanwatch 2012comparison with previous year, using the revised methodology comparison with previous year, using the revised methodology
32 Thailand 58.32
33 Brazil 58.20
34 Austria 58.09
35 Belarus 57.98
36 Indonesia 57.07
37 – South Africa 56.70
38 Finland 56.58
39 ▲ Croatia 56.37
40 Australia 55.39
41 – New Zealand 54.48
42 Bulgaria 54.27
43 United States 53.51
44 Poland 52.47
45 Estonia 52.45
46 Algeria 52.34
47 Japan 52.10
48 Greece 52.04
49 Netherlands 50.28
50 Argentina 49.97
51 Korea 49.93
52 Chinese Taipei 49.40
53 – Singapore 49.13
54 China 49.03
55 Malaysia 47.53
56 Russian Federation 46.65
57 Turkey 46.60
58 Canada 45.16
59 – Kazakhstan 39.96
60 – Islamic Rep. of Iran 35.81
61 – Saudi Arabia 26.90
© Germanwatch 2012
Rank Country Score** Tendency
Rank Country Score** Tendency
Index Categories
Emissions Level (30% weighting)
Emissions Development (30% weighting)
Renewable Energy (10% weighting)
Efficiency (10% weighting)
Policy (20% weighting)
Rating
Very good
Good
Moderate
Poor
Very poor
CLIMATE CHANGE PERFORMANCE
index2013
98
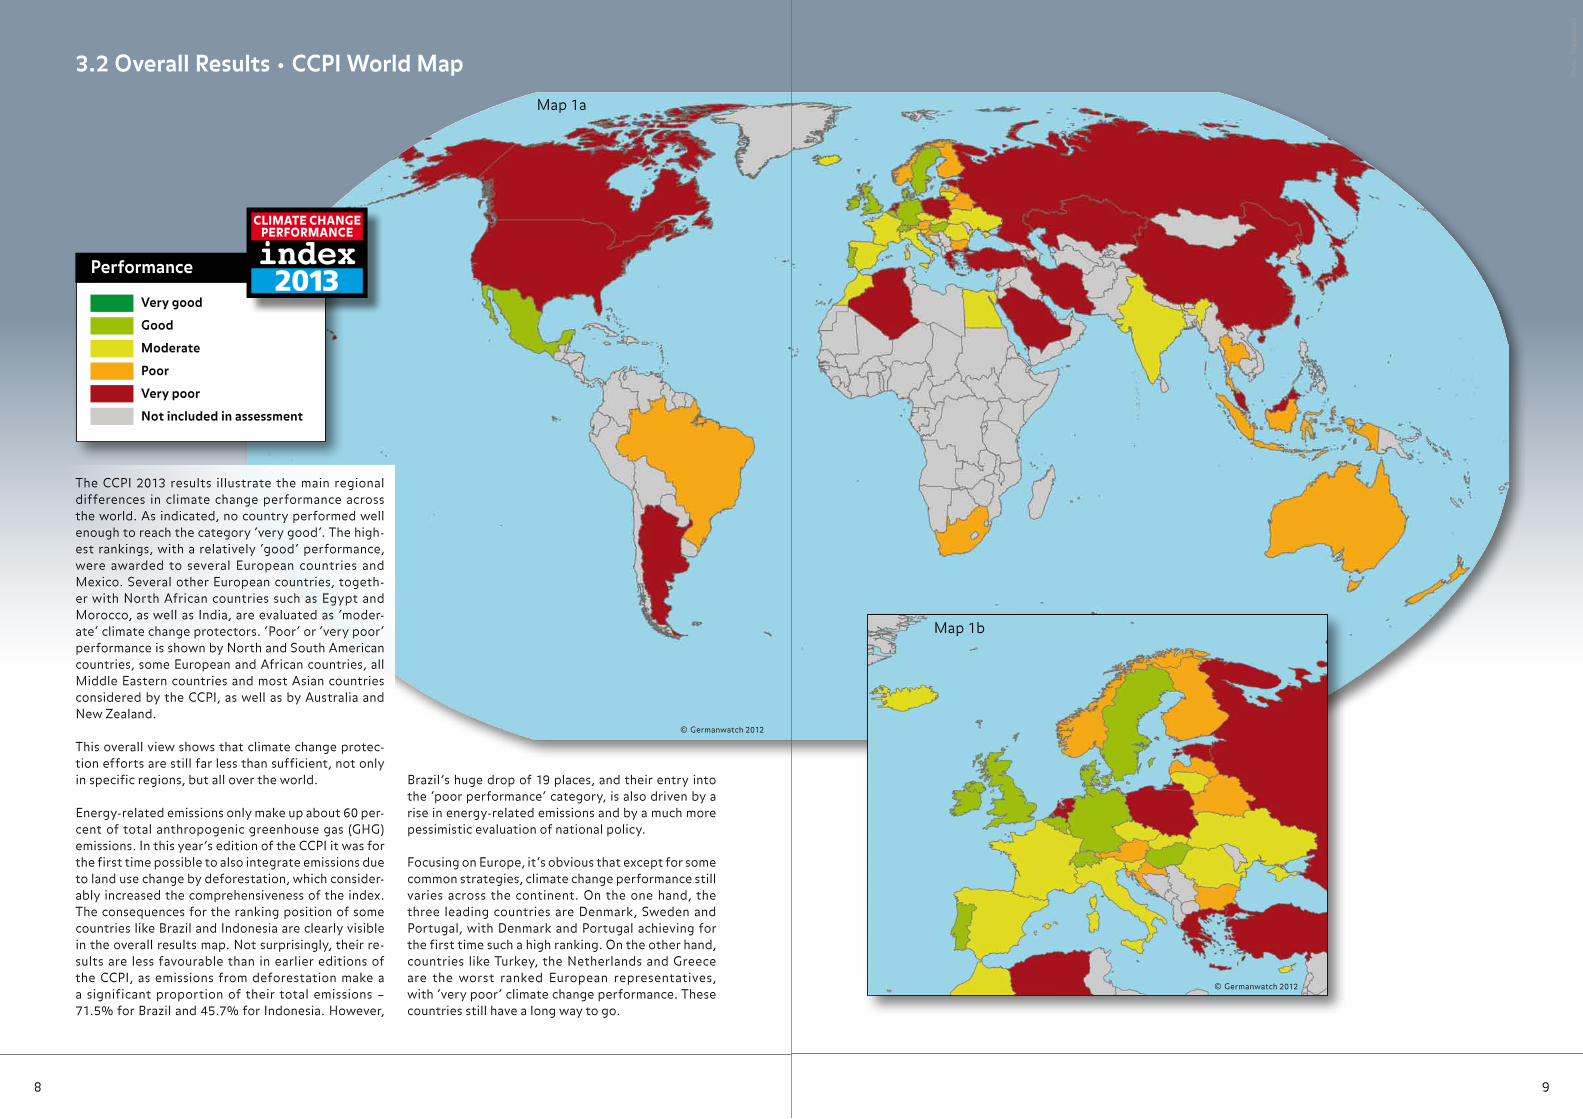
3.2 Overall Results • CCPI World Map
© Germanwatch 2012© Germanwatch 2012
Map 1a
Map 1b
© Germanwatch 2012
The CCPI 2013 results illustrate the main regional differences in climate change performance across the world. As indicated, no country performed well enough to reach the category ‘very good‘. The high-est rankings, with a relatively ‘good‘ performance, were awarded to several European countries and Mexico. Several other European countries, togeth-er with North African countries such as Egypt and Morocco, as well as India, are evaluated as ‘moder-ate‘ climate change protectors. ‘Poor‘ or ‘very poor‘ performance is shown by North and South American countries, some European and African countries, all Middle Eastern countries and most Asian countries considered by the CCPI, as well as by Australia and New Zealand.
This overall view shows that climate change protec-tion efforts are still far less than sufficient, not only in specific regions, but all over the world.
Energy-related emissions only make up about 60 per-cent of total anthropogenic greenhouse gas (GHG) emissions. In this year’s edition of the CCPI it was for the first time possible to also integrate emissions due to land use change by deforestation, which consider-ably increased the comprehensiveness of the index. The consequences for the ranking position of some countries like Brazil and Indonesia are clearly visible in the overall results map. Not surprisingly, their re-sults are less favourable than in earlier editions of the CCPI, as emissions from deforestation make a a significant proportion of their total emissions – 71.5% for Brazil and 45.7% for Indonesia. However,
Brazil’s huge drop of 19 places, and their entry into the ‘poor performance‘ category, is also driven by a rise in energy-related emissions and by a much more pessimistic evaluation of national policy.
Focusing on Europe, it‘s obvious that except for some common strategies, climate change performance still varies across the continent. On the one hand, the three leading countries are Denmark, Sweden and Portugal, with Denmark and Portugal achieving for the first time such a high ranking. On the other hand, countries like Turkey, the Netherlands and Greece are the worst ranked European representatives, with ‘very poor‘ climate change performance. These countries still have a long way to go.
Phot
o: D
igit
alst
ock
Very good
Good
Moderate
Poor
Very poor
Not included in assessment
Performance
CLIMATE CHANGE PERFORMANCE
index2013
1110
4.1 Partial Results • Emissions Level
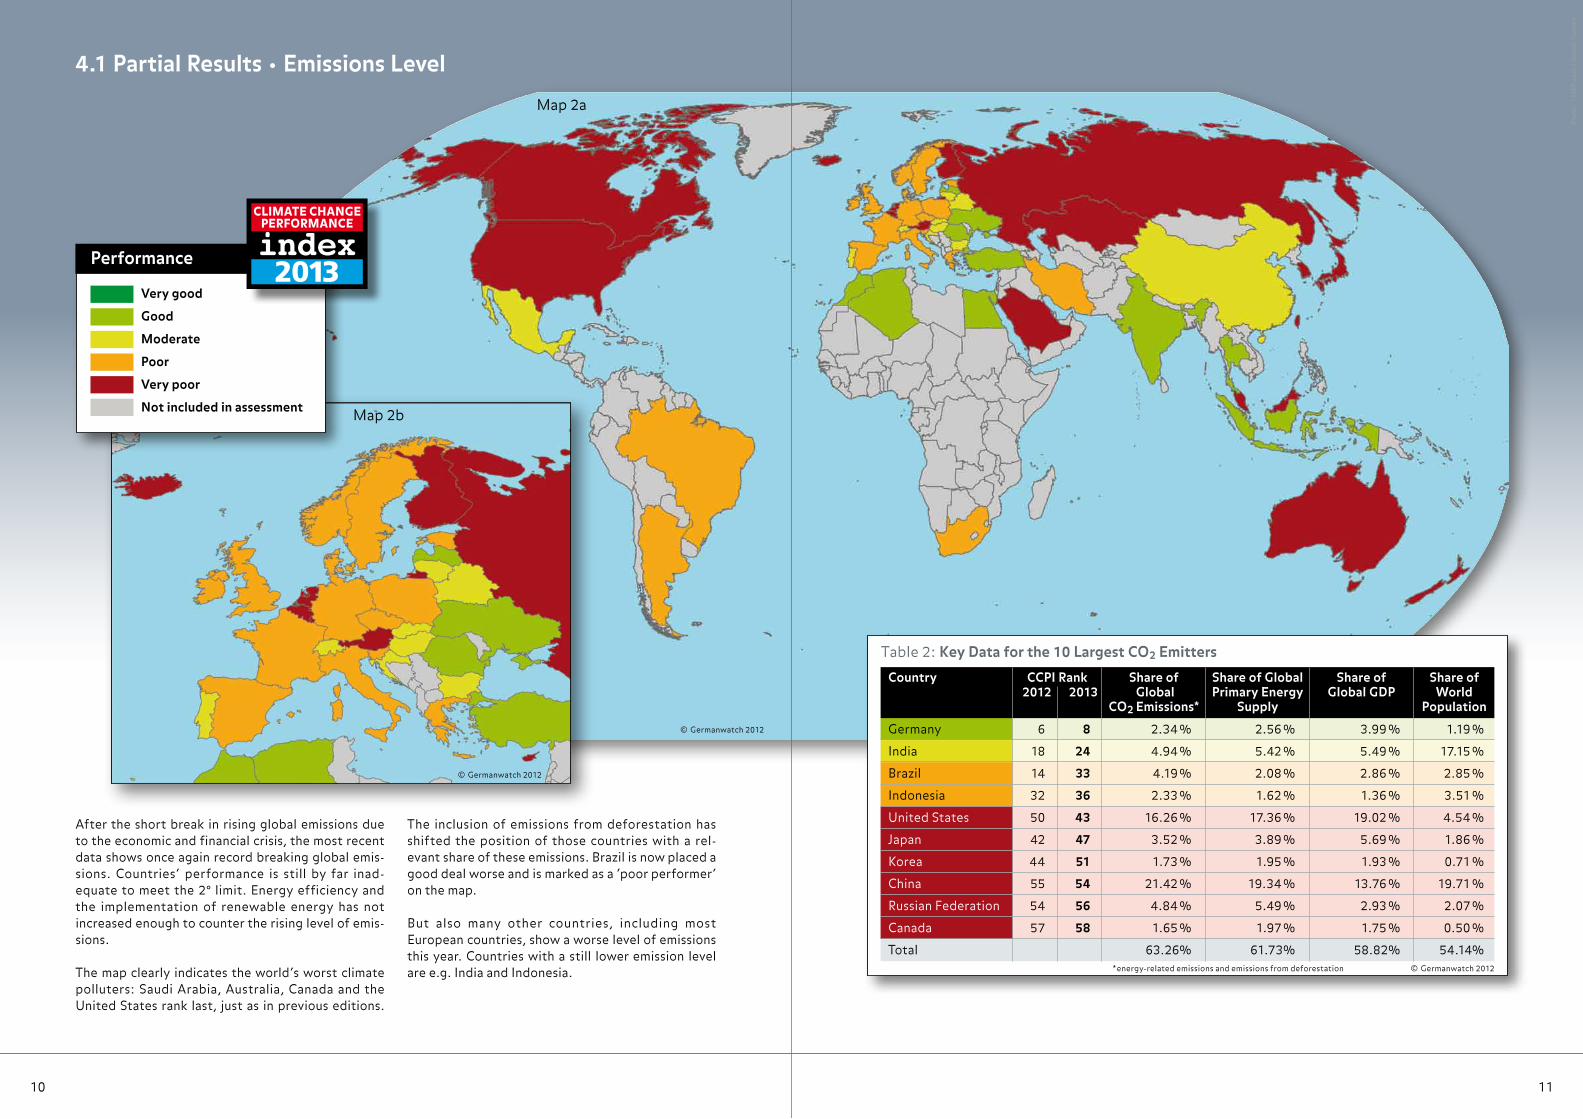
After the short break in rising global emissions due to the economic and financial crisis, the most recent data shows once again record breaking global emis-sions. Countries‘ performance is still by far inad-equate to meet the 2° limit. Energy efficiency and the implementation of renewable energy has not increased enough to counter the rising level of emis-sions.
The map clearly indicates the world‘s worst climate polluters: Saudi Arabia, Australia, Canada and the United States rank last, just as in previous editions.
The inclusion of emissions from deforestation has shifted the position of those countries with a rel-evant share of these emissions. Brazil is now placed a good deal worse and is marked as a ‘poor performer‘ on the map.
But also many other countries, including most European countries, show a worse level of emissions this year. Countries with a still lower emission level are e.g. India and Indonesia.
CCPI Rank 2012 2013
Country Share of Global
CO2 Emissions*
Share of Global Primary Energy
Supply
Share of Global GDP
Share of World
Population
Germany 6 8 2.34 % 2.56 % 3.99 % 1.19 %
India 18 24 4.94 % 5.42 % 5.49 % 17.15 %
Brazil 14 33 4.19 % 2.08 % 2.86 % 2.85 %
Indonesia 32 36 2.33 % 1.62 % 1.36 % 3.51 %
United States 50 43 16.26 % 17.36 % 19.02 % 4.54 %
Japan 42 47 3.52 % 3.89 % 5.69 % 1.86 %
Korea 44 51 1.73 % 1.95 % 1.93 % 0.71 %
China 55 54 21.42 % 19.34 % 13.76 % 19.71 %
Russian Federation 54 56 4.84 % 5.49 % 2.93 % 2.07 %
Canada 57 58 1.65 % 1.97 % 1.75 % 0.50 %
Total 63.26% 61.73% 58.82% 54.14%© Germanwatch 2012* energy-related emissions and emissions from deforestation
Table 2: Key Data for the 10 Largest CO2 Emitters
© Germanwatch 2012
© Germanwatch 2012
Map 2a
Map 2b
Very good
Good
Moderate
Poor
Very poor
Not included in assessment
Performance
CLIMATE CHANGE PERFORMANCE
index2013
Phot
o: 1
23RF
.com
/ D
anie
l-O
erte
lt
Phot
o: P
anth
erm
edia
.net
/ E
rwin
Wod
icka
1312
4.2 Partial Results • Development of Emissions
Map 3b
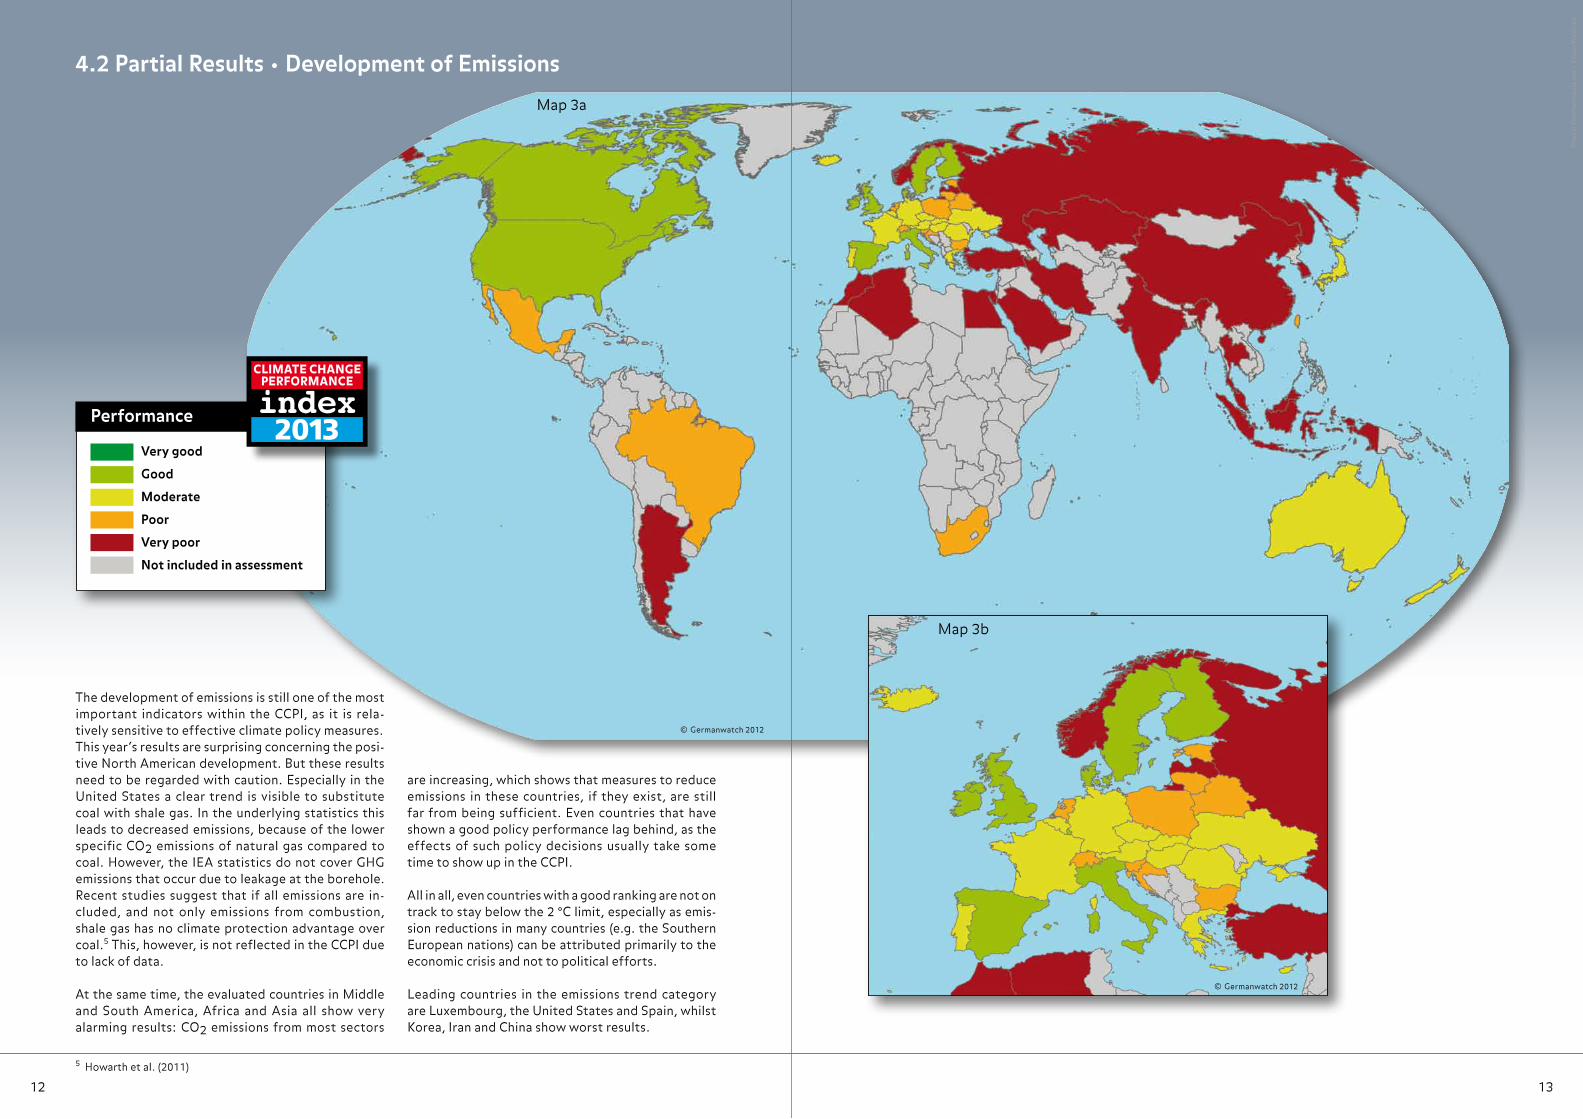
The development of emissions is still one of the most important indicators within the CCPI, as it is rela-tively sensitive to effective climate policy measures. This year‘s results are surprising concerning the posi-tive North American development. But these results need to be regarded with caution. Especially in the United States a clear trend is visible to substitute coal with shale gas. In the underlying statistics this leads to decreased emissions, because of the lower specific CO2 emissions of natural gas compared to coal. However, the IEA statistics do not cover GHG emissions that occur due to leakage at the borehole. Recent studies suggest that if all emissions are in-cluded, and not only emissions from combustion, shale gas has no climate protection advantage over coal.5 This, however, is not reflected in the CCPI due to lack of data.
At the same time, the evaluated countries in Middle and South America, Africa and Asia all show very alarming results: CO2 emissions from most sectors
are increasing, which shows that measures to reduce emissions in these countries, if they exist, are still far from being sufficient. Even countries that have shown a good policy performance lag behind, as the effects of such policy decisions usually take some time to show up in the CCPI.
All in all, even countries with a good ranking are not on track to stay below the 2 °C limit, especially as emis-sion reductions in many countries (e.g. the Southern European nations) can be attributed primarily to the economic crisis and not to political efforts.
Leading countries in the emissions trend category are Luxembourg, the United States and Spain, whilst Korea, Iran and China show worst results.
© Germanwatch 2012
5 Howarth et al. (2011)
Very good
Good
Moderate
Poor
Very poor
Not included in assessment
Performance
CLIMATE CHANGE PERFORMANCE
index2013
© Germanwatch 2012
Map 3a
Phot
o: P
anth
erm
edia
.net
/ T
hom
as K
naue
r
1514
4.3 Partial Results • Renewable Energies
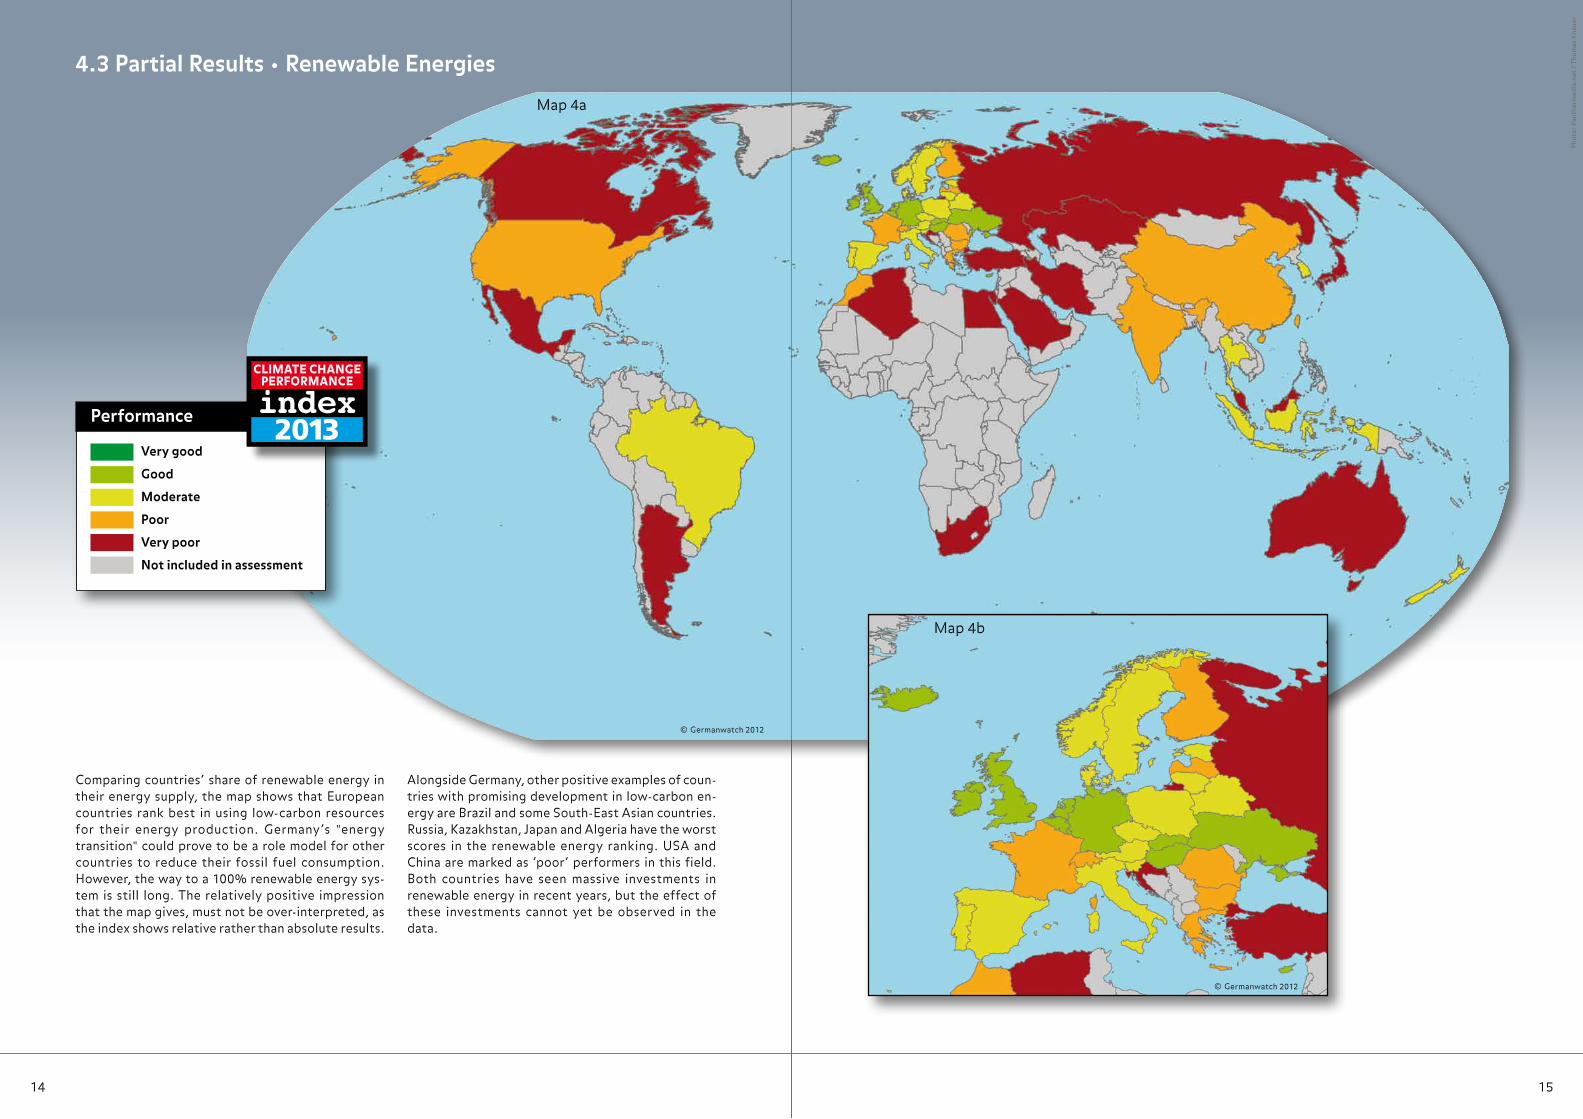
Comparing countries‘ share of renewable energy in their energy supply, the map shows that European countries rank best in using low-carbon resources for their energy production. Germany‘s "energy transition" could prove to be a role model for other countries to reduce their fossil fuel consumption. However, the way to a 100% renewable energy sys-tem is still long. The relatively positive impression that the map gives, must not be over-interpreted, as the index shows relative rather than absolute results.
Alongside Germany, other positive examples of coun-tries with promising development in low-carbon en-ergy are Brazil and some South-East Asian countries. Russia, Kazakhstan, Japan and Algeria have the worst scores in the renewable energy ranking. USA and China are marked as ‘poor‘ performers in this field. Both countries have seen massive investments in renewable energy in recent years, but the effect of these investments cannot yet be observed in the data.
Very good
Good
Moderate
Poor
Very poor
Not included in assessment
Performance
CLIMATE CHANGE PERFORMANCE
index2013
© Germanwatch 2012
Map 4a
Map 4b
© Germanwatch 2012
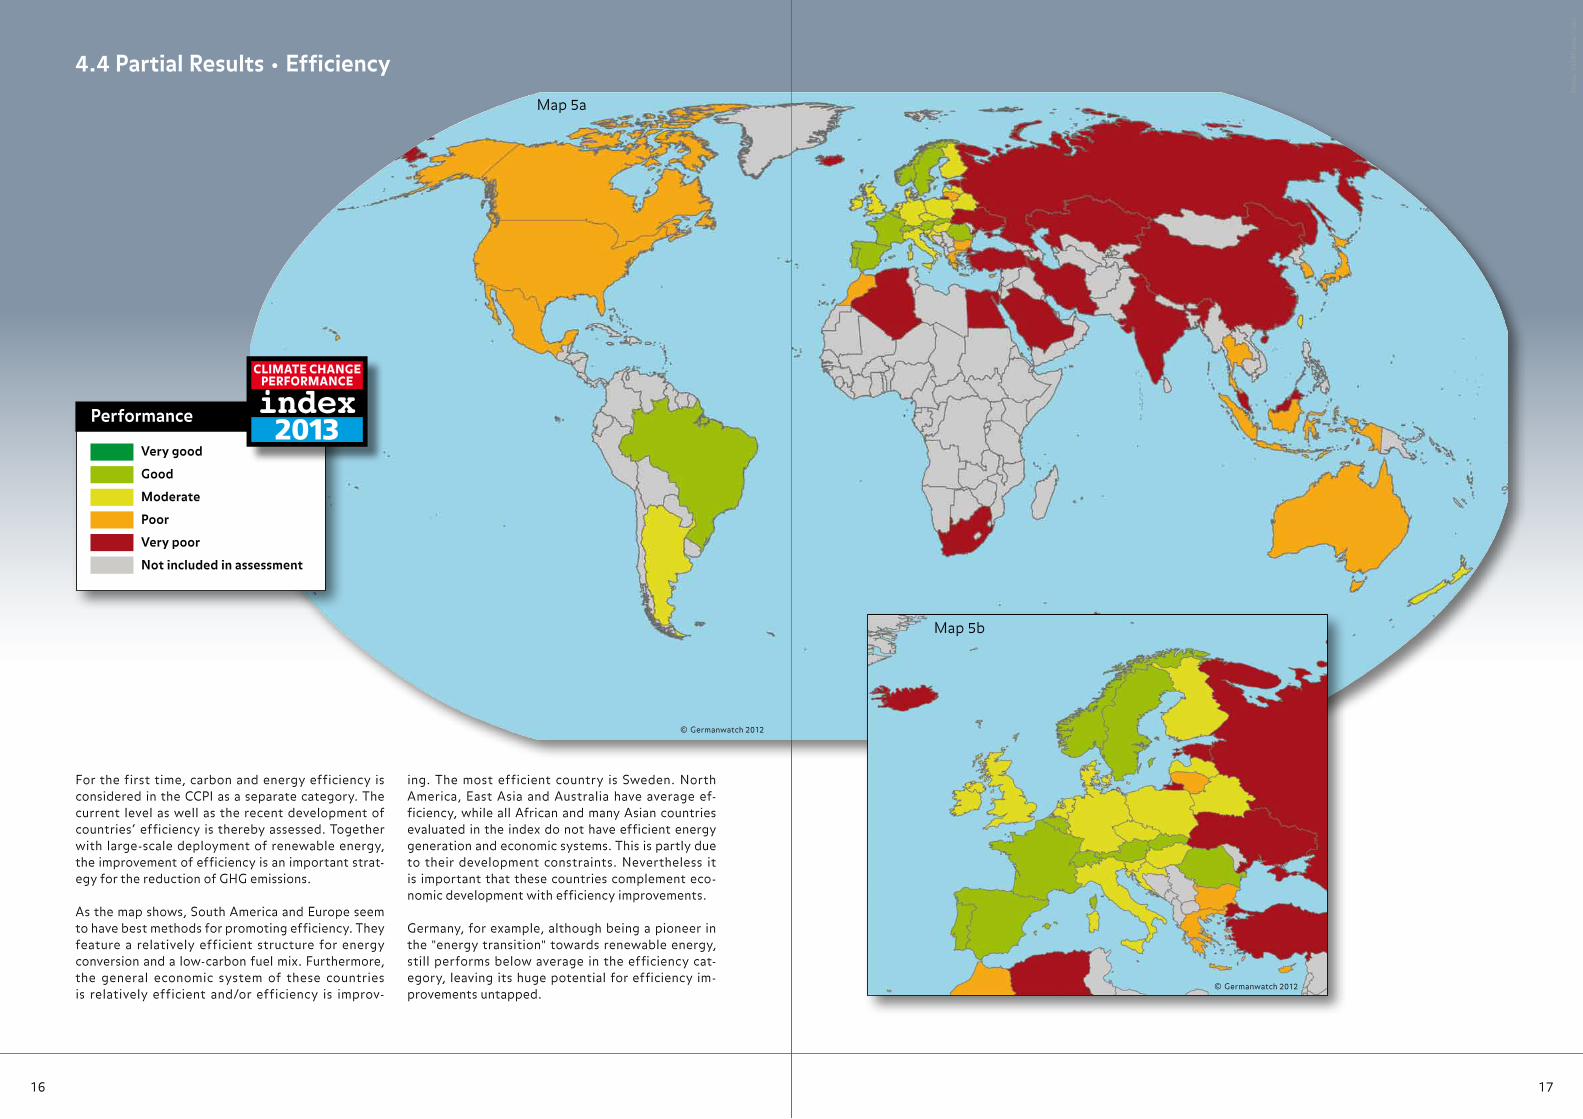
For the first time, carbon and energy efficiency is considered in the CCPI as a separate category. The current level as well as the recent development of countries‘ efficiency is thereby assessed. Together with large-scale deployment of renewable energy, the improvement of efficiency is an important strat-egy for the reduction of GHG emissions.
As the map shows, South America and Europe seem to have best methods for promoting efficiency. They feature a relatively efficient structure for energy conversion and a low-carbon fuel mix. Furthermore, the general economic system of these countries is relatively efficient and/or efficiency is improv-
ing. The most efficient country is Sweden. North America, East Asia and Australia have average ef-ficiency, while all African and many Asian countries evaluated in the index do not have efficient energy generation and economic systems. This is partly due to their development constraints. Nevertheless it is important that these countries complement eco-nomic development with efficiency improvements.
Germany, for example, although being a pioneer in the "energy transition" towards renewable energy, still performs below average in the efficiency cat-egory, leaving its huge potential for efficiency im-provements untapped.
Phot
o: 1
23RF
.com
/ n
dul
1716
4.4 Partial Results • Efficiency
© Germanwatch 2012
Very good
Good
Moderate
Poor
Very poor
Not included in assessment
Performance
CLIMATE CHANGE PERFORMANCE
index2013
© Germanwatch 2012
Map 5a
Map 5b
© Germanwatch 2012
Phot
o: P
anth
erm
edia
.net
/ U
we
Bauc
h
1918
4.5 Partial Results • Climate Policy
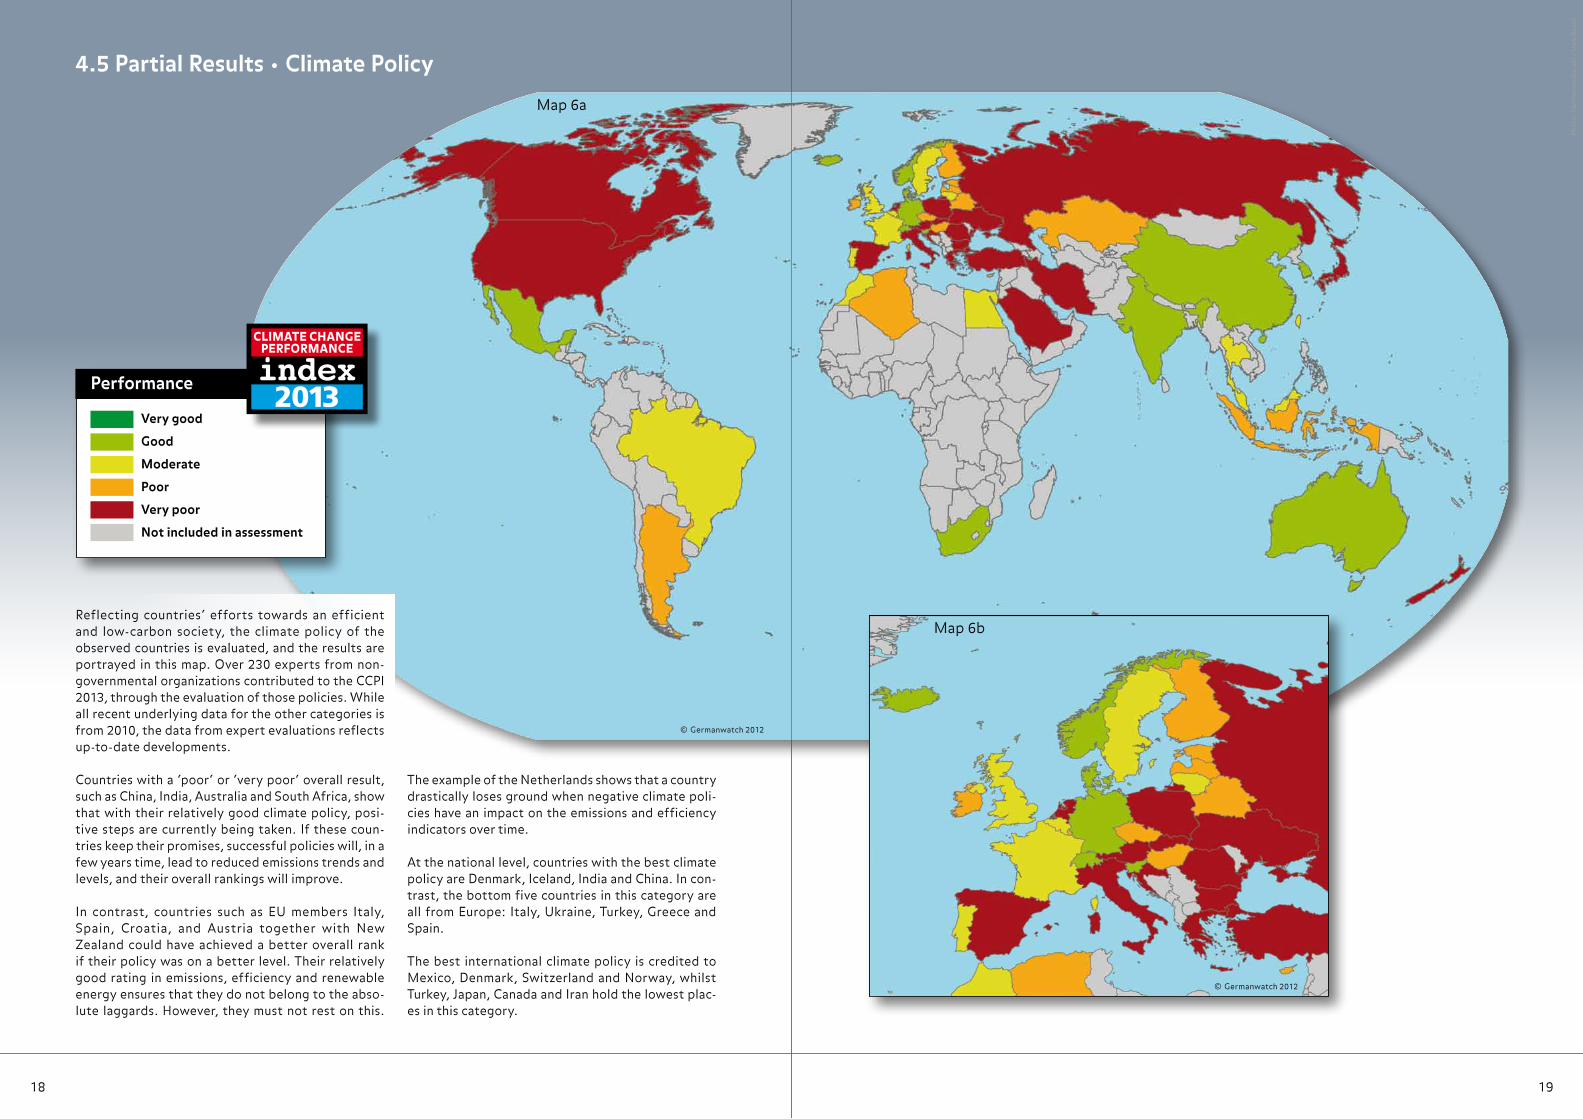
Reflecting countries‘ efforts towards an efficient and low-carbon society, the climate policy of the observed countries is evaluated, and the results are portrayed in this map. Over 230 experts from non-governmental organizations contributed to the CCPI 2013, through the evaluation of those policies. While all recent underlying data for the other categories is from 2010, the data from expert evaluations reflects up-to-date developments.
Countries with a ‘poor‘ or ‘very poor‘ overall result, such as China, India, Australia and South Africa, show that with their relatively good climate policy, posi-tive steps are currently being taken. If these coun-tries keep their promises, successful policies will, in a few years time, lead to reduced emissions trends and levels, and their overall rankings will improve.
In contrast, countries such as EU members Italy, Spain, Croatia, and Austria together with New Zealand could have achieved a better overall rank if their policy was on a better level. Their relatively good rating in emissions, efficiency and renewable energy ensures that they do not belong to the abso-lute laggards. However, they must not rest on this.
The example of the Netherlands shows that a country drastically loses ground when negative climate poli-cies have an impact on the emissions and efficiency indicators over time.
At the national level, countries with the best climate policy are Denmark, Iceland, India and China. In con-trast, the bottom five countries in this category are all from Europe: Italy, Ukraine, Turkey, Greece and Spain.
The best international climate policy is credited to Mexico, Denmark, Switzerland and Norway, whilst Turkey, Japan, Canada and Iran hold the lowest plac-es in this category.
© Germanwatch 2012
Map 6a
Map 6b
© Germanwatch 2012
Very good
Good
Moderate
Poor
Very poor
Not included in assessment
Performance
CLIMATE CHANGE PERFORMANCE
index2013
Phot
o: 1
23RF
.com
/ Jo
n Bo
r
2120
5. Country Example – Brazil
The weighted sum of each country‘s scores in all par-tial indicators makes up the overall score, which de-termines a country‘s position in the index. However, the overall ranking does not state how much and in which regard one country‘s performance differs from the others. To compare the individual country results, one must examine the scores of the various partial indicators.
In this year‘s edition we compare Brazil‘s 2013 rank with that which Brazil would have scored in 2012, by using the revised methodology of the CCPI 2013. This helps to better understand the new method-ology and at the same time allows the remarkable changes in Brazil‘s ranking to be tracked.
First we would like to explore the differences that arise from the newly implemented methodology and the inclusion of data on emissions from deforesta-tion. In last year‘s edition of the CCPI, using the old methodology, Brazil was among the top performing countries and was awarded an overall 7th place. If last year‘s CCPI had used the revised methodology, then Brazil would have ranked 14th. This drop in ranking would mainly be due to the inclusion of emissions from deforestation. Brazil is by far the largest source of such emissions. With nearly 5 tonnes CO2 per-cap-ita, Brazil‘s emissions from deforestation are more than double that of their per-capita emissions from fossil energy.
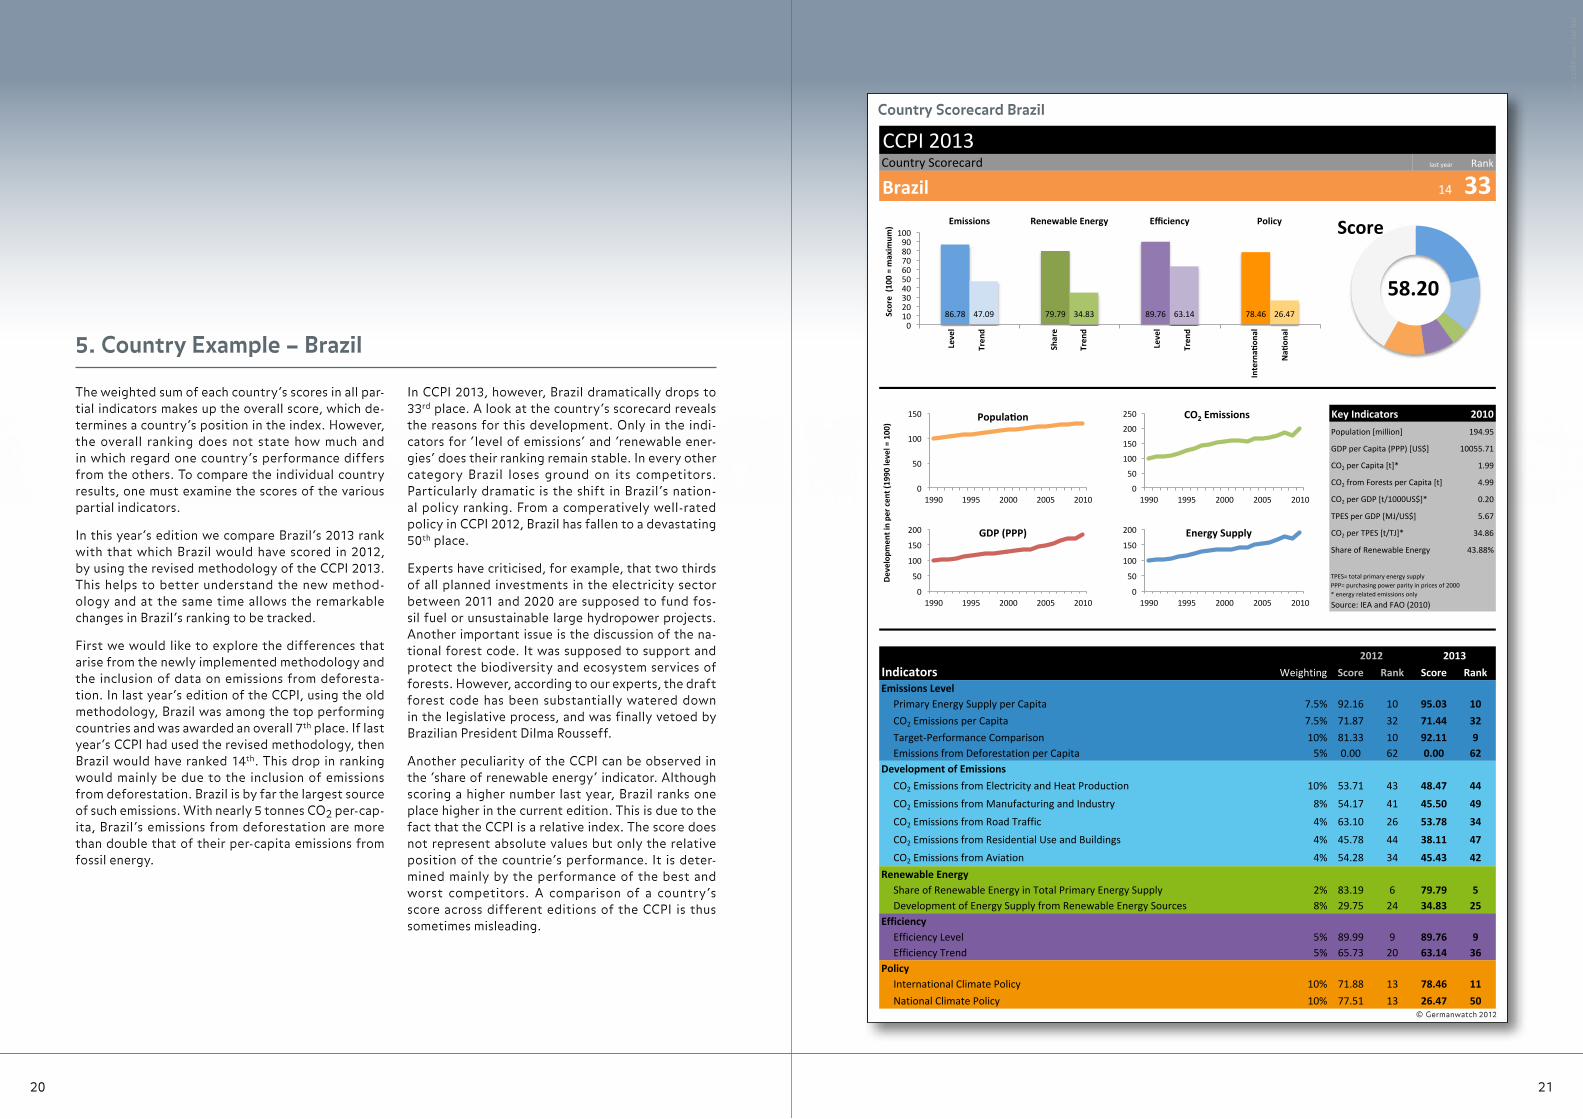
In CCPI 2013, however, Brazil dramatically drops to 33rd place. A look at the country‘s scorecard reveals the reasons for this development. Only in the indi-cators for ‘level of emissions‘ and ‘renewable ener-gies‘ does their ranking remain stable. In every other category Brazil loses ground on its competitors. Particularly dramatic is the shift in Brazil‘s nation-al policy ranking. From a comperatively well-rated policy in CCPI 2012, Brazil has fallen to a devastating 50th place.
Experts have criticised, for example, that two thirds of all planned investments in the electricity sector between 2011 and 2020 are supposed to fund fos-sil fuel or unsustainable large hydropower projects. Another important issue is the discussion of the na-tional forest code. It was supposed to support and protect the biodiversity and ecosystem services of forests. However, according to our experts, the draft forest code has been substantially watered down in the legislative process, and was finally vetoed by Brazilian President Dilma Rousseff.
Another peculiarity of the CCPI can be observed in the ‘share of renewable energy‘ indicator. Although scoring a higher number last year, Brazil ranks one place higher in the current edition. This is due to the fact that the CCPI is a relative index. The score does not represent absolute values but only the relative position of the countrie‘s performance. It is deter-mined mainly by the performance of the best and worst competitors. A comparison of a country‘s score across different editions of the CCPI is thus sometimes misleading.
Table 3: Country Scorecard Brazil
©Germanwatch
CCPI 2013Country Scorecard last year Rank
Brazil 14 33
Key Indicators 2010Population [million] 194.95
GDP per Capita (PPP) [US$] 10055.71
CO2 per Capita [t]* 1.99
CO2 from Forests per Capita [t] 4.99
CO2 per GDP [t/1000US$]* 0.20
TPES per GDP [MJ/US$] 5.67
CO2 per TPES [t/TJ]* 34.86
Share of Renewable Energy 43.88%
TPES= total primary energy supplyPPP= purchasing power parity in prices of 2000* energy related emissions only
Source: IEA and FAO (2010)
Indicators Weighting Score Rank Score RankEmissions Level
Primary Energy Supply per Capita 7.5% 92.16 10 95.03 10CO2 Emissions per Capita 7.5% 71.87 32 71.44 32Target-‐Performance Comparison 10% 81.33 10 92.11 9Emissions from Deforestation per Capita 5% 0.00 62 0.00 62
Development of EmissionsCO2 Emissions from Electricity and Heat Production 10% 53.71 43 48.47 44
CO2 Emissions from Manufacturing and Industry 8% 54.17 41 45.50 49
CO2 Emissions from Road Traffic 4% 63.10 26 53.78 34
CO2 Emissions from Residential Use and Buildings 4% 45.78 44 38.11 47
CO2 Emissions from Aviation 4% 54.28 34 45.43 42Renewable Energy
Share of Renewable Energy in Total Primary Energy Supply 2% 83.19 6 79.79 5Development of Energy Supply from Renewable Energy Sources 8% 29.75 24 34.83 25
EfficiencyEfficiency Level 5% 89.99 9 89.76 9Efficiency Trend 5% 65.73 20 63.14 36
PolicyInternational Climate Policy 10% 71.88 13 78.46 11National Climate Policy 10% 77.51 13 26.47 50
Deve
lopm
ent i
n pe
r cen
t (19
90 le
vel =
100
)
2012 2013
86.78 79.79 89.76 78.46 47.09 34.83 63.14 26.47 0
10 20 30 40 50 60 70 80 90
100 Emissions Renewable Energy Efficiency Policy
Scor
e (1
00 =
max
imum
)
Leve
l Tr
end
Shar
e Tr
end
Leve
l Tr
end
Inte
rnaS
onal
NaS
onal
Score
58.20
0
50
100
150
200
1990 1995 2000 2005 2010
GDP (PPP)
0
50
100
150
1990 1995 2000 2005 2010
PopulaSon
0
50
100
150
200
250
1990 1995 2000 2005 2010
CO2 Emissions
0
50
100
150
200
1990 1995 2000 2005 2010
Energy Supply
© Germanwatch 2012
Phot
o: F
otol
ia.c
om /
cpa
usch
ert
2322
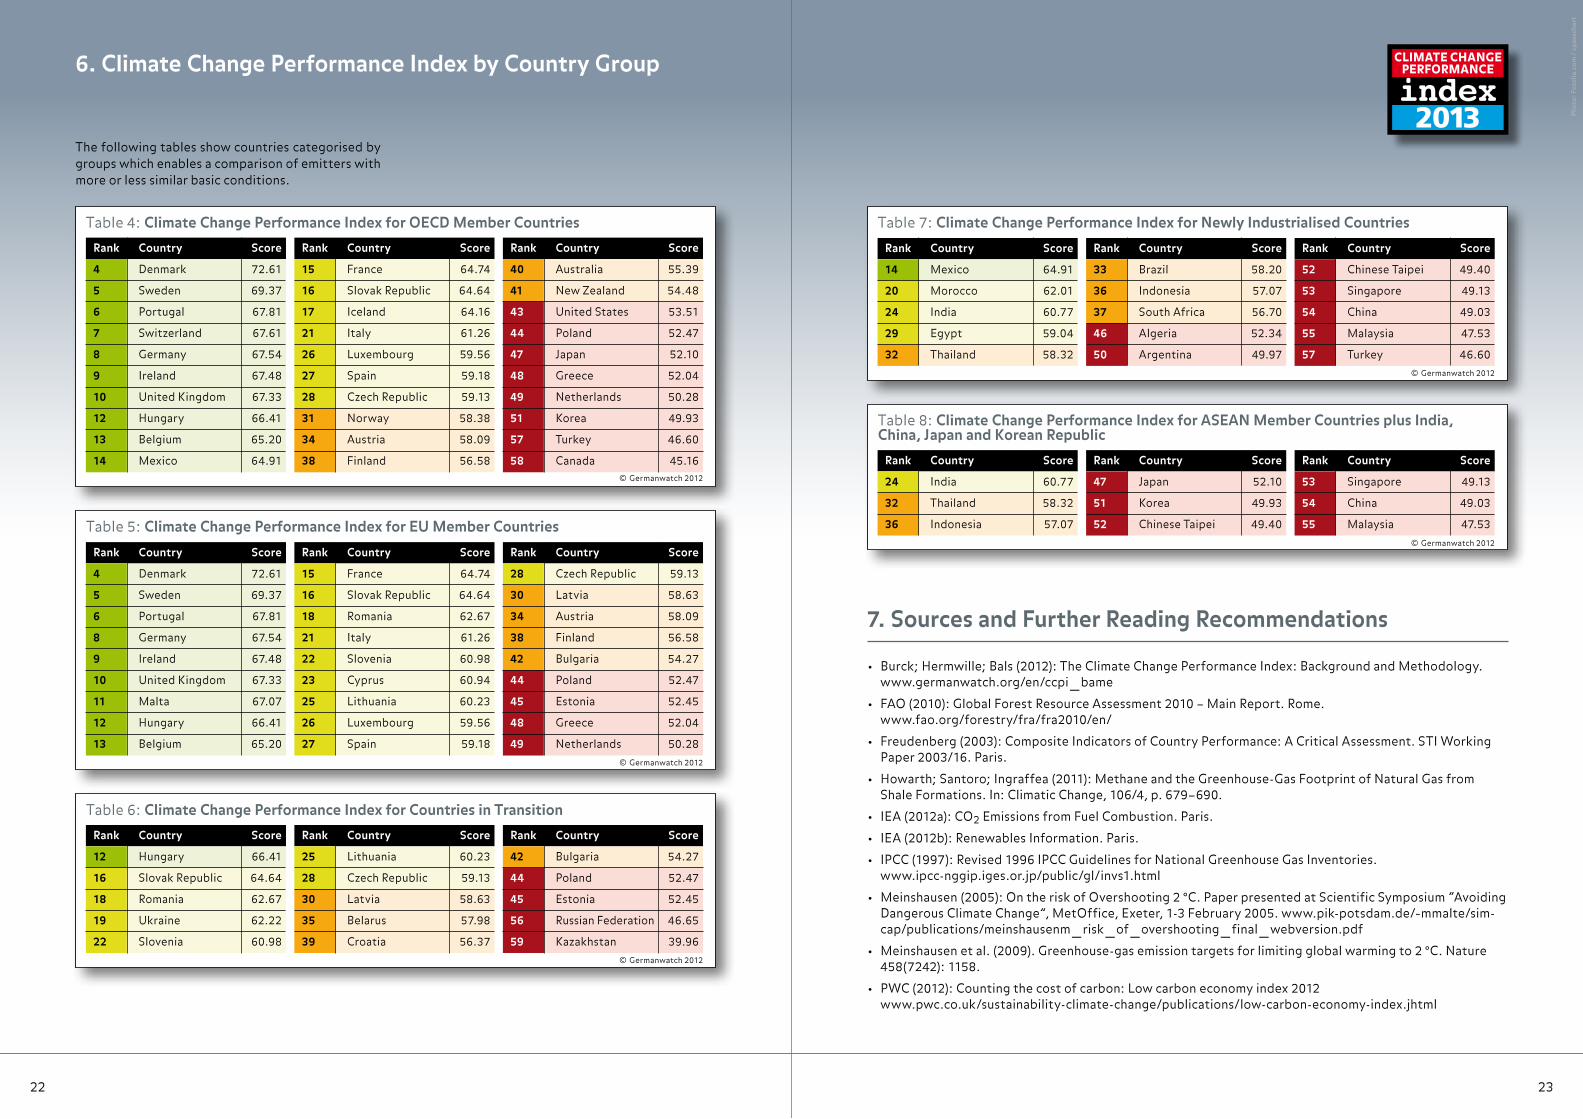
The following tables show countries categorised by groups which enables a comparison of emitters with more or less similar basic conditions.
6. Climate Change Performance Index by Country Group
• Burck; Hermwille; Bals (2012): The Climate Change Performance Index: Background and Methodology. www.germanwatch.org/en/ccpi_ bame
• FAO (2010): Global Forest Resource Assessment 2010 – Main Report. Rome. www.fao.org/forestry/fra/fra2010/en/
• Freudenberg (2003): Composite Indicators of Country Performance: A Critical Assessment. STI Working Paper 2003/16. Paris.
• Howarth; Santoro; Ingraffea (2011): Methane and the Greenhouse-Gas Footprint of Natural Gas from Shale Formations. In: Climatic Change, 106/4, p. 679–690.
• IEA (2012a): CO2 Emissions from Fuel Combustion. Paris.
• IEA (2012b): Renewables Information. Paris.
• IPCC (1997): Revised 1996 IPCC Guidelines for National Greenhouse Gas Inventories. www.ipcc-nggip.iges.or.jp/public/gl/invs1.html
• Meinshausen (2005): On the risk of Overshooting 2 °C. Paper presented at Scientific Symposium “Avoiding Dangerous Climate Change”, MetOffice, Exeter, 1-3 February 2005. www.pik-potsdam.de/~mmalte/sim-cap/publications/meinshausenm_ risk _ of _ overshooting _ final_ webversion.pdf
• Meinshausen et al. (2009). Greenhouse-gas emission targets for limiting global warming to 2 °C. Nature 458(7242): 1158.
• PWC (2012): Counting the cost of carbon: Low carbon economy index 2012 www.pwc.co.uk/sustainability-climate-change/publications/low-carbon-economy-index.jhtml
7. Sources and Further Reading Recommendations
© Germanwatch 2012
Rank Country Score 4 Denmark 72.61
5 Sweden 69.37
6 Portugal 67.81
8 Germany 67.54
9 Ireland 67.48
10 United Kingdom 67.33
11 Malta 67.07
12 Hungary 66.41
13 Belgium 65.20
Rank Country Score 15 France 64.74
16 Slovak Republic 64.64
18 Romania 62.67
21 Italy 61.26
22 Slovenia 60.98
23 Cyprus 60.94
25 Lithuania 60.23
26 Luxembourg 59.56
27 Spain 59.18
Rank Country Score 28 Czech Republic 59.13
30 Latvia 58.63
34 Austria 58.09
38 Finland 56.58
42 Bulgaria 54.27
44 Poland 52.47
45 Estonia 52.45
48 Greece 52.04
49 Netherlands 50.28
Table 5: Climate Change Performance Index for EU Member Countries
© Germanwatch 2012
Rank Country Score 12 Hungary 66.41
16 Slovak Republic 64.64
18 Romania 62.67
19 Ukraine 62.22
22 Slovenia 60.98
Rank Country Score 25 Lithuania 60.23
28 Czech Republic 59.13
30 Latvia 58.63
35 Belarus 57.98
39 Croatia 56.37
Rank Country Score 42 Bulgaria 54.27
44 Poland 52.47
45 Estonia 52.45
56 Russian Federation 46.65
59 Kazakhstan 39.96
Table 6: Climate Change Performance Index for Countries in Transition
© Germanwatch 2012
Rank Country Score 14 Mexico 64.91
20 Morocco 62.01
24 India 60.77
29 Egypt 59.04
32 Thailand 58.32
Rank Country Score
33 Brazil 58.20
36 Indonesia 57.07
37 South Africa 56.70
46 Algeria 52.34
50 Argentina 49.97
Rank Country Score 52 Chinese Taipei 49.40
53 Singapore 49.13
54 China 49.03
55 Malaysia 47.53
57 Turkey 46.60
Table 7: Climate Change Performance Index for Newly Industrialised Countries
CLIMATE CHANGE PERFORMANCE
index2013
Performance
© Germanwatch 2012
Rank Country Score 4 Denmark 72.61
5 Sweden 69.37
6 Portugal 67.81
7 Switzerland 67.61
8 Germany 67.54
9 Ireland 67.48
10 United Kingdom 67.33
12 Hungary 66.41
13 Belgium 65.20
14 Mexico 64.91
Rank Country Score 15 France 64.74
16 Slovak Republic 64.64
17 Iceland 64.16
21 Italy 61.26
26 Luxembourg 59.56
27 Spain 59.18
28 Czech Republic 59.13
31 Norway 58.38
34 Austria 58.09
38 Finland 56.58
Rank Country Score 40 Australia 55.39
41 New Zealand 54.48
43 United States 53.51
44 Poland 52.47
47 Japan 52.10
48 Greece 52.04
49 Netherlands 50.28
51 Korea 49.93
57 Turkey 46.60
58 Canada 45.16
Table 4: Climate Change Performance Index for OECD Member Countries
© Germanwatch 2012
Rank Country Score 24 India 60.77
32 Thailand 58.32
36 Indonesia 57.07
Rank Country Score
47 Japan 52.10
51 Korea 49.93
52 Chinese Taipei 49.40
Rank Country Score
53 Singapore 49.13
54 China 49.03
55 Malaysia 47.53
Table 8: Climate Change Performance Index for ASEAN Member Countries plus India, China, Japan and Korean Republic
Germanwatch
CAN Europe
Climate Action Network Europe (CAN-E) is recog-nised as Europe‘s leading network working on cli-mate and energy issues. With over 100 members in 25 european countries, CAN-E unites to work to prevent dangerous climate change and promote sustainable energy and environment policy in Europe.
The Climate Action Network (CAN) is a worldwide network of over 700 Non-Governmental Organi-zations (NGOs) working to promote government, private sector and individual action to limit human-induced climate change to ecologically sustainable levels.
The vision of CAN is a world striving actively towards and achieving the protection of the global climate in a manner that promotes equity and social justice between peoples, sustainable development of all communities, and protection of the global environ-ment. CAN unites to work towards this vision.
CAN‘s mission is to support and empower civil society organisations to influence the design and development of an effective global strategy to reduce greenhouse gas emissions and ensure its im plementation at international, national and local levels in the promotion of equity and sustainable de-velopment.
Following the motto "Observing, Analysing, Act-ing", Germanwatch has been actively promoting global equity and the preservation of livelihoods since 1991. In doing so, we focus on the politics and economics of the North with their world - wide consequences. The situation of marginalised people in the South is the starting point of our work. Together with our members and supporters as well as with other actors in civil society, we intend to represent a strong lobby for sustainable develop-ment. We endeavour to approach our aims by advo-cating food security, responsible financial markets, compliance with human rights, and the prevention of dangerous climate change.
Germanwatch is funded by membership fees, dona-tions, grants from the "Stiftung Zukunftsfähigkeit" (Foundation for Sustainability), and by grants from a number of other public and private donors.
You can also help to achieve the goals of German-watch and become a member or support our work with your donation:
Bank fuer Sozialwirtschaft AGBIC/Swift: BFSWDE33BERIBAN: DE33 1002 0500 0003 212300