Rapidity and Pseudorapidity Distributions of theVarious ... · of inclusive cross-sections of...
12
Journal of Modern Physics, 2011, 2, 1354-1365 doi:10.4236/jmp.2011.211168 Published Online November 2011 (http://www.SciRP.org/journal/jmp) Copyright © 2011 SciRes. JMP Rapidity and Pseudorapidity Distributions of the Various Hadron-Species Produced in High Energy Nuclear Collisions: A Systematic Approach Goutam Sau 1 , Aparajita Bhattacharya 2 , Subrata Bhattacharyya 3* 1 Beramara RamChandrapur High School, West Bengal, India 2 Department of Physics, Jadavpur University, Kolkata, India 3 Physics and Applied Mathematics Unit (PAMU), Indian Statistical Institute, Kolkata, India E-mail: [email protected], [email protected], * [email protected] Received August 25, 2011; revised October 8, 2011; accepted October 18, 2011 Abstract With the help of a phenomenological approach outlined in the text in some detail, we have dealt here with the description of the plots on rapidity and pseudorapidity spectra of some hadron-secondaries produced in various nucleus-nucleus interactions at high energies. The agreement between the measured data and the at- tempted fits are, on the whole, modestly satisfactory excepting a very narrow central region in the vicinity of y = η = 0. At last, hints to how the steps suggested in the main body of the text to proceed with the descrip- tion of the measured data given in the plots could lead finally to a somewhat systematic methodology have also been made. Keywords: Relativistic Heavy Ion Collisions, Inclusive Cross-Section, Inclusive Production with Identified Hadrons, Quarks, Gluons, and QCD in Nuclear Reactions 1. Introduction and Background In a chain of our previous works we studied extensively the properties of the rapidity (pseudorapidity) spectra of the various secondary particles in some very high energy collisions. The leftovers of the available latest data on rapidity (pseudorapidity) spectra would here be dealt with for some specific secondaries produced in some very high energy nuclear collisions. The secondary spe- cies studied herein are mostly clearly identified particles. Our objective here is quite clear. In the light of a Grand Combinational Model (GCM) we would dwell here upon some aspects of the behaviour of the rapidity (pseu- dorapidity) spectra of the identified secondaries pro- duced in high energy Au + Au and Pb + Pb interactions. This would provide us an opportunity to check up the role of Grand Combinational Model (GCM) in explain- ing some very recent and interesting data on Au + Au and Pb + Pb reactions. Amidst the two previous works, this paper is more in line with our second work [1] on understanding the na- ture of the rapidity spectra for production of some heavy baryons than with the first one. In this paper, an empiri- cal energy-dependence of one of the parameters was in- troduced and a systematic approach to the study was built up. This work is just a follow-up of that particular methodology. This work is essentially just an exhaustive study on the rapidity-density or pseudorapidity-density of the identified hadronic secondaries produced in some high energy nuclear collisions. This apart, some clues to developing this procedure as a systematic approach have also been highlighted. The paper is organized as follows. In the next section (Section 2) we give the basic outlook and the approach to be taken up for this study. The following section (Section 3) provides description of the data analyses on Au + Au and Pb + Pb interactions mostly in the graphical plots. The last section is reserved for summing up the conclu- sions with some suggestive remarks to develop the ap- plied procedure into a somewhat complete systematic methodology. 2. The Phenomenological Setting: Premises and the Pathway Following Faessler [2], Peitzmann [3], Schmidt and
Transcript of Rapidity and Pseudorapidity Distributions of theVarious ... · of inclusive cross-sections of...

Journal of Modern Physics, 2011, 2, 1354-1365 doi:10.4236/jmp.2011.211168 Published Online November 2011 (http://www.SciRP.org/journal/jmp)
Copyright © 2011 SciRes. JMP
Rapidity and Pseudorapidity Distributions of the Various Hadron-Species Produced in High Energy
Nuclear Collisions: A Systematic Approach
Goutam Sau1, Aparajita Bhattacharya2, Subrata Bhattacharyya3* 1Beramara RamChandrapur High School, West Bengal, India 2Department of Physics, Jadavpur University, Kolkata, India
3Physics and Applied Mathematics Unit (PAMU), Indian Statistical Institute, Kolkata, India E-mail: [email protected], [email protected], *[email protected]
Received August 25, 2011; revised October 8, 2011; accepted October 18, 2011
Abstract With the help of a phenomenological approach outlined in the text in some detail, we have dealt here with the description of the plots on rapidity and pseudorapidity spectra of some hadron-secondaries produced in various nucleus-nucleus interactions at high energies. The agreement between the measured data and the at-tempted fits are, on the whole, modestly satisfactory excepting a very narrow central region in the vicinity of y = η = 0. At last, hints to how the steps suggested in the main body of the text to proceed with the descrip-tion of the measured data given in the plots could lead finally to a somewhat systematic methodology have also been made. Keywords: Relativistic Heavy Ion Collisions, Inclusive Cross-Section, Inclusive Production with Identified
Hadrons, Quarks, Gluons, and QCD in Nuclear Reactions
1. Introduction and Background In a chain of our previous works we studied extensively the properties of the rapidity (pseudorapidity) spectra of the various secondary particles in some very high energy collisions. The leftovers of the available latest data on rapidity (pseudorapidity) spectra would here be dealt with for some specific secondaries produced in some very high energy nuclear collisions. The secondary spe-cies studied herein are mostly clearly identified particles. Our objective here is quite clear. In the light of a Grand Combinational Model (GCM) we would dwell here upon some aspects of the behaviour of the rapidity (pseu-dorapidity) spectra of the identified secondaries pro-duced in high energy Au + Au and Pb + Pb interactions. This would provide us an opportunity to check up the role of Grand Combinational Model (GCM) in explain-ing some very recent and interesting data on Au + Au and Pb + Pb reactions.
Amidst the two previous works, this paper is more in line with our second work [1] on understanding the na-ture of the rapidity spectra for production of some heavy baryons than with the first one. In this paper, an empiri-
cal energy-dependence of one of the parameters was in-troduced and a systematic approach to the study was built up. This work is just a follow-up of that particular methodology. This work is essentially just an exhaustive study on the rapidity-density or pseudorapidity-density of the identified hadronic secondaries produced in some high energy nuclear collisions. This apart, some clues to developing this procedure as a systematic approach have also been highlighted.
The paper is organized as follows. In the next section (Section 2) we give the basic outlook and the approach to be taken up for this study. The following section (Section 3) provides description of the data analyses on Au + Au and Pb + Pb interactions mostly in the graphical plots. The last section is reserved for summing up the conclu-sions with some suggestive remarks to develop the ap-plied procedure into a somewhat complete systematic methodology. 2. The Phenomenological Setting: Premises
and the Pathway Following Faessler [2], Peitzmann [3], Schmidt and
G. SAU ET AL.
1355
Schukraft [4] and finally Thom e et al. [5], we [6,7] had formulated in the past a final working expression for rapidity distributions in proton-proton collisions at ISR (Intersecting Storage Rings) ranges of energy-values by the following three-parameter parametrization, viz,
1
01
11 exp
y ydC
dy
(1)
where 1 is a normalization constant and 0 , C y are two parameters. The choice of the above form made by Thom et al. [5] was intended to describe conveniently the central plateau and the fall-off in the fragmentation region by means of the parameters 0 and respec-tively. Besides, this was based on the concept of both limiting fragmentation and the Feynman Scaling hy-pothesis. For all five energies in PP collisions the value of was obtained to be ~ 0.55 for pions [6] and kaons [7], ~ 0.35 for protons/antiprotons [7], and ~ 0.70 for
e
y
,
, , and . And these values of are gener-ally assumed to remain the same in the ISR ranges of energy. Still, for very high energies, and for direct frag-mentation processes which are quite feasible in very high energy heavy nucleus-nucleus collisions, such parameter values do change somewhat prominently, though in most cases with marginal high energies, we have treated them as nearly constant.
Now, the fits for the rapidity (pseudorapidity) spectra for non-pion secondaries produced in the PP reactions at various energies are phenomenologically obtained by De and Bhattacharyya [7] through the making of suitable choices of 1 and 0 . It is observed that for most of the secondaries the values of 0 do not remain exactly constant and show up some degree of species-depend- ence. However, for , ,
C y
y
, and , it gradu-ally increases with energies and the energy-dependence of 0 is empirically proposed to be expressed by the following relationship [6] :
y
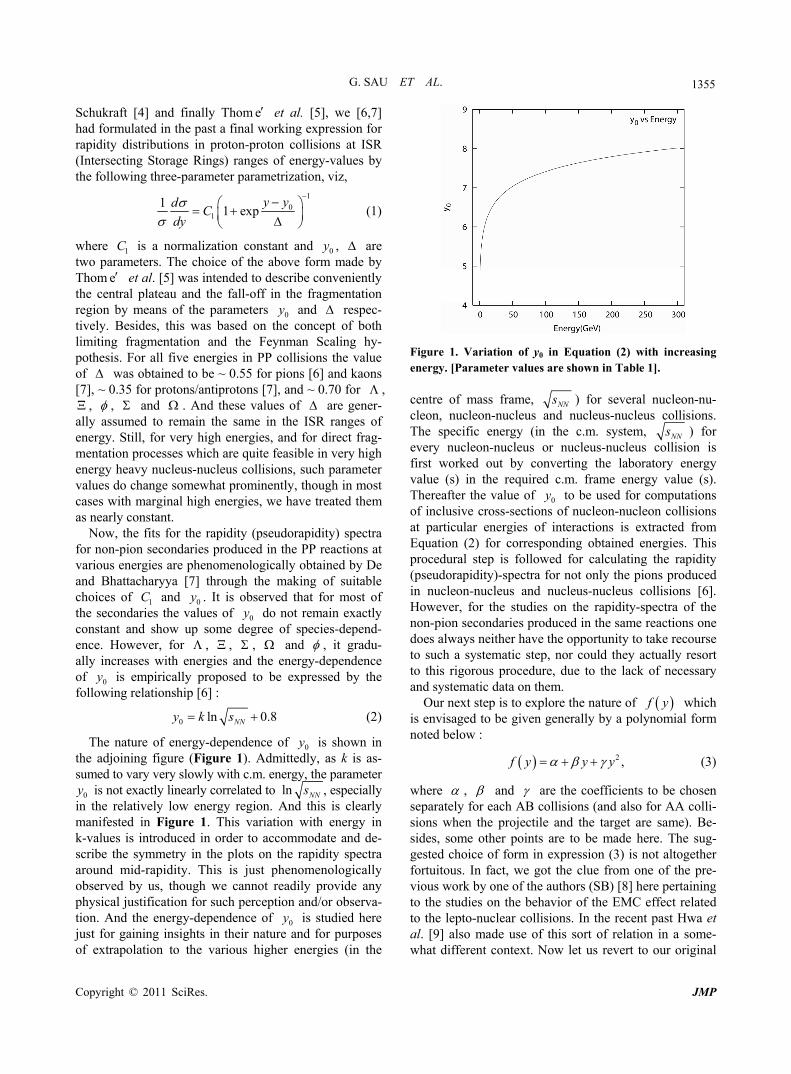
0 ln 0.8NNy k s (2)
The nature of energy-dependence of 0 is shown in the adjoining figure (Figure 1). Admittedly, as k is as-sumed to vary very slowly with c.m. energy, the parameter
0 is not exactly linearly correlated to
y
y ln NNs , especially in the relatively low energy region. And this is clearly manifested in Figure 1. This variation with energy in k-values is introduced in order to accommodate and de-scribe the symmetry in the plots on the rapidity spectra around mid-rapidity. This is just phenomenologically observed by us, though we cannot readily provide any physical justification for such perception and/or observa-tion. And the energy-dependence of 0 is studied here just for gaining insights in their nature and for purposes of extrapolation to the various higher energies (in the
y
Figure 1. Variation of y0 in Equation (2) with increasing energy. [Parameter values are shown in Table 1]. centre of mass frame, NNs ) for several nucleon-nu- cleon, nucleon-nucleus and nucleus-nucleus collisions. The specific energy (in the c.m. system, NNs ) for every nucleon-nucleus or nucleus-nucleus collision is first worked out by converting the laboratory energy value (s) in the required c.m. frame energy value (s). Thereafter the value of 0 to be used for computations of inclusive cross-sections of nucleon-nucleon collisions at particular energies of interactions is extracted from Equation (2) for corresponding obtained energies. This procedural step is followed for calculating the rapidity (pseudorapidity)-spectra for not only the pions produced in nucleon-nucleus and nucleus-nucleus collisions [6]. However, for the studies on the rapidity-spectra of the non-pion secondaries produced in the same reactions one does always neither have the opportunity to take recourse to such a systematic step, nor could they actually resort to this rigorous procedure, due to the lack of necessary and systematic data on them.
y
Our next step is to explore the nature of f y which is envisaged to be given generally by a polynomial form noted below :
2 ,f y y y (3)
where , and are the coefficients to be chosen separately for each AB collisions (and also for AA colli-sions when the projectile and the target are same). Be-sides, some other points are to be made here. The sug-gested choice of form in expression (3) is not altogether fortuitous. In fact, we got the clue from one of the pre-vious work by one of the authors (SB) [8] here pertaining to the studies on the behavior of the EMC effect related to the lepto-nuclear collisions. In the recent past Hwa et al. [9] also made use of this sort of relation in a some-what different context. Now let us revert to our original
Copyright © 2011 SciRes. JMP
1356 G. SAU ET AL.
discussion and to the final working formula for dN
dy in
various AB (or AA) collisions given by the following relation:
2
2
2
1
03 1 exp ,
y y
AB QX PP QX
y y
dN dNC AB
dy dy
y yC AB
(4)
where C2 is the normalization constant and 3 2 ( )C C AB is another constant as is also a constant for a specific collision at a specific energy. The parameter values for different nucleus-nucleus collisions are given in the Ta-bles 2-11).
However, it is to be noted that the relationship be-tween rapidity and pseudorapidity is given by the fol-lowing standard relation
2
2 2 21
coshT T
dN m dN
d dp m y dydp
2T
(5)
with the following properties: Table 1. Variation of y0 with Energy. [Reference Figure 1].
NNEnergy s GeV Constant k 0y
6.3 (20 AGeV) 2.76 5.894
7 2.65 5.951
7.6 (30 AGeV) 2.54 6.006
8.7 (40 AGeV) 2.40 6.085
12.3 (80 AGeV) 2.16 6.276
19.6 1.92 6.517
62.4 1.54 7.153
130 1.39 7.556
200 1.32 7.794
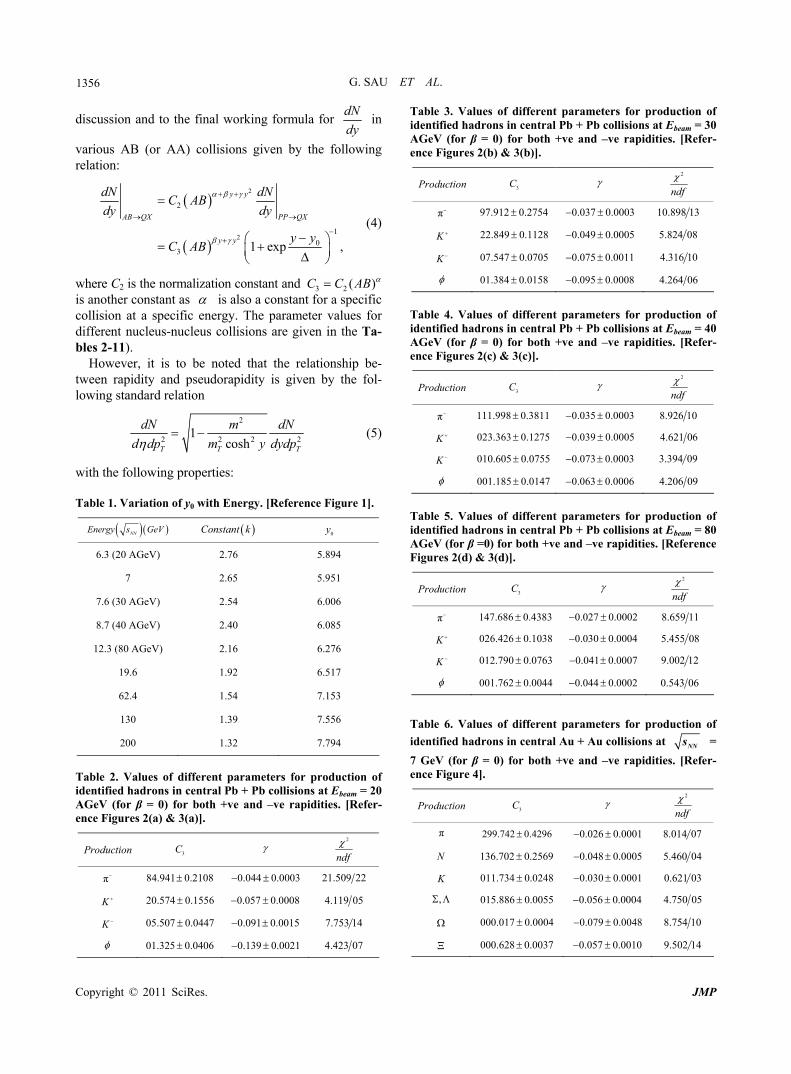
Table 2. Values of different parameters for production of identified hadrons in central Pb + Pb collisions at Ebeam = 20 AGeV (for β = 0) for both +ve and –ve rapidities. [Refer-ence Figures 2(a) & 3(a)].
Production 3C 2
ndf
π 84.941 0.2108 0.044 0.0003 21.509 22
K 20.574 0.1556 0.057 0.0008 4.119 05
K 05.507 0.0447 0.091 0.0015 7.753 14
01.325 0.0406 0.139 0.0021 4.423 07
Table 3. Values of different parameters for production of identified hadrons in central Pb + Pb collisions at Ebeam = 30 AGeV (for β = 0) for both +ve and –ve rapidities. [Refer-ence Figures 2(b) & 3(b)].
Production 3C 2
ndf
π 97.912 0.2754 0.037 0.0003 10.898 13
K 22.849 0.1128 0.049 0.0005 5.824 08
K 07.547 0.0705 0.075 0.0011 4.316 10
01.384 0.0158 0.095 0.0008 4.264 06
Table 4. Values of different parameters for production of identified hadrons in central Pb + Pb collisions at Ebeam = 40 AGeV (for β = 0) for both +ve and –ve rapidities. [Refer-ence Figures 2(c) & 3(c)].
Production 3C 2
ndf
π 111.998 0.3811 0.035 0.0003 8.926 10
K 023.363 0.1275 0.039 0.0005 4.621 06
K 010.605 0.0755 0.073 0.0003 3.394 09
001.185 0.0147 0.063 0.0006 4.206 09
Table 5. Values of different parameters for production of identified hadrons in central Pb + Pb collisions at Ebeam = 80 AGeV (for β =0) for both +ve and –ve rapidities. [Reference Figures 2(d) & 3(d)].
Production 3C 2
ndf
π 147.686 0.4383 0.027 0.0002 8.659 11
K 026.426 0.1038 0.030 0.0004 5.455 08
K 012.790 0.0763 0.041 0.0007 9.002 12
001.762 0.0044 0.044 0.0002 0.543 06
Table 6. Values of different parameters for production of
identified hadrons in central Au + Au collisions at NNs =
7 GeV (for β = 0) for both +ve and –ve rapidities. [Refer-ence Figure 4].
Production 3C 2
ndf
π 299.742 0.4296 0.026 0.0001 8.014 07
N 136.702 0.2569 0.048 0.0005 5.460 04
K 011.734 0.0248 0.030 0.0001 0.621 03
, 015.886 0.0055 0.056 0.0004 4.750 05
000.017 0.0004 0.079 0.0048 8.754 10
000.628 0.0037 0.057 0.0010 9.502 14
Copyright © 2011 SciRes. JMP

G. SAU ET AL.
Copyright © 2011 SciRes. JMP
1357 Table 7. Values of different parameters for production of charged-particle (π+) in Au + Au collisions at NNs = 19.6 GeV (for β = 0) for both +ve and –ve pseudo-rapidities. [Reference Figure 5].
Centrality 3C 2
ndf
03% 06% 363.098 1.764 0.0125 0.00008 17.359 12
06% 10% 328.094 1.195 0.0148 0.00007 12.873 19
10% 15% 266.638 0.967 0.0137 0.00007 21.209 18
15% 20% 207.392 1.130 0.0125 0.00008 9.160 10
20% 25% 180.106 0.656 0.0123 0.00007 15.549 16
25% 30% 150.634 0.456 0.0117 0.00006 14.747 12
30% 35% 0.436115.939 0.0110 0.00007 16.130 15
35% 40% 087.982 0.405 0.0098 0.00008 11.447 13
40% 45% 071.793 0.249 0.0093 0.00008 16.840 10
Table 8. Values of different parameters for production of charged-particle (π+) in Au + Au collisions at NNs = 62.4 GeV (for β = 0) for both +ve and –ve pseudo-rapidities. [Reference Figures 6 & 7].
Centrality 3C 2
ndf
00% 03% 8 858.977 2.349 0.0131 0.00002 3.527 04
03% 06% 805.167 1.252 0.0135 0.00008 9.541 12
06% 10% 690.250 4.553 0.0126 0.00006 15.843 13
10% 15% 505.765 2.056 0.0111 0.00004 15.882 15
15% 20% 397.679 1.516 0.0101 0.00004 11.527 12
20% 25% 288.758 1.128 0.0086 0.00005 9.042 10
25% 30% 223.869 1.019 0.0081 0.00004 8.544 08
30% 35% 179.875 0.496 0.0076 0.00004 10.873 11
35% 40% 126.863 0.661 0.0066 0.00005 10.169 10
40% 45% 112.144 0.404 0.0068 0.00005 6.154 05
45% 50% 091.802 0.290 0.0077 0.00004 11.346 09
1) In the region , 0y dN dN
d d
y
2) But, in the region 0y , there ia a small depres-
sion of the dN
d distribution relative to
dN
dy due to the
above transformation. In experiments at high energies
where dN
dy has a plateau shape, this transformation
gives a small dip in dN
d around 0 .
3) In the c.m. frame, the peak of the distribution is lo-
cated around 0y , and the peak value of dN
d is
smaller than the peak value of dN
dy; And this Diminu-
tive Fraction Factor (DFF) is given by 1
22
21
T
mDFF
m
(6)
3. Depicting the Results Obtained 3.1. A Few Pointed Steps The procedural steps for arriving at the results could be summed up as follows:

1358 G. SAU ET AL.
Table 9. Values of different parameters for production of charged-particle (π+) in Au + Au collisions at NNs = 130 GeV (for β = 0) for both +ve and –ve pseudo-rapidities. [Reference Figures 8 & 9].
Centrality 3C 2
ndf
00% 03% 1017.26 4.767 0.0106 0.00006 8.489 08
03% 06% 859.123 4.007 0.0096 0.00005 11.504 11
06% 10% 771.332 4.214 0.0094 0.00005 11.448 11
10% 15% 553.134 1.895 0.0083 0.00002 11.348 07
15% 20% 490.218 2.056 0.0084 0.00004 13.212 15
20% 25% 384.377 1.812 0.0079 0.00004 9.556 16
25% 30% 342.650 1.736 0.0081 0.00004 14.193 13
30% 35% 264.987 1.080 0.0077 0.00004 8.711 13
35% 40% 183.701 0.757 0.0061 0.00005 3.271 06
40% 45% 165.105 0.243 0.0068 0.00001 11.067 08
45% 50% 115.942 0.417 0.0065 0.00003 8.366 13
Table 10. Values of different parameters for production of charged-particle (π+) in Au + Au collisions at NNs = 200 GeV (for β = 0) for both +ve and –ve pseudo-rapidities. [Reference Figures 10 & 11].
Centrality 3C 2
ndf
00% 03% 1305.84 6.334 0.0095 0.00004 8.374 07
03% 06% 1217.02 3.923 0.0092 0.00002 2.677 07
06% 10% 1085.85 5.787 0.0089 0.00003 8.494 08
10% 15% 786.155 5.756 0.0083 0.00004 10.695 07
15% 20% 671.544 0.816 0.0080 0.00001 13.220 08
20% 25% 494.043 4.083 0.0076 0.00005 8.479 08
25% 30% 371.719 2.104 0.0069 0.00004 7.826 06
30% 35% 298.854 2.012 0.0069 0.00005 10.232 07
35% 40% 298.430 1.067 0.0077 0.00001 19.517 16
40% 45% 142.160 0.609 0.0060 0.00003 11.112 10
45% 50% 203.956 0.874 0.0063 0.00003 13.112 08
Table 11. Values of different parameters for production of charged-particle (π+) in Au + Au collisions at four different ener-gies for +ve pseudo-rapiditie only. [Reference Figure 12].
Energy GeV 3C 2
ndf
19.6 361.238 3.900 0.015 0.00032 0.020 0.00009 8.596 25
62.4 778.667 8.000 0.018 0.00028 0.018 0.00008 3.847 04
130 511.297 7.890 0.027 0.00054 0.012 0.00015 14.445 25
200 557.934 7.087 0.028 0.00044 0.011 0.00011 9.578 26
Copyright © 2011 SciRes. JMP
G. SAU ET AL.
Copyright © 2011 SciRes. JMP
1359
1) We assume that the inclusive cross section (I.C.) of any particle in a nucleus-nucleus (AB) collision can be obtained from the production of the same in nu-cleon-nucleon collisions by multiplying the inclusive cross-section (I.C.) by a product of the atomic numbers of each of the colliding nuclei raised to a particular func-tion, which is initially unspecified [10].
2) Secondly, we accept the property of factorization [1] of that particular function which helps us to perform the integral over in a relatively simpler manner. T
3) Thirdly, we assume a particular 3-parameter form for the pp cross section with the parameters 1, 0 and Δ.
p
C y4) Finally, we accept the ansatz that the function f(y)
can be modeled by a quadratic function with the pa-rameters α, β and γ. 3.2. Final Results Delivered The results are shown here by the graphical plots with the accompanying tables for the parameter values. Here we draw the rapidity-density of pion (π), kaon (K), pro-
ton-antiproton (N), , , , , for symmetric Pb + Pb and Au + Au collisions and pseudorapidity- density of charged-particle (mainly π+) for symmetric Au + Au collisions at several energies which have been ap-propriately labeled at the top right corner. In this context some comments are in order. Though the figures repre-sents the case for production of pion (π), kaon (K), pro-ton-antiproton (N),
, , , , , we do not an-ticipate and/or expect any strong charge-dependence of the results. Besides, the solid curves in all cases-almost without any exception-demonstrate our GCM-based re-sults. Secondly, the data on rapidity (pseudorapidty)- spectra for some high-energy collisions are, at times, available for both positive and negative y(η)-values. This gives rise to a problem in our method. It is evident here in this work that we are concerned with only symmetric collisions wherein the colliding nuclei must be identical. But in our expression (4) the coefficient β multiplies a term which is proportional to y and so is not symmetric under
y y . In order to overcome this difficulty we would introduce here β = 0 for all the graphical plots
(a) (b)
(c) (d)
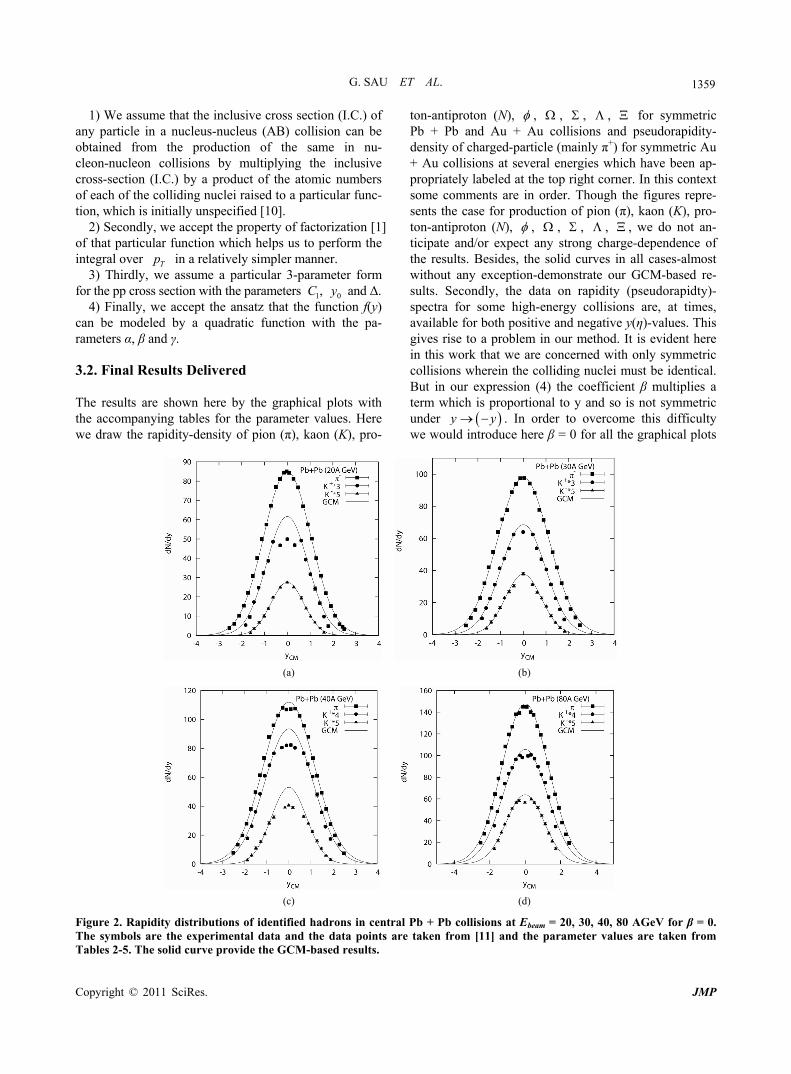
Figure 2. Rapidity distributions of identified hadrons in central Pb + Pb collisions at Ebeam = 20, 30, 40, 80 AGeV for β = 0. The symbols are the experimental data and the data points are taken from [11] and the parameter values are taken from
ables 2-5. The solid curve provide the GCM-based results. T

G. SAU ET AL.
Copyright © 2011 SciRes. JMP
1360
(except Figure 12). These plots are represented by Fig-ure 2 to Figure 11 for π, K, , N, , , , in Pb + Pb and Au + Au collision under different conditions.
The parameter values in this particular case are presented in tables (Tables 2-10). The graphical plots shown in Figure 2 and Figure 3 (for β = 0) are for production of
(a) (b)
(c) (d)
Figure 3. Rapidity spectra for in central Pb + Pb collisions at Ebeam = 20, 30, 40, 80 AGeV for β = 0. The different experimental points are taken from [11] and the parameter values are taken from Tables 2- 5. The solid curve provide the GCM-based results.
(a) (b) (c)
Figure 4. Rapidity distributions of identified hadrons in central Au+Au collisions at NNs = 7 GeV for β = 0. The different experimental points are taken from [12] and the parameter values are taken from Table 6. The solid curve provide the GCM-based results.

G. SAU ET AL.
1361
(a) (b)
(c) (d)
Figure 5. Pseudo-rapidity spectra for π+ for nine centrality bins representing 45% of the total cross-section for Au + Au collisions at NNs = 19.6 GeV for β = 0. The different experimental points are taken from [13] and the parameter values are taken from Table 7. The solid curve provide the GCM-based results.
(a) (b) (c)
Figure 6. Plot of dN
dvs.
η η for π+ for seven centrality bins representing 45% of the total cross-section for Au + Au collisions
at NNs = eV for β = 0. The different experimental points are taken from [13] and the parameter values are taken
from Table 8. The solid curve provide the GCM-based results.
62.4 G
Copyright © 2011 SciRes. JMP

1362 G. SAU ET AL.
(a) (b)
Figure 7. Plot of dN
dη vs. η for π+ for four centrality bins representing 45% of the total cross-section for Au + Au collisions
at NNs = 62.4 GeV for β = 0. The different experimental points are taken from [13] and the parameter values are taken
from Table 8. The solid curve provide the GCM-based results.
(a) (b)
Figure 8. Pseudo-rapidity spectra for π+ for five centrality bins representing 45% of the total cross-section for Au + Au collisions at NNs = 130 GeV for β = 0. The different experimental points are taken from [13] and the parameter values are taken from Table 9. The solid curve provide the GCM-based results.
(a) (b) (c)
Figure 9. Pseudo-rapidity spectra for π+ for six centrality bins representing 45% of the total cross-section for Au + Au collisions at NNs = 130 GeV for β = 0. The different experimental points are taken from [13] and the parameter values are taken from Table 9. The solid curve provide the GCM-based results.
Copyright © 2011 SciRes. JMP

G. SAU ET AL.
Copyright © 2011 SciRes. JMP
1363
(a) (b) (c)
Figure 10. Plot of dN
dη vs. for π+ for six centrality bins representing 45% of the total cross-section for Au + Au collisions
at
η
NNs = 200 GeV for β = 0. The different experimental points are taken from [13] and the parameter values are taken
from Table 10. The solid curve provide the GCM-based results.
(a) (b)
Figure 11. Plot of dN
dη vs. for π+ for five centrality bins representing 45% of the total cross-section for Au + Au collisions
at
η
NNs = 200 GeV for β = 0. The different experimental points are taken from [13] and the parameter values are taken
from Table 10. The solid curve provide the GCM-based results.
π–, K–, K+, , in Pb + Pb collisions at 20A GeV, 30A GeV, 40A GeV, 80A GeV respectively. The diagrams shown in Figure 4 represent the production of π, N, K,
, , , in Au + Au interaction at 7s NN GeV (for β = 0). And the plots depicted for pseudorapid-ity-spectra in Figure 5 to Figure 11 are based on the production of charged particle (we consider only π+) in Au + Au collision for different centrality bins at 19.6 GeV, 62.4 GeV, 130 GeV and 200 GeV respectively (for β = 0). The plots shown in Figure 12 are for the produc-tion of charged particle (mainly π+) for four different energies i.e., 19.6 GeV, 62.4 GeV, 130 GeV, 200 GeV respectively and the parameter values are shown in Ta-
ble 11. Here we would mention that the data are for 19.6 GeV, 130 GeV, 200 Gev for PHOBOS Collaboration and that of 62.4 GeV for STAR Collaboration as shown on the top right corner of the figure. Finally, the diagram in Figure 13 represents the variation of β and γ with the energy values and we draw a mean curve in this particu-lar diagram. 4. Concluding Remarks and Some
Comments On an overall basis, our model-based results are in fair agreement with the most of the data-sets, excepting 0y

1364 G. SAU ET AL.
Figure 12. Pseudorapidity distributions of charged particles (for π+) for various c.m. energies in Au + Au central colli-sions. Pseudorapidity distributions for 0% - 6% central Au + Au collisions at NNs = 200, 130, and 19.6 GeV are from the PHOBOS and 62.4 GeV is from STAR experiment ex-periment (β ≠ 0). The different experimental points are taken from [14] and the parameter values are taken from Table 11. The solid curve provide the GCM- based results.
or 0 region, wherein the data shows flat-plateau structures in almost all the diagrams exhibiting data on both positive and negative rapidities or pseudorapidities. The degree of disagreement in the vicinity of 0 region is evidently much stronger for the plots on pseu-dorapidity-density versus pseudorapidity plots. These discrepancies might probably be ascribed to our simplis-tic assumption of y . Had we been able to compute the diminutive fraction factor (DFF) as given by expres-sion (6), we would have been capable of giving the pseu-dorapidity-figures much better looks. And this computa-tion is not possible because of the fact that the rapid-ity-data-sets do not generally offer even the slightest hints on the T -ranges of the secondaries under obser-vations and/or measurements.
p
The last figure of this paper carries some special physical significance which we now explain below. This is, by essence, undoubtedly a purely phenomenological model with no or very little predictive capacity. The en-ergy-dependences studied in Figure 13 for some of the involved parameters, β and γ, could provide us some in-sights into what could be the possible values of β and γ at some higher/lower/intermediate values of the c.m. ener-gies of the interactions for any specific secondary. This could help, we believe, to reduce the elements/compo- nents of phenomenology and introduce some degree, however low, of predictivity of values of β and γ by nec-essary intrapolation or extrapolation, as the case may be, for any specific secondary produced in the same nuclear interactions. Thus, if sufficient and reliable data at, at least, six to seven c.m. energies at reasonable intervals
Figure 13. Variation of β and γ with increasing energy. All values are taken form Table 11. are available allowing the scopes for studying the nature of c.m. energy-dependence of these parameters, the pre-sent procedure could be nurtured to a better and more competent methodical approach. 5. References [1] G. Sau, P. Guptaroy, A. C. Das Ghosh and S. Bhat-
tacharyya, “Rapidity Spectra of Heavy Baryons in Nu-clear Collisions at Various Energies: A Systematic Ap-proach,” Il Nuovo Cimento B, Vol. 125, No. 11, 2010, pp.1379-1393. doi:10.1393/ncb/i2010-10937-8
[2] M. A. Faessler, “Experiments with α Particles at the CERN Intersecting Storage Rings,” Physical Report, Vol. 115, No. 1-2, 1984, pp. 1-91. doi:10.1016/0370-1573(84)90011-5
[3] T. Peitzmann, “Scaling Properties of Pion Production,” Physics Letters B, Vol. 450, No. 1-3, 1999, pp. 7-14. doi:10.1016/S0370-2693(99)00121-5
[4] H. R. Schmidt and J. Schukraft, “The Physics of Ultra- Relativistic Heavy-Ion Collsion,” Journal of Physics G, Vol. 19, No. 11, 1993, p. 1705. doi:10.1088/0954-3899/19/11/006
[5] W. Thome,' et al., “Charged Particle Multiplicity Distri-butions in pp Collisions at ISR Energies,” Nuclear Phys-ics B, Vol. 129, No. 3, 1977, pp. 365-389. doi:10.1016/0550-3213(77)90122-5
[6] B. De, S. Bhattacharyya and P.Guptaroy, “Studies in Rapidity and pT-Spectra of Pions in High Energy NN, NA and AA Collisions: A Comprehensive Approach,” Inter-national Journal of Modern Physics A, Vol. 17, No. 30, 2002, pp. 4615-4634. doi:10.1142/S0217751X02010704
[7] B. De and S. Bhattacharyya, “Rapidity Spectra of the Particle-Secondaries and a Combinational Approach,” International Journal of Modern Physics A, Vol. 19, No. 14, 2004, pp. 2313-2329. doi:10.1142/S0217751X04018269
[8] S. Bhattacharyya, “EMC Effect: Another Outlook,” Let-
Copyright © 2011 SciRes. JMP
G. SAU ET AL.
Copyright © 2011 SciRes. JMP
1365
ter Al Nuovo Cimento, Vol. 42, No. 2, 1985, pp. 119-126. doi:10.1007/BF02747002
[9] R. C. Hwa et al., “Effects of Gluon Depletion on J/ψ Suppression in pA and AA Collision,” Physical Review C, Vol. 64, No. 5, 2001, Article ID: 054611. doi:10.1103/PhysRevC.64.054611
[10] G. Sau, S. K. Biswas, A. C. Das Ghosh, A. Bhattacharya and S. Bhattacharyya, “On the Nature of the Rapidity Spectra at RHIC and Some Other Energies,” Il Nuovo Cimento B, Vol. 125, No. 7, 2010, pp. 833-849. doi:10.1393/ncb/i2010-10898-x
[11] L.-X. Sun, et al., “Hadronic Rapidity Spectra in Heavy Ion Collisions at SPS and AGS Energies in Quark Com-bination Model,” Chinese Physics C, Vol. 33, No. 10, 2009, p. 1. hep-ph/1105.0577 v1 03 May 2011.
[12] L.-W. Chen, et al., “Transport Model Studies of the
Baryon-Rich Quark-Gluon Plasma Formed in Heavy Ion Collsions,” Nuclear Theory, 4 March 2011, arXiv:1103.0916.
[13] B. Alver, et al. (PHOBOS Collaboration), “Charged- Particle Multiplicity and Pseudorapidity Distributions Measured with the PHOBOS Detector in Au + Au, Cu + Cu, d + Au and pp Collsions at Ultra Relativistic Ener-gies,” Physical Review C, Vol. 83, No. 2, 2011, Article ID: 024913. doi:10.1103/PhysRevC.83.024913
[14] J. Adams, et al., (STAR Collaboration), “Multiplicity and Pseudorapidity Distributions of Chraged Particles and Photons at Forward Pseudorapidity in Au + Au Collisions at NNs = 62.4 GeV,” Physical Review C, Vol. 73, No. 3,
2006, Article ID: 034906. doi:10.1103/PhysRevC.73.034906