Persis Drell Joins LAT as Nature’s Greatest Project Goes ...

ARTICLE IN PRESS
0147-6513/$ - se
doi:10.1016/j.ec
$This study
SORGBIOS 19
Korean Sea Gr
Michigan State
Laboratory at M�CorrespondE-mail addr
Ecotoxicology and Environmental Safety 61 (2005) 366–379
www.elsevier.com/locate/ecoenv
Rapid communication
Instrumental and bioanalytical measures of dioxin-like andestrogenic compounds and activities associated with sediment
from the Korean coast$
Chul-Hwan Koha, Jong Seong Khima,�, Daniel L. Villeneuveb, Kurunthachalam Kannanc,Boris G. Johnsonc,d, John P. Giesye,f
aSchool of Earth and Environmental Sciences (Oceanography), College of Natural Sciences, Seoul National University, Seoul 151-742,
Republic of KoreabUS Environmental Protection Agency, Mid-Continent Ecology Division, 6201 Congdon Boulevard, Duluth, MN 55804-2595, USA
cWadsworth Center, New York State Department of Health and Department of Environmental Health and Toxicology,
State University of New York at Albany, Empire State Plaza, P.O. Box 509, Albany, NY 12201-0509, USAdEnvironmental and Computational Chemistry Group, University of Cartagena, Cartagena, Colombia
eNational Food Safety and Toxicology Center, Department of Zoology, and Center for Integrative Toxicology, Michigan State University,
East Lansing, MI 48824, USAfDepartment of Biology and Chemistry, City University of Hong Kong, Tat Chee Avenue, Kowloon, Hong Kong SAR, China
Received 2 January 2005; accepted 2 March 2005
Available online 19 April 2005
Abstract
Sediments from inland areas and open bays along the Korean coast were analyzed to examine the distribution of dioxin-like and
estrogenic compounds. Concentrations of target chemicals varied considerably among locations (Lake Shihwa, Masan Bay, and
Kwangyang Bay) and between inland and coastal areas. Principal component analysis (PCA) of contaminants measured in
sediments showed that all of the inland locations from Lake Shihwa were highly contaminated, and the variations among locations
were explained predominantly by the distribution of alkylphenols and polycyclic aromatic hydrocarbons (PAHs). PCA of PAH
congener profiles among locations indicated that automobiles were a major source of PAH contamination. Dioxin-like and
estrogenic activities associated with sediment from inland sites were approximately three- and six-fold, respectively, greater than
those associated with open bay locations. The target dioxin-like and estrogenic compounds measured in raw extracts of sediments
accounted for approximately 20% and 40% of the activities measured in the sediment extracts. The results suggest that a
combination of instrumental and bioanalytical measurements of dioxin-like and estrogenic compounds is a valuable approach to
screen, identify, and prioritize the risks posed by contaminants in complex environmental matrices.
r 2005 Elsevier Inc. All rights reserved.
Keywords: PCBs; Pesticides; PAHs; Alkylphenols; Dioxin; Estrogen; In vitro bioassay; Sediment; Korea
e front matter r 2005 Elsevier Inc. All rights reserved.
oenv.2005.03.005
was financially supported by the National Institute of Environmental Research (NIER), Ministry of Environment, Korea,
98–2000 (Sediment Organic Compounds Bioassay Study). Additional funding for preparation of the manuscript was provided by the
ant Project 2001–2003, Ministry of Maritime Affairs and Fisheries, Korea. The chemical and bioassay analyses were performed at
University and were supported by a grant from the John P. and Susan E. Giesy Charitable Foundation to the Aquatic Toxicology
ichigan State University.
ing author. Fax: +822 872 0311.
ess: [email protected] (J.S. Khim).
ARTICLE IN PRESSC.-H. Koh et al. / Ecotoxicology and Environmental Safety 61 (2005) 366–379 367
1. Introduction
Contamination of the coastal environment by traceorganic contaminants is of increasing concern. Persis-tent organic pollutants (POPs), such as organochlorine(OC) pesticides and polychlorinated biphenyls (PCBs),are ubiquitous environmental pollutants in coastalmarine environments (Loganathan and Kannan, 1994).Recently, several studies have reported the distributionand fate of POPs in Korean coastal environments (Kimet al., 2002; Koh et al., 2002; Oh et al., 2003).Considering the dependence of coastal communities onmarine resources for food, contamination by POPs inKorean coastal areas is of great concern. Although theproduction and/or use of several classes of POPs such asPCBs and OC pesticides have been banned in Koreasince the 1970s, these contaminants continue to persistin the environment and enter into the food chain (Kimet al., 2002; Koh et al., 2002).Some POPs can disrupt normal endocrine function
both in aquatic organisms and in humans. At least someof these adverse effects are mediated by aryl hydro-carbon receptor (AhR)- and/or estrogen receptor (ER)-dependent mechanisms (Behnisch et al., 2001; Giesy etal., 2002). Bioassays capable of detecting compoundsthat act through AhR- and ER-mediated mechanismsare useful for the characterization and evaluation of thetoxic potential of sediments and other complex environ-mental matrices. Earlier studies conducted by our groupreported dioxin-like and estrogenic activities associatedwith sediment and surface water from several locationsalong the Korean coast (Khim et al., 1999a; Koh et al.,2002, 2004). In addition, chemical analyses wereperformed to quantify concentrations of selected targetcontaminants, including POPs and potential xenoestro-gens, including polycyclic aromatic hydrocarbons(PAHs), alkylphenols (APs), and bisphenol A (BPA),in the sediment and water extracts. Complementary useof bioassays and instrumental analyses provided a morecomplete characterization of potential AhR- and ER-active compounds in environmental samples.Based on the results of past studies, industrial
complexes (ICs) and urban areas located near coastalareas have been found to be major sources of organiccontamination of coastal waters in Korea (Koh et al.,2002). Some of these pollutants, including xenoestro-gens, are introduced into the coastal waters from riversor streams via discharges of industrial waste, municipalsewage, and urban and agricultural runoff. Thus,coastal contamination by organic compounds is influ-enced by point and/or non-point sources from inlandregions. The present study investigated sediments ofLake Shihwa and Masan Bay to determine the pointsources of POPs and xenoestrogens that were identifiedduring more general surveys conducted previously nearthese highly industrialized urban areas. (Khim et al.,
1999a, b). In addition, sediments collected from Kwan-gyang Bay, Korea, were analyzed to characterize dioxin-like and estrogenic activities associated with open baysediment. The objectives of the present study were (1) todetermine the spatial distribution of trace organiccontaminants in sediment from the inland areas of LakeShihwa and Masan Bay as well as open bay locations inKwangyang Bay using instrumental analyses, (2) toelucidate point or non-point sources by applying aprincipal component analysis (PCA), and (3) tocharacterize the integrated potency of AhR- and ER-active compounds associated with sediment samplesusing in vitro bioassays. Where appropriate, massbalance analyses were used to help determine whetherknown chemical components, determined by chemicalanalysis, could reasonably account for the in vitrobioassay responses observed (Sanderson and Giesy,1998; Villeneuve et al., 2000).
2. Materials and methods
2.1. Study areas
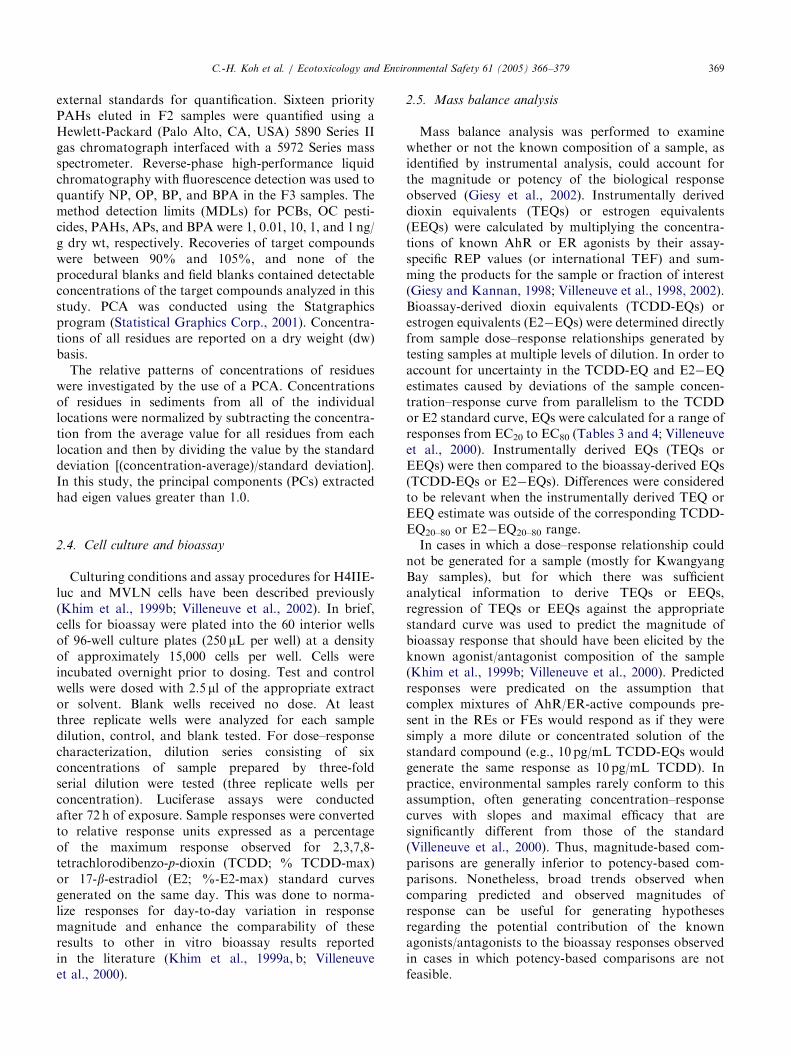
The study areas included Lake Shihwa, Masan Bay,and Kwangyang Bay, which are located along Koreancoasts (Fig. 1). Lake Shihwa is an artificial lake createdby the construction of 12.7 km of sea dike in 1994. It wassupposed to be used as a freshwater reservoir, but due toserious environmental deterioration, it was recentlymade into a saltwater lake by opening of the water gateinto Kyeonggi Bay. Several ICs and densely populatedcities are situated along the northern shore of the lake.The area south of the lake is predominantly agriculturallands. Large amounts of industrial wastewater(3� 105 ton/day) from inland cities (Shiheung andAnsan) are discharged into the lake via several streamsand creeks. Masan Bay, located on the southeast coast,is a long and narrow inlet of semienclosed bay, wherethe Masan Free Trade Zone and Changwon IC aresituated. Due to slow mixing with seawater (10 cm/s)and the long residence time (10–12 h) of wastewater(0.5� 105 ton/day), the bay serves as a reservoir ofvarious contaminants. Kwangyang Bay, located on thesouth coast, is a semienclosed bay adjacent to the SouthSea. With an average of just 4% tidal exchange volume,the western part of Kwangyang Bay is hydrologicallystatic. Kwangyang Bay opens to the South Sea and is amesotidal environment with a tidal amplitude of 2m onaverage. Posco and Yeocheon ICs are located in thenorthern and southern part, respectively.
2.2. Sample collection and preparation
Sediment samples were collected from Lake Shihwa(n ¼ 8), Masan Bay (n ¼ 8), and Kwangyang Bay

ARTICLE IN PRESS
Kyeonggi BayShiheung
Ansan
LakeShihwa
DaebuIs.
Hwaseong
Kwangyang
KwangyangBay
Posco IC
S1
S2S4
S3
S7S5
S6S8
ICs
0 3 km
SeoulEastSea
WestSea
South Sea
KOREA
N
126° 50' E
37° 4
0' N
Yeosu
Namhae
Myo Is.
0 3 km 0 3 km
K3
K2 K4K8
K6
K9
K11
M4 M3M5
M7 M2M6M8
M1K10
K7K1
K5 ICs
Masan
Changwon
ChinhaeMasan Bay
ICs
dike
Fig. 1. Map of the Lake Shihwa (S1–S8), Masan Bay (M1–M8), and Kwangyang Bay (K1–K11) sampling sites, Korea.
C.-H. Koh et al. / Ecotoxicology and Environmental Safety 61 (2005) 366–379368
(n ¼ 11) in October 2001, November 2000, and Febru-ary 2001, respectively (Fig. 1). Sampling was designed todetermine potential sources of contaminants from river,inland, and marine environments. A global positioningsystem was employed to identify the precise location ofeach site. River and coastal inland sediment sampleswere collected by shovel and spatula, and marinesediment samples were collected aboard ship using aVan Veen grab sampler (25� 40� 30 cm). After collec-tion, any pebbles and twigs were removed beforesamples were freeze-dried and ground with a mortarand pestle. Samples were stored in precleaned, high-density polyethylene bottles at �20 1C until extraction.The total organic carbon (TOC) was analyzed for thesediment samples, allowing the concentrations to benormalized to TOC.Detailed descriptions of the extraction and fractiona-
tion procedures have been presented elsewhere (Khim etal., 1999c; Kannan et al., 2003). Briefly, 40 g of sedimentwere Soxhlet extracted for 20 h using dichloromethane(DCM; Burdick & Jackson, Muskegon, MI, USA) andconcentrated using a rotary evaporator. Extracts werethen treated with acid-activated copper granules toremove sulfur and finally concentrated to 2mL.Aliquots of 1mL Soxhlet raw extracts (REs) werepassed through 10 g of activated Florisil (60–100 meshsize; Sigma Chemical Co., St. Louis, MO, USA) packedin a glass column (10mm i.d.) for clean-up and
fractionation. The first fraction (F1), which was elutedwith 100mL of hexane (Burdick & Jackson), containedPCBs, hexachlorobenzene (HCB), and p,p0-DDE. Re-maining OC pesticides, such as hexachlorocyclohexaneisomers (HCHs), chlordanes (CHLs), p,p0-DDD and-DDT, and PAHs, were eluted in the second fraction(F2) using 100mL of 20% DCM in hexane. APs such asnonylphenol (NP), octylphenol (OP), butylphenol (BP),and BPA were eluted in the third fraction (F3) with100mL of 50% DCM in methanol (Burdick & Jackson).Three fractionated extracts (FEs) were concentrated to1mL and used for instrumental quantification. One-milliliter aliquots of three FEs (F1, F2, and F3) as wellas 1mL of REs were allocated for in vitro bioassayanalysis to determine the dioxin-like (H4IIE-luc cellbioassay) and estrogenic (MVLN cell bioassay) activitiesassociated with each fraction.
2.3. Instrumental analysis
Fractions F1 and F2, containing PCBs and OCpesticides, were analyzed using a gas chromatograph(Perkin-Elmer Series 600, Palo Alto, CA, USA)equipped with a 63Ni electron capture detector. Anequivalent mixture of 98 individual PCB congeners(AccuStandard, New Haven, CT, USA) with knowncomposition and content and OC pesticide mixture(CLP-023R, CLP-024R, AccuStandard) were used as
ARTICLE IN PRESSC.-H. Koh et al. / Ecotoxicology and Environmental Safety 61 (2005) 366–379 369
external standards for quantification. Sixteen priorityPAHs eluted in F2 samples were quantified using aHewlett-Packard (Palo Alto, CA, USA) 5890 Series IIgas chromatograph interfaced with a 5972 Series massspectrometer. Reverse-phase high-performance liquidchromatography with fluorescence detection was used toquantify NP, OP, BP, and BPA in the F3 samples. Themethod detection limits (MDLs) for PCBs, OC pesti-cides, PAHs, APs, and BPA were 1, 0.01, 10, 1, and 1 ng/g dry wt, respectively. Recoveries of target compoundswere between 90% and 105%, and none of theprocedural blanks and field blanks contained detectableconcentrations of the target compounds analyzed in thisstudy. PCA was conducted using the Statgraphicsprogram (Statistical Graphics Corp., 2001). Concentra-tions of all residues are reported on a dry weight (dw)basis.The relative patterns of concentrations of residues
were investigated by the use of a PCA. Concentrationsof residues in sediments from all of the individuallocations were normalized by subtracting the concentra-tion from the average value for all residues from eachlocation and then by dividing the value by the standarddeviation [(concentration-average)/standard deviation].In this study, the principal components (PCs) extractedhad eigen values greater than 1.0.
2.4. Cell culture and bioassay
Culturing conditions and assay procedures for H4IIE-luc and MVLN cells have been described previously(Khim et al., 1999b; Villeneuve et al., 2002). In brief,cells for bioassay were plated into the 60 interior wellsof 96-well culture plates (250 mL per well) at a densityof approximately 15,000 cells per well. Cells wereincubated overnight prior to dosing. Test and controlwells were dosed with 2.5 ml of the appropriate extractor solvent. Blank wells received no dose. At leastthree replicate wells were analyzed for each sampledilution, control, and blank tested. For dose–responsecharacterization, dilution series consisting of sixconcentrations of sample prepared by three-foldserial dilution were tested (three replicate wells perconcentration). Luciferase assays were conductedafter 72 h of exposure. Sample responses were convertedto relative response units expressed as a percentageof the maximum response observed for 2,3,7,8-tetrachlorodibenzo-p-dioxin (TCDD; % TCDD-max)or 17-b-estradiol (E2; %-E2-max) standard curvesgenerated on the same day. This was done to norma-lize responses for day-to-day variation in responsemagnitude and enhance the comparability of theseresults to other in vitro bioassay results reportedin the literature (Khim et al., 1999a, b; Villeneuveet al., 2000).
2.5. Mass balance analysis
Mass balance analysis was performed to examinewhether or not the known composition of a sample, asidentified by instrumental analysis, could account forthe magnitude or potency of the biological responseobserved (Giesy et al., 2002). Instrumentally deriveddioxin equivalents (TEQs) or estrogen equivalents(EEQs) were calculated by multiplying the concentra-tions of known AhR or ER agonists by their assay-specific REP values (or international TEF) and sum-ming the products for the sample or fraction of interest(Giesy and Kannan, 1998; Villeneuve et al., 1998, 2002).Bioassay-derived dioxin equivalents (TCDD-EQs) orestrogen equivalents (E2�EQs) were determined directlyfrom sample dose–response relationships generated bytesting samples at multiple levels of dilution. In order toaccount for uncertainty in the TCDD-EQ and E2�EQestimates caused by deviations of the sample concen-tration–response curve from parallelism to the TCDDor E2 standard curve, EQs were calculated for a range ofresponses from EC20 to EC80 (Tables 3 and 4; Villeneuveet al., 2000). Instrumentally derived EQs (TEQs orEEQs) were then compared to the bioassay-derived EQs(TCDD-EQs or E2�EQs). Differences were consideredto be relevant when the instrumentally derived TEQ orEEQ estimate was outside of the corresponding TCDD-EQ20–80 or E2�EQ20–80 range.In cases in which a dose–response relationship could
not be generated for a sample (mostly for KwangyangBay samples), but for which there was sufficientanalytical information to derive TEQs or EEQs,regression of TEQs or EEQs against the appropriatestandard curve was used to predict the magnitude ofbioassay response that should have been elicited by theknown agonist/antagonist composition of the sample(Khim et al., 1999b; Villeneuve et al., 2000). Predictedresponses were predicated on the assumption thatcomplex mixtures of AhR/ER-active compounds pre-sent in the REs or FEs would respond as if they weresimply a more dilute or concentrated solution of thestandard compound (e.g., 10 pg/mL TCDD-EQs wouldgenerate the same response as 10 pg/mL TCDD). Inpractice, environmental samples rarely conform to thisassumption, often generating concentration–responsecurves with slopes and maximal efficacy that aresignificantly different from those of the standard(Villeneuve et al., 2000). Thus, magnitude-based com-parisons are generally inferior to potency-based com-parisons. Nonetheless, broad trends observed whencomparing predicted and observed magnitudes ofresponse can be useful for generating hypothesesregarding the potential contribution of the knownagonists/antagonists to the bioassay responses observedin cases in which potency-based comparisons are notfeasible.

ARTICLE IN PRESSC.-H. Koh et al. / Ecotoxicology and Environmental Safety 61 (2005) 366–379370
3. Results
3.1. Instrumental analysis
TOC contents were different among sediments fromLake Shihwa, Masan Bay, and Kwangyang Bay.Generally, Masan Bay sediment contained relativelygreater TOC contents than sediments from KwangyangBay and Lake Shihwa. Although the mean TOC contentwas generally small, some locations (S3 and S4) in LakeShihwa had a TOC content as great as 2.11% and1.78% (Table 1). These locations also contained thegreatest concentrations of PCBs and APs. Generally,upstream locations of the river or stream containedlesser TOC contents, while sediments from middle tolower reaches contained greater TOC concentrations.TOC concentrations varied more in inland sediments
Table 1
Concentrations (ng/g dry wt) of polychlorinated biphenyls (PCBs), organoc
hydrocarbons (PAHs), alkylphenols (APs), and bisphenol A (BPA) in surfic
from the open ocean of Kwangyang Bay, Korea
Location PCBs HCB HCHs CHLs DDTs
Lake Shihwa
S1 15.6 0.69 2.45 0.12 0.35
S2 9.35 0.75 1.46 0.06 0.17
S3 126 3.49 10.7 0.22 2.14
S4 47.2 2.80 0.97 0.04 0.71
S5 19.9 0.94 2.76 0.03 0.40
S6 10.9 0.10 0.55 o0.01 0.22
S7 9.37 0.09 2.17 o0.01 0.15
S8 9.05 0.18 0.88 0.02 0.28
Mean 30.9 1.13 2.74 0.08 0.55
Masan Bay
M1 9.12 0.11 0.01 o0.01 0.23
M2 41.9 0.12 0.04 0.02 0.32
M3 92.1 0.22 17.4 0.03 0.14
M4 11.7 0.61 7.87 0.04 0.28
M5 46.1 0.24 13.0 0.28 5.66
M6 40.9 0.10 0.64 o0.01 0.15
M7 30.9 0.72 44.4 0.33 1.48
M8 11.8 0.32 6.50 o0.01 0.49
Mean 35.6 0.30 11.2 0.14 1.09
Kwangyang Bay
K1 o1.00 0.47 0.02 o0.01 0.06
K2 o1.00 0.08 0.59 o0.01 0.12
K3 o1.00 0.02 0.09 o0.01 0.03
K4 o1.00 0.03 o0.01 o0.01 0.05
K5 o1.00 0.10 0.16 0.05 0.06
K6 o1.00 0.05 0.91 0.01 0.01
K7 o1.00 0.03 0.29 o0.01 0.10
K8 o1.00 0.07 0.27 o0.01 0.14
K9 o1.00 0.02 0.10 o0.01 0.11
K10 4.67 0.04 0.24 o0.01 0.09
K11 o1.00 o0.01 0.11 o0.01 0.02
Mean 4.67 0.09 0.28 0.03 0.07
PCBs, sum of 98 individual congeners; HCB, hexachlorobenzene; HCHs, a-+DDE+p,p0-DDD +p,p0-DDT; PAHs, sum of 16 priority components; NP,
TOC, total organic carbon content (%); Mean indicates the average of each
from Lake Shihwa and Masan Bay than in marinesediment from Kwangyang Bay.A significant relationship between TOC content and
various target organic compounds measured in sedimentfrom Lake Shihwa was observed (Table 2). Thecorrelation between TOC content and NP (r ¼ 0:99,Po0:01) was the strongest, whereas TOC content wasnot significantly correlated with CHLs and BP. Incontrast, poor correlation between TOCs and targetorganic compounds was found for Masan Bay andKwangyang Bay sediment. Only PAH concentrations(r ¼ 0:68, Po0:05) were correlated with TOC content incoastal marine sediment from Masan Bay. Although thesources of organic contaminants in Lake Shihwa arelocalized, the relatively long hydraulic residence time inthe lotic system influences the affinities of lipophilicorganic contaminants for sediment (Khim et al., 1999a).
hlorine pesticides (HCB, HCHs, CHLs, DDTs), polycyclic aromatic
ial sediment from inland regions of Lake Shihwa and Masan Bay and
PAHs NP OP BP BPA TOC
611 1640 42.8 74.8 47.5 0.77
121 254 6.10 21.9 26.2 0.35
643 4930 94.2 23.6 74.3 2.11
292 3640 99.7 41.1 115 1.78
80.2 949 42.6 8.57 o1.00 0.52
25.8 667 20.9 1.15 13.2 0.58
12.8 369 5.27 1.08 17.1 0.48
24.9 622 8.59 o1.00 31.0 0.49
226 1634 40.0 24.6 46.3 0.89
33.4 184 3.00 7.20 o1.00 0.56
128 152 2.44 2.91 o1.00 1.48
481 514 7.43 o1.00 o1.00 5.39
186 1070 17.5 12.5 18.1 2.24
351 179 1.56 3.04 277 2.09
48.3 84.7 1.54 5.93 222 0.66
413 526 4.96 6.92 54.6 2.63
85.4 446 8.32 20.0 o1.00 3.67
216 394 5.85 8.36 143 2.34
10.1 19.9 o1.00 o1.00 o1.00 0.83
28.2 13.4 o1.00 o1.00 o1.00 1.30
19.6 21.6 o1.00 o1.00 o1.00 1.13
17.8 11.5 o1.00 o1.00 o1.00 1.14
25.2 35.0 1.36 o1.00 o1.00 1.20
21.6 21.0 1.17 o1.00 o1.00 1.21
105 10.8 o1.00 o1.00 o1.00 0.65
74.9 11.8 o1.00 o1.00 o1.00 1.26
36.7 9.9 o1.00 o1.00 o1.00 1.08
37.2 33.4 1.81 o1.00 o1.00 1.31
24.5 12.3 o1.00 o1.00 28.3 0.57
36.4 18.2 1.44 o1.00 28.3 1.06
b-+g-hexachlorocyclohexanes; CHLs, a-+g-chlordanes; DDTs, p,p0-
nonylphenol; h OP, octylphenol; BP, butylphenol; BPA, bisphenol A;
class of compounds detected.

ARTICLE IN PRESS
Table 2
Relationships (r) between total organic carbon content and concentra-
tions of target organic compounds in sediment from the three study
sites
Compound Lake Shihwa Masan Bay Kwangyang Bay
PCBs 0.90** 0.56 —
HCB 0.96** 0.27 0.37 (-)
HCHs 0.68* 0.42 0.39
CHLs 0.64 0.22 (-) 0.06 (-)
DDTs 0.88** 0.04 (-) 0.28
PAHs 0.70* 0.68* 0.23 (-)
NP 0.99** 0.43 0.40
OP 0.94** 0.38 0.46
BP 0.29 0.67 —
BPA 0.86** 0.55 (-) —
PCBs, sum of 98 individual congeners; HCB ¼ hexachlorobenzene;
HCHs, a-+b-+g-hexachlorocyclohexanes; CHLs, a-+g-chlordanes;DDTs, p,p0-DDE+p,p0-DDD+ p,p0-DDT; PAHs, sum of 16 priority
components, NP, nonylphenol; OP, octylphenol; BP, butylphenol;
BPA, bisphenol A, (-) indicates negative correlations between
variables.
* po0.01; **po0.05.
C.-H. Koh et al. / Ecotoxicology and Environmental Safety 61 (2005) 366–379 371
PCBs were found in all of the sediment samples fromstreams and coastal inland areas in Lake Shihwa andMasan Bay, where total PCB concentrations were9.05–47.2 (mean, 30.9) and 9.12–92.1 (mean, 35.6) ng/gdw, respectively (Table 1). Sediment from location S3 inthe middle of Shiheung Stream contained the greatestPCB concentrations. This suggests the presence of pointsources of PCBs in Shiheung Stream. Paper mill, silk,mechanical, and electronic factories located near S3 arepotential sources. Similarly, in Masan Bay sedimentPCB concentrations reflected spatial heterogeneity,which indicates point sources. The greatest concentra-tions of PCBs were observed at locations M2, M3, M5,and M6, all of which were near ICs, whereas inKwangyang Bay only one location (K10) near PoscoIC contained detectable concentrations of PCBs(4.67 ng/g dw) (Table 1). Although several ICs arelocated in the northern and southern parts of Kwan-gyang Bay (mainly steel manufacturing), PCB concen-trations were not great in sediments collected near thoselocations.Among different OC pesticides analyzed, HCH
concentrations in sediments were the greatest, account-ing for over 60% of total OC pesticide concentrations.The relative abundance of OC pesticides wasHCHs4DDTs4HCB4CHLs (Table 1). OC pesticidesconcentrations were generally 1–2 orders of magnitudelower than PCB concentrations, except at location M7in Masan Bay, where the HCH concentration (44.4 ng/g dw) was greater than that of PCBs (30.9 ng/g dw).Concentrations of DDTs, HCB, and CHLs were, onaverage, less than 1.0 ng/g dw (Table 1). The greatestconcentrations of HCB, HCHs, CHLs, and DDTs were
found at location S3 in Lake Shihwa, where thesedimentary PCB concentration was also the greatest(126 ng/g dw).PAHs were detected in all of the locations from
river to marine sediment in Lake Shihwa, MasanBay, and Kwangyang Bay (Table 1). PAH concentra-tions in river sediment from Lake Shihwa and MasanBay were greater than those in marine sediment fromKwangyang Bay by an order of magnitude. The greatestconcentrations of total PAHs were found at locationsS3 (643 ng/g dw) and M3 (481 ng/g dw) in Lake Shihwaand Masan Bay, respectively (Table 1). Sedimentsamples from those locations contained the greatestconcentrations of PCBs as well, which indicatesthe presence of localized sources. PAH concentrationsin Shiheung Stream sediment were greatest atlocation S1 (611 ng/g dw) and S5 (80.2 ng/g dw).Concentrations at the other downstream locations,S6 and S8, in Lake Shihwa were near the MDL(Table 1). This agrees well with the results of an earlierstudy, which reported that lesser concentrationsof PAHs (16.9–30.8 ng/g dw) were observed inLake Shihwa sediment (Khim et al., 1999a).Marine sediment from Kwangyang Bay containeddetectable concentrations of PAHs (mean, 36.4 ng/g dw), but their concentrations were about six-fold lessthan those in Lake Shihwa (mean, 226 ng/g dw) andMasan Bay (mean, 216 ng/g dw) (Table 1). Whenexpressed as TEQs, the TEQPAH (mean, 0.49 pg TEQ/g dw) in Kwangyang Bay was approximately three- andfour-fold less than those in Lake Shihwa and MasanBay (Table 3).APs were detected in sediment samples from Lake
Shihwa and Masan Bay, and NP contributed more than90% of the total AP concentrations (Figs. 2 and 3). NP,OP, and BP were found in nearly all of the locations inLake Shihwa and Masan Bay, and the greatestconcentrations were found in river sediment from LakeShihwa at 4930, 99.7, and 74.8 ng/g dw for NP, OP, andBP, respectively (Table 1). The marine sediment inKwangyang Bay contained considerably lower concen-trations of NP (mean, 18.2 ng/g dw) and OP (mean,1.44 ng/g dw). Furthermore, BP was not detected insediment from any location in Kwangyang Bay. Thisdifference in the distributions of APs between LakeShihwa (or Masan Bay) and Kwangyang Bay reflects thesize and scale of municipal and/or industrial activities inthese areas.BPA, one of the suspected xenoestrogens, was also
detected in river and coastal inland sediment and rangedfrom o1.00 to 277 ng/g dw (Table 1). Coastal marinesediment collected at locations M5 and M6 (Masan Bay)contained high concentrations of BPA of 277 and222 ng/g dw, respectively. Polycarbonate plastics andsynthetic resins from various ICs are likely sources ofthe BPA found in Masan Bay.
ARTICLE IN PRESS
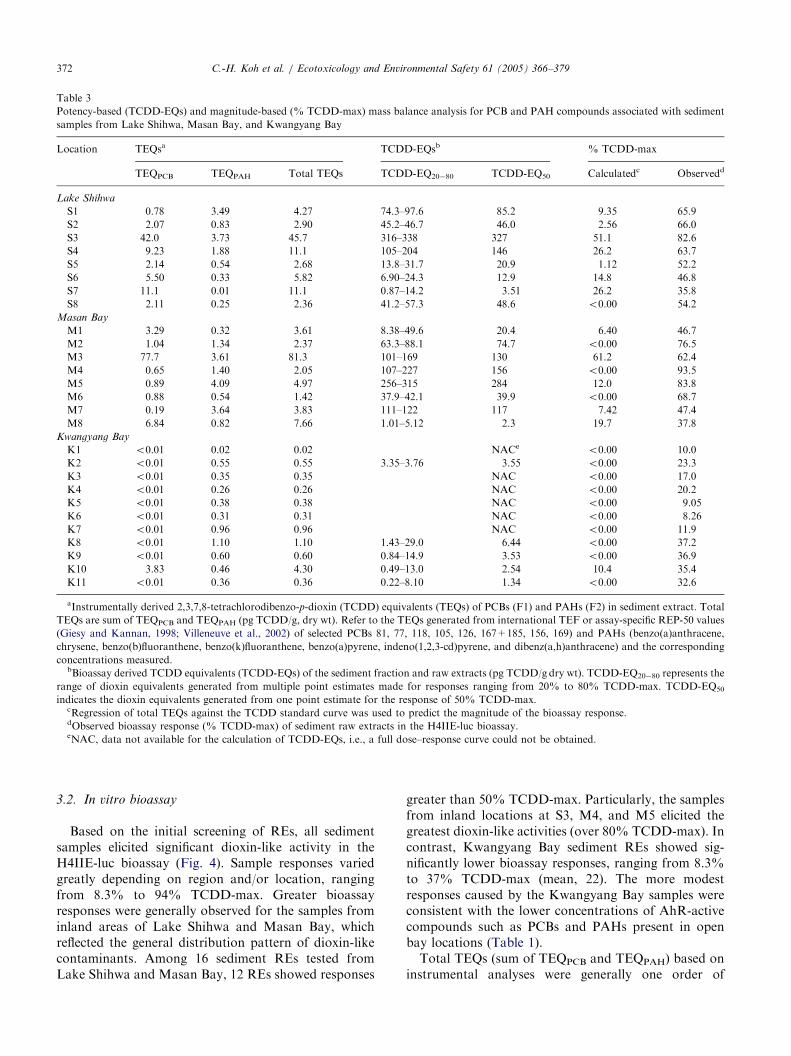
Table 3
Potency-based (TCDD-EQs) and magnitude-based (% TCDD-max) mass balance analysis for PCB and PAH compounds associated with sediment
samples from Lake Shihwa, Masan Bay, and Kwangyang Bay
Location TEQsa TCDD-EQsb % TCDD-max
TEQPCB TEQPAH Total TEQs TCDD-EQ20�80 TCDD-EQ50 Calculatedc Observedd
Lake Shihwa
S1 0.78 3.49 4.27 74.3–97.6 85.2 9.35 65.9
S2 2.07 0.83 2.90 45.2–46.7 46.0 2.56 66.0
S3 42.0 3.73 45.7 316–338 327 51.1 82.6
S4 9.23 1.88 11.1 105–204 146 26.2 63.7
S5 2.14 0.54 2.68 13.8–31.7 20.9 1.12 52.2
S6 5.50 0.33 5.82 6.90–24.3 12.9 14.8 46.8
S7 11.1 0.01 11.1 0.87–14.2 3.51 26.2 35.8
S8 2.11 0.25 2.36 41.2–57.3 48.6 o0.00 54.2
Masan Bay
M1 3.29 0.32 3.61 8.38–49.6 20.4 6.40 46.7
M2 1.04 1.34 2.37 63.3–88.1 74.7 o0.00 76.5
M3 77.7 3.61 81.3 101–169 130 61.2 62.4
M4 0.65 1.40 2.05 107–227 156 o0.00 93.5
M5 0.89 4.09 4.97 256–315 284 12.0 83.8
M6 0.88 0.54 1.42 37.9–42.1 39.9 o0.00 68.7
M7 0.19 3.64 3.83 111–122 117 7.42 47.4
M8 6.84 0.82 7.66 1.01–5.12 2.3 19.7 37.8
Kwangyang Bay
K1 o0.01 0.02 0.02 NACe o0.00 10.0
K2 o0.01 0.55 0.55 3.35–3.76 3.55 o0.00 23.3
K3 o0.01 0.35 0.35 NAC o0.00 17.0
K4 o0.01 0.26 0.26 NAC o0.00 20.2
K5 o0.01 0.38 0.38 NAC o0.00 9.05
K6 o0.01 0.31 0.31 NAC o0.00 8.26
K7 o0.01 0.96 0.96 NAC o0.00 11.9
K8 o0.01 1.10 1.10 1.43–29.0 6.44 o0.00 37.2
K9 o0.01 0.60 0.60 0.84–14.9 3.53 o0.00 36.9
K10 3.83 0.46 4.30 0.49–13.0 2.54 10.4 35.4
K11 o0.01 0.36 0.36 0.22–8.10 1.34 o0.00 32.6
aInstrumentally derived 2,3,7,8-tetrachlorodibenzo-p-dioxin (TCDD) equivalents (TEQs) of PCBs (F1) and PAHs (F2) in sediment extract. Total
TEQs are sum of TEQPCB and TEQPAH (pg TCDD/g, dry wt). Refer to the TEQs generated from international TEF or assay-specific REP-50 values
(Giesy and Kannan, 1998; Villeneuve et al., 2002) of selected PCBs 81, 77, 118, 105, 126, 167+185, 156, 169) and PAHs (benzo(a)anthracene,
chrysene, benzo(b)fluoranthene, benzo(k)fluoranthene, benzo(a)pyrene, indeno(1,2,3-cd)pyrene, and dibenz(a,h)anthracene) and the corresponding
concentrations measured.bBioassay derived TCDD equivalents (TCDD-EQs) of the sediment fraction and raw extracts (pg TCDD/g dry wt). TCDD-EQ20�80 represents the
range of dioxin equivalents generated from multiple point estimates made for responses ranging from 20% to 80% TCDD-max. TCDD-EQ50
indicates the dioxin equivalents generated from one point estimate for the response of 50% TCDD-max.cRegression of total TEQs against the TCDD standard curve was used to predict the magnitude of the bioassay response.dObserved bioassay response (% TCDD-max) of sediment raw extracts in the H4IIE-luc bioassay.eNAC, data not available for the calculation of TCDD-EQs, i.e., a full dose–response curve could not be obtained.
C.-H. Koh et al. / Ecotoxicology and Environmental Safety 61 (2005) 366–379372
3.2. In vitro bioassay
Based on the initial screening of REs, all sedimentsamples elicited significant dioxin-like activity in theH4IIE-luc bioassay (Fig. 4). Sample responses variedgreatly depending on region and/or location, rangingfrom 8.3% to 94% TCDD-max. Greater bioassayresponses were generally observed for the samples frominland areas of Lake Shihwa and Masan Bay, whichreflected the general distribution pattern of dioxin-likecontaminants. Among 16 sediment REs tested fromLake Shihwa and Masan Bay, 12 REs showed responses
greater than 50% TCDD-max. Particularly, the samplesfrom inland locations at S3, M4, and M5 elicited thegreatest dioxin-like activities (over 80% TCDD-max). Incontrast, Kwangyang Bay sediment REs showed sig-nificantly lower bioassay responses, ranging from 8.3%to 37% TCDD-max (mean, 22). The more modestresponses caused by the Kwangyang Bay samples wereconsistent with the lower concentrations of AhR-activecompounds such as PCBs and PAHs present in openbay locations (Table 1).Total TEQs (sum of TEQPCB and TEQPAH) based on
instrumental analyses were generally one order of

ARTICLE IN PRESS
1.5%
0.2%
11.3%
87%
53%
5%
41%
Jeju Is.
1%
% Composition
PCBsOC pesticides
PAHsAlkylphenols
Lake shihwa(n=8)
Kwangyang Bay(n=11)
Masan Bay(n=8)
68%
26%
2%
4%
KOREA
Fig. 2. The chemical composition of target organic contaminants in sediments from Lake Shihwa, Masan Bay, and Kwangyang Bay, Korea. PCBs
are the sum of 98 individual PCB congeners; OC pesticides include hexachlorobenzene (HCB), hexachlorocyclohexane isomers (HCHs), chlordanes
(CHLs), and DDT and its derivatives (DDTs); PAHs are the sum of 16 priority PAHs; and alkylphenols represent the sum of nonylphenol (NP),
octylphenol, (OP), butylphenol (BP), and bisphenol A (BPA).
Lake Shihwa(n=8)
Masan Bay(n=8)
Kwangyang Bay(n=11)
Mean(n=27)
0 500 1000
Concentration (ng/g, dry wt)
1500 2000
OP BP BPANP
Fig. 3. Mean composition (ng/g dry wt) of nonylphenol (NP),
octylphenol (OP), butylphenol (BP), and bisphenol A (BPA) among
total alkylphenols in sediments from Lake Shihwa, Masan Bay, and
Kwangyang Bay, Korea.
C.-H. Koh et al. / Ecotoxicology and Environmental Safety 61 (2005) 366–379 373
magnitude lower than bioassay-derived TCDD-EQs.Only three locations (S7, M8, and K10) containedgreater concentrations of total TEQs than of TCDD-EQs, which indicated that the known AhR agonists inthose sediment REs could fully account for the bioassayresponses observed in the H4IIE-luc bioassay (Table 3).On average, the known concentrations of AhR-active
compounds present in sediment extracts accounted forapproximately 30% of the total bioassay responsesobserved. Based on the total TEQs concentrationspresent in the samples, 13 of 27 REs analyzed shouldhave yielded a significant H4IIE-luc response. Each ofthose significant responses was predicted to be between1.1% and 61% TCDD-max (Table 3). However, theother 14 samples (primarily from Kwangyang Bay),which were not predicted to elicit significant responses,induced significant dioxin-like activities in all cases.These results strongly suggested that chemical analysisalone, based on the target analytes identified in thisstudy, underestimated the total dioxin-like potency ofcompounds associated with sediment from these Koreancoastal areas.All of the REs from Lake Shihwa and Masan Bay
yielded significant estrogenic responses in the MVLNbioassay (Fig. 5). Among the three areas surveyed, REsof sediment from Lake Shihwa contained the greatestconcentrations of EEQs (Table 4) and induced thegreatest estrogenic activities (Fig. 5). Based on theinstrumental determination, the estrogenic NP, OP, andBPA concentrations in Lake Shihwa sediment werefound to be as great as 4930, 99.7, and 115 ng/g dw,

ARTICLE IN PRESS
120
100
80
60
40
20
0
120
100
80
%-T
CD
D-m
ax.
60
40
20
0
120
100
80
60
40
20
0
S1 S2 S3 S4 S5 S6 S7 S8
M1 M2 M3 M4 M5 M6 M7 M8
K1 K2 K3 K4 K5 K6
LocationK7 K8 K9 K10 K11
Lake Shihwa
Masan Bay
Kwangyang BayRE,F1,2,3
sig. level
Fig. 4. Luciferase induction in the H4IIE-luc cell bioassay elicited by
sediment raw extract (RE) and fractionated extracts (FEs; F1, F2, and
F3). The response magnitude is presented as the percentage of the
maximum response observed for a 1500 pm 2,3,7,8-tetrachlorodiben-
zo-p-dioxin standard (% TCDD-max). The horizontal line equals 3 SD
(expressed in % TCDD-max) above the mean solvent control response
(set to 0% TCDD-max).
240
200
160
120
80
40
0
240
%-E
2-m
ax. 200
160
120
80
40
0
240
200
160
120
80
40
0
S1 S2 S3 S4 S5 S6 S7 S8
M1 M2 M3 M4 M5 M6 M7 M8
K1 K2 K3 K4 K5 K6Location
K7 K8 K9 K10 K11
RE,F1,2,3
sig. level
Lake Shihwa
Masan Bay
Kwangyang Bay
Fig. 5. Luciferase induction in the MVLN cell bioassay elicited by
sediment raw extract (RE) and fractionated extracts (FEs; F1, F2, and
F3). The response magnitude is presented as the percentage of the
maximum response observed for a 1000 pm 17-b-estradiol (% E2-
max). The horizontal line equals 3 SD (expressed in % E2-max) above
the mean solvent control response (set to 0% E2-max). Cells that
exhibited an altered or ‘‘stressed’’ morphology (cytotoxicity) are
indicated with (�).
C.-H. Koh et al. / Ecotoxicology and Environmental Safety 61 (2005) 366–379374
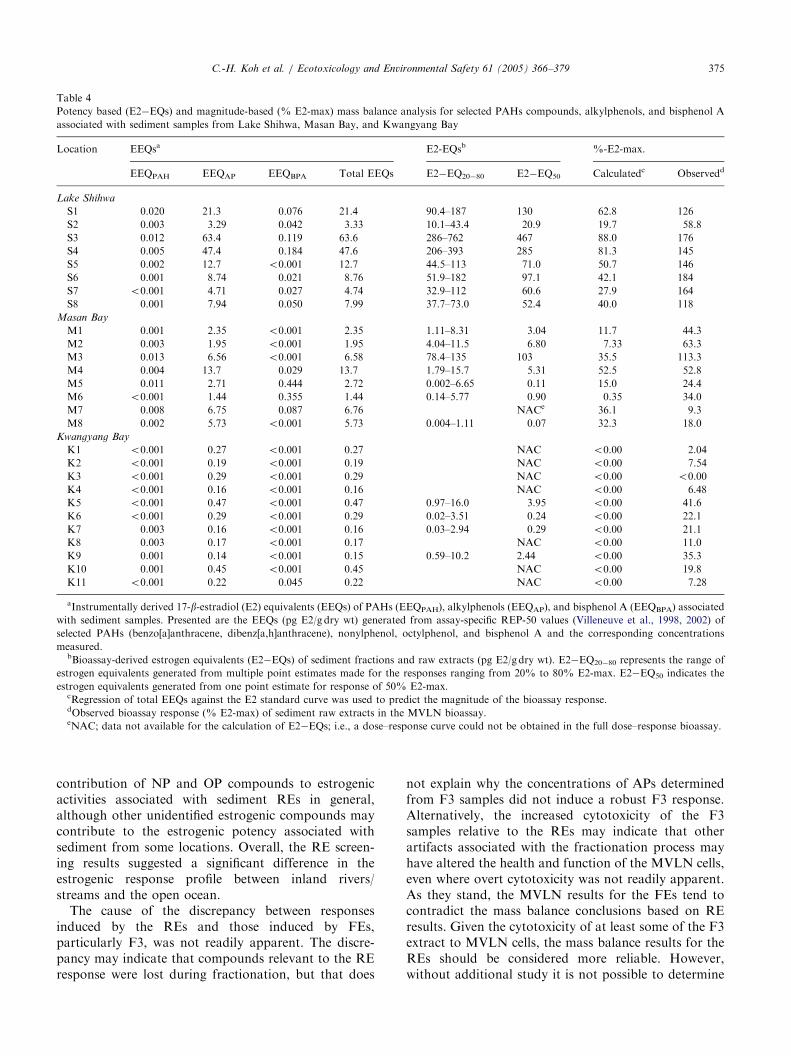
respectively (Table 1). The instrumentally derived EEQsfor Lake Shihwa sediment ranged from 3.3 to 64 pg/g dw, with an average of 21 pgEEQ/g dw (Table 4).These EEQs were predicted to yield a significantresponse of between 19% and 88% E2-max in theMVLN bioassay (Table 4). Significant responses wereobserved, but in all cases they were greater thanpredicted (Table 4). Similarly, E2�EQs determined forLake Shihwa samples were uniformly greater than thecorresponding EEQ estimates (Table 4). These resultssuggest the presence of unidentified estrogenic com-pounds and/or synergistic effects between quantifiedestrogenic compounds detected in Lake Shihwa sedi-ment. The relatively great concentrations of EEQs andE2�EQs in sediment from this area, relative to those inMasan Bay, Kwangyang Bay, and other locationsstudied previously (Khim et al., 1999a, b, 2001; Koh etal., 2002), indicate that Lake Shihwa may be an area ofspecial concern for potential impacts by estrogenicendocrine-disrupting compounds.Masan Bay sediment REs showed significant estro-
genic activities that were more modest than those forobserved for Lake Shihwa sediment REs. The estrogenicresponses of Masan Bay REs varied greatly amonglocations, from 9.3% to 113% E2-max. For all locations
except M2 and M3, EEQ concentrations, calculatedbased on concentrations of estrogenic PAHs, APs, andBPA, were sufficient to reasonably account for theestrogenic potency observed in the MVLN bioassay(EEQEE2�EQ), although the less reliable predictedmagnitude estimates were still generally less thanobserved magnitudes (Table 4). As a whole, the resultssuggest that PAHs, APs, and BPA reasonably accountfor most of the estrogenic activity of the Masan Baysediment extracts, but locations M2 and M3 may receiveadditional inputs of estrogenic compounds that wereunaccounted for in this study.Estrogenic activities associated with Kwangyang Bay
sediment REs were weak. This was in general agreementwith the Lesser concentrations of EEQs detected in openbay locations (Table 4). Nonetheless, REs from 8 of the11 Kwangyang Bay sites induced significant MVLNresponses. The greatest response, 42% E2-max, wasobserved for the RE associated with location K5, nearan IC zone. These results suggest at least some inputs ofestrogenic compounds to the open bay area.The significant correlation (r2 ¼ 0:603, Po0:01)
between estrogenic response and the logarithm ofAPs concentration and the great proportion (99%)of EEQAP to total EEQs suggested a significant
ARTICLE IN PRESS
Table 4
Potency based (E2�EQs) and magnitude-based (% E2-max) mass balance analysis for selected PAHs compounds, alkylphenols, and bisphenol A
associated with sediment samples from Lake Shihwa, Masan Bay, and Kwangyang Bay
Location EEQsa E2-EQsb %-E2-max.
EEQPAH EEQAP EEQBPA Total EEQs E2�EQ20�80 E2�EQ50 Calculatedc Observedd
Lake Shihwa
S1 0.020 21.3 0.076 21.4 90.4–187 130 62.8 126
S2 0.003 3.29 0.042 3.33 10.1–43.4 20.9 19.7 58.8
S3 0.012 63.4 0.119 63.6 286–762 467 88.0 176
S4 0.005 47.4 0.184 47.6 206–393 285 81.3 145
S5 0.002 12.7 o0.001 12.7 44.5–113 71.0 50.7 146
S6 0.001 8.74 0.021 8.76 51.9–182 97.1 42.1 184
S7 o0.001 4.71 0.027 4.74 32.9–112 60.6 27.9 164
S8 0.001 7.94 0.050 7.99 37.7–73.0 52.4 40.0 118
Masan Bay
M1 0.001 2.35 o0.001 2.35 1.11–8.31 3.04 11.7 44.3
M2 0.003 1.95 o0.001 1.95 4.04–11.5 6.80 7.33 63.3
M3 0.013 6.56 o0.001 6.58 78.4–135 103 35.5 113.3
M4 0.004 13.7 0.029 13.7 1.79–15.7 5.31 52.5 52.8
M5 0.011 2.71 0.444 2.72 0.002–6.65 0.11 15.0 24.4
M6 o0.001 1.44 0.355 1.44 0.14–5.77 0.90 0.35 34.0
M7 0.008 6.75 0.087 6.76 NACe 36.1 9.3
M8 0.002 5.73 o0.001 5.73 0.004–1.11 0.07 32.3 18.0
Kwangyang Bay
K1 o0.001 0.27 o0.001 0.27 NAC o0.00 2.04
K2 o0.001 0.19 o0.001 0.19 NAC o0.00 7.54
K3 o0.001 0.29 o0.001 0.29 NAC o0.00 o0.00
K4 o0.001 0.16 o0.001 0.16 NAC o0.00 6.48
K5 o0.001 0.47 o0.001 0.47 0.97–16.0 3.95 o0.00 41.6
K6 o0.001 0.29 o0.001 0.29 0.02–3.51 0.24 o0.00 22.1
K7 0.003 0.16 o0.001 0.16 0.03–2.94 0.29 o0.00 21.1
K8 0.003 0.17 o0.001 0.17 NAC o0.00 11.0
K9 0.001 0.14 o0.001 0.15 0.59–10.2 2.44 o0.00 35.3
K10 0.001 0.45 o0.001 0.45 NAC o0.00 19.8
K11 o0.001 0.22 0.045 0.22 NAC o0.00 7.28
aInstrumentally derived 17-b-estradiol (E2) equivalents (EEQs) of PAHs (EEQPAH), alkylphenols (EEQAP), and bisphenol A (EEQBPA) associated
with sediment samples. Presented are the EEQs (pg E2/g dry wt) generated from assay-specific REP-50 values (Villeneuve et al., 1998, 2002) of
selected PAHs (benzo[a]anthracene, dibenz[a,h]anthracene), nonylphenol, octylphenol, and bisphenol A and the corresponding concentrations
measured.bBioassay-derived estrogen equivalents (E2�EQs) of sediment fractions and raw extracts (pg E2/g dry wt). E2�EQ20�80 represents the range of
estrogen equivalents generated from multiple point estimates made for the responses ranging from 20% to 80% E2-max. E2�EQ50 indicates the
estrogen equivalents generated from one point estimate for response of 50% E2-max.cRegression of total EEQs against the E2 standard curve was used to predict the magnitude of the bioassay response.dObserved bioassay response (% E2-max) of sediment raw extracts in the MVLN bioassay.eNAC; data not available for the calculation of E2�EQs; i.e., a dose–response curve could not be obtained in the full dose–response bioassay.
C.-H. Koh et al. / Ecotoxicology and Environmental Safety 61 (2005) 366–379 375
contribution of NP and OP compounds to estrogenicactivities associated with sediment REs in general,although other unidentified estrogenic compounds maycontribute to the estrogenic potency associated withsediment from some locations. Overall, the RE screen-ing results suggested a significant difference in theestrogenic response profile between inland rivers/streams and the open ocean.The cause of the discrepancy between responses
induced by the REs and those induced by FEs,particularly F3, was not readily apparent. The discre-pancy may indicate that compounds relevant to the REresponse were lost during fractionation, but that does
not explain why the concentrations of APs determinedfrom F3 samples did not induce a robust F3 response.Alternatively, the increased cytotoxicity of the F3samples relative to the REs may indicate that otherartifacts associated with the fractionation process mayhave altered the health and function of the MVLN cells,even where overt cytotoxicity was not readily apparent.As they stand, the MVLN results for the FEs tend tocontradict the mass balance conclusions based on REresults. Given the cytotoxicity of at least some of the F3extract to MVLN cells, the mass balance results for theREs should be considered more reliable. However,without additional study it is not possible to determine

ARTICLE IN PRESSC.-H. Koh et al. / Ecotoxicology and Environmental Safety 61 (2005) 366–379376
which approach provides a more accurate characteriza-tion of causes for the estrogenic activity of these Koreancoastal sediment extracts.
4. Discussion
4.1. Distribution and sources of contaminants
Concentrations of target contaminants measured insediments from the 27 locations varied among locations.In order to detect general spatial patterns in contami-nant distribution, a PCA was performed based on theconcentrations of the measured residues (Table 1).Although PCA extracted three components, whichcollectively accounted for 99.7% of the variability inthe original data, the first two PCs explained 93% of thevariability of the data set (Fig. 6). PC1 accounted for74% of the total variance and was significantlycorrelated with BPA (r ¼ �0:48, Po0:05), TOC(r ¼ 0:25, Po0:01), BP (r ¼ 0:22, Po0:01), HCHs(r ¼ 0:20, Po0:05), and PAHs (r ¼ 0:20, Po0:01).PC2 accounted for 19% of the total variance and wassignificantly correlated with OP (r ¼ �0:52, Po0:01),NP (r ¼ 0:5, Po0:01), HCB (r ¼ �0:43, Po0:01), BP(r ¼ �0:40, Po0:01), and PCBs (r ¼ 0:22, Po0:05).The plot of loading for PC1 against PC2 resulted inthree well-defined clusters (Groups A, B, and C; Fig. 6).Greater scores for PC1 suggest greater concentrations ofTOC, BP, HCHs, and PAHs in samples, but lesser BPAconcentrations, which is inversely correlated with PC1.The small values of PC2 are due to greater concentra-tions of OP, NP, HCB, BP, and PCBs. This suggests
0.37
0.27
0.17
0.07
-0.03
-0.13
-0.23
-0.05 0 0.05 0.10
PC1 (74%)
0.15 0.20 0.25
PC
2 (1
9%)
M6
K7
K2
K8K9
M5
K11 K4
K10K6K3K7K5
M2
K1 S2S1
S3S7 S4,5
S6,8
M8M1,4
M3
BPA TOC, BP, HCHs, PAHs
A
B
C
OP,
NP,
HC
B, B
P, P
CB
s
Fig. 6. Principal component analysis of target organic contaminants
associated with sediments collected from the 27 locations in Lake
Shihwa, Masan Bay, and Kwangyang Bay, Korea. Three well-defined
clusters are represented as Groups A, B, and C, in which principal
components 1 and 2 accounted for 74% and 19% of the variability of
the data set, respectively.
that cluster C is characterized by greater concentrationsof a few of the residues analyzed. All inland locationsfrom Lake Shihwa were grouped in cluster C. Theselocations contained greater concentrations of HCHs,PAHs, BP, TOC, PCBs, HCB, OP, and BP. The sites incluster A were characterized by lesser concentrations ofseveral of the residues analyzed. The relatively strongcorrelations between APs, such as BP, OP, and NP, withscores of either PC1 or PC2 suggest that this class ofcompounds contributed to the majority of the varianceobserved among sampling sites.The majority of PAHs found in sediments contained
three to five rings, and these accounted for over 80% oftotal PAHs. Fluoranthene and pyrene were the pre-dominant compounds, comprising 18% and 19% of thetotal PAHs. The ratios of fluoranthene-to-pyrene (Fluo/Py) in sediments from Lake Shihwa (0.84) and MasanBay (0.92) were generally less than 1.0, suggesting thatthe major PAH sources were petrogenic. In contrast,Fluo/Py ratios in sediments from Kwangyang Baylocations exceeded 1.0 in 6 of the 11 locations, suggestingprimary PAH sources were both petrogenic and pyr-olytic (Kannan et al., 2001). The composition ofindividual PAHs to total PAH concentrations wasexamined by using PCA to identify contaminated sitesand probable sources. PAH concentrations were normal-ized by our logarithmically transforming the data[y0 ¼ log ðy þ 1Þ] before performing PCA. In this study,components that account for more than 10% of the totalvariance were chosen. The first two PCs accounted for89% (PC1 was 77% and PC2 was 12%) of the variationin the profiles of PAH concentrations. The plot of PC1against PC2 clustered the sampling sites into five groups(Fig. 7), where most of the PAHs were significantly
0.40
0.15
K11
S7
K1
K3
K4
M8
M4M2
M5M7 M3
S1S3
M1 S2S4
K10
K9K5
K6K2
K8 K7
S6S8
S5
M6
-0.10
-0.350.08 0.16
PC1 (77%)
0.24 0.32
PC
2 (1
2%)
CD
E
B
A
Fig. 7. Principal component analysis of 16 individual PAHs associated
with sediments collected from the 27 locations in Lake Shihwa, Masan
Bay, and Kwangyang Bay, Korea. Five groups (A–E) were character-
ized by the specific source profiles of PAHs, for which principal
components 1 and 2 accounted for 77% and 12% of the variation in
the profiles of PAH concentrations, respectively.

ARTICLE IN PRESSC.-H. Koh et al. / Ecotoxicology and Environmental Safety 61 (2005) 366–379 377
correlated with PC1 (r ¼ 0:630:90, Po0:01) and PC2(r ¼ �0:76� 0:61, Po0:01). Since all PAHs werepositively correlated with PC1 and negatively correlatedwith PC2, the sampling sites that contained the greatestconcentrations of PAHs clustered within the fourquadrants of the Cartesian system (Fig. 7). Group A(Fig. 7, lower-right cluster) and Group C (Fig. 7, upper-left cluster) contained the greatest and least PAHsconcentrations, respectively. PAH profiles reported inthe literature (Bzdusek et al., 2004; Li et al., 2003) invarious source materials (power plants, gasoline engines,traffic tunnels, etc.) were correlated with the scores ofPC1 (diesel engine, r ¼ 0:75; gasoline engine, r ¼ 0:75),which suggests that automobile traffic is one of the mainsources of PAHs in the sampling sites.APs are degradation products of alkylphenol ethox-
ylates (APEs), which are widely used in cleaningproducts. These contaminants could easily be intro-duced into the river and coastal environments via directdischarge of sewage or municipal wastewater. ICs ofover 4000 factories and densely populated cities (ca. 0.7million) in the Lake Shihwa region discharge largeamounts of industrial and municipal wastewaters daily(0.5� 106 ton/day). A recent study found severe con-tamination by NP in various environmental samplesfrom Lake Shihwa in 2002, where NP concentrations indissolved water, particulates, and sediments were asgreat as 1533 ng/L, 831 ng/L, and 5054 ng/g dw, respec-tively (Li et al., 2004). Thus, sedimentary NP(254–4930 ng/g dw) found in and around Lake Shihwasuggests continuing input of these compounds viastreams and creeks running into the lake. Also, a strongcorrelation between NP and OP (r ¼ 0:95, Po0:01)indicates that their sources are probably related.Tri- to penta-CBs were the major PCB congeners
found in sediments. PCB congeners 18 (2, 20, 5), 40 (2, 20,3, 30), and 91 (2, 20, 3,40, 6) were the predominantisomers from most of the locations. The homologuepattern of PCBs found in Lake Shihwa and Masan Baysuggested the source was technical mixtures such asAroclors 1016 and 1242 (Imamoglu and Christensen,2002). Non-, mono-, and di-ortho PCBs were found atconcentrations ranging from 0.25 to 11.2 ng/g dw, acontribution of 6.5% of the total PCB concentrations onaverage. TEQPCB concentrations in sediments fromLake Shihwa and Masan Bay were estimated to rangefrom 0.19 to 77.7 pg/g dw, whereas those from Kwan-gyang Bay were mostly less than 0.01 pg/g dw (Table 3).The similarity in the spatial distribution pattern andsignificant correlation between PCBs and individual OCpesticides (HCB, r ¼ 0:90; HCHs, r ¼ 0:91; CHLs,r ¼ 0:82; DDTs, r ¼ 0:99) suggests that their sourcesare closely related. In contrast, in Masan and Kwan-gyang Bays no apparent similarity in distributionbetween PCBs and OC pesticides was found, suggestingthat their sources are independent of each other.
4.2. Mass balance analysis
Florisil fractions F1, F2, and F3 of each of the 27samples were analyzed to characterize dioxin-likecontamination associated with sediment from thesestudy locations and to compare the profile of activityto that observed in previous studies of dioxin-likecontamination in Korean coastal areas (Fig. 4). Littledioxin-like activity was observed for F1 samples.Congener-specific PCB analysis found total concentra-tions of TEQPCB to be as great as 77.7 pg/g dw atlocation M3. Based on regression against the TCDDstandard curve, the TEQPCB would have been sufficientto induce a significant response of 55% TCDD-max.However, the PCB-containing fraction (F1) alone didnot induce significant H4IIE-luc responses (Fig. 4). Thissuggests either that nonpolar compounds present in F1antagonized the activity of AhR-active PCBs in theH4IIE-luc bioassay or that the dioxin-like potency ofspecific PCB congeners was overestimated. The lack ofbioassay responses for F1 samples from the LakeShihwa and Masan Bay inland region was consistentwith previous results that showed low-to-no dioxin-likeactivities associated with F1 for lake and marinesediments in 1999 (Khim et al., 1999a, b) and forsediment from a variety of other Korean coastal areas(Khim et al., 2001; Koh et al., 2002, 2004).All F2 and F3 samples elicited significant dioxin-like
responses (Fig. 4). The magnitude of induction for F2samples was as great as 113% TCDD-max, and in manycases F2 induced activities that were greater than thoseobserved for the corresponding RE (Fig. 4). F2 extractscontained detectable levels of AhR-active PAHs, andH4IIE-luc responses were strongly correlated with thelogarithm of total PAHs (r2 ¼ 0:65, Po0:01). However,based on the TEQPAH concentrations (0.02–4.09pg/g dw), bioassay responses were predicted to be lowerthan 10% TCCD-max. Thus, the concentrations of AhR-active PAHs present in F2 samples account for only asmall portion of the F2 responses. This indicates thatother unidentified dioxin-like (AhR-active) compounds,probably including PCDD/DFs [polychlorinated diben-zo-p-dioxins (PCDDs)/polychlorinated dibenzofurans(PCDFs)], were responsible for much of the activityassociated with F2 samples. Furthermore, the fact thatmany F2 activities were greater than those observed forthe corresponding RE suggests that components asso-ciated with F1 and/or F3 antagonized the integrateddioxin-like response of components associated with F2.Based on an instrumentally derived TEQ approach alone,it would be difficult to account for this effect andaccurately predict the integrated dioxin-like potency ofthe sediment extracts.With only a few exceptions (M1, K1, K2, K4, K11),
the magnitudes of induction caused by F3 samples wereless than those elicited by F2 samples. Response

ARTICLE IN PRESSC.-H. Koh et al. / Ecotoxicology and Environmental Safety 61 (2005) 366–379378
magnitudes for F3 samples ranged from 12% to 69%TCDD-max (Fig. 4). F3 samples corresponding toMasan Bay sediment, mainly from inland locations,showed relatively greater dioxin-like activities thanthose of Lake Shihwa and Kwangyang Bay (Figs. 1and 4). The F3 results were consistent with the previousfindings of relatively great dioxin-like activities asso-ciated with F3 of Masan Bay sediment extracts (Khimet al., 1999b). F3 results suggest the presence ofunidentified, relatively polar AhR-active compounds atnumerous locations in the Lake Shihwa, Masan Bay,and Kwangyang Bay regions. PCDDs/DFs, which cancarry over into F3 (Khim et al., 1999c; Koh et al., 2004),may account for all or a portion of the F3 responsesobserved. However, the results could indicate thepresence of additional dioxin-like compounds withpolarities similar to those of the APs. The similarfraction profiles in the H4IIE-luc bioassay betweenMasan Bay inland (current data) and bay sediments(Khim et al., 1999b) and for other studies of Koreancoastal sediments (Khim et al., 2001; Koh et al., 2002,2004) suggest broad compositional similarities amongdioxin-like contaminants present in sediment from manyKorean coastal areas.A previous study of Hyeongsan River sediments
found that PCDDs and PCDFs were the primary sourceof total TEQs in sediment extracts and that whenPCDD/DFs were included instrumentally derived TEQscould reasonably account for the magnitude of bioassayresponses observed (Koh et al., 2004). Assuming similardistributions of PCDD/DFs in other industrializedKorean coastal areas, it is likely that PCDD/DFsaccount for a large portion of the dioxin-like potencythat is currently unaccounted for in this study.Quantitative determination of PCDD/DF contamina-tion in the Lake Shihwa, Masan Bay, and KwangyangBay regions could help to clarify the contribution ofPCDD/DFs versus other unidentified dioxin-like con-taminants to the integrated dioxin-like potency (TCDD-EQs) determined in this study.Estrogenic responses in the MVLN bioassay were
markedly less after fractionation (Fig. 5). The lack ofestrogenic responses in F1 was explained by therebeing few ER-active compounds present in F1.Some F2 samples induced significant estrogenic re-sponses, but the magnitudes of response caused by F2were, on average, 19-fold less than those caused by REs.Significant correlations between the F2 response inthe MVLN bioassay and the logarithms of totalPAHs (r2 ¼ 0:330, Po0:01), benzo[a]anthracene con-centrations (r2 ¼ 0:600, Po0:01), dibenz[a,h]anthraceneconcentrations (r2 ¼ 0:469, P ¼ 0:013), and EEQPAH
(r2 ¼ 0:598, P ¼ 0:001) were found. However, the totalEEQPAH concentrations (o0.001–0.02 pg/g dw) mea-sured in the 27 F2 samples were not predicted to yieldsignificant estrogenic responses. It is currently unclear
what additional compounds or interactions mayhave contributed to the F2 responses, but evidencesuggests that these factors were likely correlated withPAH concentrations and may result from similarsources.All suspected xenoestrogens, such as NP, OP, and
BPA, eluted in F3. Consequently, one would haveexpected F3 samples to induce estrogenic activitiessimilar to those observed for REs. However, theresponse magnitudes observed for F3 were generallysix times lower than those caused by REs (Fig. 5).Furthermore, F3 responses were not significantlycorrelated with either concentrations of APs and BPAor EEQAPs (P ¼ 0:23620:889). F3 responses weresignificantly correlated with RE responses for LakeShihwa (r2 ¼ 0:766, P ¼ 0:0265) and Kwangyang Baysamples (r2 ¼ 0:624, P ¼ 0:040), but not for MasanBay samples (r2 ¼ 0:512, P ¼ 0:194). This was incontrast to the fact that there was a reasonablemass balance for the Masan Bay samples, while REresults for Lake Shihwa and Kwangyang Bay suggestedthat EEQAPs alone could not readily account for theactivity observed. At least for some samples, thelack of response could be attributed to a cytotoxicityassociated with F3; however, F3 responses wereunexpectedly low even when cytotoxicity was not readilyapparent (Fig. 5).
5. Conclusion
The relative abundance of organic contaminantsmeasured in sediment from the Korean coast was inthe order of APs4PAHs4PCBs4OC pesticides. Con-centrations of target contaminants measured in sedi-ments from the 27 locations in Lake Shihwa, MasanBay, and Kwangyang Bay varied among samplinglocations, indicating that their sources of each class ofchemicals were independent of each other. Sedimentsamples from stream and/or inland locations containedthe greatest concentrations of POPs and xenoestrogen,which indicated the presence of localized sources. Thescreening of REs in H4IIE-luc and MVLN cellbioassays indicated a significant difference in thedioxin-like and estrogenic responses between inlandrivers/streams and the open ocean, which was in goodagreement with instrumental results. Profiles of re-sponses observed for FEs showed a pattern that wasfairly consistent with previous studies of Korean coastalsediment contamination, with the greatest dioxin-likeactivities associated with the midpolar and polarfractions. Overall, the results of this study support theutility of in vitro bioassays in characterizing theoccurrence and distribution of potentially adversecontaminants present in the coastal environment.

ARTICLE IN PRESSC.-H. Koh et al. / Ecotoxicology and Environmental Safety 61 (2005) 366–379 379
Acknowledgments
We thank colleagues from the Laboratory of MarineBenthic Ecology at Seoul National University, Koreaand the Aquatic Toxicology Laboratory at MichiganState University for their technical assistance duringfield and laboratory work. We also thank Dr. Jac Aarts,University of Wageningen, The Netherlands for theH4IIE-luc cells and Dr. Michel Pons, Institut Nationalde la Sante de la Recherche Medicale, for the MVLNcells.
References
Behnisch, P.A., Hosoe, K., Sakai, S., 2001. Bioanalytical screening
methods for dioxins and dioxin-like compounds—a review of
bioassay/biomarker technology. Environ. Int. 27, 413–439.
Bzdusek, P.A., Christensen, E.R., Li, A., Zou, Q., 2004. Source
apportionment of sediment PAHs in Lake Calumet, Chicago:
application of factor analysis with nonnegative constraints.
Environ. Sci. Technol. 38, 97–103.
Giesy, J.P., Kannan, K., 1998. Dioxin-like and non-dioxin-like toxic
effects of polychlorinated biphenyls (PCBs): implications for risk
assessment. Crit. Rev. Toxicol. 28, 511–569.
Giesy, J.P., Hilscherova, K., Jones, P.D., Kannan, K., Machala, M.,
2002. Cell bioassays for detection of aryl hydrocarbon (AhR) and
estrogen receptor (ER) mediated activity in environmental samples.
Mar. Pollut. Bull. 45, 3–16.
Imamoglu, I., Christensen, E.R., 2002. PCB sources, transformations,
and contributions in recent Fox River, Wisconsin sediments
determined from receptor modeling. Water Res. 36, 3449–3462.
Kannan, K., Kober, J.L., Kang, Y-S., Masunaga, S., Nakanishi, J.,
Ostaszewski, A., Summer, C.L., Giesy, J.P., 2001. Polychlorinated-
naphthalenes, -biphenyls, -dibenzo-p-dioxins, -dibenzofurans,
polycyclic aromatic hydrocarbons and alkylphenols in sediment
from the Detroit and Rouge Rivers, Michigan, USA. Environ.
Toxicol. Chem. 20, 1878–1889.
Kannan, K., Kober, J.L., Khim, J.S., Szymczyk, K., Falandysz, J.,
Giesy, J.P., 2003. Polychlorinated biphenyls, polycyclic aromatic
hydrocarbons and alkylphenols in sediments from the Odra River
and its tributaries, Poland. Toxicol. Environ. Chem. 85, 51–60.
Khim, J.S., Villeneuve, D.L., Kannan, K., Lee, K.T., Snyder, S.A.,
Koh, C.H., Giesy, J.P., 1999a. Alkylphenols, polycyclic aromatic
hydrocarbons (PAHs), and organochlorines in sediment from Lake
Shihwa, Korea: Instrumental and bioanalytical characterization.
Environ. Toxicol. Chem. 8, 2424–2432.
Khim, J.S., Villeneuve, D.L., Kannan, K., Koh, C.H., Giesy, J.P.,
1999b. Characterization and distribution of trace organic con-
taminants in sediment from Masan Bay, Korea. 2. In vitro gene
expression analysis. Environ. Sci. Technol. 33, 4206–4211.
Khim, J.S., Kannan, K., Villeneuve, D.L., Koh, C.H., Giesy, J.P.,
1999c. Characterization and distribution of trace organic con-
taminants in sediment from Masan Bay, Korea. 1. Instrumental
analysis. Environ. Sci. Technol. 33, 4199–4205.
Khim, J.S., Lee, K.T., Villeneuve, D.L., Kannan, K., Giesy, J.P., Koh,
C.H., 2001. In vitro gene expression assays for determination of
dioxin-like and estrogenic compounds in environmental samples
from Ulsan Bay and its vicinity, Korea. Arch. Environ. Contam.
Toxicol. 40, 151–160.
Kim, S.-K., Oh, J.R., Shim, W.J., Lee, D.H., Yim, U.H., Hong, S.H.,
Shin, Y.B., Lee, D.S., 2002. Geographical distribution and
accumulation features of organochlorine residues in bivalves from
coastal areas of South Korea. Mar. Pollut. Bull. 45, 268–279.
Koh, C.H., Khim, J.S., Villeneuve, D.L., Kannan, K., Giesy, J.P.,
2002. Analysis of trace organic contaminants in environmental
samples from Onsan Bay, Korea. Environ. Toxicol. Chem. 21,
1796–1803.
Koh, C.H., Khim, J.S., Kannan, K., Villeneuve, D.L., Senthilkumar,
K., Giesy, J.P., 2004. Polychlorinated dibenzo-p-dioxins (PCDDs),
dibenzofurans (PCDFs), biphenyls (PCBs), and polycyclic aro-
matic hydrocarbons (PAHs) and 2,3,7,8-TCDD equivalents
(TEQs) in sediments from Hyeongsan River, Korea. Environ.
Pollut. 132, 489–501.
Li, A., Jang, J.K., Scheff, P.A., 2003. Application of EPA CMB8.2
model for source apportionment of sediment PAHs in Lake
Calumet, Chicago. Environ. Sci. Technol. 37, 2958–2965.
Li, Z., Li, D., Oh, J.R., Je, J.G., 2004. Seasonal and spatial distribution
of nonylphenol in Shihwa Lake, Korea. Chemosphere 56, 611–618.
Loganathan, B.G., Kannan, K., 1994. Global organochlorine con-
tamination trends: an overview. Ambio 23, 187–191.
Oh, J.R., Ikonomou, M.G., Fernandez, M.P., Hong, S.H., 2003. PCB
and PCDD/F totals, TEQs, and congener patterns in Korean
coastal marine environment, 1987, 1988, 1990, and 1996–1999.
Arch. Environ. Contam. Toxicol. 44, 224–236.
Sanderson, J.T., Giesy, J.P., 1998. Wildlife toxicology, functional
response assays. In: Meyers, R.A. (Ed.), Encyclopedia of Environ-
mental Analysis and Remediation. Wiley, New York,
pp. 5272–5297.
Statistical Graphics Corp, 2001. Statgraphics Plus for Windows,
Statistical Graphics System, User’s Guide Version 5.1. Statistical
Graphics Corp.
Villeneuve, D.L., Blankenship, A.L., Giesy, J.P., 1998. Interactions
between environmental xenobiotics and estrogen receptor-
mediated responses. In: Denison, M.S., Helferich, W.G. (Eds.),
Toxicant–Receptor Interactions. Taylor and Francis, Philadelphia,
PA, pp. 69–99.
Villeneuve, D.L., Blankenship, A.L., Giesy, J.P., 2000. Derivation and
application of relative potency estimates based on in vitro bioassay
results. Environ. Toxicol. Chem. 19, 2835–2843.
Villeneuve, D.L., Khim, J.S., Kannan, K., Giesy, J.P., 2002. Relative
potencies of individual polycyclic aromatic hydrocarbons to induce
dioxin-like and estrogenic responses in three cell lines. Environ.
Toxicol. 17, 128–137.