Rapid ventilation of the Mexico City basin and regional … ventilation of the Mexico City basin and...
40
Rapid ventilation of the Mexico City basin and regional fate of the urban plume B. De Foy, J. R. Varela, L. T. Molina, M. J. Molina To cite this version: B. De Foy, J. R. Varela, L. T. Molina, M. J. Molina. Rapid ventilation of the Mexico City basin and regional fate of the urban plume. Atmospheric Chemistry and Physics Discussions, European Geosciences Union, 2006, 6 (1), pp.839-877. <hal-00303831> HAL Id: hal-00303831 https://hal.archives-ouvertes.fr/hal-00303831 Submitted on 31 Jan 2006 HAL is a multi-disciplinary open access archive for the deposit and dissemination of sci- entific research documents, whether they are pub- lished or not. The documents may come from teaching and research institutions in France or abroad, or from public or private research centers. L’archive ouverte pluridisciplinaire HAL, est destin´ ee au d´ epˆ ot et ` a la diffusion de documents scientifiques de niveau recherche, publi´ es ou non, ´ emanant des ´ etablissements d’enseignement et de recherche fran¸cais ou ´ etrangers, des laboratoires publics ou priv´ es.
Transcript of Rapid ventilation of the Mexico City basin and regional … ventilation of the Mexico City basin and...

Rapid ventilation of the Mexico City basin and regional
fate of the urban plume
B. De Foy, J. R. Varela, L. T. Molina, M. J. Molina
To cite this version:
B. De Foy, J. R. Varela, L. T. Molina, M. J. Molina. Rapid ventilation of the Mexico Citybasin and regional fate of the urban plume. Atmospheric Chemistry and Physics Discussions,European Geosciences Union, 2006, 6 (1), pp.839-877. <hal-00303831>
HAL Id: hal-00303831
https://hal.archives-ouvertes.fr/hal-00303831
Submitted on 31 Jan 2006
HAL is a multi-disciplinary open accessarchive for the deposit and dissemination of sci-entific research documents, whether they are pub-lished or not. The documents may come fromteaching and research institutions in France orabroad, or from public or private research centers.
L’archive ouverte pluridisciplinaire HAL, estdestinee au depot et a la diffusion de documentsscientifiques de niveau recherche, publies ou non,emanant des etablissements d’enseignement et derecherche francais ou etrangers, des laboratoirespublics ou prives.
ACPD6, 839–877, 2006
Mexico City basinventilation and urban
plume
B. de Foy et al.
Title Page
Abstract Introduction
Conclusions References
Tables Figures
J I
J I
Back Close
Full Screen / Esc
Print Version
Interactive Discussion
EGU
Atmos. Chem. Phys. Discuss., 6, 839–877, 2006www.atmos-chem-phys.org/acpd/6/839/SRef-ID: 1680-7375/acpd/2006-6-839European Geosciences Union
AtmosphericChemistry
and PhysicsDiscussions
Rapid ventilation of the Mexico City basinand regional fate of the urban plume
B. de Foy1, J. R. Varela2, L. T. Molina1, and M. J. Molina1
1Department of Earth, Atmospheric and Planetary Sciences, Massachusetts Institute ofTechnology, USA2Departamento de Ingenierıa de Procesos e Hidraulica, Universidad Autonoma Metropolitana,Iztapalapa, Mexico
Received: 1 December 2005 – Accepted: 22 December 2005 – Published: 31 January 2006
Correspondence to: B. de Foy ([email protected])
© 2006 Author(s). This work is licensed under a Creative Commons License.
839

ACPD6, 839–877, 2006
Mexico City basinventilation and urban
plume
B. de Foy et al.
Title Page
Abstract Introduction
Conclusions References
Tables Figures
J I
J I
Back Close
Full Screen / Esc
Print Version
Interactive Discussion
EGU
Abstract
Urban areas can be large emitters of air pollutants leading to negative health effectsand environmental degradation. The rate of venting of these airsheds determines thepollutant loading for given emission levels, and also determines the regional impactsof the urban plume. Mexico City has approximately 20 million people living in a high5
altitude basin with air pollutant concentrations above the health limits most days ofthe year. A mesoscale meteorological model (MM5) and a particle trajectory model(FLEXPART) are used to simulate air flow within the Mexico City basin and the fate ofthe urban plume during the MCMA-2003 field campaign. The simulated trajectories arevalidated against pilot balloon and radiosonde trajectories. The residence time of air10
within the basin and the impacted areas are identified by episode type. Three specificcases are analysed to identify the meteorological processes involved. For most days,residence times in the basin are less than 12 h with little carry-over from day to dayand little recirculation of air back into the basin. Very efficient vertical mixing leads to avertically diluted plume which, in April, is transported predominantly towards the Gulf15
of Mexico. Regional accumulation was found to take place for some days however, withurban emissions sometimes staying over Mexico for more than 6 days. Knowledge ofthe residence times, recirculation patterns and venting mechanisms will be useful inguiding policies for improving the air quality of the MCMA.
1. Introduction20
Air quality in urban areas is determined by the interaction of emissions with meteorolog-ical circulation patterns. Large urban areas are often found in areas with complex windpatterns which can be due to a coastal location and/or proximity to mountain ranges.Los Angeles combines both of these with strong sunlight leading to episodes of intensephotochemistry. Lu and Turco (1995) analysed the three-dimensional wind patterns in25
the basin and found that the sea-breeze transports the polluted air mass up the moun-
840
ACPD6, 839–877, 2006
Mexico City basinventilation and urban
plume
B. de Foy et al.
Title Page
Abstract Introduction
Conclusions References
Tables Figures
J I
J I
Back Close
Full Screen / Esc
Print Version
Interactive Discussion
EGU
tain slopes. Under periods of weak synoptic forcing, a reservoir layer forms aloft, andthe polluted air mass descends on the city the following morning. Peak ozone is there-fore obtained after several days of accumulation. Houston, though also a coastal city,lies on a plain. Banta et al. (2005) analysed the circulation patterns and found thatmorning emissions are carried to sea with the land breeze. As the day progresses,5
a sea breeze forms transporting the polluted air mass back over the city where it istrapped horizontally in a convergence line and mixes vertically. In this scenario, thereis little carry-over from day-to-day and peak ozone levels can be obtained in a singleday. Phoenix, on the edge of a mountain range in a desert, was analysed by Fast et al.(2000). Slope flows transport the urban plume towards the mountains. Low synoptic10
forcing and intense heating lead to vigorous vertical mixing and effective daily ventingof the urban plume. There is therefore little multi-day accumulation although night-timeemission build-up plays an important role.
Marseilles and Athens share similarities with Los Angeles: both are coastal cities onthe edge of mountains. Kalthoff et al. (2005) analysed the sea-breeze flow during the15
ESCOMPTE field campaign in Marseille. The complex interaction between the sea-breeze, valley flows and slope flows lead to strong vertical layering with flow separatedbetween a component along the coast and one over the mountains. Grossi et al. (2000)found that for Athens a single day of emissions was sufficient to yield a peak ozone day.Night time emissions were very important however, and mutli-day carry-over affected20
the spatial extent of the plume rather than peak values.Away from the sea and next to much higher mountains, Santiago de Chile experi-
ences strong upslope flow and convergence along the mountain flanks, as describedby Schmitz (2005). The combination of the vertical mixing and the convergence leadsto effective venting of the urban plume towards and above the Andes. Studies in the25
French and Swiss Alps yield a similar emphasis on vertical diffusion in the absence ofstrong horizontal flows. Lehning et al. (1998) showed the dominance of vertical trans-port using aircraft eddy covariance measurements. Henne et al. (2004) show that threetimes the valley air mass can be exported vertically under fair weather conditions, with
841

ACPD6, 839–877, 2006
Mexico City basinventilation and urban
plume
B. de Foy et al.
Title Page
Abstract Introduction
Conclusions References
Tables Figures
J I
J I
Back Close
Full Screen / Esc
Print Version
Interactive Discussion
EGU
the topography leading to a very efficient “air pump” exporting pollutants to the free tro-posphere. The importance of thermal convection and of small-scale processes (<1 km)for these cases is described by Brulfert et al. (2005).
While many urban areas are the dominant regional source of pollutants, long-rangetransport can have important impacts. Menut et al. (2000) use a combination of aircraft5
measurements and model simulations to identify days when ozone levels in Paris arepredominantly caused by local emissions, and others when a substantial fraction is dueto transport from neighbouring countries.
Mexico city lies in a mountain basin at 2240 m altitude and 19◦ N latitude, surroundedby high mountains on three sides. The MCMA-2003 field campaign took place during10
April 2003. de Foy et al. (2005a) described the meteorological conditions during thecampaign as well as the literature on the basin wind circulation. Bossert (1997) in-vestigated flow regimes in the basin as part of the MARI field campaign. Lagrangianparticle simulations revealed strong venting from up-slope flows. Different episodeswere analysed to show the contrasting effects of local versus regional flow patterns,15
including the importance of plateau winds into the basin in flushing out the pollutedair mass. Fast and Zhong (1998) analysed the meteorological conditions during theIMADA campaign. Lagrangian simulations found residence times shorter than a dayand limited recirculation from day-to-day. Stable conditions at night lead to pollutantbuild-up which impacted air quality on the following day. Overall, it was found that the20
combination of horizontal advection, near-surface convergence and vertical diffusionlead to very effective basin venting on a daily basis.
During MCMA-2003, three types of wind circulation patterns were identified (de Foyet al., 2005a). O3-South events occur when there is weak synoptic forcing and highozone peaks in the south. O3-North events take place when there are westerlies aloft,25
leading to strong flows over the western and southern basin rim and high ozone levelsin the north. Cold Surge days are associated with “El Norte” events, with strong, coldsurface flow from the Gulf of Mexico and substantial afternoon rainfall. Of the 34 days inthe MCMA-2003 campaign, 7 were O3-South, 17 O3-North and 7 Cold Surge. de Foy
842

ACPD6, 839–877, 2006
Mexico City basinventilation and urban
plume
B. de Foy et al.
Title Page
Abstract Introduction
Conclusions References
Tables Figures
J I
J I
Back Close
Full Screen / Esc
Print Version
Interactive Discussion
EGU
et al. (2005b) found distinct wind convergence patterns during each episode: east-west convergence lines radiating northwards from a pass in the south-east of the basinfor O3-South days, relatively stationary north-south convergence lines for O3-Northdays and east-west convergence lines through the middle of the basin associated withconvective rainfall for Cold Surge days.5
This paper builds on the previous descriptions of the MCMA-2003 basin meteorology,using a Lagrangian particle model to establish the residence times, fate and origin ofthe Mexico City Metropolitan Area (MCMA) air mass. The model simulation proceduresare described in Sect. 2. Model mixing heights and particle trajectories are validatedagainst pilot balloon and radiosonde observations in Sect. 3. Results are presented10
for the entire campaign in Sect. 4 and individual cases are analysed to discuss themeteorological processes involved in Sect. 5.
2. Model description
The Pennsylvania State University/National Center for Atmospheric ResearchMesoscale Model (MM5, Grell et al., 1995) version 3.7.2 was used to generate the15
wind fields as described in de Foy et al. (2005b). This uses three nested grids withone-way nesting at resolutions of 36, 12 and 3 km, with 40×50, 55×64 and 61×61grid cells for domains 1, 2 and 3, respectively. Figure 1 shows the large and mediumdomains. The initial and boundary conditions were taken from the Global ForecastSystem (GFS) at a 3-h resolution. High resolution satellite remote sensing is used to20
initialise the land surface parameters for the NOAH land surface model, as describedin de Foy et al. (2005c).
Stochastic particle trajectories are calculated using FLEXPART, Stohl et al. (2005).The modified version 3.1, developed by G. Wotawa, was used. This version was mod-ified to ingest MM5 output, using sigma levels as the vertical coordinate and using all25
three of the nested MM5 grids. Vertical diffusion coefficients are re-calculated internallybased on the MM5 mixing heights and surface friction velocity. Particle positions were
843
ACPD6, 839–877, 2006
Mexico City basinventilation and urban
plume
B. de Foy et al.
Title Page
Abstract Introduction
Conclusions References
Tables Figures
J I
J I
Back Close
Full Screen / Esc
Print Version
Interactive Discussion
EGU
output every hour for analysis. Given the high resolution of the MM5 terrain, sub-gridscale terrain effects were turned off in the model. As this study is focussed on air trans-port, there is no deposition and a reflection boundary condition is used at the surface.A density correction was applied to the Langevin equation to improve the vertical mix-ing in FLEXPART (Stohl and Thomson, 1999). Validation of FLEXPART was carried5
out against large scale tracer experiments (Stohl et al., 1998), with a range of Pearsoncorrelation coefficients around 0.5.
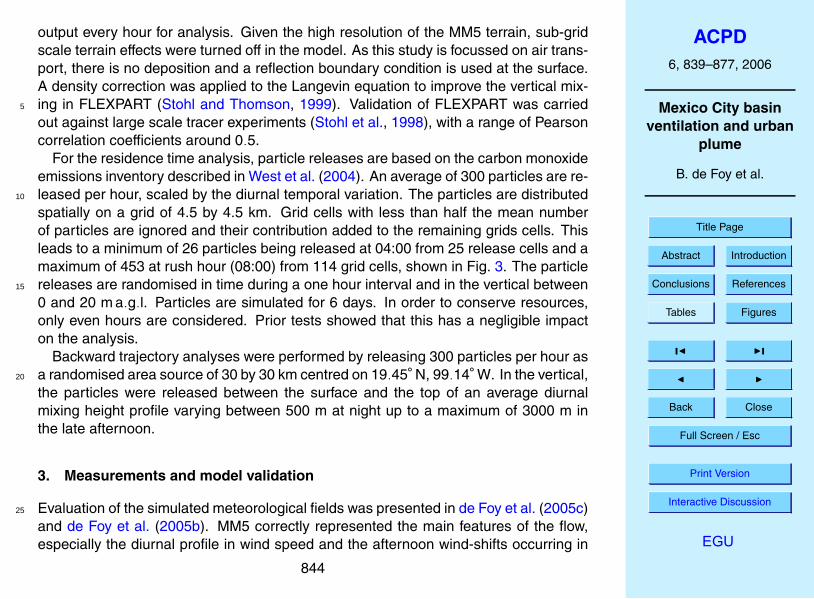
For the residence time analysis, particle releases are based on the carbon monoxideemissions inventory described in West et al. (2004). An average of 300 particles are re-leased per hour, scaled by the diurnal temporal variation. The particles are distributed10
spatially on a grid of 4.5 by 4.5 km. Grid cells with less than half the mean numberof particles are ignored and their contribution added to the remaining grids cells. Thisleads to a minimum of 26 particles being released at 04:00 from 25 release cells and amaximum of 453 at rush hour (08:00) from 114 grid cells, shown in Fig. 3. The particlereleases are randomised in time during a one hour interval and in the vertical between15
0 and 20 m a.g.l. Particles are simulated for 6 days. In order to conserve resources,only even hours are considered. Prior tests showed that this has a negligible impacton the analysis.
Backward trajectory analyses were performed by releasing 300 particles per hour asa randomised area source of 30 by 30 km centred on 19.45◦ N, 99.14◦ W. In the vertical,20
the particles were released between the surface and the top of an average diurnalmixing height profile varying between 500 m at night up to a maximum of 3000 m inthe late afternoon.
3. Measurements and model validation
Evaluation of the simulated meteorological fields was presented in de Foy et al. (2005c)25
and de Foy et al. (2005b). MM5 correctly represented the main features of the flow,especially the diurnal profile in wind speed and the afternoon wind-shifts occurring in
844
ACPD6, 839–877, 2006
Mexico City basinventilation and urban
plume
B. de Foy et al.
Title Page
Abstract Introduction
Conclusions References
Tables Figures
J I
J I
Back Close
Full Screen / Esc
Print Version
Interactive Discussion
EGU
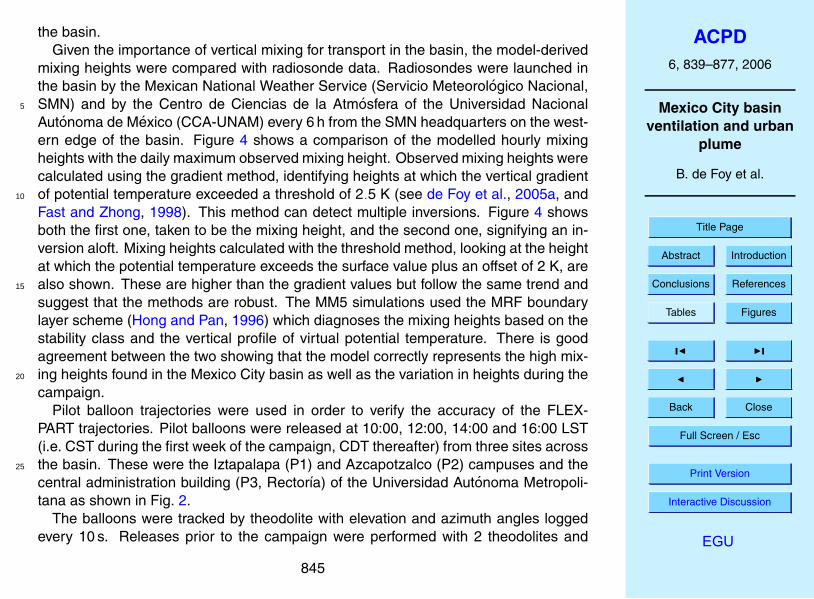
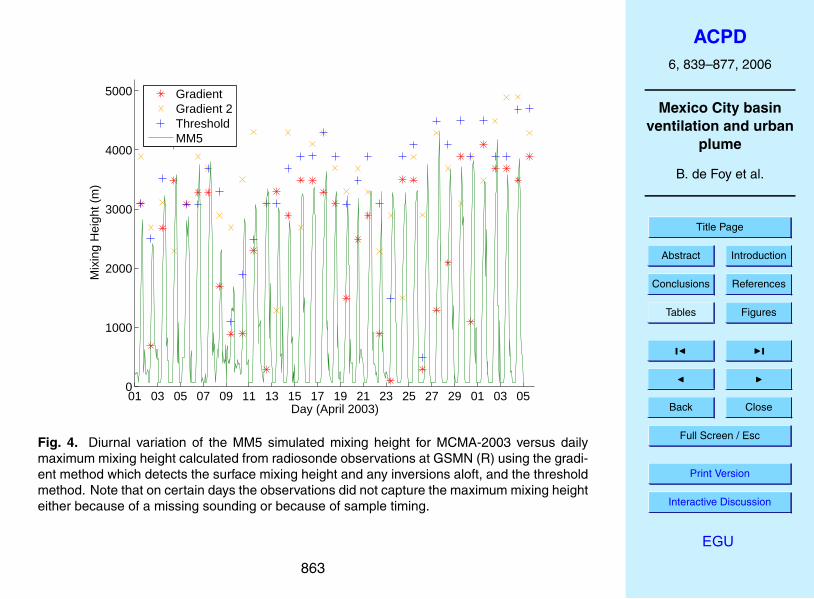
the basin.Given the importance of vertical mixing for transport in the basin, the model-derived
mixing heights were compared with radiosonde data. Radiosondes were launched inthe basin by the Mexican National Weather Service (Servicio Meteorologico Nacional,SMN) and by the Centro de Ciencias de la Atmosfera of the Universidad Nacional5
Autonoma de Mexico (CCA-UNAM) every 6 h from the SMN headquarters on the west-ern edge of the basin. Figure 4 shows a comparison of the modelled hourly mixingheights with the daily maximum observed mixing height. Observed mixing heights werecalculated using the gradient method, identifying heights at which the vertical gradientof potential temperature exceeded a threshold of 2.5 K (see de Foy et al., 2005a, and10
Fast and Zhong, 1998). This method can detect multiple inversions. Figure 4 showsboth the first one, taken to be the mixing height, and the second one, signifying an in-version aloft. Mixing heights calculated with the threshold method, looking at the heightat which the potential temperature exceeds the surface value plus an offset of 2 K, arealso shown. These are higher than the gradient values but follow the same trend and15
suggest that the methods are robust. The MM5 simulations used the MRF boundarylayer scheme (Hong and Pan, 1996) which diagnoses the mixing heights based on thestability class and the vertical profile of virtual potential temperature. There is goodagreement between the two showing that the model correctly represents the high mix-ing heights found in the Mexico City basin as well as the variation in heights during the20
campaign.Pilot balloon trajectories were used in order to verify the accuracy of the FLEX-
PART trajectories. Pilot balloons were released at 10:00, 12:00, 14:00 and 16:00 LST(i.e. CST during the first week of the campaign, CDT thereafter) from three sites acrossthe basin. These were the Iztapalapa (P1) and Azcapotzalco (P2) campuses and the25
central administration building (P3, Rectorıa) of the Universidad Autonoma Metropoli-tana as shown in Fig. 2.
The balloons were tracked by theodolite with elevation and azimuth angles loggedevery 10 s. Releases prior to the campaign were performed with 2 theodolites and
845

ACPD6, 839–877, 2006
Mexico City basinventilation and urban
plume
B. de Foy et al.
Title Page
Abstract Introduction
Conclusions References
Tables Figures
J I
J I
Back Close
Full Screen / Esc
Print Version
Interactive Discussion
EGU
established that the vertical velocity of the balloons was 3.3 m/s. Thereafter, mea-surements from a single theodolite were used together with the vertical velocity incalculating the position of the balloons.
In order to evaluate the particle trajectories, pseudo-balloons were released in themodel with the same fixed vertical velocity. 100 pseudo-balloons were released for5
every real balloon to account for the stochastic mixing effects. The particle paths weretracked for 10 min with positions logged every 10 s, as for the real balloons. The pathlength of the balloon trajectories was between 1 and 2 km. Figure 5 shows the threeballoon trajectories along with the model trajectories for 10:00 and 18:00 for the threecases that will be studied in Sect. 5: 15 April (O3-South), 23 April (O3-North) and 810
April (Cold Surge). On 15 April, transport is clearly to the south and is correctly rep-resented by the model. At 18:00, both the balloons and the particles are still movingsouthward, but the low level jet from the south-east Chalco pass is beginning to form.This affects the model more than the balloons, with north-westward model trajecto-ries. The balloons do show very weak surface flows however with some north-westerly15
component at P3. On 23 April, transport is north-eastwards. At 10:00, the winds areweak and variable. This can be seen by spiralling of the pilot balloons and a largespread in model trajectories. The pilot balloons are transported eastward when theyreach a higher elevation, which is not represented in the model. At 18:00, the strongernorth-eastward flow is well-characterised however. On 8 April, there is a strong south-20
ward flow near the surface with eastward turning aloft. This is well characterised bythe model at 10:00. At 18:00, the model is totally wrong however, having simulated anorthward low level jet through the basin. The sensitivity of model simulations to soilmoisture for these cases was discussed in de Foy et al. (2005b). Southward transportaloft is correctly characterised however.25
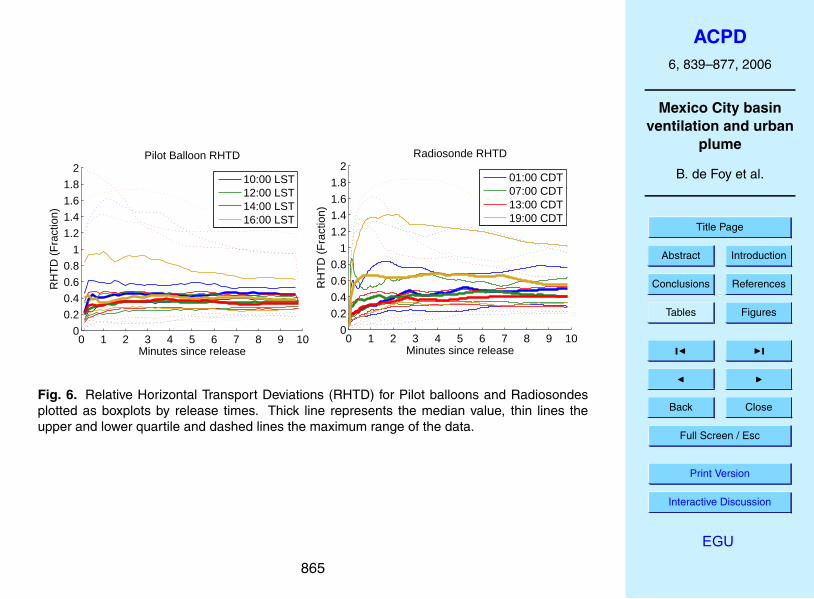
The Relative Horizontal Transport Deviations (RHTD), described by Baumann andStohl (1997), was calculated between the actual balloon position and the closest posi-tion of the pseudo-balloons. The median RHTD was found to be approximately 40% asshown in Fig. 6. The errors are largest for the 10:00 balloons when winds are weaker
846
ACPD6, 839–877, 2006
Mexico City basinventilation and urban
plume
B. de Foy et al.
Title Page
Abstract Introduction
Conclusions References
Tables Figures
J I
J I
Back Close
Full Screen / Esc
Print Version
Interactive Discussion
EGU
and for the 16:00 releases when wind variability is largest. For 12:00 and 14:00 75%of errors are below the 50% mark.
Similar trajectories were calculated for the available radiosonde observations. Theballoons were found to rise at an average of 5 m/s which was set as a constant inFLEXPART. RHTD for all available soundings at GSMN is shown in Fig. 6. These are5
similar to the pilot balloons, with 50% of trajectories having errors below 50%. In thiscase however, the 19:00 sounding performs considerably worse than the remainingones. This may be due to the location of the radiosonde release site on the westernedge of the basin which is strongly influenced by local slope flows near the surface.
In interpreting the statistics, it is important to note the large variability between the10
model trajectories. This is due to the weak and variable winds in the basin and suggestsbounds on the accuracy possible from single point measurements. For the pseudo-radiosondes, increased accuracy could be gained by specifying the known verticalheight, as was done in Baumann and Stohl (1997), rather than the average verticalvelocity . This is unlikely to have a significant impact on the RHTD however and was15
not implemented in the present work. Stohl (1998) reviews the accuracy of trajectorycalculations and finds that 20% errors are typical for trajectories based on analysedwind fields. In this case, winds are particularly weak and variable adding further to thevariability of the trajectories. It is therefore deemed acceptable that 50% of pilot balloontrajectories have relative errors below 50%.20
4. Results
The analysis of the forward and backward trajectories will be based on the classifi-cation of each day of the campaign into one of the three episode types: O3-South,O3-North and Cold Surge. The results are split into two sections: the first looks at theMexico City basin itself and the second looks at the regional area. The basin boundary25
used to calculate residence times is shown in Fig. 2. For the regional residence timeanalysis, the domain is defined by the coasts of the Pacific Ocean and the Gulf of Mex-
847

ACPD6, 839–877, 2006
Mexico City basinventilation and urban
plume
B. de Foy et al.
Title Page
Abstract Introduction
Conclusions References
Tables Figures
J I
J I
Back Close
Full Screen / Esc
Print Version
Interactive Discussion
EGU
ico, truncated 600 km to the North and 800 km to the East. The residence time wasdefined as the time span between the release time and the final exit from the domain.The recirculation fraction was calculated from the number of particles that re-enter thedomain one or more times after having left it as a fraction of total particles.
The fate of the urban plume was analysed by constructing gridded fields of particle5
clouds and, separately, of particle paths. For particle clouds, a snapshot is taken of theparticles at a particular time from all preceding releases (for forward trajectories). Theparticle count at each grid cell is made by integrating over the entire vertical columnleading to a measurement similar to a column concentration. For particle paths, “resi-dence time fields” were constructed by counting particle positions recorded every hour10
on a single grid. All particles released at a given time are included in the gridded fieldfor that particular time. Each grid cell is a column integration over the entire verticalrange and the resulting grid is the equivalent of a time exposure photograph taken fromabove for a single release.
The fine grid covers the basin and adjacent areas, as shown in Fig. 2, with a reso-15
lution of 6 km. Two coarse domains are used corresponding to the first two domainsof the MM5 simulations. A resolution of 36 km is used for both in order to have a rep-resentative number of particles in each cell. Gridded fields are summed by episodetype and/or by time of day in order to have an overall view of the conditions during thecampaign. Individual particle clouds and paths will be presented in Sect. 5 for three20
test cases in order to discuss the driving forces and mechanisms of the flow features.
4.1. Basin
Histograms of residence time were calculated for each release during the field cam-paign. Figure 7 shows a boxplot of these grouped together by episode type. For eachhour, the boxplot indicates the median fraction of particles with this residence time as25
well as the inter-quartile range and total range. For all episode types, 50% of tracershave a lifetime shorter than 7 h, and 25% shorter than 3 h. The difference between theepisodes is in the longest-lived quartile, with 25% of tracers having a residence times
848

ACPD6, 839–877, 2006
Mexico City basinventilation and urban
plume
B. de Foy et al.
Title Page
Abstract Introduction
Conclusions References
Tables Figures
J I
J I
Back Close
Full Screen / Esc
Print Version
Interactive Discussion
EGU
above 23 h for O3-South days, 9 h for O3-North and 13 h for Cold Surge. A histogramof recirculation fractions by episode type is shown in Fig. 7. The median recirculationfraction is 42% for O3-South days, 12% for O3-North and 27% for Cold Surge.
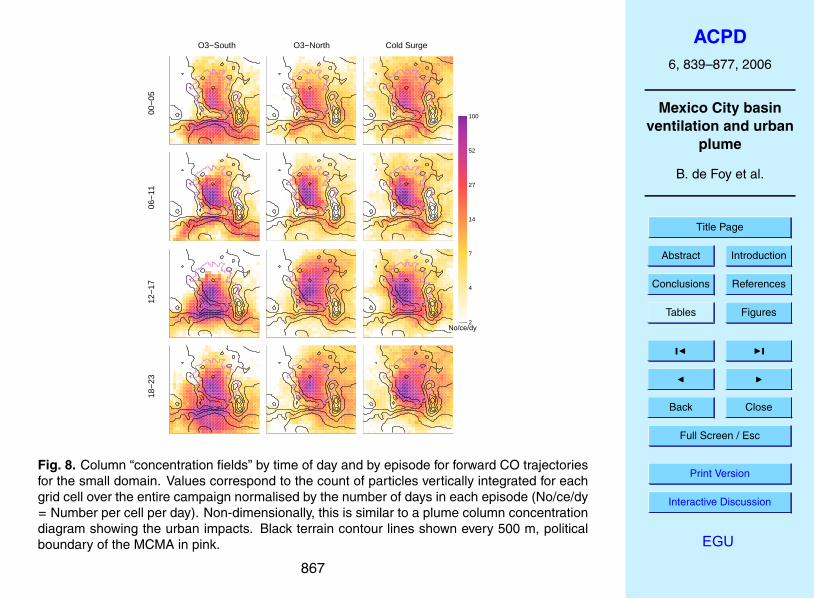
Figure 8 shows the sum of column concentration fields on the basin grid by episodetype and by time of day. For O3-South days, the dominant feature is transport to the5
South for all times of the day. Outflow from the basin takes place along the entiresouthern rim of the basin. In the morning, there is more flow through the Chalcopassage in the south-east, but later in the day the outflow is greater to the south-westnear the Ajusco mountain (at the Tres Marias pass). High concentrations of pollutedair exist south of the basin rim above the mountain slopes as basin air meets up-valley10
flow from the south. This is strong enough in the evening to push part of the urbanplume over Toluca to the west and Puebla to the east. Some transport to the northcan be seen, with north-east impacts from afternoon releases and north-west impactsfrom the night-time releases. The impacts to the north are minimal during the day butincrease at night in the north and north-east of the city.15
For O3-North days, the dominant outflux from the urban area can be seen to thenorth-east and south-east. In the early morning, there are high concentrations to thesouth of the basin in the Cuautla valley and to the east over Puebla. As mixing heightsrise during the day, these impacts are reduced. There are late morning impacts throughthe Chalco passage and to the south of the basin. These are replaced with north-east20
impacts as the afternoon progresses. By night, concentrations are high on the wholeeastern edge of the domain suggesting impacts from flow going on both sides of thevolcanoes.
For Cold Surge days there is a clearer channelling of night-time flows through theChalco passage, although there are also impacts to the north-east and looping around25
the volcanoes to Puebla. As the day progresses, the impacts are more clearly to thesouth in areas of low terrain elevation, with little flow over the basin rim and lowerconcentrations over the volcanoes. By night-time, there is a northward componentaffecting the north-east of the city and the regions to the east of the basin.
849

ACPD6, 839–877, 2006
Mexico City basinventilation and urban
plume
B. de Foy et al.
Title Page
Abstract Introduction
Conclusions References
Tables Figures
J I
J I
Back Close
Full Screen / Esc
Print Version
Interactive Discussion
EGU
Figure 9 shows residence time plots resolved in the vertical for a circular area aroundthe basin. Hourly particle path positions were counted in area between 35 and 45 kmfrom a point near the airport (UTM coordinates: 490 E, 2150 N km, zone 14) with avertical resolution of 250 m up to 2000 m a.g.l. As before, these are summed over alltime periods by episode, and is a non-dimensional representation of the time spent5
by the particles in the ring surrounding the city. On O3-South days, the outflow can beclearly seen over the basin rim in the south. The highest residence times are above thesurface, between 250 and 1000 m a.g.l. On O3-North days, the component of outflowtowards the south is much weaker as well as being a little higher and over to the south-east. The main outflow can be clearly seen to the north and north-east. The highest10
concentrations are at the surface but for the north-east the plume maximum is in the500 to 750 m a.g.l. range. On Cold Surge days the outflow is to the south. In contrastwith O3-South days however, the bulk of the flow is near the surface in the Chalco passto the south-east. Reduced vertical mixing leads to higher residence times close to thesurface for all exit directions.15
Residence time fields for backward trajectories from the urban area are shown inFig. 10 by episode and by time of day. These show where the air mass over the cityoriginated on the local scale. For O3-South days, the night time flow is a combina-tion of flow from the Mexican plateau in the north and through the Chalco pass in thesouth-east. The Mexican plateau flow increases during the day and dominates the af-20
ternoon inflow before the gap flow resumes in the early evening. For O3-North days,the situation is similar although the inflow comes much more strongly from the west.This increases as the day progresses and dominates the afternoon flow with air fromToluca coming over the mountain pass in the west of the basin. As the evening pro-gresses, the inflows come around the Ajusco mountain in the south-west of the basin.25
Cold surge days have a strong inflow from the north for all time periods. During theday there is a slightly increasing component from the north-east reverting to air comingfrom the north-west at night.
850

ACPD6, 839–877, 2006
Mexico City basinventilation and urban
plume
B. de Foy et al.
Title Page
Abstract Introduction
Conclusions References
Tables Figures
J I
J I
Back Close
Full Screen / Esc
Print Version
Interactive Discussion
EGU
4.2. Region
On the regional scale, the residence time of the urban plume over land is shown inFig. 11 along with the recirculation fractions. The median residence times are 4.7days for O3-South, 2.5 days for O3-North and 2 days for Cold Surge. More than onequarter of trajectories from O3-South days were still over land at the end of the 6 day5
simulation period. Recirculation fractions show a median of 37% for O3-South dayscompared with 29% and 28% for O3-North and Cold Surge respectively. These areparticles that leave the domain either over the Gulf or over the Pacific before beingblown back to land.
The regional impact does not vary substantially by time of day and is shown by10
episode type in Fig. 12 on the medium grid with 36 km spacing. On O3-South days,the plume leaves the basin mainly to the south as shown above. After that it fans outand impacts both the Pacific coast to the south and the Gulf coast to the east. Thecolumn concentration plots show some looping around the Pico de Orizaba volcanodue east, with northward transport along the flanks of the Sierra Madre Oriental. On15
O3-North days, the north-eastward outflow from the basin continues in the same direc-tion, moving over the Sierra Madre Oriental and onto the Gulf of Mexico. The outflowto the south and south-west is limited to the area adjacent to the basin as further awaythe plume is blown back to the east and north-east. On Cold Surge days, the columnintegrated spatial impact is similar to O3-North days with outflow to the north-east. The20
main difference is that the plume follows the terrain much more closely as it is chan-nelled through mountain passes and depressions. On the basin scale, the outflow wasmainly to the south through the Chalco passage. This can be seen on the regionalplot but lasts for less than 100 km as the flow is turned to the north-east. The outflowis concentrated beyond Pachuca in the valleys descending the Sierra Madre Oriental.25
After this, it fans out along the coast impacting areas both to the north and south.Figure 13 shows the exit direction resolved vertically as for Fig. 9. Particle paths
were gridded radially between 300 and 400 km from the MCMA. In the vertical, the
851
ACPD6, 839–877, 2006
Mexico City basinventilation and urban
plume
B. de Foy et al.
Title Page
Abstract Introduction
Conclusions References
Tables Figures
J I
J I
Back Close
Full Screen / Esc
Print Version
Interactive Discussion
EGU
resolution is still 250 m but now extends to 8000 m a.g.l. For O3-South days, thisshows outflow towards the south in the range of 1500 to 2500 m a.g.l. and towardsthe south-west around 3000 m a.g.l. The component of northward flow can be seen inthe lower levels along the Gulf Coast and out over the Gulf. For O3-North days, twodominant outflow areas can be seen. To the north near the Sierra Madre Oriental there5
is a low level outflow around 500 to 1000 m a.g.l. To the east, the peak outflow is in therange of 3000 to 4000 m a.g.l., but the outflow is very spread out both vertically andfor the entire north-east quadrant. Cold Surge days have the most outflow in the lowerlevels along the flank of the Sierra Madre Oriental. There is no outflow for the wholewestern side and some outflow over the Gulf at higher elevations.10
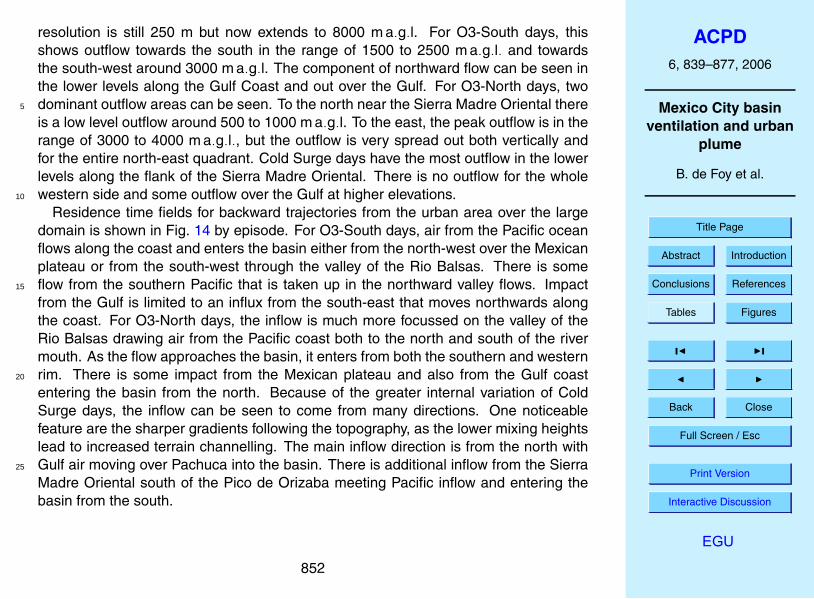
Residence time fields for backward trajectories from the urban area over the largedomain is shown in Fig. 14 by episode. For O3-South days, air from the Pacific oceanflows along the coast and enters the basin either from the north-west over the Mexicanplateau or from the south-west through the valley of the Rio Balsas. There is someflow from the southern Pacific that is taken up in the northward valley flows. Impact15
from the Gulf is limited to an influx from the south-east that moves northwards alongthe coast. For O3-North days, the inflow is much more focussed on the valley of theRio Balsas drawing air from the Pacific coast both to the north and south of the rivermouth. As the flow approaches the basin, it enters from both the southern and westernrim. There is some impact from the Mexican plateau and also from the Gulf coast20
entering the basin from the north. Because of the greater internal variation of ColdSurge days, the inflow can be seen to come from many directions. One noticeablefeature are the sharper gradients following the topography, as the lower mixing heightslead to increased terrain channelling. The main inflow direction is from the north withGulf air moving over Pachuca into the basin. There is additional inflow from the Sierra25
Madre Oriental south of the Pico de Orizaba meeting Pacific inflow and entering thebasin from the south.
852

ACPD6, 839–877, 2006
Mexico City basinventilation and urban
plume
B. de Foy et al.
Title Page
Abstract Introduction
Conclusions References
Tables Figures
J I
J I
Back Close
Full Screen / Esc
Print Version
Interactive Discussion
EGU
5. Discussion
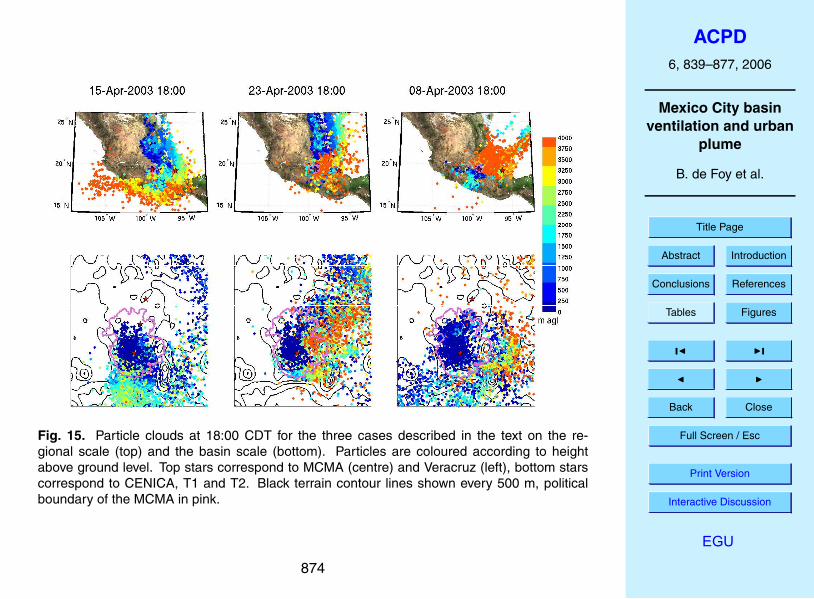
The results section presented aggregate behaviour of the plume by episode type,showing distinct ventilation patterns and residence times for each type. This sectionwill focus on three specific days to analyse in greater detail the processes causing theobserved results. Following de Foy et al. (2005b), 15 April was chosen for the O3-5
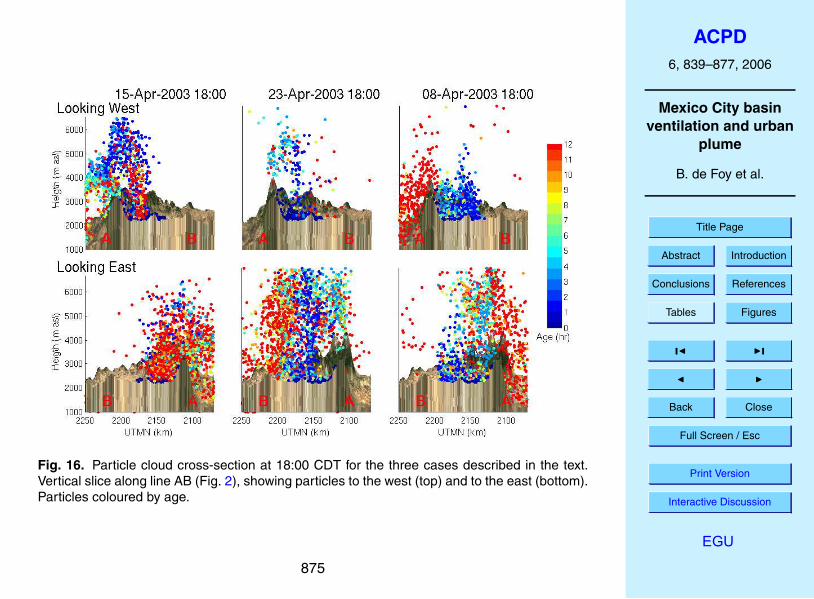
South category, 23 April for O3-North and 8 April for Cold Surge. Figure 15 shows theparticle cloud (snapshot of current particles for all prior releases) of the urban plumeat 18:00 for each day at both the regional and basin scale. North-south cross-sectionsof the basin are shown in Fig. 16. Finally, particle paths (hourly positions of a singlerelease for the entire simulation period) from specific releases around the basin are10
shown in Fig. 17 to help elucidate the flow patterns entering the basin.15 April shows the clockwise transport aloft by an anti-cyclone over western Mexico
characteristic of O3-South episodes. At lower levels however, the plume is taken intothe northward surface flow of the Gulf of Mexico along the edge of the Sierra MadreOriental. This section of the plume comes from the night time surface flow blown15
northward by the low level jet. There is a return flow visible on the regional scale as theconvergence line between the Pacific ocean breeze and the Gulf breeze moves south-eastward. On the basin scale, the cross-section looking west shows clearly the verticaldispersion of the urban plume to 4000 m a.g.l. Close inspection of the fresh particleson the southern slope show that there is some up-slope flow but that the majority of20
the transport is due to vertical mixing above the city. In this case, the increased mixingheights over the urban area dominate the up-slope drafts. Once the plume is aloft, itis transported southwards where it meets the cooler ocean air moving up-valley. Thisleads to an accumulation band at around 4000 ma.s.l. with little MCMA impacts at thesurface. The flow is relatively stationary at this point and flows back into the basin25
when the northward jet forms in the Chalco passage. The (relatively) aged particlesstay mainly on the eastern edge of the basin before being vented out again by verticalmixing. Looking at the particle releases from points around the basin confirms this
853

ACPD6, 839–877, 2006
Mexico City basinventilation and urban
plume
B. de Foy et al.
Title Page
Abstract Introduction
Conclusions References
Tables Figures
J I
J I
Back Close
Full Screen / Esc
Print Version
Interactive Discussion
EGU
picture. The releases to the north of the basin are convected into the basin and overthe rim to the Cuautla valley. The release in the Chalco passage leads to a sharplydefined influx on the eastern edge of the basin before being blown eastward through acombination of convection and vertical mixing.
23 April has a strong north-eastward outflow typical of O3-North days. Vigorous5
vertical mixing takes place diluting the plume more than 4000 m a.g.l. In addition,for this particular case, a strong convective cell developed in the afternoon (de Foyet al., 2005b) explaining the transport above the top of the mixing layer. Low particledensities exist in the basin at 18:00 as the plume is swept away by a strong north-eastward flow over the western and southern edges of the basin. On the regional10
scale, there is a vertical separation between the flow aloft which is taken east and evensouth-east towards the Gulf and the surface flow which is much slower and leads tomore concentrated impacts moving north along the Gulf coast. In contrast with 15April, this flow does not impact the Mexican plateau as the regional convergence linestays close to the edge of the Sierra Madre Oriental. Particle paths from the release15
to the north of the basin reveal the strong eastward component of the flow with littleimpact on the MCMA. The release in the Chalco passage does show the jet flow veryclearly however and impacts much more of the urban area as it moves north-westwardbefore being taken up in the regional eastward movement. The release near Cuautlais also influenced by the eastward flow preventing it from entering the basin at Chalco20
and impacting Puebla instead.8 April was the day of highest rain from the field campaign and the central day of
a Cold Surge episode. As expected, the surface transport is to the south with strongchannelling through the Chalco passage. On the basin scale, the reduced verticalmixing leads to particles accumulating in the basin and held back by the surrounding25
mountains. The outflow through Chalco leads to surface transport down the Cuautlavalley. This time, there is no up-coming valley flow to counteract the jet. There areolder particles that experienced increased vertical transport earlier in the day when themixing height was higher. These are transported both southward and eastward. On
854

ACPD6, 839–877, 2006
Mexico City basinventilation and urban
plume
B. de Foy et al.
Title Page
Abstract Introduction
Conclusions References
Tables Figures
J I
J I
Back Close
Full Screen / Esc
Print Version
Interactive Discussion
EGU
the regional scale, these particles are caught in the westerlies and blown eastwardover the Gulf. This leads to a plume split in two with each half travelling in oppositedirections. Particles released near Pachuca show the strong inflow into the basin.This has a westward component as the flow from the Gulf blows perpendicular to themountain axis. The flow in the Chalco passage fans out to the south impacting the5
whole Cuautla valley.
6. Conclusions
The FLEXPART trajectory model was used with MM5 simulated wind fields to analysethe air flow in the Mexico City basin. Mixing heights simulated by MM5 were shownto be in good agreement with those obtained from radiosonde observations, giving10
confidence in the model representation of vertical diffusion. Model simulated pseudo-balloon trajectories were compared against a rich dataset of pilot balloon trajectoriesconsisting of 409 releases from 3 sites during the whole time of the campaign. There isa large variability between the pseudo-balloon trajectories due to the weak and variablewinds. This suggests that the bounds on the expected accuracy of a point-to-point15
comparison are rather large. 50% of trajectories had relative errors smaller than 50%,suggesting that the model is able to reproduce the flow features in the basin. Furthercomparisons were made between model trajectories and radiosonde paths with similaraccuracy levels. As these are more widely available, albeit with reduced spatial andtemporal coverage, they could serve for model comparisons and evaluation in a greater20
number of cases. The variability in the trajectories could also serve as an estimate ofthe expected variability in sounding data for model validation.
Forward and backward trajectories were simulated corresponding to urban primaryemissions and to the “breathable” air in the basin. Venting of the basin was foundto be very rapid, especially for 2 of the 3 episode types studied: O3-North and Cold25
Surge. Residence times below 7 h for 50% of particles corroborate findings from previ-ous studies. On the regional scale, the transport is equally rapid, with 50% of particles
855

ACPD6, 839–877, 2006
Mexico City basinventilation and urban
plume
B. de Foy et al.
Title Page
Abstract Introduction
Conclusions References
Tables Figures
J I
J I
Back Close
Full Screen / Esc
Print Version
Interactive Discussion
EGU
remaining over land for less than 2 to 2.5 days. There is however a significant amountof recirculation and longer residence times for O3-South episodes. Peak ozone val-ues during the campaign occurred on all three episode types suggesting that multi-daycarry-over may contribute to greater spatial extent of the ozone peak but not to themaximum daily value (de Foy et al., 2005a). In this respect, Mexico City is more com-5
parable to Houston and Athens where sea-breeze flows lead to same-day convergenceof emissions over the urban area rather than Los Angeles where a polluted reservoir isformed. The mountain basin acts as an “air pump” pulsing the urban plume aloft afterwhich it is carried away by the synoptic flow. The vigorous vertical mixing dominatesboth the slope flow and the wind convergence updrafts, leading to a well-mixed vertical10
plume over the urban area. On the regional scale, for this time of year, the main direc-tions of outflow of the basin are east and north-east with some limited transport to thePacific ocean on certain days.
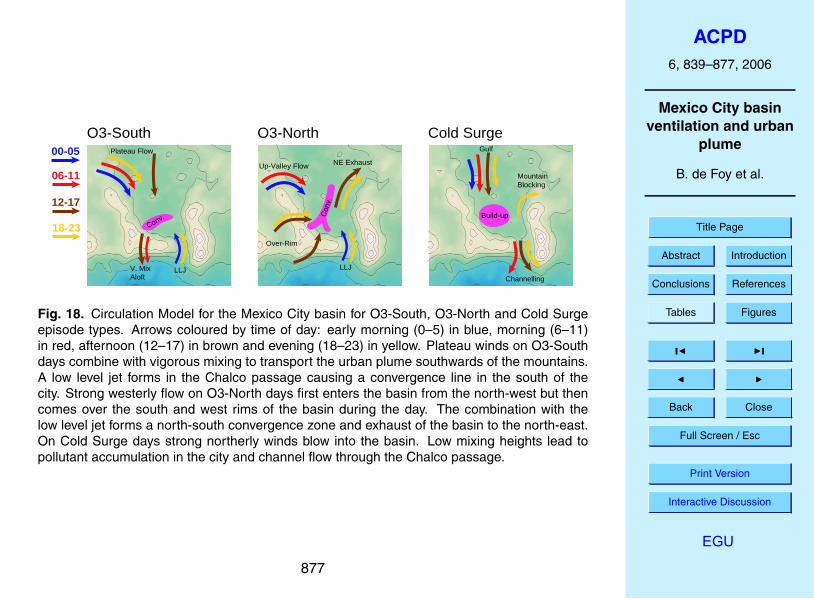
The circulation model proposed in de Foy et al. (2005a) is revised in Fig. 18 in thelight of the wind convergence patterns of de Foy et al. (2005b) and the current particle15
trajectories. These effects, and especially their vertical resolution enhance the previ-ous model which was based on surface wind measurements. For O3-South days, theplateau-to-basin winds are the main influx into the basin coming from the north in theafternoon and from the north-west the rest of the time. The low level jet through theChalco passage forms in the evening and continues throughout the night. The plume20
is mixed vertically and transported out of the basin southwards above the mountains.For O3-North days, the influx is in the north of the basin, but coming from the west.Rather than being a plateau flow, it is actually an up-valley flow through the Rio Balsasvalley, up to Toluca and around the mountains. As the day progresses, the westerlyflow strengthens and comes over the basin rim on both sides of the Ajusco mountain.25
The low level jet in the Chalco passage is now an extension of this flow rather than aseparate feature. Plume exhaust takes place along the axis of the convergence linetowards the north-east. For Cold Surge days, the inflow is from the north. Low mix-ing heights lead to an accumulation in the middle of the basin with outflow southward
856
ACPD6, 839–877, 2006
Mexico City basinventilation and urban
plume
B. de Foy et al.
Title Page
Abstract Introduction
Conclusions References
Tables Figures
J I
J I
Back Close
Full Screen / Esc
Print Version
Interactive Discussion
EGU
through the Chalco passage. Mountain blocking of the flow is particularly noticeable atnight with flow on both sides of the volcanoes in the south-east.
While a limited number of cases were presented in this paper, trajectories weregenerated for the whole campaign forming a database for the analysis of MCMA-2003 wind transport, which is currently accessible from http://mce2.org/ as part of5
the MCMA-2003 and MCMA-2006 field campaigns. It is hoped that this may helpin interpreting observations from the field campaign and in planning for the up-comingMILAGRO campaign (Megacity Initiative: Local and Global Research Observations,http://www.joss.ucar.edu/milagro/). The analysis of flow patterns and residence timeswill also be able to assist in developing abatement strategies and provide policy guid-10
ance for reducing the adverse health impacts on the public.
Acknowledgements. The authors wish to thank the Pilot Balloon Team at the UniversidadAutonoma Metropolitana, Mexico, for the database of balloon trajectories. Radiosonde ob-servations were provided by the Mexican National Meteorological Service with support fromPemex-Refinacion to the Instituto Mexicano del Petroleo for additional soundings at 06:0015
and 18:00 UTC, operated by the Centro de Ciencias de la Atmosfera, Universidad NacionalAutonoma de Mexico.
MM5 is made publicly available and supported by the Mesoscale and Microscale Meteorologydivision at the National Center for Atmospheric Research for which the authors are very grateful.The authors thank A. Stohl for making FLEXPART available and for valuable discussions as well20
as G. Wotawa for developing the MM5 version.
The financial support from the US National Science Foundation (Award ATM-0511803), theUS Department of Energy (Award DE-FG02-05ER63980) and the Molina Center for StrategicStudies in Energy and the Environment for this work is gratefully acknowledged.
References25
Banta, R. M., Seniff, C. J., Nielsen-Gammon, J., Darby, L. S., Ryerson, T. B., Alvarez, R. J.,Sandberg, S. R., Williams, E. J., and Trainer, M.: A bad air day in Houston, Bull. Amer. Met.Soc., 86, 657–669, 2005. 841
857
ACPD6, 839–877, 2006
Mexico City basinventilation and urban
plume
B. de Foy et al.
Title Page
Abstract Introduction
Conclusions References
Tables Figures
J I
J I
Back Close
Full Screen / Esc
Print Version
Interactive Discussion
EGU
Baumann, K. and Stohl, A.: Validation of a long-range trajectory model using gas balloon tracksfrom the Gordon Bennett Cup 95, J. Appl. Meteorol., 36, 711–720, 1997. 846, 847
Bossert, J. E.: An investigation of flow regimes affecting the Mexico City region, J. Appl. Mete-orol., 36, 119–140, 1997. 842
Brulfert, G., Chemel, C., Chaxel, E., and Chollet, J. P.: Modelling photochemistry in alpine5
valleys, Atmos. Chem. Phys., 5, 2341–2355, 2005,SRef-ID: 1680-7324/acp/2005-5-2341. 842
de Foy, B., Caetano, E., Magana, V., Zitacuaro, A., Cardenas, B., Retama, A., Ramos, R.,Molina, L. T., and Molina, M. J.: Mexico City basin wind circulation during the MCMA-2003field campaign, Atmos. Chem. Phys., 5, 2267–2288, 2005a,10
SRef-ID: 1680-7324/acp/2005-5-2267. 842, 845, 856de Foy, B., Clappier, A., Molina, L. T., and Molina, M. J.: Distinct wind convergence patterns
due to thermal and momentum forcing of the low level jet into the Mexico City basin, Atmos.Chem. Phys. Discuss., 5, 11 055–11 090, 2005b,SRef-ID: 1680-7375/acpd/2005-5-11055. 842, 843, 844, 846, 853, 854, 85615
de Foy, B., Molina, L. T., and Molina, M. J.: Satellite-derived land surface parameters formesoscale modelling of the Mexico City basin, Atmos. Chem. Phys. Discuss., 5, 9861–9906,2005c,SRef-ID: 1680-7375/acpd/2005-5-9861. 843, 844
Fast, J. D. and Zhong, S. Y.: Meteorological factors associated with inhomogeneous ozone20
concentrations within the Mexico City basin, J. Geophys. Res.-Atmos., 103, 18 927–18 946,1998. 842, 845
Fast, J. D., Doran, J. C., Shaw, W. J., Coulter, R. L., and Martin, T. J.: The evolution of theboundary layer and its effect on air chemistry in the Phoenix area, J. Geophys. Res.-Atmos.,105, 22 833–22 848, 2000. 84125
Grell, G. A., Dudhia, J., and Stauffer, D. R.: A Description of the Fifth-Generation PennState/NCAR Mesoscale Model (MM5), Tech. Rep. NCAR/TN-398+STR, NCAR, 1995. 843
Grossi, P., Thunis, P., Martilli, A., and Clappier, A.: Effect of sea breeze on air pollution in theGreater Athens Area. Part II: Analysis of different emission scenarios, J. Appl. Meteorol., 39,563–575, 2000. 84130
Henne, S., Furger, M., Nyeki, S., Steinbacher, M., Neininger, B., de Wekker, S. F. J., Dommen,J., Spichtinger, N., Stohl, A., and Prevot, A. S. H.: Quantification of topographic venting ofboundary layer air to the free troposphere, Atmos. Chem. Phys., 4, 497–509, 2004,
858

ACPD6, 839–877, 2006
Mexico City basinventilation and urban
plume
B. de Foy et al.
Title Page
Abstract Introduction
Conclusions References
Tables Figures
J I
J I
Back Close
Full Screen / Esc
Print Version
Interactive Discussion
EGU
SRef-ID: 1680-7324/acp/2004-4-497. 841Hong, S. Y. and Pan, H. L.: Nonlocal boundary layer vertical diffusion in a Medium-Range
Forecast Model, Mon. Weather Rev., 124, 2322–2339, 1996. 845Kalthoff, N., Kottmeier, C., Thurauf, J., Corsmeier, U., Said, F., Frejafon, E., and Perros, P. E.:
Mesoscale circulation systems and ozone concentrations during ESCOMPTE: a case study5
from IOP 2b, Atmos. Res., 74, 355–380, 2005. 841Lehning, M., Richner, H., Kok, G. L., and Neininger, B.: Vertical exchange and regional budgets
of air pollutants over densely populated areas, Atmos. Environ., 32, 1353–1363, 1998. 841Lu, R. and Turco, R. P.: Air pollutant transport in a coastal environment. 2. 3-dimensional
simulations over los-angeles basin, Atmos. Environ., 29, 1499–1518, 1995. 84010
Menut, L., Vautard, R., Flamant, C., Abonnel, C., Beekmann, M., Chazette, P., Flamant, P. H.,Gombert, D., Guedalia, D., Kley, D., Lefebvre, M. P., Lossec, B., Martin, D., Megie, G., Perros,P., Sicard, M., and Toupance, G.: Measurements and modelling of atmospheric pollution overthe Paris area: an overview of the ESQUIF Project, Ann. Geophys., 18, 1467–1481, 2000,SRef-ID: 1432-0576/ag/2000-18-1467. 84215
Schmitz, R.: Modelling of air pollution dispersion in Santiago de Chile, Atmos. Environ., 39,2035–2047, 2005. 841
Stohl, A.: Computation, accuracy and applications of trajectories – A review and bibliography,Atmos. Environ., 32, 947–966, 1998. 847
Stohl, A. and Thomson, D. J.: A density correction for Lagrangian particle dispersion models,20
Boundary-Layer Meteorol., 90, 155–167, 1999. 844Stohl, A., Hittenberger, M., and Wotawa, G.: Validation of the Lagrangian particle dispersion
model FLEXPART against large-scale tracer experiment data, Atmos. Environ., 32, 4245–4264, 1998. 844
Stohl, A., Forster, C., Frank, A., Seibert, P., and Wotawa, G.: Technical note: The Lagrangian25
particle dispersion model FLEXPART version 6.2, Atmos. Chem. Phys., 5, 2461–2474, 2005,SRef-ID: 1680-7324/acp/2005-5-2461. 843
West, J. J., Zavala, M. A., Molina, L. T., Molina, M. J., San Martini, F., McRae, G. J., Sosa-Iglesias, G., and Arriaga-Colina, J. L.: Modeling ozone photochemistry and evaluation ofhydrocarbon emissions in the Mexico City metropolitan area, J. Geophys. Res.-Atmos., 109,30
doi:10.1029/2004JD004614, 2004. 844
859
ACPD6, 839–877, 2006
Mexico City basinventilation and urban
plume
B. de Foy et al.
Title Page
Abstract Introduction
Conclusions References
Tables Figures
J I
J I
Back Close
Full Screen / Esc
Print Version
Interactive Discussion
EGU
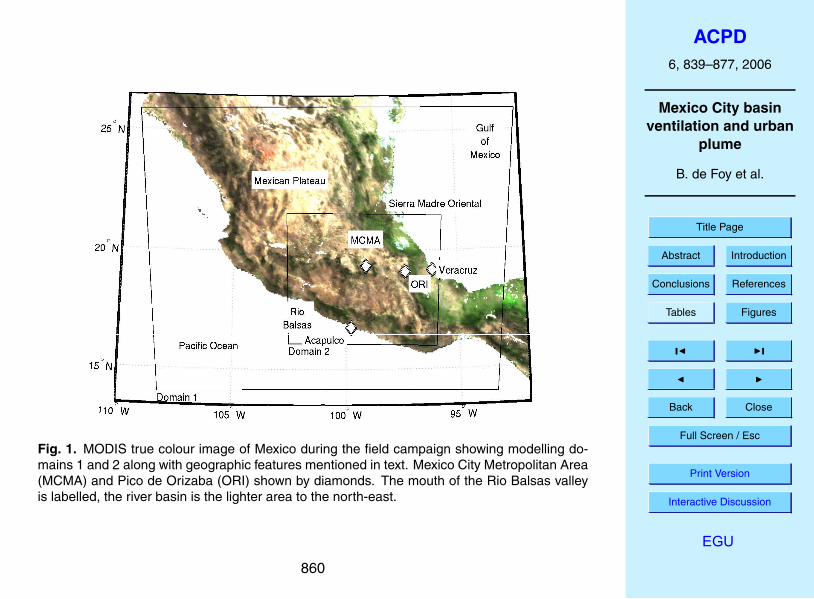
Fig. 1. MODIS true colour image of Mexico during the field campaign showing modelling do-mains 1 and 2 along with geographic features mentioned in text. Mexico City Metropolitan Area(MCMA) and Pico de Orizaba (ORI) shown by diamonds. The mouth of the Rio Balsas valleyis labelled, the river basin is the lighter area to the north-east.
860
ACPD6, 839–877, 2006
Mexico City basinventilation and urban
plume
B. de Foy et al.
Title Page
Abstract Introduction
Conclusions References
Tables Figures
J I
J I
Back Close
Full Screen / Esc
Print Version
Interactive Discussion
EGU
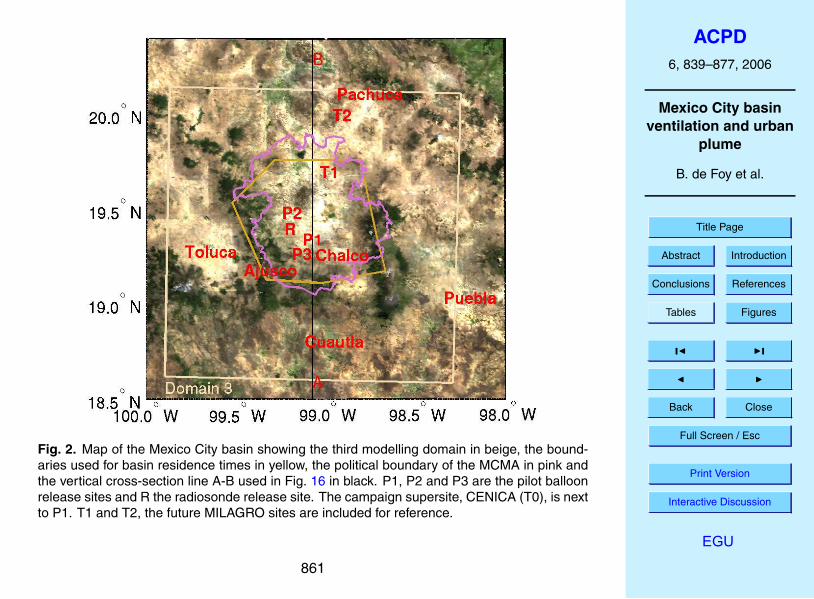
Fig. 2. Map of the Mexico City basin showing the third modelling domain in beige, the bound-aries used for basin residence times in yellow, the political boundary of the MCMA in pink andthe vertical cross-section line A-B used in Fig. 16 in black. P1, P2 and P3 are the pilot balloonrelease sites and R the radiosonde release site. The campaign supersite, CENICA (T0), is nextto P1. T1 and T2, the future MILAGRO sites are included for reference.
861

ACPD6, 839–877, 2006
Mexico City basinventilation and urban
plume
B. de Foy et al.
Title Page
Abstract Introduction
Conclusions References
Tables Figures
J I
J I
Back Close
Full Screen / Esc
Print Version
Interactive Discussion
EGU
0
2
4
6
8
10
12
14
16
18
No.
440 460 480 500 520 540 560
2100
2120
2140
2160
2180
2200
P1
P2
P3
GSMN
UTM East (km)
UT
M N
orth
(km
)
Fig. 3. Particle releases from grid cells representing carbon monoxide emissions during rushhour (08:00). Contour lines of terrain every 500 m, political boundary of the MCMA in pink,balloon release sites as for Fig. 2.
862
ACPD6, 839–877, 2006
Mexico City basinventilation and urban
plume
B. de Foy et al.
Title Page
Abstract Introduction
Conclusions References
Tables Figures
J I
J I
Back Close
Full Screen / Esc
Print Version
Interactive Discussion
EGU
01 03 05 07 09 11 13 15 17 19 21 23 25 27 29 01 03 050
1000
2000
3000
4000
5000
Day (April 2003)
Mix
ing
Hei
ght (
m)
GradientGradient 2ThresholdMM5
Fig. 4. Diurnal variation of the MM5 simulated mixing height for MCMA-2003 versus dailymaximum mixing height calculated from radiosonde observations at GSMN (R) using the gradi-ent method which detects the surface mixing height and any inversions aloft, and the thresholdmethod. Note that on certain days the observations did not capture the maximum mixing heighteither because of a missing sounding or because of sample timing.
863

ACPD6, 839–877, 2006
Mexico City basinventilation and urban
plume
B. de Foy et al.
Title Page
Abstract Introduction
Conclusions References
Tables Figures
J I
J I
Back Close
Full Screen / Esc
Print Version
Interactive Discussion
EGU
Fig. 5. Pilot balloon trajectories (large) versus Flexpart particle paths (small symbols) for 10:00 and 18:00 CDTfor April 15, 23 & 8. 100 particles are released for each balloon. P1 in green, P2 in black and blue and P3in red. Note that horizontal transport of the balloons and particles is exaggerated by a factor of 8, in practiceaverage transport is less than 2 km from the release site. Contour lines of terrain every 500 m.
0 1 2 3 4 5 6 7 8 9 100
0.2
0.4
0.6
0.8
1
1.2
1.4
1.6
1.8
2
Minutes since release
RH
TD
(F
ract
ion)
Pilot Balloon RHTD
10:00 LST12:00 LST14:00 LST16:00 LST
0 1 2 3 4 5 6 7 8 9 100
0.2
0.4
0.6
0.8
1
1.2
1.4
1.6
1.8
2
Minutes since release
RH
TD
(F
ract
ion)
Radiosonde RHTD
01:00 CDT07:00 CDT13:00 CDT19:00 CDT
Fig. 6. Relative Horizontal Transport Deviations (RHTD) for Pilot balloons and Radiosondes plotted as box-plots by release times. Thick line represents the median value, thin lines the upper and lower quartile and dashedlines the maximum range of the data.
21
Fig. 5. Pilot balloon trajectories (large) versus Flexpart particle paths (small symbols) for 10:00and 18:00 CDT for 15, 23 and 8 April. 100 particles are released for each balloon. P1 in green,P2 in black and blue and P3 in red. Note that horizontal transport of the balloons and particlesis exaggerated by a factor of 8, in practice average transport is less than 2 km from the releasesite. Contour lines of terrain every 500 m.
864
ACPD6, 839–877, 2006
Mexico City basinventilation and urban
plume
B. de Foy et al.
Title Page
Abstract Introduction
Conclusions References
Tables Figures
J I
J I
Back Close
Full Screen / Esc
Print Version
Interactive Discussion
EGU
0 1 2 3 4 5 6 7 8 9 100
0.2
0.4
0.6
0.8
1
1.2
1.4
1.6
1.8
2
Minutes since release
RH
TD
(F
ract
ion)
Pilot Balloon RHTD
10:00 LST12:00 LST14:00 LST16:00 LST
0 1 2 3 4 5 6 7 8 9 100
0.2
0.4
0.6
0.8
1
1.2
1.4
1.6
1.8
2
Minutes since release
RH
TD
(F
ract
ion)
Radiosonde RHTD
01:00 CDT07:00 CDT13:00 CDT19:00 CDT
Fig. 6. Relative Horizontal Transport Deviations (RHTD) for Pilot balloons and Radiosondesplotted as boxplots by release times. Thick line represents the median value, thin lines theupper and lower quartile and dashed lines the maximum range of the data.
865

ACPD6, 839–877, 2006
Mexico City basinventilation and urban
plume
B. de Foy et al.
Title Page
Abstract Introduction
Conclusions References
Tables Figures
J I
J I
Back Close
Full Screen / Esc
Print Version
Interactive Discussion
EGU
0 4 8 12 16 20 24 28 32 36 40 44 480
10
20
30
40
50
His
togr
am (
%)
Time before leaving the basin (Hr)
Residence Times
O3−SouthO3−NorthCold Surge
0 10 20 30 40 50 60 70 80 90 1000
10
20
30
40
50
His
togr
am (
%)
Recirculation Fraction (%)
Recirculation Fractions
O3−SouthO3−NorthCold Surge
Fig. 7. Residence time and recirculation fractions for the basin domain shown in Fig. 2 cate-gorised by episode type. For the residence time, this shows a boxplot of histograms constructedfor each release of the campaign (even hours only). Thick lines show the median histogramvalue by episode, thin lines show the upper and lower quartiles and dashed lines the rangeof the data. For the recirculation fraction, the lines represent a histogram by episode of therecirculation fractions at each release of the campaign.
866
ACPD6, 839–877, 2006
Mexico City basinventilation and urban
plume
B. de Foy et al.
Title Page
Abstract Introduction
Conclusions References
Tables Figures
J I
J I
Back Close
Full Screen / Esc
Print Version
Interactive Discussion
EGU
00−
0506
−11
12−
1718
−23
O3−South O3−North Cold Surge
2
4
7
14
27
52
100
No/ce/dy
Fig. 8. Column “concentration fields” by time of day and by episode for forward CO trajectoriesfor the small domain. Values correspond to the count of particles vertically integrated for eachgrid cell over the entire campaign normalised by the number of days in each episode (No/ce/dy= Number per cell per day). Non-dimensionally, this is similar to a plume column concentrationdiagram showing the urban impacts. Black terrain contour lines shown every 500 m, politicalboundary of the MCMA in pink.
867

ACPD6, 839–877, 2006
Mexico City basinventilation and urban
plume
B. de Foy et al.
Title Page
Abstract Introduction
Conclusions References
Tables Figures
J I
J I
Back Close
Full Screen / Esc
Print Version
Interactive Discussion
EGU
Fig. 9. Basin outflow “residence times” for CO tracers by height and by episode type in Numberper cell per day. Particle counts in 35 to 40 km ring around MCMA, vertical grid from surface to2000 m a.g.l. in 250 m increments. The MCMA is inside the cylinder, view looking towards theChalco passage in the south-east with north at the bottom.
868

ACPD6, 839–877, 2006
Mexico City basinventilation and urban
plume
B. de Foy et al.
Title Page
Abstract Introduction
Conclusions References
Tables Figures
J I
J I
Back Close
Full Screen / Esc
Print Version
Interactive Discussion
EGU
00−
0506
−11
12−
1718
−23
O3−South O3−North Cold Surge
1
2
4
8
17
34
70
No/ce/dy
Fig. 10. Column “residence time” fields by time of day and by episode for backward MCMAtrajectories for the small domain (No/ce/dy = Number per cell per day). This shows the pathtaken for particles arriving in the MCMA at each particular time range. Black terrain contourlines shown every 500 m, political boundary of the MCMA in pink.
869

ACPD6, 839–877, 2006
Mexico City basinventilation and urban
plume
B. de Foy et al.
Title Page
Abstract Introduction
Conclusions References
Tables Figures
J I
J I
Back Close
Full Screen / Esc
Print Version
Interactive Discussion
EGU
0 24 48 72 96 120 1440
10
20
30
40
50
His
togr
am (
%)
Time before leaving the basin (Hr)
Residence Times
O3−SouthO3−NorthCold Surge
0 10 20 30 40 50 60 70 80 90 1000
10
20
30
40
50
His
togr
am (
%)
Recirculation Fraction (%)
Recirculation Fractions
O3−SouthO3−NorthCold Surge
Fig. 11. Residence time and recirculation fractions for the regional domain bounded by theGulf and Pacific coasts truncated 600 km to the North and 800 km to the East. See Fig. 7 forexplanation of plots.
870

ACPD6, 839–877, 2006
Mexico City basinventilation and urban
plume
B. de Foy et al.
Title Page
Abstract Introduction
Conclusions References
Tables Figures
J I
J I
Back Close
Full Screen / Esc
Print Version
Interactive Discussion
EGU
0 24 48 72 96 120 1440
10
20
30
40
50
His
togr
am (
%)
Time before leaving the basin (Hr)
Residence Times
O3−SouthO3−NorthCold Surge
0 10 20 30 40 50 60 70 80 90 1000
10
20
30
40
50
His
togr
am (
%)
Recirculation Fraction (%)
Recirculation Fractions
O3−SouthO3−NorthCold Surge
Fig. 11. Residence time and recirculation fractions for the regional domain bounded by the Gulf and Pacificcoasts truncated 600 km to the North and 800 km to the East. See Fig. 7 for explanation of plots.
O3−South O3−North Cold Surge
10
26
67
173
448
1159
3000
No/ce/dy
Fig. 12. Column “concentration fields” for forward trajectories for the regional domain by episode type, cf.Fig. 8.
Fig. 13. Regional outflow “residence times” for CO tracers by height and by episode type, cf. Fig. 9. Particlecounts in 300 to 400 km ring around MCMA, vertical grid from surface to 8000 magl in 250 m increments.Mountains surrounding the basin can be seen in the middle of the cylinder with the Pacific Ocean on the bottom,the Gulf of Mexico on the top of the figure and North to the left. Acapulco is along the piece of coast hiddenby the cylinder and Veracruz along the coast hidden by the volcanoes inside the cylinder.
26
Fig. 12. Column “concentration fields” for forward trajectories for the regional domain byepisode type, cf. Fig. 8.
871

ACPD6, 839–877, 2006
Mexico City basinventilation and urban
plume
B. de Foy et al.
Title Page
Abstract Introduction
Conclusions References
Tables Figures
J I
J I
Back Close
Full Screen / Esc
Print Version
Interactive Discussion
EGU
Fig. 13. Regional outflow “residence times” for CO tracers by height and by episode type,cf. Fig. 9. Particle counts in 300 to 400 km ring around MCMA, vertical grid from surface to8000 m a.g.l. in 250 m increments. Mountains surrounding the basin can be seen in the middleof the cylinder with the Pacific Ocean on the bottom, the Gulf of Mexico on the top of the figureand North to the left. Acapulco is along the piece of coast hidden by the cylinder and Veracruzalong the coast hidden by the volcanoes inside the cylinder.
872

ACPD6, 839–877, 2006
Mexico City basinventilation and urban
plume
B. de Foy et al.
Title Page
Abstract Introduction
Conclusions References
Tables Figures
J I
J I
Back Close
Full Screen / Esc
Print Version
Interactive Discussion
EGU
O3−South O3−North Cold Surge
50
82
136
224
368
607
1000
No/ce/dy
Fig. 14. Column “residence time” field by episode for backward MCMA trajectories for the large domain, cf.Fig. 10.
Fig. 15. Particle clouds at 18:00 CDT for the three cases described in the text on the regional scale (top) andthe basin scale (bottom). Particles are coloured according to height above ground level. Top stars correspondto MCMA (centre) and Veracruz (left), bottom stars correspond to CENICA, T1 and T2. Black terrain contourlines shown every 500 m, political boundary of the MCMA in pink.
27
Fig. 14. Column “residence time” field by episode for backward MCMA trajectories for the largedomain, cf. Fig. 10.
873
ACPD6, 839–877, 2006
Mexico City basinventilation and urban
plume
B. de Foy et al.
Title Page
Abstract Introduction
Conclusions References
Tables Figures
J I
J I
Back Close
Full Screen / Esc
Print Version
Interactive Discussion
EGU
O3−South O3−North Cold Surge
50
82
136
224
368
607
1000
No/ce/dy
Fig. 14. Column “residence time” field by episode for backward MCMA trajectories for the large domain, cf.Fig. 10.
Fig. 15. Particle clouds at 18:00 CDT for the three cases described in the text on the regional scale (top) andthe basin scale (bottom). Particles are coloured according to height above ground level. Top stars correspondto MCMA (centre) and Veracruz (left), bottom stars correspond to CENICA, T1 and T2. Black terrain contourlines shown every 500 m, political boundary of the MCMA in pink.
27
Fig. 15. Particle clouds at 18:00 CDT for the three cases described in the text on the re-gional scale (top) and the basin scale (bottom). Particles are coloured according to heightabove ground level. Top stars correspond to MCMA (centre) and Veracruz (left), bottom starscorrespond to CENICA, T1 and T2. Black terrain contour lines shown every 500 m, politicalboundary of the MCMA in pink.
874
ACPD6, 839–877, 2006
Mexico City basinventilation and urban
plume
B. de Foy et al.
Title Page
Abstract Introduction
Conclusions References
Tables Figures
J I
J I
Back Close
Full Screen / Esc
Print Version
Interactive Discussion
EGU
Fig. 16. Particle cloud cross-section at 18:00 CDT for the three cases described in the text. Vertical slice alongline AB (Fig. 2), showing particles to the west (top) and to the east (bottom). Particles coloured by age.
Pass
South
NE
NW
Release
15−Apr−2003 18:00 23−Apr−2003 18:00 08−Apr−2003 18:00
Fig. 17. Particle paths from four releases on the basin periphery at 18:00 CDT for the three cases described inthe text. Pass (red) is in the Chalco passage, South (yellow) in the Cuautla valley, NE (blue) near Pachuca andNW (green) to the north-west.
28
Fig. 16. Particle cloud cross-section at 18:00 CDT for the three cases described in the text.Vertical slice along line AB (Fig. 2), showing particles to the west (top) and to the east (bottom).Particles coloured by age.
875

ACPD6, 839–877, 2006
Mexico City basinventilation and urban
plume
B. de Foy et al.
Title Page
Abstract Introduction
Conclusions References
Tables Figures
J I
J I
Back Close
Full Screen / Esc
Print Version
Interactive Discussion
EGU
Fig. 16. Particle cloud cross-section at 18:00 CDT for the three cases described in the text. Vertical slice alongline AB (Fig. 2), showing particles to the west (top) and to the east (bottom). Particles coloured by age.
Pass
South
NE
NW
Release
15−Apr−2003 18:00 23−Apr−2003 18:00 08−Apr−2003 18:00
Fig. 17. Particle paths from four releases on the basin periphery at 18:00 CDT for the three cases described inthe text. Pass (red) is in the Chalco passage, South (yellow) in the Cuautla valley, NE (blue) near Pachuca andNW (green) to the north-west.
28
Fig. 17. Particle paths from four releases on the basin periphery at 18:00 CDT for the threecases described in the text. Pass (red) is in the Chalco passage, South (yellow) in the Cuautlavalley, NE (blue) near Pachuca and NW (green) to the north-west.
876
ACPD6, 839–877, 2006
Mexico City basinventilation and urban
plume
B. de Foy et al.
Title Page
Abstract Introduction
Conclusions References
Tables Figures
J I
J I
Back Close
Full Screen / Esc
Print Version
Interactive Discussion
EGU
O3-South O3-North Cold Surge00-05
06-11
18-23
12-17
LLJV. MixAloft
Plateau Flow
Conv.
Gulf
MountainBlocking
Channelling
Build-up
LLJ
NE Exhaust
Over-Rim
Up-Valley Flow
Con
v.Fig. 18. Circulation Model for the Mexico City basin for O3-South, O3-North and Cold Surge episode types.Arrows coloured by time of day: early morning (0-5) in blue, morning (6-11) in red, afternoon (12-17) in brownand evening (18-23) in yellow. Plateau winds on O3-South days combine with vigorous mixing to transport theurban plume southwards of the mountains. A low level jet forms in the Chalco passage causing a convergenceline in the south of the city. Strong westerly flow on O3-North days first enters the basin from the north-westbut then comes over the south and west rims of the basin during the day. The combination with the low leveljet forms a north-south convergence zone and exhaust of the basin to the north-east. On Cold Surge days strongnortherly winds blow into the basin. Low mixing heights lead to pollutant accumulation in the city and channelflow through the Chalco passage.
29
Fig. 18. Circulation Model for the Mexico City basin for O3-South, O3-North and Cold Surgeepisode types. Arrows coloured by time of day: early morning (0–5) in blue, morning (6–11)in red, afternoon (12–17) in brown and evening (18–23) in yellow. Plateau winds on O3-Southdays combine with vigorous mixing to transport the urban plume southwards of the mountains.A low level jet forms in the Chalco passage causing a convergence line in the south of thecity. Strong westerly flow on O3-North days first enters the basin from the north-west but thencomes over the south and west rims of the basin during the day. The combination with thelow level jet forms a north-south convergence zone and exhaust of the basin to the north-east.On Cold Surge days strong northerly winds blow into the basin. Low mixing heights lead topollutant accumulation in the city and channel flow through the Chalco passage.
877