Rapid assessment of visual function: an electronic sweep ...
11
Rapid assessment of visual function: an electronic sweep technique for the pattern visual evoked potential Christopher W. Tyler, Patricia Apkarian, Dennis M. Levi, and Ken Nakayama We have developed, an electronic spatial frequency sweep technique for electrophysiological assessment of visual acuity and. pattern vision. The technique allows an accurate and. reliable measurement ofVEPs to a full range of spatial frequencies in just 10 sec. Because the mea- surements are so rapid, the technique suggests several new improvements in the assessment of visual function. Sweeping spatial frequency linearly and. extrapolating the high-frequency region of the VEP spatial-tuning function to zero voltage allows an estimate of acuity which correlates highly with psychophysical estimates of acuity. Variants of the procedure are appro- priate for the assessment of refractive error, determination of equality of visual function for the two eyes and of binocular interactions, and for sequential assessment of therapeutic conditions. Key words: visual evoked potential, pattern vision, diagnosis, therapeutic evaluation, binocular interactions, visual acuity, refraction c -linical assessment of visual function is re- lying progressively more on visual evoked potential (VEP) scalp recording as an objec- tive indicator of visual system loss. 1 " 6 The classical technique of transient VEPs from flashed or pattern reversal stimulation is rel- atively slow, requiring stimulation times of the order of 1 min to obtain a single response average. Proportionately more time is re- quired to estimate visual acuity or measure the range of stimulus patterns to which the visual system responds. This lengthy record- ing time is a great disadvantage for clinical From the Smith-Kettlewell Institute of Visual Sciences, Pacific Medical Center, San Francisco, Calif. Supported by National Institutes of Health grants 5 R01 EY01582, 1R01 EY02124, R01 EY01728, and 5 P30 EY01186; National Institutes of Health General Re- search Grant 5 SOI RR05566; and The Smith-Kettle- well Eye Research Foundation. Submitted for publication Aug. 21, 1978. Reprint requests: Dr. Christopher W. Tyler, Smith- Kettlewell Institute, 2232 Webster St., San Francisco, Calif. 94115. assessment in young children or for screening purposes. The recording process can be greatly speeded by recording the synchro- nous VEP response at high temporal fre- quencies of stimulation. 7 " 10 The major infor- mation about response amplitude and phase can be obtained in a second or two using syn- chronous recording at 10 to 100 Hz rates. This increase in recording speed allows the use of sweep techniques for presenting the full range of a stimulus variable in a single recording session. We have developed an electronic spatial-frequency sweep technique for electrophysiological assessment of visual acuity and pattern response. This enables us to measure the VEP to the full range of spa- tial frequencies in a 10 sec sweep with good resolution and reliability. A slower optome- chanical version of this technique has re- cently been described by Regan. 6 Methods The electronic equipment consists of a visual display, a synchronous filter for the electroen- 0146-0404/79/070703+ll$01.10/0 © 1979 Assoc. for Res. in Vis. and Ophthal., Inc. 703
Transcript of Rapid assessment of visual function: an electronic sweep ...
Rapid assessment of visual function: anelectronic sweep technique for the pattern
visual evoked potentialChristopher W. Tyler, Patricia Apkarian, Dennis M. Levi, and Ken Nakayama
We have developed, an electronic spatial frequency sweep technique for electrophysiologicalassessment of visual acuity and. pattern vision. The technique allows an accurate and. reliablemeasurement ofVEPs to a full range of spatial frequencies in just 10 sec. Because the mea-surements are so rapid, the technique suggests several new improvements in the assessment ofvisual function. Sweeping spatial frequency linearly and. extrapolating the high-frequencyregion of the VEP spatial-tuning function to zero voltage allows an estimate of acuity whichcorrelates highly with psychophysical estimates of acuity. Variants of the procedure are appro-priate for the assessment of refractive error, determination of equality of visual function for thetwo eyes and of binocular interactions, and for sequential assessment of therapeutic conditions.
Key words: visual evoked potential, pattern vision, diagnosis, therapeuticevaluation, binocular interactions, visual acuity, refraction
c-linical assessment of visual function is re-lying progressively more on visual evokedpotential (VEP) scalp recording as an objec-tive indicator of visual system loss.1"6 Theclassical technique of transient VEPs fromflashed or pattern reversal stimulation is rel-atively slow, requiring stimulation times ofthe order of 1 min to obtain a single responseaverage. Proportionately more time is re-quired to estimate visual acuity or measurethe range of stimulus patterns to which thevisual system responds. This lengthy record-ing time is a great disadvantage for clinical
From the Smith-Kettlewell Institute of Visual Sciences,Pacific Medical Center, San Francisco, Calif.
Supported by National Institutes of Health grants 5 R01EY01582, 1R01 EY02124, R01 EY01728, and 5 P30EY01186; National Institutes of Health General Re-search Grant 5 SOI RR05566; and The Smith-Kettle-well Eye Research Foundation.
Submitted for publication Aug. 21, 1978.Reprint requests: Dr. Christopher W. Tyler, Smith-
Kettlewell Institute, 2232 Webster St., San Francisco,Calif. 94115.
assessment in young children or for screeningpurposes. The recording process can begreatly speeded by recording the synchro-nous VEP response at high temporal fre-quencies of stimulation.7"10 The major infor-mation about response amplitude and phasecan be obtained in a second or two using syn-chronous recording at 10 to 100 Hz rates.
This increase in recording speed allows theuse of sweep techniques for presenting thefull range of a stimulus variable in a singlerecording session. We have developed anelectronic spatial-frequency sweep techniquefor electrophysiological assessment of visualacuity and pattern response. This enables usto measure the VEP to the full range of spa-tial frequencies in a 10 sec sweep with goodresolution and reliability. A slower optome-chanical version of this technique has re-cently been described by Regan.6
Methods
The electronic equipment consists of a visualdisplay, a synchronous filter for the electroen-
0146-0404/79/070703+ll$01.10/0 © 1979 Assoc. for Res. in Vis. and Ophthal., Inc. 703
704 Tyler et al. Invest. Ophthalmol. Visual Set.July 1979
S T I M U L U S
VCFSPATIAL
FREQUENCYGENERATOR
RASTER —
RECORDING
1CONTRASTREVERSAL
*
PRE-AMP —SYNCHRONOUS
FILTER ANDINTEGRATOR
RAMPGENERATOR
Y
X-Y PLOTTER
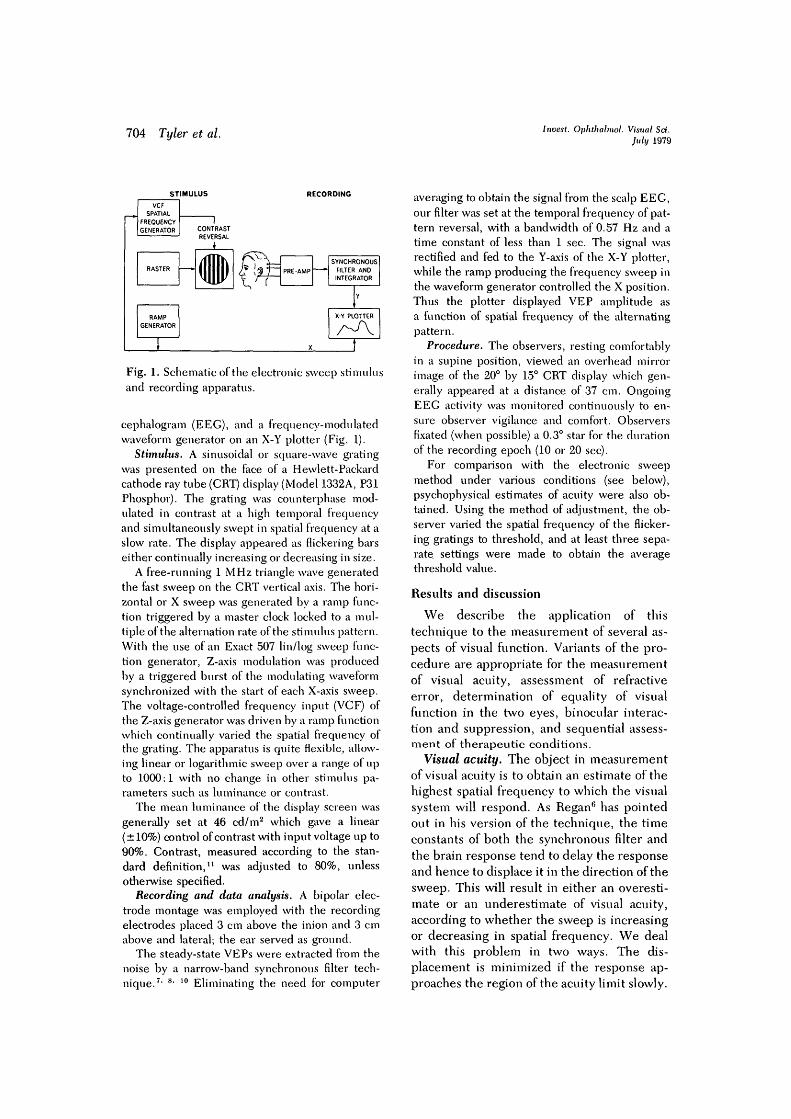
Fig. 1. Schematic of the electronic sweep stimulusand recording apparatus.
cephalogram (EEG), and a frequency-modulatedwaveform generator on an X-Y plotter (Fig. 1).
Stimulus. A sinusoidal or square-wave gratingwas presented on the face of a Hewlett-Packardcathode ray tube (CRT) display (Model 1332A, P31Phosphor). The grating was counterphase mod-ulated in contrast at a high temporal frequencyand simultaneously swept in spatial frequency at aslow rate. The display appeared as flickering barseither continually increasing or decreasing in size.
A free-running 1 MHz triangle wave generatedthe fast sweep on the CRT vertical axis. The hori-zontal or X sweep was generated by a ramp func-tion triggered by a master clock locked to a mul-tiple of the alternation rate of the stimulus pattern.With the use of an Exact 507 lin/log sweep func-tion generator, Z-axis modulation was producedby a triggered burst of the modulating waveformsynchronized with the start of each X-axis sweep.The voltage-controlled frequency input (VCF) ofthe Z-axis generator was driven by a ramp functionwhich continually varied the spatial frequency ofthe grating. The apparatus is quite flexible, allow-ing linear or logarithmic sweep over a range of upto 1000:1 with no change in other stimulus pa-rameters such as luminance or contrast.
The mean luminance of the display screen wasgenerally set at 46 cd/m2 which gave a linear(±10%) control of contrast with input voltage up to90%. Contrast, measured according to the stan-dard definition," was adjusted to 80%, unlessotherwise specified.
Recording and data analysis. A bipolar elec-trode montage was employed with the recordingelectrodes placed 3 cm above the inion and 3 cmabove and lateral; the ear served as ground.
The steady-state VEPs were extracted from thenoise by a narrow-band synchronous filter tech-nique.7' 8| 10 Eliminating the need for computer
averaging to obtain the signal from the scalp EEG,our filter was set at the temporal frequency of pat-tern reversal, with a bandwidth of 0.57 Hz and atime constant of less than 1 sec. The signal wasrectified and fed to the Y-axis of the X-Y plotter,while the ramp producing the frequency sweep inthe waveform generator controlled the X position.Thus the plotter displayed VEP amplitude asa function of spatial frequency of the alternatingpattern.
Procedure. The observers, resting comfortablyin a supine position, viewed an overhead mirrorimage of the 20° by 15° CRT display which gen-erally appeared at a distance of 37 cm. OngoingEEG activity was monitored continuously to en-sure observer vigilance and comfort. Observersfixated (when possible) a 0.3° star for the durationof the recording epoch (10 or 20 sec).
For comparison with the electronic sweepmethod under various conditions (see below),psychophysical estimates of acuity were also ob-tained. Using the method of adjustment, the ob-server varied the spatial frequency of the flicker-ing gratings to threshold, and at least three sepa-rate, settings were made to obtain the averagethreshold value.
Results and discussion
We describe the application of thistechnique to the measurement of several as-pects of visual function. Variants of the pro-cedure are appropriate for the measurementof visual acuity, assessment of refractiveerror, determination of equality of visualfunction in the two eyes, binocular interac-tion and suppression, and sequential assess-ment of therapeutic conditions.
Visual acuity. The object in measurementof visual acuity is to obtain an estimate of thehighest spatial frequency to which the visualsystem will respond. As Regan6 has pointedout in his version of the technique, the timeconstants of both the synchronous filter andthe brain response tend to delay the responseand hence to displace it in the direction of thesweep. This will result in either an overesti-mate or an underestimate of visual acuity,according to whether the sweep is increasingor decreasing in spatial frequency. We dealwith this problem in two ways. The dis-placement is minimized if the response ap-proaches the region of the acuity limit slowly.
Volume 18Number 7 Rapid assessment of visual function 705
6 9 12SPATIAL FREQUENCY (c/deg)
15
5 l
4H
2-
1-
10 15 20 25
SPATIAL FREQUENCY (c/deg)
30 35
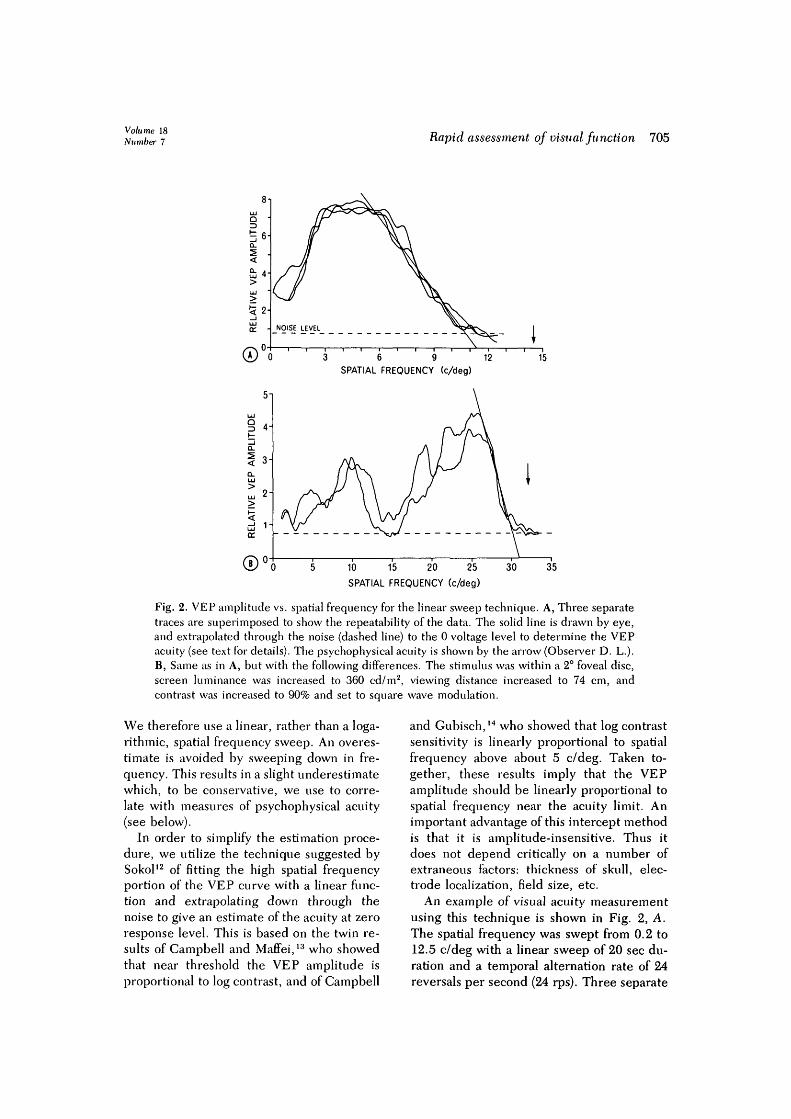
Fig. 2. VEP amplitude vs. spatial frequency for the linear sweep technique. A, Three separatetraces are superimposed to show the repeatability of the data. The solid line is drawn by eye,and extrapolated through the noise (dashed line) to the 0 voltage level to determine the VEPacuity (see text for details). The psychophysical acuity is shown by the arrow (Observer D. L.).B, Same as in A, but with the following differences. The stimulus was within a 2° foveal disc,screen luminance was increased to 360 cd/m2, viewing distance increased to 74 cm, andcontrast was increased to 90% and set to square wave modulation.
We therefore use a linear, rather than a loga-rithmic, spatial frequency sweep. An overes-timate is avoided by sweeping down in fre-quency. This results in a slight underestimatewhich, to be conservative, we use to corre-late with measures of psychophysical acuity(see below).
In order to simplify the estimation proce-dure, we utilize the technique suggested bySokol12 of fitting the high spatial frequencyportion of the VEP curve with a linear func-tion and extrapolating down through thenoise to give an estimate of the acuity at zeroresponse level. This is based on the twin re-sults of Campbell and Maffei,13 who showedthat near threshold the VEP amplitude isproportional to log contrast, and of Campbell
and Gubisch,14 who showed that log contrastsensitivity is linearly proportional to spatialfrequency above about 5 c/deg. Taken to-gether, these results imply that the VEPamplitude should be linearly proportional tospatial frequency near the acuity limit. Animportant advantage of this intercept methodis that it is amplitude-insensitive. Thus itdoes not depend critically on a number ofextraneous factors: thickness of skull, elec-trode localization, field size, etc.
An example of visual acuity measurementusing this technique is shown in Fig. 2, A.The spatial frequency was swept from 0.2 to12.5 c/deg with a linear sweep of 20 sec du-ration and a temporal alternation rate of 24reversals per second (24 rps). Three separate
706 Tyler et al. Invest. Ophtlialmol. Visual Sci.
July 1979
2 4 6 8 10 12SPATIAL FREQUENCY (c/deg)
2 4 6 8 10 12 14
SPATIAL FREQUENCY (c/deg)
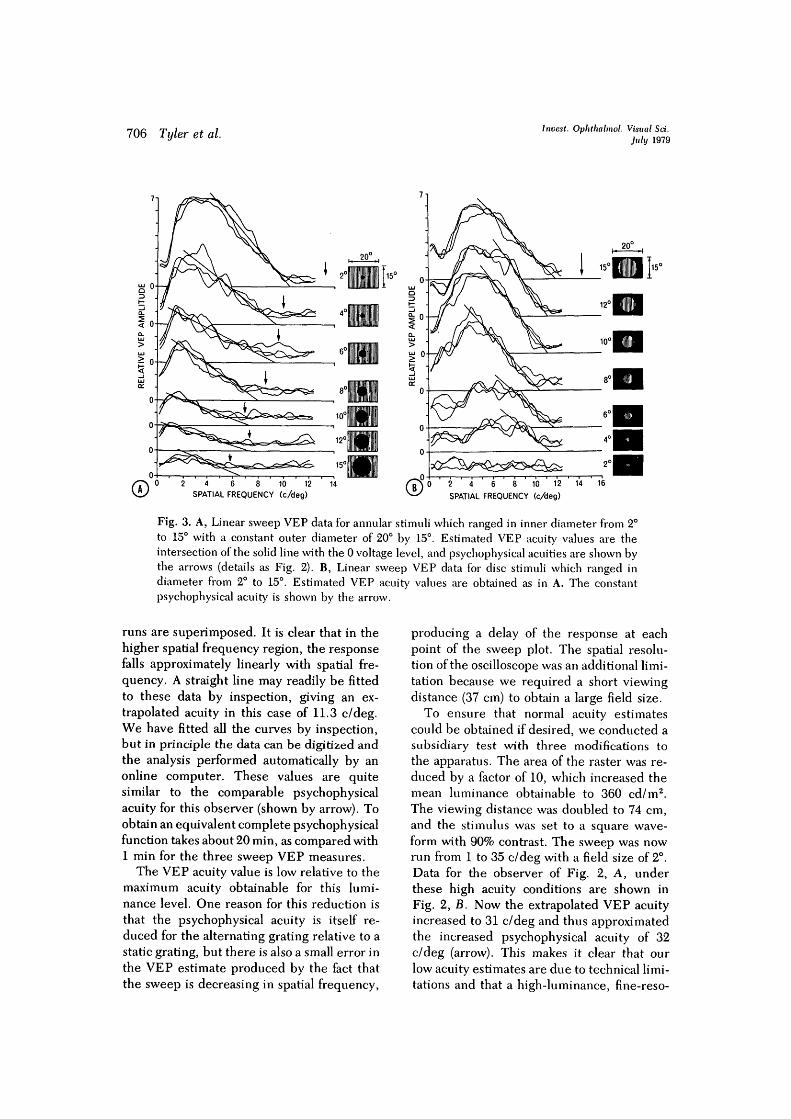
Fig. 3. A, Linear sweep VEP data for annular stimuli which ranged in inner diameter from 2°to 15° with a constant outer diameter of 20° by 15°. Estimated VEP acuity values are theintersection of the solid line with the 0 voltage level, and psychophysical acuities are shown bythe arrows (details as Fig. 2). B, Linear sweep VEP data for disc stimuli which ranged indiameter from 2° to 15°. Estimated VEP acuity values are obtained as in A. The constantpsychophysical acuity is shown by the arrow.
runs are superimposed. It is clear that in thehigher spatial frequency region, the responsefalls approximately linearly with spatial fre-quency. A straight line may readily be fittedto these data by inspection, giving an ex-trapolated acuity in this case of 11.3 c/deg.We have fitted all the curves by inspection,but in principle the data can be digitized andthe analysis performed automatically by anonline computer. These values are quitesimilar to the comparable psychophysicalacuity for this observer (shown by arrow). Toobtain an equivalent complete psychophysicalfunction takes about 20 min, as compared with1 min for the three sweep VEP measures.
The VEP acuity value is low relative to themaximum acuity obtainable for this lumi-nance level. One reason for this reduction isthat the psychophysical acuity is itself re-duced for the alternating grating relative to astatic grating, but there is also a small error inthe VEP estimate produced by the fact thatthe sweep is decreasing in spatial frequency,
producing a delay of the response at eachpoint of the sweep plot. The spatial resolu-tion of the oscilloscope was an additional limi-tation because we required a short viewingdistance (37 cm) to obtain a large field size.
To ensure that normal acuity estimatescould be obtained if desired, we conducted asubsidiary test with three modifications tothe apparatus. The area of the raster was re-duced by a factor of 10, which increased themean luminance obtainable to 360 cd/m2.The viewing distance was doubled to 74 cm,and the stimulus was set to a square wave-form with 90% contrast. The sweep was nowrun from 1 to 35 c/deg with a field size of 2°.Data for the observer of Fig. 2, A, underthese high acuity conditions are shown inFig. 2, B. Now the extrapolated VEP acuityincreased to 31 c/deg and thus approximatedthe increased psychophysical acuity of 32c/deg (arrow). This makes it clear that ourlow acuity estimates are due to technical limi-tations and that a high-luminance, fine-reso-
Volume 18Number 7 Rapid assessment of visual function 707
RETINAL CONTRAST LUMINANCE DEFOCUS
LOCATION
4 8 0 4 8 0 4VEP ACUITY (c/deg)
12 16
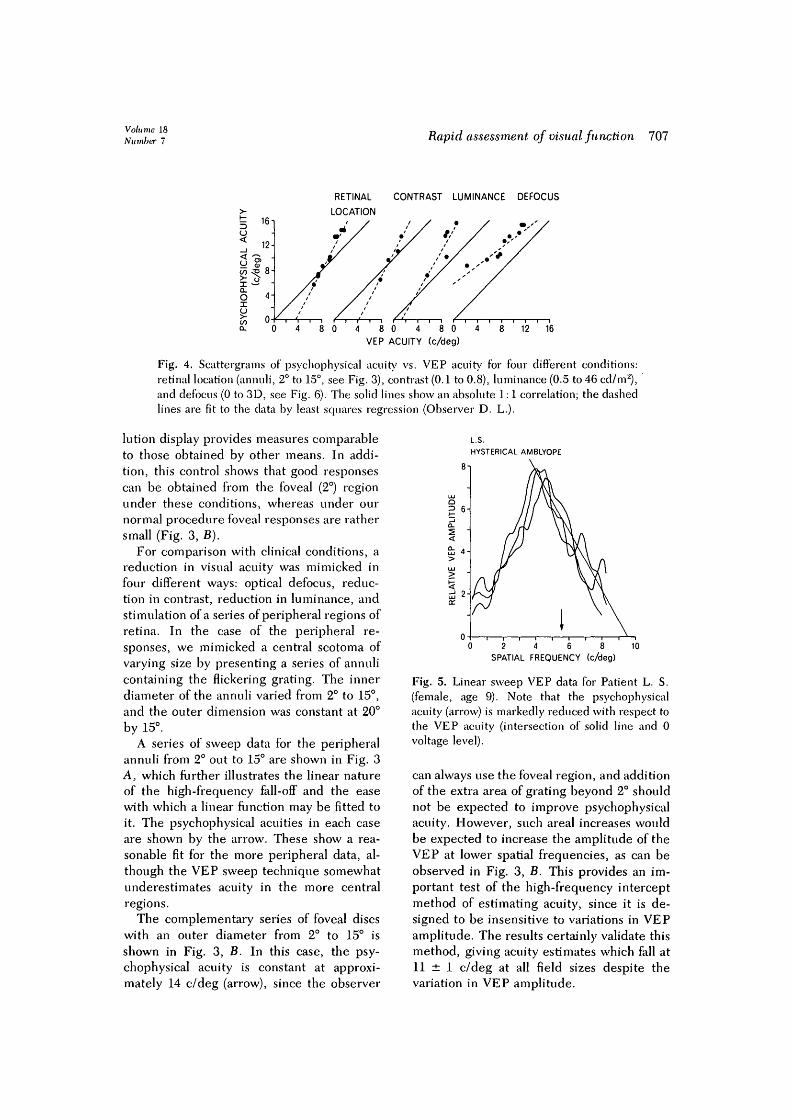
Fig. 4. Scattergrams of psychophysical acuity vs. VEP acuity for four different conditions:retinal location (annuli, 2° to 15°, see Fig. 3), contrast (0.1 to 0.8), luminance (0.5 to 46 cd/m2),and defocus (0 to 3D, see Fig. 6). The solid lines show an absolute 1:1 correlation; the dashedlines are fit to the data by least squares regression (Observer D. L.).
lution display provides measures comparableto those obtained by other means. In addi-tion, this control shows that good responsescan be obtained from the foveal (2°) regionunder these conditions, whereas under ournormal procedure foveal responses are rathersmall (Fig. 3, B).
For comparison with clinical conditions, areduction in visual acuity was mimicked infour different ways: optical defocus, reduc-tion in contrast, reduction in luminance, andstimulation of a series of peripheral regions ofretina. In the case of the peripheral re-sponses, we mimicked a central scotoma ofvarying size by presenting a series of annulicontaining the flickering grating. The innerdiameter of the annuli varied from 2° to 15°,and the outer dimension was constant at 20°by 15°.
A series of sweep data for the peripheralannuli from 2° out to 15° are shown in Fig. 3A, which further illustrates the linear natureof the high-frequency fall-off and the easewith which a linear function may be fitted toit. The psychophysical acuities in each caseare shown by the arrow. These show a rea-sonable fit for the more peripheral data, al-though the VEP sweep technique somewhatunderestimates acuity in the more centralregions.
The complementary series of foveal discswith an outer diameter from 2° to 15° isshown in Fig. 3, B. In this case, the psy-chophysical acuity is constant at approxi-mately 14 c/deg (arrow), since the observer
L.S.HYSTERICAL AMBLYOPE
Q? 6
2-
2 4 6 8SPATIAL FREQUENCY (c/deg)
10
Fig. 5. Linear sweep VEP data for Patient L. S.(female, age 9). Note that the psychophysicalacuity (arrow) is markedly reduced with respect tothe VEP acuity (intersection of solid line and 0voltage level).
can always use the foveal region, and additionof the extra area of grating beyond 2° shouldnot be expected to improve psychophysicalacuity. However, such areal increases wouldbe expected to increase the amplitude of theVEP at lower spatial frequencies, as can beobserved in Fig. 3, B. This provides an im-portant test of the high-frequency interceptmethod of estimating acuity, since it is de-signed to be insensitive to variations in VEPamplitude. The results certainly validate thismethod, giving acuity estimates which fall at11 ± 1 c/deg at all field sizes despite thevariation in VEP amplitude.

708 Tyler et al. Invest. Ophthalmol. Visual Sri.July 1979
DEFOCUS
(DIOPTERS)
0.00
4 8 12SPATIAL FREQUENCY (c/deg)
16
Fig. 6. Linear sweep VEP data for 0.00 to 3.00diopters of optical defocus. Details are as in theother linear sweep data (see Fig. 2).
Similar series were obtained for centralviewing of a 20° by 15° field with reductionsin contrast, with reductions in mean lumi-nance level, and with optical defocus. Thefull set of acuity estimates is plotted in theform of scattergrams between psychophysicaland sweep VEP measures (Fig. 4). The corre-lations obtained between the psychophysicalacuity and VEP acuity estimates for thesefour conditions are high (r = 0.87 to 0.99),but under our conditions, the sweep VEPtends to underestimate the higher acuity val-ues by about 25% (0.1 log unit). The solid linein each scattergram indicates a theoreticalabsolute correlation between the two mea-
sures. The dashed lines have been fit to thedata by least-squares regression. It is inter-esting that the slopes of the regression linesfor the retinal location, contrast, and lumi-nance conditions are quite similar, whereasthe optical defocus data show a much flatterslope, suggesting that the VEP may be amore sensitive indicant of blur than is psy-chophysical acuity (see Refractive error).
An exception to this acuity underestimatein normal observers was found in the case of apatient with hysterical amblyopia (Fig. 5).This patient showed a significantly higherVEP acuity than that determined psycho-physically (shown by the arrow) under pre-cisely the same stimulus conditions (Fig. 5).In hysterical amblyopia, pattern VEPs areusually normal, and visual acuity is equallyreduced bilaterally, probably due to psycho-genie factors.15' 16
We conclude that linear extrapolation fromthe linear sweep VEP provides a usefultechnique for the estimation of visual acuity,not only of the over-all retina but also forlocalized regions of retina which may havesuffered specific pathological losses. In theseexamples, we have limited the study to mildlosses, but the technique may readily beadapted for extreme conditions by confiningthe total sweep to a smaller range, for ex-ample, 0.1 -^ 2 c/deg instead of 0.2 -» 12.5c/deg as has been shown here.
Refractive error. The linear sweeptechnique can be used for the reliable mea-surement of refractive error. There has re-cently been a series of claims and counter-claims as to the validity of VEP responsesin refractive error.17"21 These studies haveall relied on the effects of blurring the edgesof checks or bars of sizes which were wellabove the visual acuity limit. Typical sizesmight be 10' or 20' checks, whereas thaacuity limit is reached with about 1' checks.These authors also used low reversal rates.
Rather than picking a particular check sizeor spatial frequency, our approach utilizesthe fast sweep technique to extrapolate tothe effective acuity produced by refractiveerror. We find that the linear sweep tech-nique is highly accurate and can objectively
Volume 18Nu miter 7 Rapid assessment of visual function 709
determine refractive state to within 0.25diopter quite rapidly. This degree of accu-racy results from the fact that the effects ofblur are more marked at or near the acuitylimit.22
The technique consists simply in recordingthe synchronous responses to the linearsweep, counterphase grating stimulus viewedthrough a set of refracting lenses. Eachsweep takes 10 sec. The standard ophthalmicprocedure of hill-climbing through sphericalpower, then astigmatic axis, and finally cylin-drical power can be used by employing ap-propriately oriented gratings, except that themeasure of visual acuity is now objectiverather than relying on subjective discrimina-tions. The main problem is to ensure that theobserver's fixation remains in the center ofthe stimulus, so that a fair degree of coopera-tion is still necessary. In assessing infants andyoung children, a "peek-a-boo" technique(i.e., keeping the screen covered until im-mediately prior to recording) is quite effec-tive in ensuring fixation on and attention tothe visual display. With this procedure abasic assessment of refractive error hasproved possible even in patients as young as6 months of age.
The sensitivity of the linear sweep to in-duced refractive error is illustrated for a goodobserver in Fig. 6, which shows a series ofsweeps with increasing spherical power, withthe linear functions extrapolated to zero re-sponse amplitude. Note that there is littlechange in the response amplitude at low spa-tial frequencies (e.g., 2 c/deg). The data fallwith a good approximation to linearity, and itis clear that a small change in lens power hasa strong effect on the extrapolated value ofthe spatial frequency limit. It is probable thatthis extra loss in the VEP reflects the inabilityto accommodate continuously on the blurredstimulus, whereas short periods of good ac-commodation may be sufficient for psycho-physical determinations.
These data show that, contrary to the con-clusion of Bostrom et al.,21 it is possible touse the VEP for estimation of refractive errorif the technique involves stimulation by highspatial frequencies and higher temporal fre-
O.D. O.S.A.NORMAL
20/15 20/15
B. CHORIORETINITIS20/400
5 C. STRABISMIC AMBLYOPEw 20/20 20/60001
0.2 2 20 0.2 2SPATIAL FREQUENCY (c/deg)
20
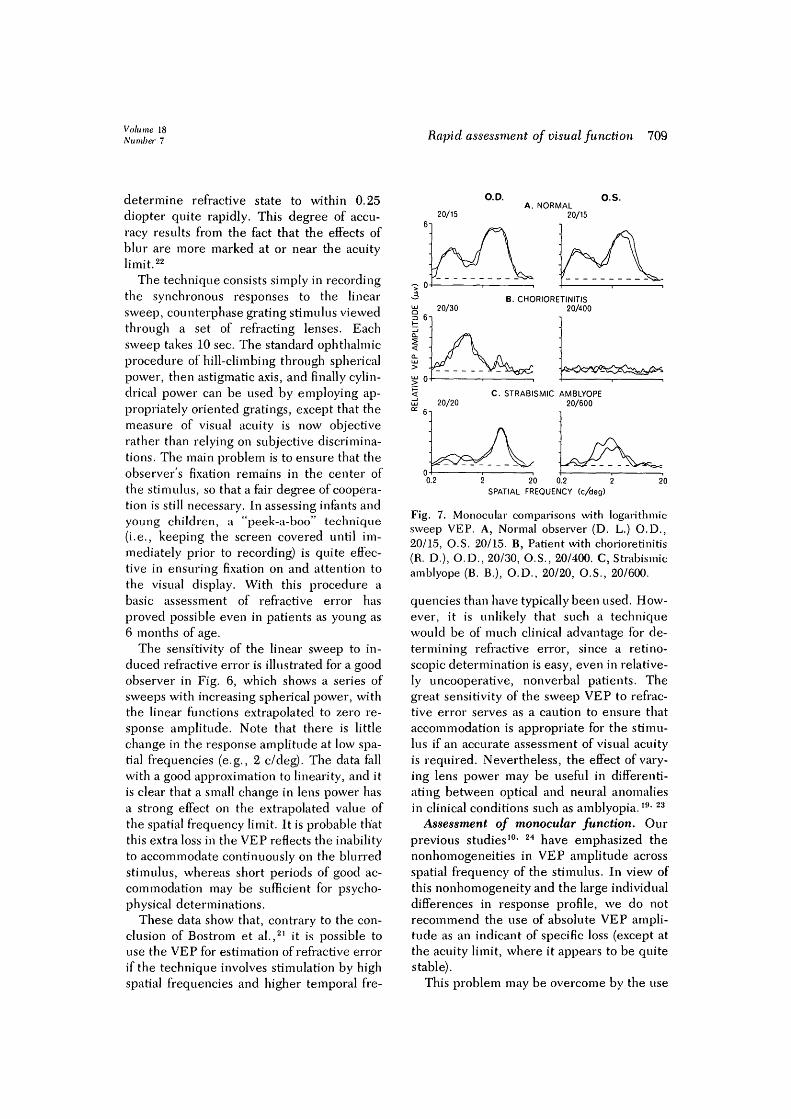
Fig. 7. Monocular comparisons with logarithmicsweep VEP. A, Normal observer (D. L.) O.D.,20/15, O.S. 20/15. B, Patient with chorioretinitis(R. D.), O.D., 20/30, O.S., 20/400. C, Strabismicamblyope (B. B.), O.D., 20/20, O.S., 20/600.
quencies than have typically been used. How-ever, it is unlikely that such a techniquewould be of much clinical advantage for de-termining refractive error, since a retino-scopic determination is easy, even in relative-ly uncooperative, nonverbal patients. Thegreat sensitivity of the sweep VEP to refrac-tive error serves as a caution to ensure thataccommodation is appropriate for the stimu-lus if an accurate assessment of visual acuityis required. Nevertheless, the effect of vary-ing lens power may be useful in differenti-ating between optical and neural anomaliesin clinical conditions such as amblyopia.l9< 23
Assessment of monocular function. Ourprevious studies10- 24 have emphasized thenonhomogeneities in VEP amplitude acrossspatial frequency of the stimulus. In view ofthis nonhomogeneity and the large individualdifferences in response profile, we do notrecommend the use of absolute VEP ampli-tude as an indicant of specific loss (except atthe acuity limit, where it appears to be quitestable).
This problem may be overcome by the use

710 Tyler et al.Invest. Ophthalmol. Visual Set.
July 1979
6iA. O.U
Q_
LU B. O.D
c. as.
OO
\ <o: a:
5oo2
CQ
0
D.
r\.2 .5 1 2 5 10 20
SPATIAL FREQUENCY (c/deg)
Fig. 8. Binocular interactions for Observer H. S.at 28 rps. In D, a ratio of 1 indicates no summa-tion, 2 indicates perfect summation, and >2 showsfacilitation.
of interocular comparisons. Although normallimits remain to be established, over a testpopulation of about 12 normal individuals wehave not seen marked interocular differencesin the VEP. Both the amplitudes and phasesof the responses are typically similar betweenthe two eyes at all spatial and temporalstimulus frequencies. On the other hand,most patients with some diagnosed monocu-lar pathology show large differences betweenthe pattern of responses from the two eyes.Interocular comparison is therefore a usefuldiagnostic tool and has been extensively uti-lized for pattern-evoked potentials in thepast.4* 6> 23> 25 The interocular comparisontechnique may now be extended to a fullrange of pattern vision by the use of a version
of the spatial-frequency sweep technique.This is of particular importance because it hasrecently been shown psychophysically thatpathological conditions can affect some spa-tial frequencies and not others.26"28 Fur-thermore, there may be residual function atlow spatial frequencies even when acuity isseverely degraded.25' 29~31
In order to give appropriate weight overthe range of spatial frequencies, a logarithmicsweep of spatial frequency is optimal for de-termining the structure of the spatial-fre-quency tuning function. A logarithmic sweepgives equal weight to each octave of spatialfrequency in order to correspond with thetuning functions obtained psychophysi-cally.32- 33 A two-decade range 0.2 to 20 c/degappears adequate, and it is preferable to use a20 sec sweep time if the attention span of thepatient allows it. We have found that a tem-poral frequency in the region of 24 rps isa good compromise between high rate andgood signal-to-noise ratio.
Examples of data from a normal observerand two types of visual dysfunction (chorio-retinitis and strabismic amblyopia) are shownin Fig. 7. What is clear from these data is thatthe curves from the right and left eyes of thenormal observer (Fig. 7, A) are highly similarboth in shape and amplitude even though thecharacteristic specificity of tuning to spatialfrequency is present. Note that these separ-able spatial frequency peaks are often not vis-ible with the linear sweep because the lowand medium frequencies are swept rapidlyand peaks and troughs integrated by the 0.8sec time constant. The logarithmic sweep al-lows more time at these frequencies, but itcorrespondingly reduces accuracy in thehigh-frequency region and hence is unsuit-able for acuity measurement.
Fig. 7, B, shows data from a patient whohad long-standing chorioretinal lesions. Theright eye showed some mild involvement,which appears to be reflected in the slightlyreduced Snellen acuity (20/30), and the factthat the VEP did not show a strong responseat high spatial frequencies. The left eyeshowed large areas of involvement and mark-edly reduced acuity (20/400) and exhibited

Volume 18Number 7 Rapid assessment of visual function 711
drastic VEP losses across the entire fre-quency spectrum. In contrast, the data for astrabismic amblyope (Fig. 7, C) with evengreater visual acuity loss in the left eye (20/600) show a much more selective pattern ofloss and even an increase in response relativeto the normal eye at spatial frequenciesaround 1 c/deg. We have observed such ab-normalities in other amblyopes,25 and similarchanges have been reported by Sokol.31 Thelosses are of course to be expected, but theamplitude increases in the amblyopic eye atparticular spatial frequency regions are sug-gestive of some kind of functional reorgani-zation in the pathways of the amblyopic eye.Two possible processes are suggested by thedata. In most cases, the response increasesappear as a downward shift of the peak seenin the normal eye to lower spatial frequenciesfor the ambylopic eye. Thus, if the peak isproduced by some kind of resonant responseto specific spatial and temporal frequencies,the space/time constants may change to somelarger value, resulting in a peak shift.
The other possibility is that the response isderived from some active inhibitory or sup-pressive mechanism. In this case, the pres-ence of a response might reflect the suppres-sion of function rather than the presenceof some function. This kind of process isexhibited in the ubiquitous alpha-rhythm,which appears when over-all visual functionis under suppression. Certain pattern VEPpeaks could correspond to similar or relatedprocesses operating specifically on the sup-pressed (amblyopic) eye. We have not testedone of these two hypotheses vs. the other asyet.
Assessment of binocular function. A ne-glected aspect in the VEP diagnosis of visualfunction is the assessment of binocularity. Al-though retinal losses must have a concomi-tant effect on the binocular response, undersome conditions (e.g., strabismus), a binocu-lar loss may occur in the absence of retinallosses. We have found that in normal ob-servers the binocular response may vary fromzero summation, in which the binocular re-sponse equals the mean monocular response,to facillation, in which the binocular response
2 5 10 20 .2 .5 1 2
SPATIAL FREQUENCY (c/deg)10 20
Fig. 9. Effect of patching left eye for logarithmicsweep VEP for Observer D. L. at 24 rps.
is greater than the sum of the two monocularresponses. The degree of binocular interac-tion is highly specific and is dependent uponsuch stimulus dimensions as spatial and tem-poral frequency.24 Given this degree of spe-cificity, testing binocular function under onlya few stimulus conditions may be inappro-priate. In this regard, the sweep VEP has agreat advantage because it can be exhaustivewith respect to spatial frequency and thuspermits an extremely rapid exploration of thecomplex details of binocular interactions overa wide range of stimulus conditions. As anillustration of the application to binocular in-teraction, we show the binocular responses ofa normal observer at 28 rps (Fig. 8, A).Fig. 8, B and C, show the responses for theright and left eye obtained under the samestimulus conditions. It is apparent that thebinocular response is considerably largerthan its monocular components but has thesame general form. The comparison is facili-tated by plotting the ratio of the binocular tothe mean monocular response as a function ofspatial frequency (Fig. 8, D). For this ob-server the degree of binocular interaction

712 Tyler et al. Invest. Ophthalmol. Visual Sri.July 1979
varies from no summation at approximately0.6 c/deg to dramatic facilitation in a narrowregion around 3 c/deg, where the binocularresponse is approximately 5.5 times the meanmonocular response.
As is usual in observers with normal vision,the binocular response does not fall belowthe mean of the monocular responses. Sincethe variations seen in binocular interactionsare complex, requiring exploration over awide range of spatial and temporal frequen-cies, we conclude that the sweep VEP tech-nique provides a rapid method for compre-hensive identification and study of binocularinteractions which should be of value in theanalysis of disorders involving abnormalbinocular function.
Therapeutic assessment. The rapidity ofthe sweep technique makes it valuable forsequential monitoring of the effects of thera-peutic techniques on visual function and vi-sual acuity. As an example of a therapeutictechnique which could easily be transposedto the laboratory, we chose a simple monocu-lar patching regimen such as might be usedin the treatment of amblyopia. The monitor-ing procedure is equally applicable to the ef-fects of topical or systemic drug treatments,surgical procedures, or even optical manipu-lations.
The procedure consisted of occluding theleft eye of a normal observer for 5 hr while heambulated in a normal visual environment(except for the brief test periods). The sweepVEP was measured for each eye alone and forboth together, to determine the changes inmonocular function and binocular interac-tions. Measurements were taken prior topatching, once an hour during patching, andat regular intervals after removal of the patchto determine the effects of recovery. The log-arithmic sweep was used because we wereinterested not so much in visual acuity as inthe general effects of patching on the variousfrequency regions.
Sample results are shown in Fig. 9 for thespatial tuning functions obtained prior topatching (Fig. 9, A), at 2 and 5 hr followingapplication of the patch to the left eye (Fig. 9,B), and 15 and 75 min after removal of thepatch (Fig. 9, C). After 2 hr of patching, little
change is evident; after 5 hr, there is adramatic doubling of the amplitude of thehigh-frequency peak in the exposed eye, ac-companied by little change in the patchedeye. Such an increase in the nondeprived eyehas been reported recently in this journal34
and must be a neural effect since no patchingwas applied to this eye.
Removal of the patch produced the firstmajor effect on the patched eye, which was adramatic response increase reminiscent of apostinhibitory rebound (Fig. 9, C). The un-patched eye's response was decreased againby removal of the patch; by 75 min after re-moval, the responses of the left eye wereback to the baseline level, while the right eyestill showed some elevation. Curiously, nointeresting changes were observed in thebinocular response, which remained at about0.8 of the sum of the monocular responsesthroughout all conditions. Similar resultshave been found during patching with tran-sient VEP recording,34 but the rapid sweeptechnique allows examination of the post-patch period over the entire range of spatialfrequencies.
The data presented here are intended toshow that the sweep VEP technique is sensi-tive to visual changes produced by this ther-apeutic patching regimen. In addition, thesweep technique allows the effects of patch-ing to be assessed with great rapidity, thusminimizing exposure during the testingsequence.
Conclusion
The electronic sweep technique describedprovides a rapid and useful method of VEPassessment of several aspects of pattern vi-sion. The speed and reliability of assessingpattern vision by sweeping spatial frequen-cies, as well as other stimulus dimensions,are of great value for both clinical and re-search purposes.
We thank A. J. Alden and E. E. Sutter for technicalassistance, Jim Brodale for graphic illustrations, andA. B. Scott, M.D., and]. A. Gammon, M.D., for patientreferral.
REFERENCES1. Millodot, M.: New method of objective refraction:
Electrophysiology, Can. J. Optom. 33:64, 1971.

Volume 18Number 7 Rapid assessment of visual function 713
2. Sokol, S.: An electrodiagnostic index of macular de-generation, Arch. Ophthalmol. 88:619, 1972.
3. Halliday, A.M., McDonald, W.I., and Muslim, J.:Visual evoked response in diagnosis of multiple scle-rosis, Br. Med. J. 4:661, 1973.
4. Arden, G.B.: The visual evoked response in oph-thalmology, Proc. R. Soc. Med. 66:1037, 1973.
5. Bodis-Wollner, I., Hendley, C D . , and Atkin, A.:Evaluation by evoked potentials of dissociated visualfunctions in patients with cerebral lesions. InDesmedt, J.E., editor: Visual Evoked Potentials inMan: New Developments, Oxford, 1977, ClarendonPress, pp. 514-524.
6. Regan, D.: Rapid methods for refracting the eye andassessing the visual acuity in amblyopia usingsteady-state visual evoked potentials. In Desmedt,J.E., editor: Visual Evoked Potentials in Man: NewDevelopments, Oxford, 1977, Clarendon Press,pp. 418-426.
7. Fricker, S.J.: Narrow-band filter techniques for thedetection and measurement of evoked responses,Electroencephalogr. Clin. Neurophysiol. 14:411,1962.
8. Van der Tweel, L. H., Sem-Jacobsen, C.W., Kamp,A., Van Leeuwen, W.S., and Verings, F.T.H.: Ob-jective determination of response to modulatedlight, Acta Physiol. Pharmacol. Neerl. 7:528, 1958.
9. Regan, D.: Latencies of evoked potentials to flickerand to pattern speedily estimated by simultaneousstimulation method, Electroencephalogr. Clin.Neurophysiol. 40:654, 1976.
10. Tyler, C.W., Apkarian, P., and Nakayama, K.:Multiple spatial frequency tuning of electrical re-sponses from the human visual cortex, Exp. BrainRes. 33:535, 1978.
11. Michelson, AA.: Studies in Optics, Chicago, 1927,University of Chicago Press.
12. Sokol, S.: Measurement of infant visual acuity frompattern reversal evoked potentials, Vision Res.18:33, 1978.
13. Campbell, F.W., and Maffei, L.: Electrophysio-logical evidence for the existence of orientation andsize detectors in the human visual system, J.Physiol. (Lond.) 207:635, 1970.
14. Campbell, F.W., and Gubisch, R.W.: Optical qual-ity of the human eye, J. Physiol. (Lond.) 186:558,1966.
15. Behrman, J.: The visual evoked response in hysteri-cal amblyopia, Br. J. Ophthalmol. 53:839, 1969.
16. Berman, M.S., and Levi, D.M.: Hysterical ambly-opia: Electrodiagnostic and clinical evaluation, Am.J. Optom. Physiol. Optics 52:267, 1975.
17. Harter, M.R., and White, C.T.: Effects of contoursharpness and check-size on visually evoked corticalpotentials, Vision Res. 8:701, 1968.
18. Millodot, M., and Riggs, L.A.: Refraction deter-mined electrophysiologically. Responses to alterna-tion of visual contours, Arch. Ophthalmol. 84:272,1970.
19. Dawson, W.W., Perry, N.W., and Childers, D.G.:Variations in human cortical response to patterns
and image quality. INVEST. OPHTHALMOL. 1L7S9,1972.
20. Regan, D.: Rapid objective refraction using evokedbrain potentials, INVEST. OPHTHALMOL. 12:669,1973.
21. Bostrom, C , Keller, E.L., and Marg, E.: A recon-sideration of visual evoked potentials for fast auto-mated ophthalmic refractions, INVEST. OPHTHAL-MOL. VISUAL SCI. 17:182, 1978.
22. Campbell, F. W., and Green, D.G.: Optical and ret-inal factors affecting visual resolution, J. Physiol.181:576, 1965.
23. Levi, D.M., and Harwerth, R.W.: Contrast evokecpotentials in strabismic and anisometropic ambly-opia, INVEST. OPHTHALMOL. VISUAL SCI. 17
571, 1978.24. Apkarian, P., Nakayama, K., and Tyler, C.W..
Binocular interactions in steady state visual evokecresponses, Soc. Neurosci. Abstracts 111:551, 1977.
25. Apkarian, P., Brown, B., and Tyler, C.W.: Binocu-lar interactions in strabismic amblyopia, INVESTOPHTHALMOL. VISUAL SCI. 17(ARVO Suppl.):216.1978.
26. Bodis-Wollner, I.: Visual acuity and contrast sensitivity in patients with cerebral lesions, Science178:769, 1972.
27. Gucukoglu, A., and Arden, G.B.: Low-frequenc;contrast sensitivity is reduced very early in maculadisease, INVEST. OPHTHALMOL. VISUAL SCI. 1'.
(ARVO Suppl.):179, 1978.28. Ginsburg, A.P., and Campbell, F.W.: Thresholc
and suprathreshold contrast sensitivity with a 5 C/L"notch in the visiogram of an adult strabismic ambly-ope, INVEST. OPHTHALMOL. VISUAL SCI. 17(ARVC
Suppl.):230, 1978.29. Levi, D.M., and Harwerth, R.S.: Spatio-tempora
interactions in anisometropic and strabismic amblyopia, INVEST. OPHTHALMOL. VISUAL SCI. 16:90
1977.30. Levi, D.M., and Walters, J.W.: Visual evoked re
sponses in strabismic and anisometropic amblyopiaeffects of check size and retinal'locus, Am. J. Optorn. Physiol. Optics 54:691, 1978.
31. Sokol, S., and Shaterian, E.: The pattern evokeicortical potential in amblyopia as an index of visuafunction. In Moore, S., Mein, J., and StockbridgeL., edittrs: Orthoptics, Past, Present, FutureTransactions of the Third International OrthoptiCongress, Miami, 1976, Symposia Specialists, pp59-67.
32. Blakemore, C , and Campbell, F.W.: On the exi:tence of neurones in the human visual system selectively sensitive to the orientation and size of retin;images, J. Physiol. 203:237, 1969.
33. Stromeyer, C.F., III, and Julesz, B.: Spatial-fitquency masking in vision: Critical bands and spreaof masking, J. Opt. Soc. Am. 62:1221, 1972.
34. Tyler, C.W., and Katiz, M.F.: Binocular internetions in the human visual evoked potential afteshort-term occlusion and anisometropia, INVES"OPHTHALMOL. VISUAL SCI. 16:1070, 1977.