Evaluation of Rapid Manufacturing Solutions for Improved ...

Rapid and Rigorous Impact Evaluation: Advances in the Methods and Data Available for Timely and Cost-Efficient
Evaluation
Ann-Sofie Isaksson
Abstract
This background paper explores the menu of experimental and quasi-experimental impact evaluation strategies open to evaluators, depending on context- and evaluation-specific constraints. It focuses on recent advances in the methods and data available for impact evaluation, with implications for the speed, cost and scale of evaluations. A key message of the paper concerns the benefits of a flexible approach to the methods and data materials used for impact evaluation in order to assure that impact assessments are cost-efficient and available to decision makers in a timely manner. It highlights the need to adjust the evaluation approach to fit the evaluation objectives and constraints of policy makers and explores the potential to draw on existing data and routine data collection systems and utilizing quasi-experimental methods and iterative and adaptive evaluation approaches. Furthermore, to harness the benefits of the new data and increasingly sophisticated analytical tools, the paper sheds light on the need to build data infrastructure, invest in equipment, software and staff, and to encourage inter-disciplinary impact evaluation teams.
Acknowledgements
The Center for Global Development is grateful for contributions from the Hewlett Foundation in support of this work. Thanks also to Janeen Madan Keller, Julia Kaufman, members of CGD’s Working Group on New Evidence Tools for Policy Impact, and anonymous reviewers for their comments and feedback on earlier drafts.
CGD Background Paper
Contents 1. Introduction ...................................................................................................................................................... 1
2. Methodological advances ................................................................................................................................ 2
2.1 Adapting RCTs to implementer needs and constraints through proxy outcomes, multiple treatment arms, A/B testing, iterative evaluations, and other approaches .............................. 3
2.2 Impact evaluation using quasi-experimental methods.......................................................... 7
3. Data advancements ........................................................................................................................................10
3.1 Geo-referenced survey data ....................................................................................................10
3.2 Administrative data ..................................................................................................................11
3.3 Remotely sensed data ...............................................................................................................12
3.4 Low-cost remote surveys ........................................................................................................13
3.5 Machine learning and big data ................................................................................................15
4. Right fit impact evaluation: Challenges and prospects.............................................................................17
5. Recommendations..........................................................................................................................................22
References ............................................................................................................................................................24
Appendix..............................................................................................................................................................30

CGD Background Paper
1
1. Introduction
After nearly a quarter century of global poverty steadily declining, poverty reduction now suffers its worst setback in decades. In a recent report, the World Bank describes how the COVID-19 pandemic and the associated global economic recession, compounded by the effects of armed conflict and climate change, are reversing hard-won gains in poverty reduction (World Bank, 2020b). Working towards the sustainable development goals (SDGs), the most fundamental being to ‘end poverty in all its forms everywhere’ (United Nations, 2015), the international community thus faces massive challenges.
In light of these challenges, the importance of robust evidence on development effectiveness, helping to ensure that scarce resources are allocated to where they have the most development impact, can hardly be overestimated. Impact evaluation provides information about how well development interventions (i.e. programs, projects, policies, reforms) work and why. As such, they can contribute to better development results and help hold donors and partner country governments accountable for results. At the same time, there are concerns that evaluators do not sufficiently take into account the temporal, budgetary and operational constraints of policy makers and development agencies, which often necessitate faster, cheaper and simpler studies, resulting in impact evaluations that do not have a significant influence on development policy (see e.g. Shah et al., 2015).
This paper is part of the background work that seeks to inform the deliberations of a new working group that the Center for Global Development has launched on New Evidence Tools for Policy Impact. It explores the menu of experimental and quasi-experimental impact evaluation strategies open to evaluators, depending on context- and evaluation-specific constraints. It focuses on recent advances in the methods and data available for impact evaluations, with implications for the speed, cost and scale of evaluations. As such, the background paper is particularly relevant as an introduction for commissioners and funders of impact evaluations alongside other relevant stakeholders.
Here, a few notes on scope are in order. To begin with, estimating impact implies establishing causality, i.e. investigating how an intervention has changed the world around it, which as discussed below, can be demanding. Importantly, though, impact evaluations are only one evaluation tool among others. Sometimes the questions that stakeholders want answered are better addressed through monitoring data, including for example on staff activities, take-up and usage of services, and on constituents’ satisfaction with services. Other times, impact evaluations may not be feasible due to the small scale, limited resources or timing of an intervention (Gugerty, and Karlan, 2018a,b). In many cases, utilizing a combination of evaluation approaches and data sources is valuable, and oftentimes, it is possible to draw on existing knowledge to help answer the questions at hand. Finally, while acknowledging the great importance of evidence synthesis, the urgency of which has been underscored during the COVID-19 pandemic (see e.g. ACRES, 2021; 3ie, 2021), the focus of this paper is restricted to evidence generation.
Estimating the causal impact of an intervention requires a certain level of analytical rigor. If beneficiaries of an intervention are not randomly selected, some people, with certain characteristics, will be more likely to be targeted. A comparison of outcomes among beneficiaries and non-beneficiaries would then suffer from selection bias, meaning that the estimated impact would pick up
CGD Background Paper
2
systematic differences between the two groups that exist regardless of the intervention. Indeed, in cases where an intervention targets vulnerable groups, selection bias is a direct result of the policy design. Rigorously estimating the impact of an intervention thus requires an attempt to gauge what outcomes beneficiaries would have had in the absence of the intervention, and comparing this with the outcomes observed when the intervention was implemented (e.g. Leeuw and Vaessen, 2009). Put differently, rigorous impact evaluation requires counterfactual analysis of the impact of an intervention on welfare outcomes (White, 2006).
That said, there are tradeoffs between, on the one hand, the need for careful data collection and analytical efforts, and on the other, assuring that impact assessments are cost-efficient and available to decision makers in a timely manner. In the context of the COVID-19 pandemic, which has led to both growing needs for robust evidence on policy effectiveness and severe constraints on evaluation practices, these tradeoffs have become even more pressing. To help countries recover, effective development policy and international co-operation will be key. Arguably, the need for rigorous impact evaluation to promote effective public policies and programs is thus higher than ever. At the same time, the fast-changing environment created by the pandemic poses major challenges for evaluation. Not least, travel restrictions limit possibilities for field-based assessments of project effectiveness (see e.g. Evans, 2020).
Nonetheless, there is reason for optimism. In parallel to growing needs and new constraints, technological and methodological advances imply that evaluators today have novel tools and data materials at their disposal. Technological developments such as cellphones, wifi, GPS devices and satellite imagery have made it less expensive to gather and transmit data, and software innovations have made the information easier to analyze and use (Gugerty and Karlan, 2018b). As the Independent Evaluation Group of the World Bank (IEG) puts it in their annual report (IEG, 2020, p. 32), the constraints following the pandemic indeed provide “an exciting opportunity to reconsider whether traditional methods are the best way to tackle an evaluation problem and how best to work in situations where conventional techniques for data collection are more costly, difficult, or simply unavailable.”
The next section focuses on experimental and quasi-experimental methodological advances relevant for conducting rapid, rigorous impact evaluation. Section 3 discusses data developments relevant for impact evaluation, focusing on the increased availability of geo-referenced survey data, administrative data, remotely sensed data, low-cost remote surveys and data based on machine learning. Section 4 discusses right-fit impact evaluation approaches in terms of timeliness, cost, and robustness as well as outstanding challenges and promising prospects for conducting rapid, rigorous impact evaluations, and Section 5 concludes with recommendations to evaluators and other stakeholders in light of these challenges and opportunities.
2. Methodological advances
This section focuses on methodological advances allowing for rigorous impact evaluation even under circumstances calling for faster and lower-cost assessments. Specifically, the section discusses efforts to modify randomized controlled trials (RCTs) in response to practical and ethical considerations in order to make them better align with implementer needs and constraints, as well as the potential
CGD Background Paper
3
usefulness of impact assessments based on quasi-experimental methods. Table 1 summarizes the characteristics, data requirements, and most suitable contexts for each of these methodological developments.
2.1 Adapting RCTs to implementer needs and constraints through proxy outcomes, multiple treatment arms, A/B testing, iterative evaluations, and other approaches
The appropriate format of an evaluation varies depending on the stakeholders concerned, objectives and constraints. To effectively inform development action, there have been calls for context specific impact evaluations driven by implementer demand, tailored to implementer needs and constraints, and embedded within implementer structures (Shah et al., 2015).
Policymakers and practitioners likely want evidence on operational topics that may seem mundane to researchers motivated by gaps in the academic literature, and researcher priorities may lead evaluations to be longer and costlier than implementers need. Adapting impact evaluations to implementer needs and constraints may call for faster and cheaper studies. Furthermore, mitigating generalizability limitations of RCTs (see e.g. Pritchett and Sandefur, 2014, 2015; Vivalt, 2015, 2020) may necessitate testing interventions under conditions very similar to those in which the interventions could be scaled.
Hence, there is arguably reason to design more impact evaluations with the primary objective to inform a specific policy decision of a specific implementer in a specific location for a specific target population over a specific time horizon, within the time, budgetary and operational constraints of the implementer (Shah et al., 2015). A number of measures can help optimize the evidence available to decision makers within their temporal, budgetary, operational and political constraints.
If time is short, the evaluation may rely on proximate outcomes linked to longer-term, downstream outcomes. Athey et al. (2019) develop a new method of estimating the long-term impacts of policies more rapidly and precisely using short-term proxies. Specifically, they predict the impacts of a policy change on long-term outcomes (e.g. lifetime earnings) by looking at the impact of the policy change on short-term proxies (e.g. earnings in early adulthood or test scores). Following the statistical literature, they call these proxies ‘surrogates’. Further, they combine multiple short-term indicators into a single ‘surrogate index’ and show that this index can predict long-term outcomes, even when any single short-term indicator fails to do so. They suggest that building a library of surrogate indices for long-term outcomes would expedite the analysis of ongoing and future interventions.
To reduce costs, the evaluation may use smaller, focused questionnaires as well as smaller samples designed to detect larger, policy-relevant effects. They may rely on low-cost data collection techniques such as online surveys, as well as draw more heavily on pre-existing data. And if randomization is not a feasible or desirable option, quasi-experimental approaches such as matching and regression discontinuity designs may be considered (discussed in more detail below).
CGD Background Paper
4
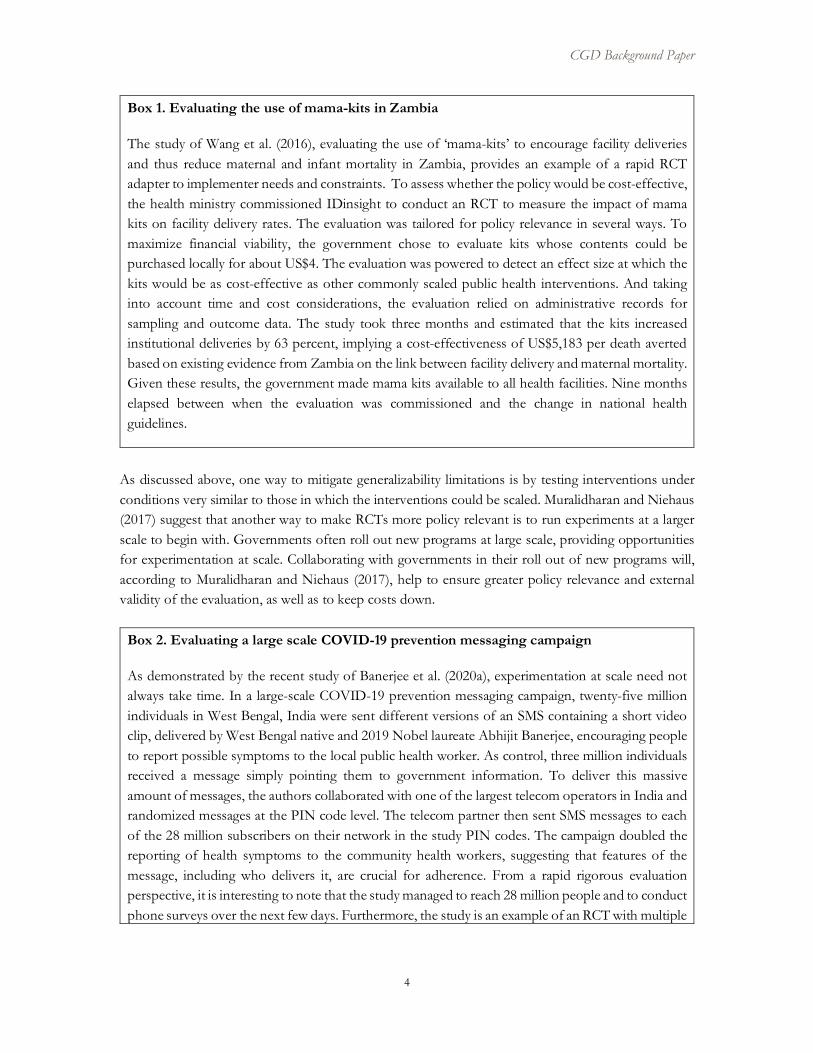
Box 1. Evaluating the use of mama-kits in Zambia
The study of Wang et al. (2016), evaluating the use of ‘mama-kits’ to encourage facility deliveries and thus reduce maternal and infant mortality in Zambia, provides an example of a rapid RCT adapter to implementer needs and constraints. To assess whether the policy would be cost-effective, the health ministry commissioned IDinsight to conduct an RCT to measure the impact of mama kits on facility delivery rates. The evaluation was tailored for policy relevance in several ways. To maximize financial viability, the government chose to evaluate kits whose contents could be purchased locally for about US$4. The evaluation was powered to detect an effect size at which the kits would be as cost-effective as other commonly scaled public health interventions. And taking into account time and cost considerations, the evaluation relied on administrative records for sampling and outcome data. The study took three months and estimated that the kits increased institutional deliveries by 63 percent, implying a cost-effectiveness of US$5,183 per death averted based on existing evidence from Zambia on the link between facility delivery and maternal mortality. Given these results, the government made mama kits available to all health facilities. Nine months elapsed between when the evaluation was commissioned and the change in national health guidelines.
As discussed above, one way to mitigate generalizability limitations is by testing interventions under conditions very similar to those in which the interventions could be scaled. Muralidharan and Niehaus (2017) suggest that another way to make RCTs more policy relevant is to run experiments at a larger scale to begin with. Governments often roll out new programs at large scale, providing opportunities for experimentation at scale. Collaborating with governments in their roll out of new programs will, according to Muralidharan and Niehaus (2017), help to ensure greater policy relevance and external validity of the evaluation, as well as to keep costs down.
Box 2. Evaluating a large scale COVID-19 prevention messaging campaign
As demonstrated by the recent study of Banerjee et al. (2020a), experimentation at scale need not always take time. In a large-scale COVID-19 prevention messaging campaign, twenty-five million individuals in West Bengal, India were sent different versions of an SMS containing a short video clip, delivered by West Bengal native and 2019 Nobel laureate Abhijit Banerjee, encouraging people to report possible symptoms to the local public health worker. As control, three million individuals received a message simply pointing them to government information. To deliver this massive amount of messages, the authors collaborated with one of the largest telecom operators in India and randomized messages at the PIN code level. The telecom partner then sent SMS messages to each of the 28 million subscribers on their network in the study PIN codes. The campaign doubled the reporting of health symptoms to the community health workers, suggesting that features of the message, including who delivers it, are crucial for adherence. From a rapid rigorous evaluation perspective, it is interesting to note that the study managed to reach 28 million people and to conduct phone surveys over the next few days. Furthermore, the study is an example of an RCT with multiple

CGD Background Paper
5
treatment arms, discussed below in more detail.
Furthermore, conducting RCTs with multiple treatment arms can be a cost-efficient way to test multiple hypotheses. Not least, cash-benchmarking, i.e. comparing the per-dollar impact of an intervention with the impact of a comparably sized cash transfer given directly to beneficiaries, can be used to assess whether an intervention is good value for money (see e.g. Rose and Glassman, 2018).
Box 3. Evaluating labor market policies among Syrian refugees in Jordan
The recent study of Caria et al. (2020), which evaluates the impact of active labor market policies on Syrian refugees and local job-seekers in Jordan, provides an example of using multiple treatment arms. Specifically, they compare the impact of three types of support: a small, unconditional cash transfer; information provision to increase the ability to signal skills to employers; and a behavioral nudge to strengthen job search motivation.1 Neither treatment had a significant short-term effect on employment, but the cash grant had a substantial impact on longer-term employment outcomes. Particularly, the cash grant raised job search rates and enabled refugees to place more job applications.
Conducting RCTs with multiple treatment arms but no pure control group can also help alleviate ethical concerns with the experimental setup. A key ethical consideration when conducting RCTs concerns withholding assistance for the control group. For study participants in a vulnerable position, if the alternative offered to the treatment group is preferable at the outset, withholding this best available alternative from the control group constitutes an ethical breach (Puri et al., 2017), especially during the emergency phase of a humanitarian crisis. Under circumstances when it is not feasible to omit individuals or regions entirely from treatment, one solution is to compare several treatment arms rather than a treatment and a pure control (Puri et al., 2017). Hence, instead of having a randomly chosen treatment group receive the intervention and a randomly chosen control group receive no intervention, the evaluation would compare groups randomly chosen to receive different versions of a treatment. Indeed, the critical question for policymakers and development organizations does not typically concern the comparison of the effectiveness of an intervention with doing nothing, but rather aims to determine which variation of an intervention, among the available options, is more effective.2
1 Furthermore, Caria et al. (2020) use what they refer to as adaptive targeted experimentation. By observing treatment outcomes over time, they adaptively optimize treatment assignment for experimental participants. To do so, they use an algorithm that is 1) adaptive, meaning that it changes treatment assignment probabilities over time by incorporating information about the successes of treatments of existing experimental participants, and 2) targeted in the sense that it uses information about the success rates of treatments in every group in order to target treatments for each individual group. 2 Another option is to use a staggered roll-out, also referred to as a ‘phase-in’ or ‘stepped-wedge’ design. Provided that the implementation of the intervention cannot be done in one fell swoop, some groups will inevitably be treated earlier and some later. By randomizing which groups (e.g. municipalities) are treated early and late, a comparison of early-treated and late-treated groups makes it possible to estimate the effects of the intervention. Beyond the immediate emergency phase of the crisis, a staggered roll-out may be ethically justifiable, since individuals in both control and treatment groups eventually experience the potential benefits (or costs) of any intervention (Puri et al., 2017; Haushofer and Metcalf, 2020).
CGD Background Paper
6
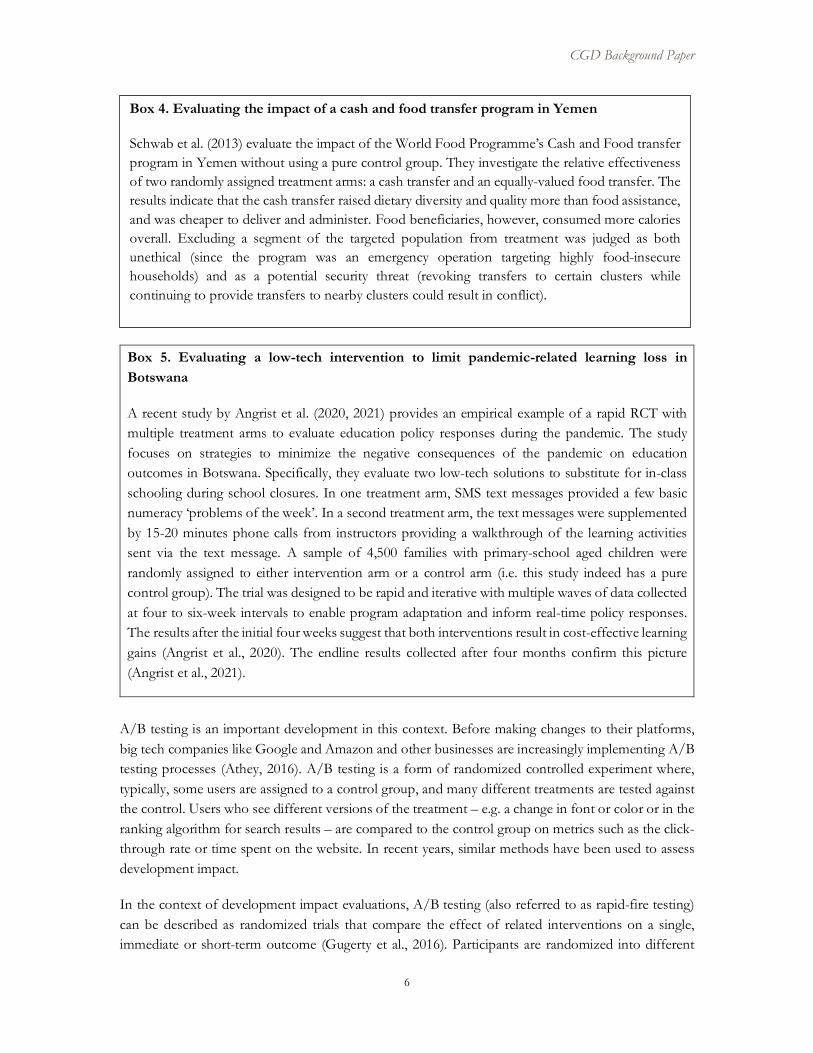
Box 5. Evaluating a low-tech intervention to limit pandemic-related learning loss in Botswana
A recent study by Angrist et al. (2020, 2021) provides an empirical example of a rapid RCT with multiple treatment arms to evaluate education policy responses during the pandemic. The study focuses on strategies to minimize the negative consequences of the pandemic on education outcomes in Botswana. Specifically, they evaluate two low-tech solutions to substitute for in-class schooling during school closures. In one treatment arm, SMS text messages provided a few basic numeracy ‘problems of the week’. In a second treatment arm, the text messages were supplemented by 15-20 minutes phone calls from instructors providing a walkthrough of the learning activities sent via the text message. A sample of 4,500 families with primary-school aged children were randomly assigned to either intervention arm or a control arm (i.e. this study indeed has a pure control group). The trial was designed to be rapid and iterative with multiple waves of data collected at four to six-week intervals to enable program adaptation and inform real-time policy responses. The results after the initial four weeks suggest that both interventions result in cost-effective learning gains (Angrist et al., 2020). The endline results collected after four months confirm this picture (Angrist et al., 2021).
A/B testing is an important development in this context. Before making changes to their platforms, big tech companies like Google and Amazon and other businesses are increasingly implementing A/B testing processes (Athey, 2016). A/B testing is a form of randomized controlled experiment where, typically, some users are assigned to a control group, and many different treatments are tested against the control. Users who see different versions of the treatment – e.g. a change in font or color or in the ranking algorithm for search results – are compared to the control group on metrics such as the click-through rate or time spent on the website. In recent years, similar methods have been used to assess development impact.
In the context of development impact evaluations, A/B testing (also referred to as rapid-fire testing) can be described as randomized trials that compare the effect of related interventions on a single, immediate or short-term outcome (Gugerty et al., 2016). Participants are randomized into different
Box 4. Evaluating the impact of a cash and food transfer program in Yemen
Schwab et al. (2013) evaluate the impact of the World Food Programme’s Cash and Food transfer program in Yemen without using a pure control group. They investigate the relative effectiveness of two randomly assigned treatment arms: a cash transfer and an equally-valued food transfer. The results indicate that the cash transfer raised dietary diversity and quality more than food assistance, and was cheaper to deliver and administer. Food beneficiaries, however, consumed more calories overall. Excluding a segment of the targeted population from treatment was judged as both unethical (since the program was an emergency operation targeting highly food-insecure households) and as a potential security threat (revoking transfers to certain clusters while continuing to provide transfers to nearby clusters could result in conflict).
CGD Background Paper
7
treatment groups (and sometimes, but not necessarily, a pure control group) and exposed to variations in a program’s design or message. Outcomes are often obtained from administrative data (e.g. transactions records or deposits and loan repayments from financial institutions), meaning that there is no need for costly and time-consuming original data collection. As such, the approach enables researchers to test several hypotheses within the given time and resource constraints (Narasimhan and Arun, 2017). On the other hand, A/B tests usually require relatively large sample sizes. Since the method relies on incremental changes to existing interventions, the anticipated marginal impacts will often be small, meaning that large sample sizes are usually necessary to detect them (Dibner-Dunlap and Rathore, 2016).
Against this background, A/B testing is most suited for answering questions that generate a fast feedback loop and for which administrative data are recorded (Gugerty et al., 2016). Since the method is often used to assess variations in program design, it is particularly valuable in the design or pilot stage of an intervention, where it (on top of assessing impact) can be used to identify small and low cost design or messaging changes that increase demand or program participation. By assessing easily scalable variations of interventions, A/B tests can help minimize the costs of evaluation and streamline scale-ups (Narasimhan and Arun, 2017).
Box 6. Evaluating SMS reminders to encourage savings
The study of Karlan et al. (2016), focusing on savings behavior, provides a good example of A/B testing in a development context. The authors collaborated with private banks in Bolivia and the Philippines to test whether simple SMS reminders could encourage people who had recently opened savings accounts with explicit savings goals to save more. The study consisted of several treatment arms with reminders framed in slightly different ways, as well as a control group that did not receive a reminder. The results indicated that the reminders were effective in helping clients to meet their savings goals, particularly messages that mentioned both savings goals and financial incentives. Based on these findings, some of the involved banks decided to continue with the measure.
2.2 Impact evaluation using quasi-experimental methods
In many cases, randomized experiments are difficult or impossible to implement for various reasons (e.g. financial, ethical or political factors). Thus, policy evaluations often rely on observational data – i.e. data where treatments (or policies) were allotted in a way other than random assignment (Atheyand Imbens, 2017). Establishing the causal effect of a policy from observational data is clearlychallenging. However, researchers have increasingly sophisticated tools and data at their disposal. Thissection provides a very brief overview of some well-established quasi-experimental methods, namelyregression discontinuity designs, matching, and difference-in-differences, as well as of somenoteworthy developments in the area, namely the use of synthetic controls and machine learningtechniques.
In the absence of randomly assigned treatment and control groups, the great challenge for quasi-experimental methods is to estimate how the outcome of interest would have evolved for the treatment

CGD Background Paper
8
group without the treatment, i.e. the counterfactual. Simply stated, the idea is to find ‘control’ cases that are sufficiently similar to the ‘treated’ cases to constitute a viable comparison group. This may entail controlling for observable and unobservable factors in a regression framework, or utilizing natural experiments that, for reasons outside of the investigators’ control, mimic the existence of test and control groups of controlled experiments and thus provide the evaluator with ‘as-if random’ variation.
Regression discontinuity designs (RDD, see e.g. Athey and Imbens, 2017) provides an example of the latter.3 The idea is to estimate causal effects by exploiting discontinuities in incentives or ability to receive a discrete treatment. For instance, birthdate cutoffs may limit eligibility to start kindergarten between two children born only a few days apart, meaning that one could estimate the causal effect of attending kindergarten by comparing outcomes for children with birthdates on either side of the cutoff. The key feature of regression discontinuity design is thus to find an exogenous variable, where the probability of participating in the program changes discontinuously at a threshold value. Under the assumption that individuals close to, but on different sides of, the threshold are otherwise comparable, any difference in average outcomes between individuals just to one side or the other can be attributed to the treatment.
Matching involves strategic subsampling of observational data to identify treatment and control cases that are very similar except for the presence or absence of the intervention (see e.g. Angrist and Pischke, 2009).4 Just as standard regression frameworks, matching relies on controlling for observable factors. For this reason, many economists are skeptical about the credibility of matching estimators for identifying treatment impacts (McKenzie, 2021). A potential advantage, though, is that it shifts focus from controlling for factors that may influence the outcome variable to factors that matter to treatment assignment (which the researcher may have more information about), and avoids extrapolation from one relatively distinct population to another (Austin, 2011).
Difference-in-differences methods consist of comparing groups affected and not affected by an intervention over time, before and after the intervention. As the name implies, the estimation strategy entails comparing the average change in the outcome variable over time (before and after project implementation) for a treatment group exposed to the intervention, and a control group not exposed to the intervention (see e.g. Angrist and Pischke, 2009). This makes it possible to capture the effect on the treatment group in the period after treatment, controlling for common time trends, i.e. factors that would cause changes in the outcome even in the absence of a treatment, as well as possible pre-existing differences between treatment and control group. A precondition for the approach to hold is that the treatment and control group would exhibit the same trend in terms of the concerned outcome in the absence of the treatment. The comparability of treatment and control groups in terms of potential group-specific time-trends thus needs careful consideration.
3 For a guide to regression discontinuity design, see e.g. Imbens and Lemieux (2008). 4 Propensity score matching takes place in two steps. In a first step, the researcher estimates the conditional probability of an observation being assigned to a particular treatment given a set of observable characteristics. The next step is to construct a matched sample based on the estimated score from the first step, and then estimate the treatment effect by comparing outcomes between treated and untreated subjects in the matched sample. For more information about different matching strategies, see e.g. Austin (2011) and Iacus et al., (2012).
CGD Background Paper
9
A development in this regard is the use of synthetic control groups (for an overview, see Abadie, 2020). The synthetic control method is based on the idea that, when the units of observation are a small number of aggregate entities (e.g. cities, regions or countries), a combination of untreated units may provide a more appropriate comparison than any single untreated unit alone. Specifically, rather than using a single control unit or a simple average of control units, the synthetic control method uses a weighted average of a set of controls. As Guo (2015) puts it, the synthetic control method involves ‘carefully blending from a palette of possible controls’. To illustrate the method, Athey and Imbens (2017) refer to the difference-in-differences study of Card (1990), focusing on the effect of a sudden migration wave of low-skilled Cuban workers to Miami on the wages of low-skilled workers in the area. Whereas Card considered various possible control cities to compare with, including Houston, Petersburg, and Atlanta, the synthetic control method chooses weights for each of the three cities so that the weighted average is more similar to Miami than any single city would be.5
Another notable development is the use of machine learning methods for causal inference. Simply put, machine learning (ML) is a set of methods to train computers to learn from data (Paul et al., 2018).6 As discussed in Athey and Imbens (2017) and Athey (2019), an important difference between most econometric approaches and machine learning is that the latter typically relies on data-driven model selection. That is, the analyst provides the list of covariates, but the functional form is at least in part determined as a function of the data, to maximize a certain criterion. ML methods can be particularly useful when there is a need to control for a large number of covariates in a flexible manner. While the specific approaches differ, this can for instance consist in using ML to find weights that balance covariates or functions of the covariates between treatment and control groups, so that once the data has been reweighted, it mimics a randomized experiment more closely (Athey and Imbens, 2017).The promises and potential pitfalls with using ML for impact evaluation will be discussed further in section 3.5.
The study by Samii et al. (2016), focusing on policies to reduce criminality among ex-combatants in Colombia, provides an example. As noted by the authors, having a large number of covariates at one’s disposal allows, in principle, for more plausible causal identification. At the same time, however, it raises concerns about researchers selecting from among the vast number of potential specifications to manipulate results. ML techniques can help get around this issue by applying an objective criterion for model selection (here the minimum expected error of prediction for the propensity score).
As noted, the use of RDD, difference-in-differences and matching metods is by now well-established. In many applications, the novelty rather lies in the data utilized. With increased availability of granular spatial data, researchers are better able to assess outcomes and control for potential confounding factors at fine geographic levels. The next section discusses relevant data
5 The credibility of the estimator depends on its ability to track the trajectory of the outcome variable for the treated unit over an extended pre-intervention period. The weights of the control cases are chosen so that the resulting synthetic control best resembles the pre-intervention values for the treated unit of predictors of the outcome variable. Predictor variables typically include both pre-intervention values of the outcome variable (which are not affected by the treatment) as well as other predictors. For a detailed account, see Abadie (2020). 6 A detailed account of machine learning methods is beyond the scope of this background paper. However, for a discussion of the role of machine learning in econometric impact analysis see e.g. Athey and Imbens (2017) and Athey (2019).

CGD Background Paper
10
developments. Many of the data sources discussed below offer very large sample sizes and are collected continuously over long time periods. By using quasi-experimental methods and these data sources, the evaluator can more readily conduct impact evaluations retrospectively, after project completion.
3. Data advancements
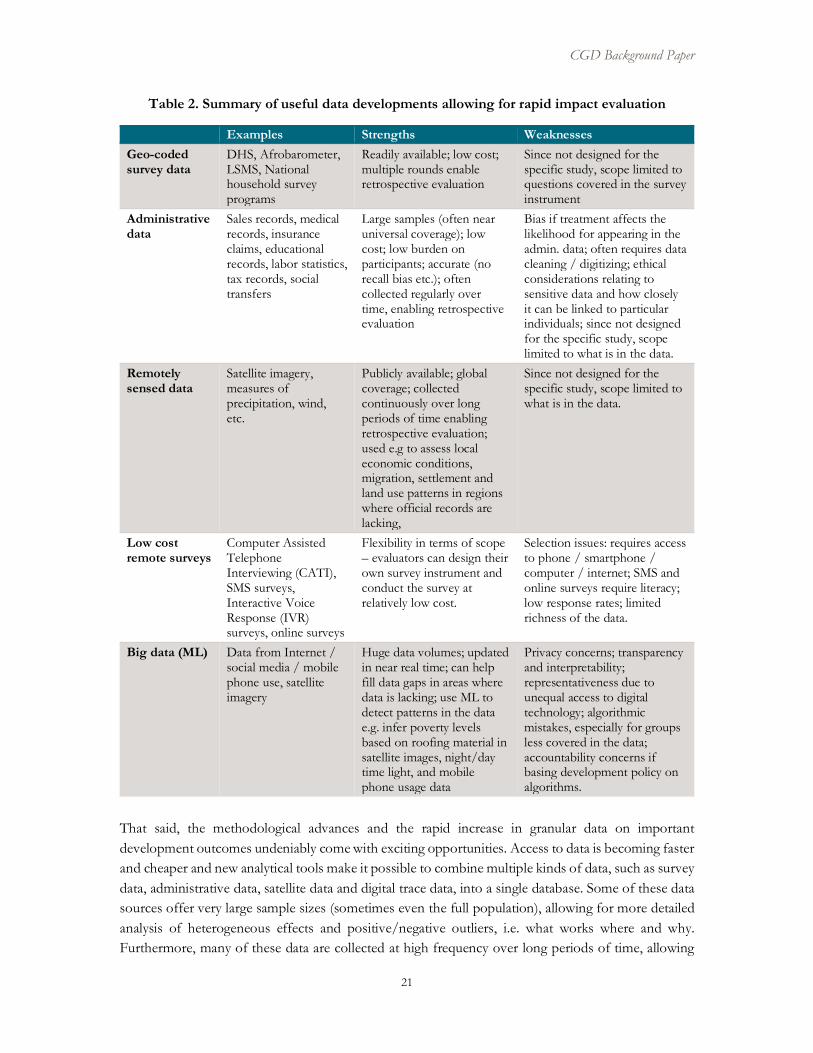
Technological advances such as cellphones, wifi, GPS devices and satellite imagery have made it less expensive to gather and transmit data, and software innovations have made information easier to analyze and use (Gugerty and Karlan, 2018b). As a result, there has been a rapid expansion in the availability of sub-nationally geo-referenced data on relevant development outcomes. The geographical identifiers enable the investigator to identify observations, e.g. survey respondents, in areas where specific development interventions have been implemented, and evaluate how these fare on relevant outcomes compared to respondents in unaffected areas.7 This section discusses data developments that improve the possibilities for rapid and rigorous impact assessments. Specifically, we consider the potential of drawing on geo-referenced survey data, administrative data, remotely sensed data, remote surveys and data based on machine learning, with examples of data sources and applications for each. Table 2 summarizes the various strengths and weaknesses of the data advancements discussed below.
3.1 Geo-referenced survey data
Recent years have seen a rapid expansion in the availability of geocoded data on relevant development outcomes, allowing for impact assessment of local policy interventions. Household survey data is increasingly geocoded to the smallest geographical sampling unit, rather than only providing geographical identifiers to the region or district level as before.
A number of survey data sources are particularly worth mentioning. For instance, both the Demographic and Health Survey (DHS, 2020) and the Afrobarometer (Afrobarometer, 2020) now provide GPS coordinates at the cluster level. Both surveys consist of country-representative samples and have been conducted in multiple waves across a wide range of countries. The Afrobarometer has been conducted in seven waves from 1999-2018 and to date covers more than 200,000 African citizens across 37 African countries, with questions on e.g. corruption, political participation, trust in institutions, and a wide range of citizen attitudes. The DHS contains over 300 surveys from over 90 countries, each with a sample size of between 5,000 and 30,000 households. Focusing on population and health indicators, it allows for analysis of – to mention just a few examples – child health, domestic violence, literacy, family planning, maternal health, fertility, and HIV. Similarly, the World Bank Living Standards Measurement Study (LSMS) program, which provides technical assistance to national statistical offices in the design and implementation of multi-topic household surveys, now often provides geographical information at the cluster level (World Bank, 2020a).
Geo-coded data from comprehensive survey projects like these can be used to assess pre-intervention (baseline) and post-intervention performance on relevant outcome variables in, for
7 For more information on geospatial impact evaluation methods, see Isaksson (2017) and BenYishay et al. (2017).
CGD Background Paper
11
instance, a difference-in-differences setup. Importantly, impact evaluations based on large scale geo-referened data materials allow for flexibility in terms of the unit and scope of analysis. The evaluation can focus on the local effects of a single intervention, or, for that matter, the local effects of all development projects in a specific sector, or of all projects from a specific donor, in one or several partner countries. For governments or development agencies looking for a broader perspective on development effectiveness in e.g. specific sectors or of specific actors, this can be useful. Given that capacity to conduct geospatial impact evaluation is disproportionately low in comparison to the sheer quantity of sateillite data and tools, investments in training for geospatial impact evaluation could be particularly influential.
Box 7. Evaluating the impact of aid on health outcomes in Uganda
Odokonyero et al. (2018) combine Uganda’s geocoded national household panel survey with geographically referenced subnational foreign aid data to study the effects of health aid in Uganda. They define individuals as treated if they reside within a certain distance of any health aid project, and use a difference‐in‐differences approach with individual fixed effects to estimate their impact. Their results suggest that health aid had a strong effect on reducing the days of productivity lost due to illness and a smaller effect on reducing disease prevalence.
3.2 Administrative data
Another valuable source of information for use in impact evaluation is administrative data. Administrative data are information collected, used, and stored mainly for administrative (i.e. operational) purposes, rather than research or impact evaluation (Feeney et al., 2018). Government departments and other organizations collect administrative data for the purposes of e.g. record keeping, often during the delivery of a service. Examples of administrative data include credit card transactions, sales records, medical records, insurance claims, educational records, labor statistics, data from land registries, tax records, social transfers, etc.
Using administrative data for impact evaluation has a number of advantages (see Feeney et al., 2018; Cole et al., 2020). It may be less expensive and logistically easier than collecting new data. It reduces the burdens on participants, who are not required to provide information to researchers that they have already shared in other contexts. Many administrative databases provide near universal coverage of the individuals relevant to a given study. Administrative data may be more accurate than surveys in measuring characteristics that are difficult for subjects to remember (e.g. income or consumption). Relatedly, the fact that administrative data are not actively reported by individuals or program staff minimizes the risk of social desirability or enumerator bias. Also, checks like biometric capture of beneficiaries or automatic geotagging can make administrative data more reliable than self-reported information. Finally, administrative data are often collected regularly over time, allowing investigators to observe outcomes for study participants across long time spans, and thus to identify impacts that are not present in the short-term.
That said, administrative data are not immune to issues of bias, inaccuracy and incompleteness (Feeney et al., 2018). In particular, bias is a concern if being assigned to the treatment group affects the likelihood that an individual appears in the administrative data or that researchers are able to link

CGD Background Paper
12
individuals to their administrative records (Feeney et al., 2018). When members of the treatment and control group are differentially likely to appear in administrative records, evaluators cannot be sure that the treatment and control groups are statistically equivalent. Furthermore, just as with primary data collection, administrative data can be costly. While the price varies, data providers tend to charge for records. Another issue concerns data availability and data usability. Especially in a developing country context, records are often incomplete and collected in outmoded files, disconnected databases, and formats not amenable to systematic data analysis. Hence, researchers often need to devote resources to e.g. digitizing key outcomes of interest (Cole et al., 2020). There are also ethical considerations related to how closely the data can be linked to particular individuals and how sensitive the data are (see e.g. Pisa et al., 2020). Finally, since not designed by the investigators themselves for the purpose of the study, the set of variables and the selection of observations in administrative data of course constrains the questions it can help address (see e.g. Legovini and Jones, 2020).
With these issues in mind, using administrative data for impact evaluations can help answer questions that require large sample sizes or detailed data on hard-to-reach populations and generate evidence with a high level of external validity and policy relevance (Harron et al., 2017). Not least, it is common to draw on a combination of data sources, complementing administrative data with survey, census, and/or remote sensing data to create georeferenced datasets tailored to the specific question and context under study (Legovini and Jones, 2020).
Box 8. Evaluating financial management reform in India
A recent study by Banerjee et al. (2020b) evaluating an e-governance reform underlying India’s flagship social protection program (MGNREGS) illustrates the use of administrative data in combination with other data sources. The program had been suffering from widespread leakages, mainly through the creation of ‘ghost workers’, i.e. people who are paid for their work but who do not exist in reality. The reform changed how funds were transferred from the central government to the local implementing body, making it easier to detect misreporting. The team worked with the state government in Bihar to randomize the introduction of the reform across 195 blocks, spanning a population of 33 million. The experimental evaluation triangulates across multiple data sources. They use administrative data on MGNREGS fund flows and also match administrative data on individual MGNREGS beneficiaries with India’s Socio-Economic Caste Census to assess whether ‘ghost workers’ were less prevalent in treatment areas. Last, they conduct a survey for a sub-sample of households about their participation in the program. The results indicate a significant expenditure reduction in treatment relative to control areas, thus indicting reduced fund leakage.
3.3 Remotely sensed data
A number of comprehensive data materials provide high resolution spatial data on population dynamics and demographics, relevant for both development targeting and impact assessments. For example, WorldPop (2020) combines satellite data with census, survey, social media, cellphone and other spatial datasets to produce gridded maps of population distributions and measures of populations dynamics (migration) and characteristics (e.g. age and sex structures, births and
CGD Background Paper
13
pregnancies) in low and middle income countries. In a recent application (Wigley et al., 2020), WorldPop gridded data on population and pregnancies was combined with geo-located hospital data to assess the availability and geographical accessibility of maternal health services across sub-Saharan Africa.
Other data collection initiatives provide spatial data on geographical and environmental attributes. To mention a few examples, IPUMS TERRA (2020) collects data on environmental characteristics, including land use and land cover as well as temperature, precipitation, and other climate-related variables. The US Geological Survey (USGS, 2020) collects satellite data used to assess the impact of climate and land use change. Using their EarthExplorer tool, users can also search and order geospatial data from several sources. Similarly, the Worldview tool from NASA's Earth Observing System Data and Information System (NASA EOSDIS, 2020) provides access to high-resolution satellite imagery and underlying data on a broad range of issues (e.g. air quality, droughts, floods, vegetation and deforestation as well as population variables like migration and settlements).
Granular datasets like these, which are often publicly available, are increasingly used to assess development outcomes. For instance, Burke and Lobell (2017) use satellite imagery to track smallholder maize yield variation in Kenya. Their findings suggest that high-resolution satellite imagery estimates of smallholder agricultural productivity are very similar to the survey-based measures traditionally used, thus highlighting the potential to quickly generate useful datasets on agricultural productivity.
Furthermore, since satellite data on night time light has been shown to correlate with economic activity, it has in recent years often been used as a proxy for economic activity at the sub-national level (pioneered by Henderson et al., 2012) given that developing countries often lack reliable data on sub-national economic development. Night time light data at a high-level of spatial resolution is available from the early 1990s from the Earth Observation Group of the National Oceanic and Atmospheric Administration (NOAA, 2020) and other entities. From an impact evaluation perspective, data on night time light can be used to measure pre- and post-intervention local economic performance over the short- or long-term.
In a further development, promising recent work (Yeh et al., 2020) uses both daytime and night time satellite imagery and machine learning to assess local wealth differences in Africa. After compiling asset wealth data for over 500,000 households in around 20,000 villages across 23 African countries from the DHS (discussed above), machine learning (discussed below) is used to predict the village- and year-specific measures of wealth, with temporally and spatially matched daytime imagery as well as night time lights imagery as inputs. The results suggest that this approach outperforms approaches focusing on nightlights alone in predicting local wealth differences. That said, as the authors themselves note, the relative simplicity of approaches based on night time lights may still speak to their advantage.
3.4 Low-cost remote surveys
Technological advances have also made researchers better able to conduct remote surveys quickly and at relatively low cost. Key methods include Computer Assisted Telephone Interviewing (CATI),
CGD Background Paper
14
SMS text message surveys, Interactive Voice Response (IVR) surveys, and online surveys. Each have different pros and cons (for an overview, see 60 Decibels, 2020).
In CATI (i.e. phone) surveys, the interviewer reads questions displayed on an electronic device (computer/tablet/mobile) to a respondent over the phone, and then enters the respondent’s answers directly into the electronic device (see e.g. Bhajibhakare et al., 2020). Advantages of this format include that it works in low literacy contexts and that one can include a mix of qualitative and quantitative questions and get relatively rich data. On the downside, it is more expensive than SMS and IVR and requires high quality training of the survey team.
SMS surveys are inexpensive, can be sent to any type of phone with or without internet access, and can easily incorporate incentives to reply using e.g. an airtime bonus. Furthermore, respondents can complete the survey at their convenience and it is potentially easier to collect honest responses to sensitive questions. On the other hand, SMS surveys require high mobile penetration and literacy rates, cannot be longer than a few questions, and obtain less rich data than phone or online surveys.
In IVR surveys, the survey enumerator is a pre-recorded voice message. A series of voice recordings guide the respondent through how to participate in the survey, including the possibility to opt in or out of the survey and the subsequent question and answer portion. Advantages of IVR technology include its inexpensiveness and effectiveness in low-literacy areas, along with more reliable responses to sensistive questions (as with SMS surveys). However, response rates are typically low, one can only include a limited number of questions, and the format only allows for multiple choice format.
In online surveys, respondents are usually sent an initial text message containing a link to a web survey. Online surveys are inexpensive and can be longer than SMS surveys. They also allow for more complex question types (including video and picture questions) with both qualitative and quantitative responses. On the downside, they require high literacy rates, often garner low response rates, and require respondents to have access to the internet via a smartphone or computer, all of which result in concerns about selection bias.
By utilizing already existing sampling frames, all of these remote survey formats can be implemented rapidly. To mention an example, the Cox’s Bazar Panel Survey (CBPS), which tracks a representative sample of recently displaced Rohingya households and their host communities in the Cox’s Bazar district of Bangladesh, is explicitly designed to act as a ‘sandbox’ testing environment simplifying future impact evaluations (Mobarak, 2021). Drawing on this sampling frame, the World Bank (2020c) conducted a rapid phone survey evaluating the impact of COVID-19 on work and wages in the area, covering a sub-sample of 3,174 out of the 5,020 households surveyed in the CBPS baseline.
With the travel restrictions and social distancing guidelines in place during COVID-19, remote surveys are of course especially relevant. Indeed, many research organizations have shifted to data collection through remote surveys, as field activities have been halted due to the pandemic. Adapting to remote surveys can be challenging for various reasons, including low responsiveness and the difficulty of establishing trust with respondents (see the discussion in Mani and Barooah, 2020; Mukerji and Priyadarshini, 2020). However, awareness of the opportunities and pitfalls of the different methods enables decision makers and evaluators to consider various options and select the most appropriate based on the priorities of the evaluation. J-PAL has put together a crowd-sourced

CGD Background Paper
15
guide with tips and factors to consider when conducting remote surveys (Kopper and Sautmann, 2020) that is useful in this context. It covers a broad range of practical issues including how to obtain informed consent, how to improve the response rate and how to modify the survey protocol to better suit the format. It also includes a long list of software solutions (e.g. 60 Decibels) designed to enable remote surveys.
3.5 Machine learning and big data
The explosion of digital technologies such as mobile phones, GPS devices, satellites, and remote sensors over the past decade, even in very poor countries, has led to a corresponding surge in the amount of data produced (e.g. UN Global Pulse, 2016; Bamberger and York, 2020a,b). Mobile phones have made it possible to collect information, actively or passively, from anyone almost anywhere at any time. The so-called Internet of Things (IoT), i.e. physical objects with attached sensors or software to connect them to the internet, makes it possible to collect objective data on human behaviors, health status, environmental conditions, interactions, etc. Internet use in general and social media presence in particular generate large amounts of information on users’ attitudes and behavior. Drones and satellites make it possible to collect aerial images capturing infrastructure, economic activity, migration patterns, land cover, temperature, moisture levels and other characteristics of the natural environment on a continual basis. Due to developments like these, there has been an exponential growth of big data: data that is huge in volume and generated very fast (often in real time), alongside the data analytics necessary to make sense of this information.
As noted in Section 2.2, machine learning (ML) is a set of methods to train computers to learn from data. ‘Learning’ in this context generally refers to detecting patterns or structures in data. Paul et al. (2018) provide an intuitive description of the approach. In traditional statistical analysis, the usual method is to first develop a model based on mathematical rules and then apply this model to data. ML approaches flip this process. They begin by finding patterns in training data and then return a model that can make predictions for new, unseen data. As such, ML techniques are more flexible than statistical models and can thus be especially effective at finding complex, nonlinear relationships, and for making sense of large amounts of unstructured numeric or nonnumeric (e.g. image, audio, text) data.
An earlier section already touched on the promising role of ML from a methodological perspective, i.e. in terms of helping to estimate the causal effect of an intervention. Another central role for ML in impact evaluation is providing data on important development outcomes and covariates. One dimension of this concerns getting basic measurements in regions where there are important gaps in key statistics (see e.g. the discussion in Burke et al., 2016; UN Global Pulse, 2016; McKenzie, 2018; Paul et al., 2018). Reliable data on local economic conditions remain scarce in many developing countries, hampering efforts to study these outcomes and to design policies that improve them (Burke et al., 2016). ML approaches can potentially help fill in the large data gaps resulting from poor survey coverage, and contribute to making more data available on difficult–to–reach populations.
ML has shown promise when it comes to filling gaps in data related to poverty, population density, or basic infrastructure, i.e. data that are necessary to be able to efficiently target development interventions as well as to evaluate impact. As discussed in Paul et al. (2018), filling these data gaps generally requires beginning with scarce, high-value data (e.g. poverty measures in existing household
CGD Background Paper
16
surveys) and then using cheap, abundant data (e.g. from mobile phones or satellite images) to predict these target data. ML can help to infer poverty levels based on structural features such as roofing material and proximity to roads and other buildings identified in satellite images or by mobile phone usage data.
While not impact evaluations per se, a growing number of studies illustrate the potential of using remotely sensed data and ML techniques to assess development outcomes. Studies by Burke et al. (2016) and Yeh et al. (2020) provide examples of efforts using satellite imagery and machine learning to assess local economic conditions in Africa. Burke et al. (2016) use machine learning to extract socioeconomic data from high-resolution daytime satellite imagery, validating the approach in five African countries for which geo-referenced local-level data on economic outcomes are available. They find that their ML model can be trained to identify image features that explain around 75 percent of the variation in local-level economic outcomes, and thus argue that their approach could be used to fill in the large data gaps resulting from poor survey coverage in many African countries.
Leo et al. (2020) use ML to assess vulnerability to climate change in Mali and Malawi. According to the authors, many efforts to map climate change vulnerability focus exclusively on environmental data, like the incidence of flooding and droughts, leaving out information about the adaptation potential and resilience of the communities living with this threat. Instead, they use ML algorithms to combine satellite imagery and publicly available microdata to create environmental as well as socioeconomic and demographic indicators used to build indices of vulnerability at the one square kilometer resolution level. They argue that ML is central for expanding the reach of existing datasets to provide insights at the local-level, where such data is otherwise difficult to access, and that the approach can help provide a better understanding of baseline vulnerability and gaps in adaptive capacity, and to evaluate how specific interventions are helping to address these gaps.
The study of Aiken et al. (2020) illustrates both the promise and the risks of using digital trace data to identify (or measure outcomes among) vulnerable groups. They study the extent to which machine learning leveraging mobile phone data can accurately differentiate ultra-poor households eligible for program benefits from other poor households deemed ineligible. Specifically, they match mobile phone transaction logs to household survey data in Afghanistan, and evaluate the accuracy of ML methods drawing on the mobile phone data to identify the ultra-poor in comparison to traditional asset- and consumption-based measures of poverty from household survey data. Their findings suggest that the ML results are comparable in accuracy to standard survey-based measures of welfare for identifying the phone-owning ultra-poor. As emphasized by the authors, however, their ML measure is limited to households owning mobile phones, meaning that its utility is compromised when there is incomplete mobile phone penetration. This, of course, is a general problem when using digital trace data; there is an inherent risk of not capturing those who are not equally digitally connected, and thus of compounding inequalities manifested in digital divides.
Another dimension of how ML can help fill in data gaps concerns when the approach allows researchers to derive data on outcomes that may otherwise be difficult to measure. The study by Parthasarathy et al. (2019) provides a good example in this regard. The authors use textual analysis of transcripts of India’s village assemblies to explore the relationship between deliberative influence and the gender and position (citizen versus official) of a speaker. The vast amount of data would make this very difficult to do systematically using traditional methods. However, by using ML techniques
CGD Background Paper
17
for textual analysis, they are able to quantitatively examine the relative floor time enjoyed by different types of speakers, as well as their ability to influence the topic of conversation and to have the state listen to their claims. Their findings suggest, for instance, that women are less likely to speak, less likely to influence the topic of conversation, and get fewer responses from state officials. However, in villages that have been randomly chosen to have a female president, women are significantly more likely to speak and be listened to than in villages with a male president, in line with the idea that female representation influences social norms.
While data based on ML techniques show great potential for making development impact evaluation more efficient, experience from higher income contexts warns of potential concerns that need consideration (see the discussion in McKenzie, 2018; Paul et al., 2018; and Bamberger and York, 2020a,b). A key issue concerns the challenges of ensuring the privacy of the populations on which the data is based. How organizations collect and protect potentially sensitive data on the populations with whom they work is thus central in this context (Pisa et al., 2020). Another issue has to do with transparency and interpretability. Machine-learning algorithms are something of a ‘black box’. In many cases, the algorithms – or their results – are considered proprietary, and even if they are not, the level of technical expertise required to understand them limits the ability of non-expert users to critically assess the data. Next, there is always a risk that algorithmic decisions are faulty. For instance, if relying on ML algorithms to target an intervention, people may be unfairly included or excluded. And with decisions based on ML algorithms rather than human judgements, the people impacted may be unable to hold anyone accountable for the results. Furthermore, algorithmic mistakes often fall disproportionately on marginalized groups (Paul et al., 2018).
Relatedly, a concern when using digital trace data relates to skewed data representativeness stemming from unequal access to digital technologies (Hilbert, 2016). If the most vulnerable groups are the least well represented in the data, there is a greater risk of algorithmic mistakes with respect to these groups. The fact that data can be obtained on millions of people can lead to a ‘fallacy of large numbers’ in the sense that it is implicitly assumed that the huge sample makes selection bias less of a concern (Bamberger and York, 2020a). However, if the ML measure is limited to households owning mobile phones, as in the study of Aiken et al. (2020), this needs to be taken into account when interpreting the results.
With these issues in mind, however, data based on machine-learning have undeniable potential for making development interventions as well as development impact evaluation more efficient.
4. Right fit impact evaluation: Challenges and prospects
While estimating the impact of an intervention requires a certain level of analytical rigor, the discussion throughout this paper has highlighted the tradeoffs between, on the one hand, the need for careful data collection and analysis, and on the other, assuring that impact assessments are cost-efficient and available to decision makers in a timely manner. The global COVID-19 pandemic, which has led to both growing needs for robust evidence on development effectiveness and severe constraints on evaluation practices, underscores these tradeoffs.
This background paper has explored the menu of experimental and quasi-experimental impact

CGD Background Paper
18
evaluation strategies open to evaluators, depending on context- and evaluation-specific constraints. In doing so, it has focused on recent advances in the methods and data (summarized in Tables 1-2) available for impact evaluation that enable rigorous evaluation even under circumstances calling for faster and lower-cost evaluations. The discussion has highlighted that there is no one-size-fits-all in impact evaluation; the appropriate format of the evaluation varies depending on the policy, policy makers involved, objectives, and constraints in focus.
To begin with, RCTs are clearly a powerful tool to assess the causal impacts of development projects with strong internal validity. However, for timely studies that effectively inform policy action, there may be reason to modify the experimental protocol. To ensure greater policy relevance, an efficient solution may be to conduct evaluations with the explicit aim to inform a specific policy decision of a specific implementer in a specific location for a specific target population over a specific time horizon, rather than to produce generalizable conclusions (Shah et al. 2015). From the implementer’s perspective, smaller scale, lower-cost solutions may well be sufficient to address the questions they are most interested in. Using the analogy of Gugerty and Karlan (2018a,b), like Goldilocks in the famous children’s story, governments and development agencies need to build evaluation systems that fit their needs.
Table 1. Methodological developments allowing for rapid impact evaluation
Rapid IE tool Characteristics Suitable for Data requirements
Empirical example
Context specific, smaller scale IE
Align objectives with the temporal, budgetary, operational and political constraints of the implementer. Test interventions under conditions similar to those in which the interventions could be scaled.
Informing a specific policy of a specific implementer in a specific location/time/target population, within their time, budgetary and operational constraints. Not suitable to create generalizable knowledge across contexts.
Consider proximate outcomes, use smaller surveys and samples, low-cost remote surveys, draw on pre-existing data
Wang et al. (2016), evaluating the use of ‘mama-kits’ in Zambia
Multiple treatment arms – A/B testing
Randomized trials that compare the effect of related interventions on a short-term outcome.
Assessing variations in program design, in the design or pilot stage of an intervention. Allows for rapid assessment of multiple treatments at low cost.
Often based on administrative data, large sample sizes required to detect small impacts of incremental changes to interventions.
Karlan et al. (2016) on SMS to encourage savings in Bolivia and the Philippines

CGD Background Paper
19
Multiple treatment arms, no pure control
RCTs with multiple treatment arms but no pure control group.
Alleviating ethical concerns regarding withholding assistance for the control group.
Similar to standard RCT (but no need to collect data on untreated group).
Banerjee et al. (2020a) evaluating a COVID-19 prevention messaging campaign in India
Adaptive/iterative evaluation
Designed to be rapid and iterative with multiple waves of data collected to enable program adaptation and inform real-time policy responses along the way.
When policymakers require a rapid feedback loop and need to inform policy in real-time.
Multiple rounds of data collection made easier with low cost remote surveys.
Angrist et al. (2020, 2021) on COVID-19 education policy in Botswana; Caria et al. (2020) on labor market policies in Jordan
Quasi-experimental methods
Econometric techniques to find ‘control’ cases that are sufficiently similar to the ‘treated’ cases to constitute a viable comparison group. E.g. RDD, matching, Diff-in-diff, synthetic control groups and ML-techniques.
When randomization is not feasible or desirable for e.g. financial, ethical or political reasons, or due to time constraints. The fact that these methods do not require random treatment assignment enables faster evaluation. Useful for retrospective studies.
Often drawing on pre-existing data, e.g. administrative data, remotely sensed data, enabling cheaper and faster studies.
Odokonyero et al. (2018) on the effects of health aid in Uganda
Furthermore, in many cases, it is reasonable to depart from random treatment assignment and instead use quasi-experimental methods based on observational data. The basic idea behind these methods is to find control cases that are sufficiently similar to the treated cases to constitute a viable comparison group. While this clearly presents a challenge in terms of internal validity, researchers have increasingly sophisticated tools and data at their disposal. Synthetic control methods and different machine learning techniques are noteworthy developments for this toolbox. Moreover, with increased availability of granular spatial data, researchers are better able to assess outcomes and control for potential confounding factors at fine geographic levels.
CGD Background Paper
20
While random treatment assignment undeniably is an advantage with respect to the internal validity of an impact evaluation, quasi-experimental studies based on observational data can be comparatively strong in terms of external validity. In particular, many of the readily available data sources discussed above offer very large sample sizes and are collected continuously over long time periods, with advantages for external validity in both a spatial and a temporal sense. While these data sources can be used for baseline and outcome measures in a study based on random treatment assignment as well, quasi-experimental methods enable the evaluator is able to conduct impact evaluations retrospectively, after project completion.
While the rapid developments in terms of new data sources and increasingly sophisticated analytical tools show great potential for making development impact evaluation more efficient, there are some hurdles to widespread adoption. As noted by Bamberger and York (2020b), the need to adapt to a new data ecosystem will likely cause some disruption. Considering that many evaluators are not familiar with the new technologies for data collection and analysis, capacity development will be necessary. More generally, widespread adoption of the new techniques may require investments in equipment, software, and staff. For instance, evaluation agencies will greatly benefit from incorporating additional staff or consultants with data science skills (which would require increased funding for data science expertise). Changes like these may meet with resistance.
There are also important outstanding challenges with respect to safeguarding the privacy and consent of the populations on which (potentially sensitive) data are based and to ensuring transparency and interpretability of data and methods that require a high level of technical expertise.
Another key challenge involves capturing the most vulnerable groups when relying on digital trace data or data based on administrative records, which pick up only those already engaging with a service. It is critical to identify ways to capture households living in rural areas with poor internet connectivity, individuals who do not own mobile phones, the less educated, and those that lack digital literacy skills. Since people who fall in the latter categories disproportionately tend to be women, there are important gendered effects to take into account.
Furthermore, the fast-changing environment created by the pandemic poses major challenges for evaluation. Most notably, travel restrictions limit the possibilities for field-based assessments of project effectiveness.
CGD Background Paper
21
Table 2. Summary of useful data developments allowing for rapid impact evaluation
Examples Strengths Weaknesses Geo-coded survey data
DHS, Afrobarometer, LSMS, National household survey programs
Readily available; low cost; multiple rounds enable retrospective evaluation
Since not designed for the specific study, scope limited to questions covered in the survey instrument
Administrative data
Sales records, medical records, insurance claims, educational records, labor statistics, tax records, social transfers
Large samples (often near universal coverage); low cost; low burden on participants; accurate (no recall bias etc.); often collected regularly over time, enabling retrospective evaluation
Bias if treatment affects the likelihood for appearing in the admin. data; often requires data cleaning / digitizing; ethical considerations relating to sensitive data and how closely it can be linked to particular individuals; since not designed for the specific study, scope limited to what is in the data.
Remotely sensed data
Satellite imagery, measures of precipitation, wind, etc.
Publicly available; global coverage; collected continuously over long periods of time enabling retrospective evaluation; used e.g to assess local economic conditions, migration, settlement and land use patterns in regions where official records are lacking,
Since not designed for the specific study, scope limited to what is in the data.
Low cost remote surveys
Computer Assisted Telephone Interviewing (CATI), SMS surveys, Interactive Voice Response (IVR) surveys, online surveys
Flexibility in terms of scope – evaluators can design their own survey instrument and conduct the survey at relatively low cost.
Selection issues: requires access to phone / smartphone / computer / internet; SMS and online surveys require literacy; low response rates; limited richness of the data.
Big data (ML) Data from Internet / social media / mobile phone use, satellite imagery
Huge data volumes; updated in near real time; can help fill data gaps in areas where data is lacking; use ML to detect patterns in the data e.g. infer poverty levels based on roofing material in satellite images, night/day time light, and mobile phone usage data
Privacy concerns; transparency and interpretability; representativeness due to unequal access to digital technology; algorithmic mistakes, especially for groups less covered in the data; accountability concerns if basing development policy on algorithms.
That said, the methodological advances and the rapid increase in granular data on important development outcomes undeniably come with exciting opportunities. Access to data is becoming faster and cheaper and new analytical tools make it possible to combine multiple kinds of data, such as survey data, administrative data, satellite data and digital trace data, into a single database. Some of these data sources offer very large sample sizes (sometimes even the full population), allowing for more detailed analysis of heterogeneous effects and positive/negative outliers, i.e. what works where and why. Furthermore, many of these data are collected at high frequency over long periods of time, allowing
CGD Background Paper
22
for evaluation of short-term impact as well as of the long-term sustainability of interventions.
As noted, many of the data sources discussed above have in common that they are readily available. Utilizing comprehensive existing data materials rather than collecting own baseline and/or outcome data can help make impact evaluations both faster and cheaper. Awareness of these data sources could potentially encourage policy implementers and program managers to continuously assess impact and improve program design. Furthermore, drawing on existing data, much of the evaluation can be conducted remotely, say from a policy evaluator’s desk. This is not only beneficial from a cost perspective; it is also useful to evaluators working in fragile state settings or when conducting an impact evaluation during a global pandemic.
Furthermore, even if judging that the evaluation requires original data collection, technological advances have made researchers better able to conduct remote surveys quickly and at relatively low cost. With the travel restrictions and social distancing guidelines in place during the COVID-19 pandemic, many research organizations have in fact already shifted to data collection through remote surveys. Indeed, one could argue that the constraints following the pandemic provide “an exciting opportunity to reconsider whether traditional methods are the best way to tackle an evaluation problem and how best to work in situations where conventional techniques for data collection are more costly, difficult, or simply unavailable” (IEG, 2020, p. 32).
Tables 1 and 2 summarize the empirical examples mentioned throughout this paper, along with the particular data sources and methodological tools they utilize. Ranging from an evaluation of the cost-effectiveness of ‘mama-kits’ to encourage facility deliveries and reduce maternal and infant mortality (Wang et al., 2016) to how to frame a COVID-19 prevention messaging campaign to achieve maximum adherence (Banerjee et al., 2020a), these examples illustrate the potentially strong policy impact of rapid rigorous evaluations.
In broad terms, a key message of the above discussion concerns the benefits of a flexible approach to the methods and data materials used for impact evaluation in order to assure that impact assessments are cost-efficient and available to decision makers in a timely manner.
5. Recommendations
Estimating the impact of an intervention requires an attempt to gauge what outcomes beneficiaries would have had in the absence of the intervention and compare this with the outcomes observed when the intervention was implemented. In this paper, we have thus thought of rigorous impact evaluation as requiring a counterfactual-based identification strategy to attribute causal impact to an intervention with statistical confidence. As discussed throughout the paper, however, this does not imply a one-size-fits-all impact evaluation solution. Rather, this paper has emphasized that there is a menu of experimental and quasi-experimental impact evaluation strategies open to evaluators to this end. Which approach is most appropriate for a given evaluation depends on the concerned stakeholders, objectives and constraints. Against this background, recommendations will inevitably be of a rather general nature. Nonetheless, a number of key points stand out from the above discussion, each with relevance for different target audiences: evaluators/researchers, implementing agencies, and funders (see Table 3).
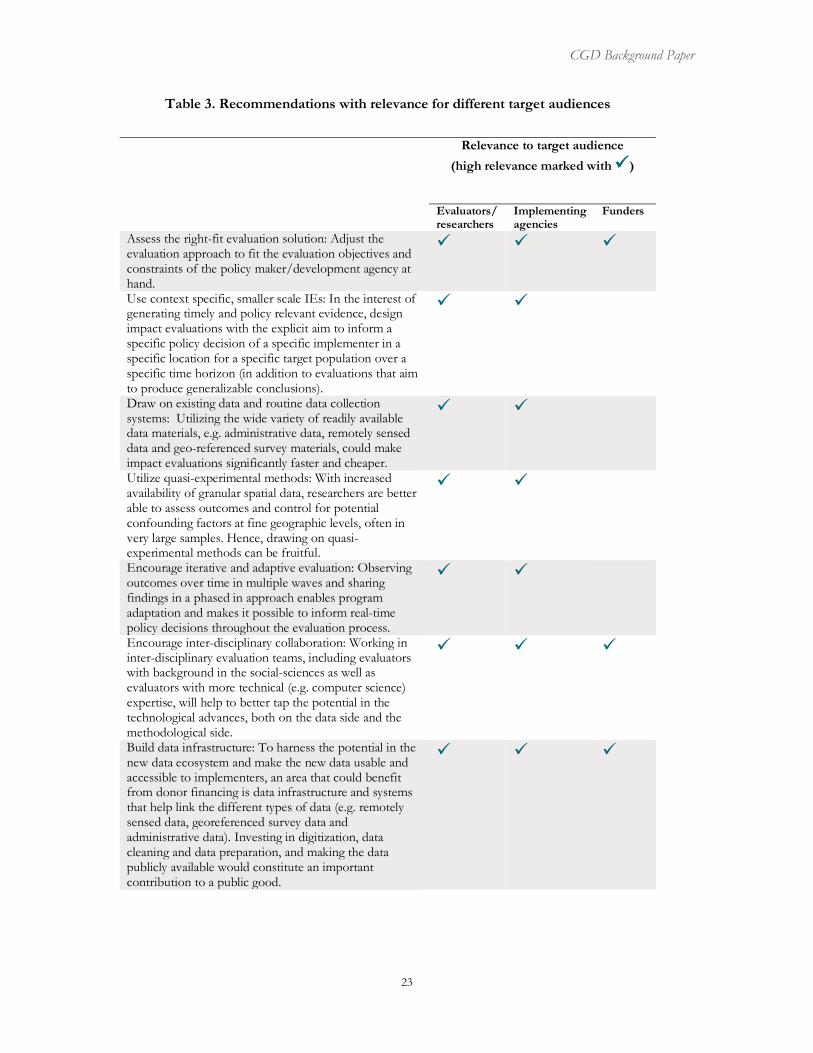
CGD Background Paper
23
Table 3. Recommendations with relevance for different target audiences
Relevance to target audience (high relevance marked with )
Evaluators/researchers
Implementing agencies
Funders
Assess the right-fit evaluation solution: Adjust the evaluation approach to fit the evaluation objectives and constraints of the policy maker/development agency at hand.
Use context specific, smaller scale IEs: In the interest of generating timely and policy relevant evidence, design impact evaluations with the explicit aim to inform a specific policy decision of a specific implementer in a specific location for a specific target population over a specific time horizon (in addition to evaluations that aim to produce generalizable conclusions).
Draw on existing data and routine data collection systems: Utilizing the wide variety of readily available data materials, e.g. administrative data, remotely sensed data and geo-referenced survey materials, could make impact evaluations significantly faster and cheaper.
Utilize quasi-experimental methods: With increased availability of granular spatial data, researchers are better able to assess outcomes and control for potential confounding factors at fine geographic levels, often in very large samples. Hence, drawing on quasi-experimental methods can be fruitful.
Encourage iterative and adaptive evaluation: Observing outcomes over time in multiple waves and sharing findings in a phased in approach enables program adaptation and makes it possible to inform real-time policy decisions throughout the evaluation process.
Encourage inter-disciplinary collaboration: Working in inter-disciplinary evaluation teams, including evaluators with background in the social-sciences as well as evaluators with more technical (e.g. computer science) expertise, will help to better tap the potential in the technological advances, both on the data side and the methodological side.
Build data infrastructure: To harness the potential in the new data ecosystem and make the new data usable and accessible to implementers, an area that could benefit from donor financing is data infrastructure and systems that help link the different types of data (e.g. remotely sensed data, georeferenced survey data and administrative data). Investing in digitization, data cleaning and data preparation, and making the data publicly available would constitute an important contribution to a public good.

CGD Background Paper
24
References
Abadie, A. (2020) ““Using Synthetic Controls: Feasibility, Data Requirements, and Methodological Aspects”, Journal of Economic Literature, forthcoming.
ACRES (2021) “Covid-19 briefs”, The Center for Rapid evidence synthesis, Makere University, accessed at: https://acres.or.ug/rapid-response-service/briefs-archive/covid-19-briefs-2/ on 2021-03-10.
Afrobarometer (2020) “Geocoded data”, accessed at: http://afrobarometer.org/data/geocoded-data on 2020-12-11.
Aiken, E. L., Bedoya, G., Coville, A. and J. E. Blumenstock (2020) “Targeting Development Aid with Machine Learning and Mobile Phone Data”, unpublished manuscript, available at: http://jblumenstock.com/files/papers/jblumenstock_ultra-poor.pdf. (accessed 2020-11-04)
Angrist, N., Bergman, P., Brewster, C. and M. Matsheng (2020) “Stemming Learning Loss During the Pandemic: A Rapid Randomized Trial of a Low-Tech Intervention in Botswana”, CSAE Working Paper WPS/2020-13, University of Oxford.
Angrist, N., Bergman, P. and M. Matsheng (2021) “School’s out: Experimental evidence on limiting learning loss using ‘low-tech’ in a pandemic”, NBER Working Paper 28205.
Angrist, J.D. and J-S. Pischke (2009) Mostly Harmless Econometrics: An Empiricist’s Companion, Princeton, New Jersey: Princeton University Press.
Athey, S. (2016) “How Do Academic Economists Use A/B Testing?”, Forbes, Quora, Apr 5, 2016, accessed at: https://www.forbes.com/sites/quora/2016/04/05/how-do-academic-economists-use-ab-testing/ on 2021-01-15.
Athey, S. (2019) “The Impact of Machine Learning on Economics”, in Ajay Agrawal, A., Gans, J. and A. Goldfarb (eds.) (2019) The Economics of Artificial Intelligence: An Agenda, Chicago: University of Chicago Press.
Athey, S., R. Chetty, G. W. Imbens, and H. Kang (2019) “The Surrogate Index: Combining Short-term Proxies to Estimate Long-term Treatment Effects more Rapidly and Precisely”, Working Paper 26463, National Bureau of Economic Research.
Athey, S. and G. W. Imbens (2017) “The state of applied econometrics: Causality and policy evaluation”, The Journal of Economic Perspectives, 31(2), pp.3-32.
Austin, P.C. (2011) “An Introduction to Propensity Score Methods for Reducing the Effects of Confounding in Observational Studies”, Multivariate Behavioral Research, 46(3), pp. 399–424.
Bamberger, M. and P. York (2020a) “Measuring results and impact in the age of big data: The nexus of evaluation, analytics, and digital technology”, The Rockefeller Foundation, Measurement and Evaluation, March 2020, accessed at: https://www.rockefellerfoundation.org/wp-content/uploads/Measuring-results-and-impact-in-the-age-of-big-data-by-York-and-Bamberger-March-2020.pdf on 2020-12-21.
Bamberger, M. and P. York (2020b) “Preparing Evaluation of the Future: Big Data, Modern Technologies, and Shifs in Global Development Priorities”, Evaluation Matters, June 2020, pp. 10-21, Independent Development Evaluation, African Development Bank Group.
Banerjee, A., Alsan, M., Breza, E., Chandrasekhar, A. G., Chowdhury, A., Duflo, E., Goldsmith-Pinkham, P., and B. A. Olken (2020a) “Messages on Covid-19 prevention in India increased symptoms reporting and adherence to preventive behaviors among 25 million recipients with similar effects on non-recipient members of their communities”, NBER Working Paper 27496, National Bureau of Economic Research, July 2020.

CGD Background Paper
25
Banerjee, A., Duflo, E., Imbert, C., Mathew, S. and R.i Pande (2020b) "E-governance, Accountability, and Leakage in Public Programs: Experimental Evidence from a Financial Management Reform in India." American Economic Journal: Applied Economics, 12 (4), pp. 39-72.
BenYishay, A., Runfola, D., Trichler, R., Dolan, C., Goodman, S., Parks, B., Tanner, J., Heuser, S., Batra, G. and A. Anand (2017) “A Primer on Geospatial Impact Evaluation Methods, Tools, and Applications”, mimeo, Williamsburg, VA: AidData.
Bhajibhakare, S., Chopra, A., Gupta, P. and M. Patel (2020) “Transitioning to CATI: Checklists and Resources”, J-PAL South Asia March 2020, accessed at: https://www.povertyactionlab.org/sites/default/files/research-resources/transitioning-to-CATI-Checklists.pdf on 2020-12-21.
Burke, M., Davis, M., Ermon, S., Jean, N., Lobell, D. B. and M. Xie (2016) “Combining satellite imagery and machine learning to predict poverty”, Science, 353(6301), pp. 790-794.
Burke, M. and D. B. Lobell (2017) “Satellite-based assessment of yield variation and its determinants in smallholder African systems”, Proceedings of the National Academy of Sciences of the United States of America (PNAS), 114 (9), pp. 2189-2194.
Caria, A. S., Gordon, G., Kasy, M., Quinn, S., Shami, S. and A. Teytelboym (2020) “An Adaptive Targeted Field Experiment: Job Search Assistance for Refugees in Jordan”, CSAE Working Paper WPS/2020-20, available at: https://www.csae.ox.ac.uk/materials/papers/csae-wps-2020-20.pdf (accessed 2020-11-04)
Cole, S., Dhaliwal, I., Sautmann, A. and L. Vilhuber (2020) “Introduction.” In: Cole, S., Dhaliwal, I., Sautmann, A. and L. Vilhuber (eds.), Handbook on Using Administrative Data for Research and Evidence-based Policy. Abdul Latif Jameel Poverty Action Lab (J-PAL), MIT, Accessed at: https://admindatahandbook.mit.edu/book/v1.0-rc5/intro.html on 2020-11-04./ on 2020-11-04.
Demographic and Health Survey (2020) “Data” accessed at: http://dhsprogram.com/Data/ on 2020-12-11
Dibner-Dunlap, A. and Y. Rathore (2016) “Beyond RCTs: How Rapid-Fire Testing Can Build Better Financial Products”, Innovations for Policy Action, blog August 1 2016, accessed at: https://www.poverty-action.org/blog/beyond-rcts-how-rapid-fire-testing-can-build-better-financial-products on 2021-01-18.
European Centre for Disease Prevention and Control (2020) “COVID-19 situation update worldwide, as of 24 November 2020” accessed at: https://www.ecdc.europa.eu/en/geographical-distribution-2019-ncov-cases on 2020-11-25).
Evans, A. (2020) “Evidence as a guide in uncertain times - IEG in 2020”, ieg blog post, October 7, 2020, accessed at: http://ieg.worldbankgroup.org/blog/evidence-guide-uncertain-times-ieg-2020 on 2020-11-07.
Feeney, L., Bauman, J., Chabrier, J., Mehra, G. and M. Woodford (2018) “Using administrative data for randomized evaluations”, J-PAL North America, December 2015, updated November 2018, Accessed at: https://www.povertyactionlab.org/resource/using-administrative-data-randomized-evaluations on 2020-11-04.
Gugerty, M. K., Karlan, D. and T. Zelenska (2016) ”Introduction to Rapid-Fire Operational Testing for Social Programs”, Innovations for Poverty Action, February 2016, accessed at: https://www.poverty-action.org/sites/default/files/publications/Goldilocks-Deep-Dive-Introduction-Rapid-Fire-Operational-Testing-for-Social-Programs_0.pdf on 2021-01-15.
CGD Background Paper
26
Gugerty, M. K. and D. Karlan (2018a) The Goldilocks Challenge: Right-Fit Evidence for the Social Sector, Oxford Scholarship Online.
Gugerty, M. K. and D. Karlan (2018b) “Ten reasons not to measure impact – and what to do instead”, Stanford Social Innovation Review, Summer 2018.
Harron K, Dibben C, Boyd J, Hjern, A., Azimaee, M., Barreto, M. L. and H. Goldstein (2017) “Challenges in administrative data linkage for research”. Big Data & Society. December 2017. Pp. 1-12.
Haushofer, J. and C. J. E. Metcalf (2020) “Which Interventions Work Best in a Pandemic?”, Science 368(6495), pp. 1063–1065.
Henderson, J. V., Storeygard, A. and D. N. Weil (2012) “Measuring Economic Growth from Outer Space", American Economic Review, 102(2), pp. 994-1028.
Hilbert, M. (2016) “Big Data for Development: A Review of Promises and Challenges”, Development Policy Review, 34(1), pp. 135–174.
Iacus, S. M., King, G. and G. Porro (2012) “Causal Inference Without Balance Checking: Coarsened Exact Matching.” Political Analysis, 20(1), pp. 1--24.
IDinsight (2020) “Learning Partnership”, accessed at: https://www.idinsight.org/engagements/learning-partnership on 2021-03-01.
IEG (2020) “Insights for a Rapidly Changing World: IEG 2020 Annual Report”, Independent Evaluation Group, World Bank Group, accessed from: https://openknowledge.worldbank.org/handle/10986/34711 on 2020-11-07.
Imbens, G. W. and T. Lemieux (2008) “Regression Discontinuity Designs: A Guide to Practice”, Journal of Econometrics, 142(2), pp. 615–35.
IPUMS TERRA (2020) “Data”, Accessed at: https://terra.ipums.org/data on 2020-12-14 Isaksson, A-S (2017) “Geospatial analysis of aid: A new approach to aid evaluation”, EBA report 9
2017, Available at: https://eba.se/en/rapporter/geospatial-analysis-of-aid-a-new-approach-to-aid-evaluation/6435/
Karlan, D., McConnell, M., Mullainathan, S., and J. Zinman (2016) “Getting to the Top of Mind: How Reminders Increase Saving”, Management Science, 62(12), pp. 4-52.
Kopper, S. and A. Sautmann (2020) ”Best practices for conducting phone surveys” J-Pal Blog post 20 March 2020, accessed at: https://www.povertyactionlab.org/blog/3-20-20/best-practices-conducting-phone-surveys on 2020-12-21.
Leeuw, F. and J. Vaessen (2009) “Impact Evaluations and Development: NoNIE Guidance on Impact Evaluation”, The Network of Networks on Impact Evaluation, Washington DC. Accessed at: https://www.oecd.org/development/evaluation/dcdndep/47466906.pdf on 2020-11-25.
Legovini, A. and M. R. Jones (2020) “Administrative Data in Research at the World Bank: The Case of Development Impact Evaluation (DIME).” In: Cole, S., Dhaliwal, I., Sautmann, A. and L. Vilhuber (eds.), Handbook on Using Administrative Data for Research and Evidence-based Policy, Abdul Latif Jameel Poverty Action Lab (J-PAL), MIT, Accessed at: https://admindatahandbook.mit.edu/book/v1.0-rc5/dime.html on 2020-11-04.
Leo, B., Patni, S., Winn, C., Lewis, Q., Paton, C. and M. Persaud (2020) “Using Machine Learning for Climate Related Impact Evaluations”, Evaluation Matters, June 2020, pp. 22-33, Independent Development Evaluation, African Development Bank Group.

CGD Background Paper
27
Mani, S. and B. Barooah (2020) “Phone surveys in developing countries need an abundance of caution”, International Initiative for Impact Evaluation (3ie), blog post 9 April 2020, Accessed at: https://www.3ieimpact.org/blogs/phone-surveys-developing-countries-need-abundance-caution on 2020-11-02.
McKee, C., Blampied, C., Mitchell, I. and A. Rogerson (2020) “Revisiting aid effectiveness: A new framework and set of measures for assessing aid ‘quality’”, Center for Global Development Working Paper 524.
McKenzie, D. (2018) “How can machine learning and artificial intelligence be used in development interventions and impact evaluations?”, Development Impact, March 5 2018, accessed at: https://blogs.worldbank.org/impactevaluations/how-can-machine-learning-and-artificial-intelligence-be-used-development-interventions-and-impact on 2021-01-19.
McKenzie, D. (2021) “What do you need to do to make a matching estimator convincing? Rhetorical vs statistical checks”, Development Impact, February 16 2021, accessed at: https://blogs.worldbank.org/impactevaluations/what-do-you-need-do-make-matching-estimator-convincing-rhetorical-vs-statistical
Mobarak, M. (2021) “Cox’s Bazar Panel Survey”, Yale Macmillan Center, accessed at: https://refugee.macmillan.yale.edu/research-outputs/coxs-bazar-panel-survey on 2021-02-11.
Mukerji, S. and V. Priyadarshini (2020) “Foundations of ethical and high-quality data collection during the COVID-19 pandemic”, The Abdul Latif Jameel Poverty Action Lab (J-PAL), Blog post 13 July 2020, available at https://www.povertyactionlab.org/blog/7-13-20/foundations-ethical-and-high-quality-data-collection-during-covid-19-pandemic (accessed 2020-11-02).
Muralidharan, K. and P. Niehaus (2017) “Experimentation at Scale”, Journal of Economic Perspectives, 31(4), pp. 103–124.
Narasimhan, M. and A. Arun (2017) “Shifting gears: Randomised Control Trials and the future of development evaluation”, LSE blogs, July 17 2017, accessed at: https://blogs.lse.ac.uk/southasia/2017/07/11/shifting-gears-randomised-control-trials-and-the-future-of-development-evaluation/ on 2021-01-15.
NASA Earth Observing System Data and Information System (2020) “Worldview”, Accessed at: https://worldview.earthdata.nasa.gov/ on 2020-14-12.
National Oceanic and Atmospheric Administration (2020) “Earth Observation Group (EOG)”, Accessed at: https://ngdc.noaa.gov/eog/index.html on 2020-12-14.
Odokonyero, T., Ijjo, A., Marty, R., Muhumuza, T. and G. O. Moses (2018) “The impact of aid on health outcomes in Uganda”, Health Economics. Vol. 27, pp. 733–745.
Parthasarathy, R., Rao, V. and N. Palaniswamy (2019) “Deliberative Democracy in an Unequal World: A Text-As-Data Study of South India’s Village Assemblies”, American Political Science Review, 113(3), pp. 623-640.
Paul, A., Jolley, C. and A: Anthony (2018) ”Reflecting the past, Changing the Future: Making AI work for international development”, Strategy & Research team within the Center for Digital Development, USAID.
Pisa, M., Dixon, P., Ndulu, B. and U. Nwankwo (2020) “Governing Data for Development: Trends, Challenges, and Opportunities”, Center for Global Development Policy Paper 190 November 2020.
CGD Background Paper
28
Puri, J., Aladysheva, A., Iversen, V., Ghorpade, Y. and T. Brück (2017) ”Can rigorous impact evaluations improve humanitarian assistance?”, Journal of Development Effectiveness, 9(4), pp. 519–542.
Pritchett, L. and J. Sandefur (2014) “Context Matters for Size: Why External Validity Claims and Development Practice do not Mix”, Journal of Globalization and Development, 4(2), pp. 161-197.
Pritchett, L. and J. Sandefur (2015) “Learning from Experiments when Context Matters”, The American Economic Review: Papers and proceedings, 105(5), pp. 471-475.
Rose, S. and A. Glassman (2018) “Committing to Cost-Effectiveness: USAID’s New Effort to Benchmark for Greater Impact”, Center for Global Development Note September 2018
Shah, N. B., Wang, P., Fraker, A. and D. Gastfriend (2015) “Evaluations with impact: Decision-focused impact evaluation as a policy-making tool”, International Initiative for Impact Evaluation (3ie), Working Paper 25, September 2015.
Schwab, B., A. Margolies, and J. Hoddinott (2013) “Impact Evaluation of Cash and Food Transfers for the Seasonal Emergency Safety Net in Hajjah and Ibb Governorates: Yemen Endline Report”, Washington, DC: International Food Policy Research Institute.
UN Global Pulse (2016) “Integrating Big Data into the Monitoring and Evaluation of Development Programmes”, accessed at: https://www.unglobalpulse.org/wp content/uploads/2016/12/integratingbigdataintomedpwebungp-161213223139.pdf on 2020-12-21
United Nations (2015) “Transforming our world: the 2030 Agenda for Sustainable Development”, Resolution adopted by the General Assembly on 25 September 2015.
US Geological Survey (2020) “U.S. Geological Survey “, Accessed at: https://www.usgs.gov/ on 2020-12-14.
Vandercasteelen, J. (2020) ”When evaluators cannot make it to the field, they can always observe from space”, ieg blog post, July 22, 2020, Accessed from: http://ieg.worldbankgroup.org/blog/when-evaluators-cannot-make-it-field-they-can-always-observe-space on 2020-11-07.
Vivalt, E. (2015) “Heterogeneous Treatment Effects in Impact Evaluation”, American Economic Review: Papers & Proceedings, 105(5), pp. 467-470.
Vivalt, E. (2020) “How much can we generalize from impact evaluations?”, Journal of the European Economic Association, September 2020 (pre-print).
Wang, P., Connor, A. L., Guo, E., Nambao, M., ChandaKapata, P., Lambo, N., and C. Phiri (2016) “Measuring the impact of non-monetary incentives on facility delivery in rural Zambia: a clustered randomised controlled trial”, Tropical Medicine and International Health, 21(4).
White, H. (2006) “Impact evaluation: the experience of the Independent Evaluation Group of the World Bank”, Independent Evaluation Group, The World Bank, accessed at: https://mpra.ub.uni-muenchen.de/1111/1/MPRA_paper_1111.pdf on 2021-06-17.
Wigley, A.S., Tejedor-Garavito, N., Alegana, V. et al. (2020) “Measuring the availability and geographical accessibility of maternal health services across sub-Saharan Africa”. BMC Med, 18(237). https://doi.org/10.1186/s12916-020-01707-6
World Bank (2020a) “Living Standards Measurement Study” accessed at: https://www.worldbank.org/en/programs/lsms/overview on 2020-12-11.
World Bank (2020b) “Poverty and Shared Prosperity 2020: Reversals of Fortune”, Washington, DC: World Bank.

CGD Background Paper
29
World Bank (2020c) “Cox’s Bazar Panel Survey: Rapid Follow-up Round 1 Impacts of covid-19 on work and wages in Cox’s Bazar”, The World Bank Group, July 2020, accessed at: https://fscluster.org/sites/default/files/documents/labor_cxb_covid.pdf on 2021-02-11
WorldPop (2020) “About WorldPop”, Accessed at: https://www.worldpop.org/about on 2020-12-14
Yeh, C., Perez, A., Driscoll, A. et al. (2020) “Using publicly available satellite imagery and deep learning to understand economic well-being in Africa”, Nature Communications, 11(2583), pp. 1-11.
3ie (2021) “Evidence synthesis response to COVID-19 crisis”, International Initiative for Impact Evaluation (3ie), accessed at: https://www.3ieimpact.org/about-us/Evidence-synthesis-response-COVID-19-crisis on 2021-01-29.
60 Decibels (2020) “Remote Survey Toolkit: Prepared in Response to COVID-19”, 60 Decibels, March 2020, accessed at: https://60decibels.com/user/pages/03.Work/_remote_survey_toolkit/60_Decibels_Remote_Survey_Toolkit_March_2020.pdf on 2020-12-21.
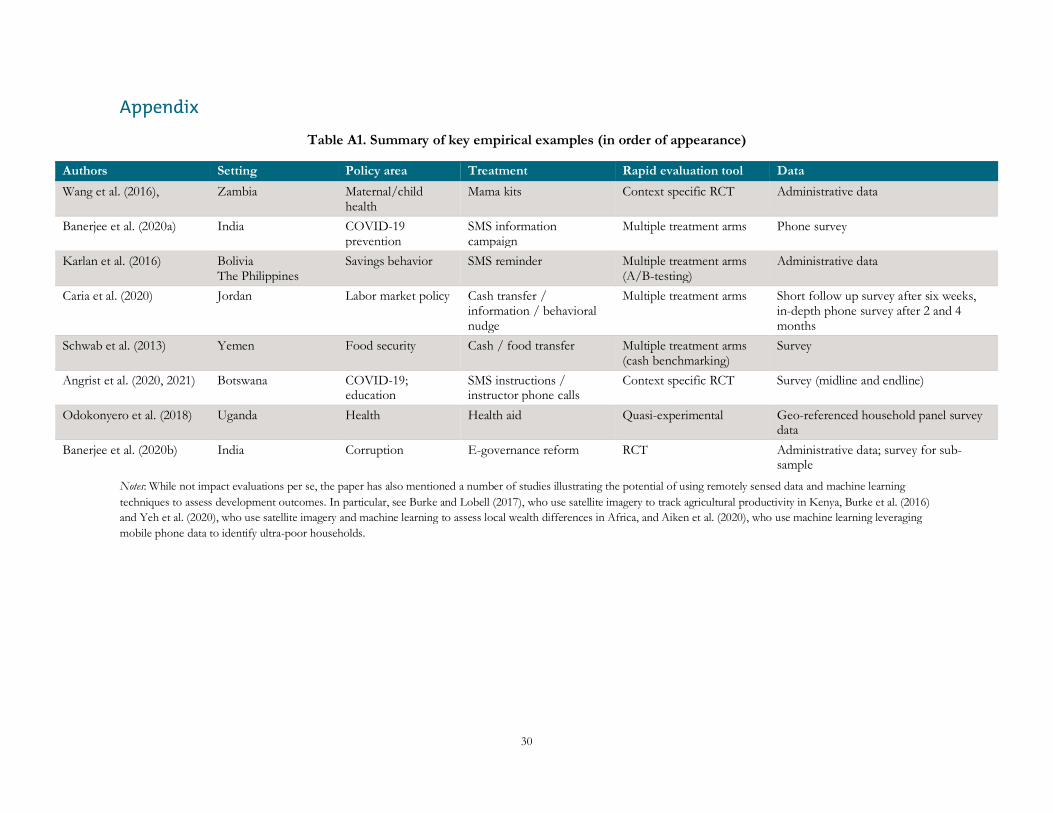
30
Appendix
Table A1. Summary of key empirical examples (in order of appearance)
Authors Setting Policy area Treatment Rapid evaluation tool Data Wang et al. (2016), Zambia Maternal/child
health Mama kits Context specific RCT Administrative data
Banerjee et al. (2020a) India COVID-19 prevention
SMS information campaign
Multiple treatment arms Phone survey
Karlan et al. (2016) Bolivia The Philippines
Savings behavior SMS reminder Multiple treatment arms (A/B-testing)
Administrative data
Caria et al. (2020) Jordan Labor market policy Cash transfer / information / behavioral nudge
Multiple treatment arms Short follow up survey after six weeks, in-depth phone survey after 2 and 4 months
Schwab et al. (2013) Yemen Food security Cash / food transfer Multiple treatment arms (cash benchmarking)
Survey
Angrist et al. (2020, 2021) Botswana COVID-19; education
SMS instructions / instructor phone calls
Context specific RCT Survey (midline and endline)
Odokonyero et al. (2018) Uganda Health Health aid Quasi-experimental Geo-referenced household panel survey data
Banerjee et al. (2020b) India Corruption E-governance reform RCT Administrative data; survey for sub-sample
Notes: While not impact evaluations per se, the paper has also mentioned a number of studies illustrating the potential of using remotely sensed data and machine learning techniques to assess development outcomes. In particular, see Burke and Lobell (2017), who use satellite imagery to track agricultural productivity in Kenya, Burke et al. (2016) and Yeh et al. (2020), who use satellite imagery and machine learning to assess local wealth differences in Africa, and Aiken et al. (2020), who use machine learning leveraging mobile phone data to identify ultra-poor households.